General decapping activators target different subsets of inefficiently translated mRNAs
- University of Massachusetts Medical School, United States
Figures
Figure 1 with 4 supplements
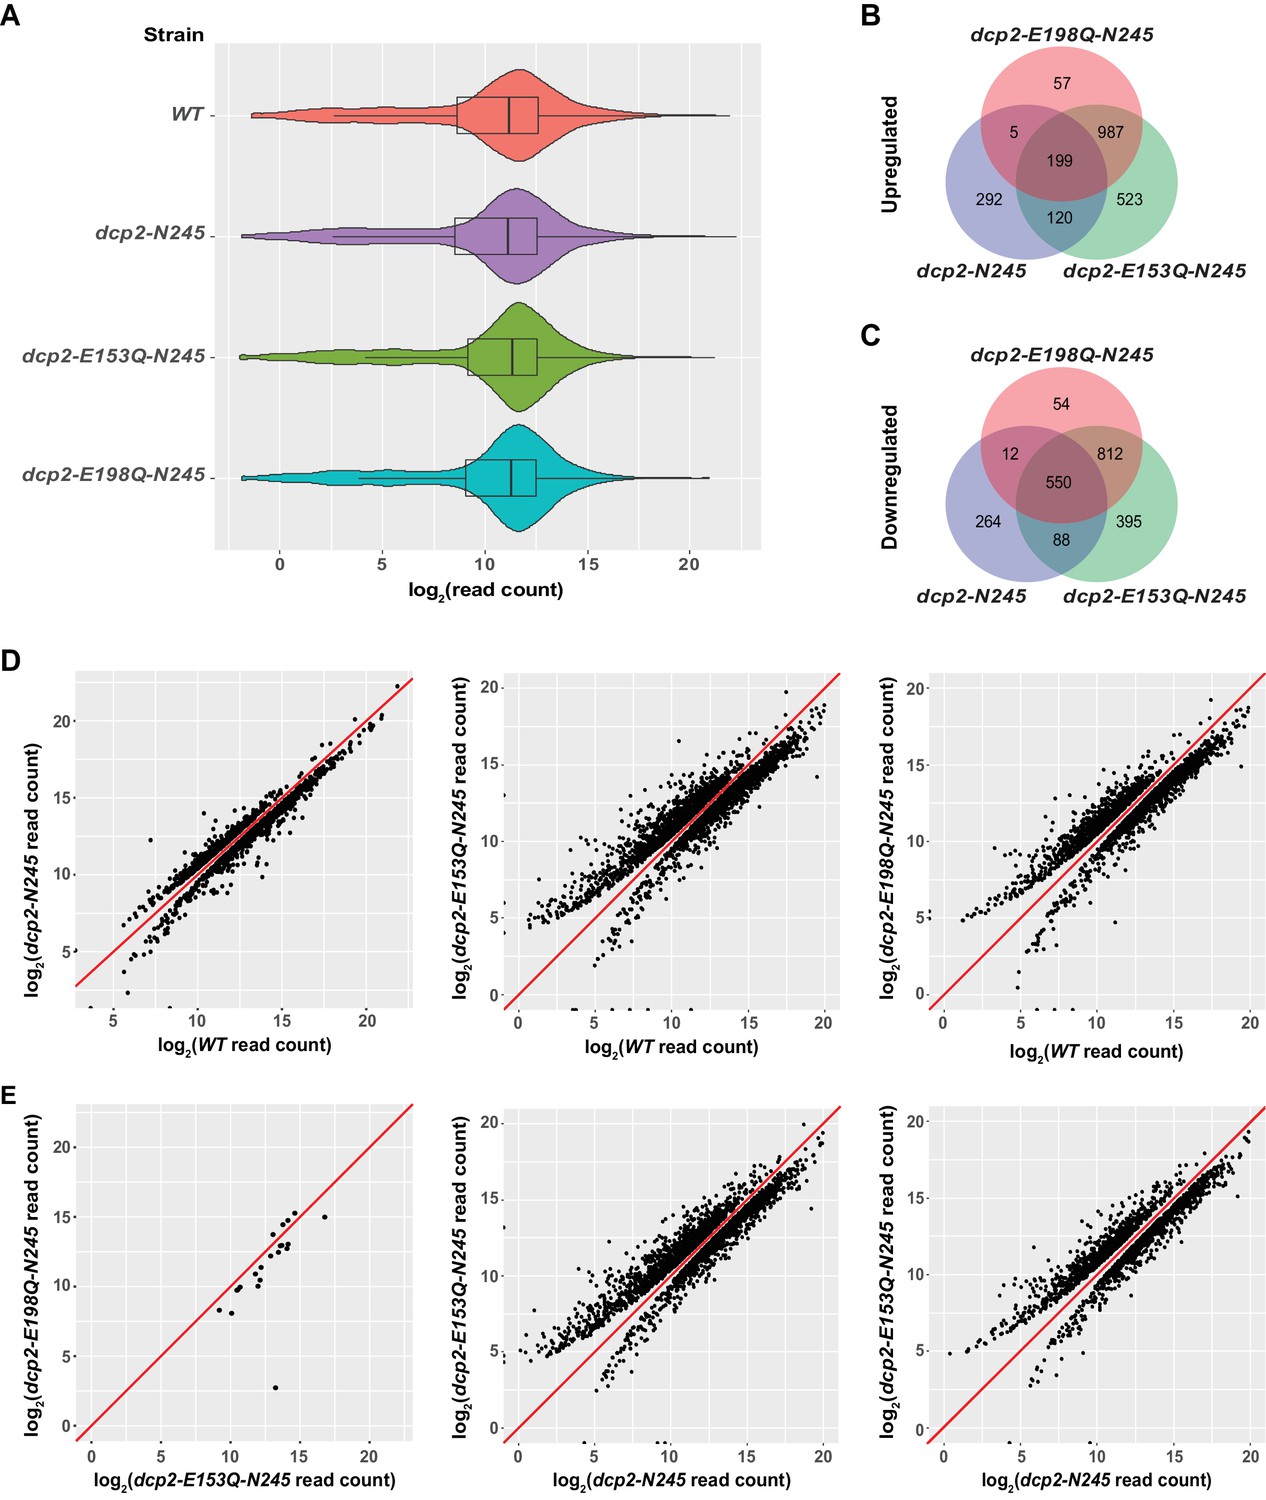
Identification of transcripts differentially expressed in dcp2-N245, dcp2-E153Q-N245, and dcp2-E198Q-N245 cells.
(A) Violin and box plots displaying the average and median read count distributions of the RNA-Seq libraries from WT, dcp2-N245, dcp2-E153Q-N245, and dcp2-E198Q-N245 strains in three independent experiments. (B) Venn diagram displaying the relationships between transcripts up-regulated in dcp2-N245, dcp2-E153Q-N245, and dcp2-E198Q-N245 cells. (C) Venn diagram displaying the relationships between transcripts down-regulated in dcp2-N245, dcp2-E153Q-N245, and dcp2-E198Q-N245 cells. (D) Scatterplots comparing the normalized read counts between the WT and the dcp2-N245, dcp2-E153Q-N245, or dcp2-E198Q-N245 strains for transcripts differentially expressed in each of the mutant strains. Left panel, comparison for the 616 up- and 1025 down-regulated transcripts in dcp2-N245 cells; middle panel, comparison for the 1921 up- and 1845 down-regulated transcripts in dcp2-E153Q-N245 cells; and right panel, comparison for the 1346 up- and 1428 down-regulated transcripts in dcp2-E198Q-N245. (E) Scatterplots comparing the normalized read counts for transcripts differentially expressed between the dcp2-E153Q-N245 and dcp2-E198Q-N245 strains, or in these two strains compared to the dcp-N245 strain. Left panel, comparison for 21 differentially expressed transcripts between dcp2-E153Q-N245 and dcp2-E198Q-N245 cells; middle panel, comparison for the 1658 up- and 1690 down-regulated transcripts in dcp2-E153Q-N245 cells; and right panel, comparison for the 1113 up- and 1090 down-regulated transcripts in dcp2-E198Q-N245 cells. The log2 read count values of individual transcripts were used in the analyses of parts D and E, and the y = x line is shown in red.
Figure 1—figure supplement 1
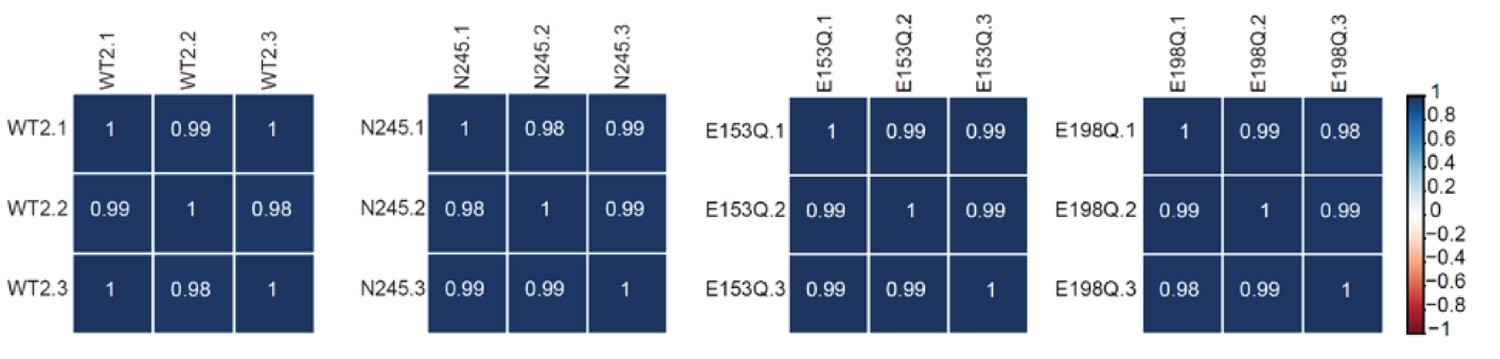
RNA-Seq libraries generated from WT, dcp2-N245, dcp2-E153Q-N245, and dcp2-E198Q-N245 strains exhibit good correlation between three different biological replicates.
Matrices showing the Pearson correlation coefficients among three independent experiments for RNA-Seq libraries generated from WT, dcp2-N245, dcp2-E153Q-N245, and dcp2-E198Q-N245 cells.
Figure 1—figure supplement 2
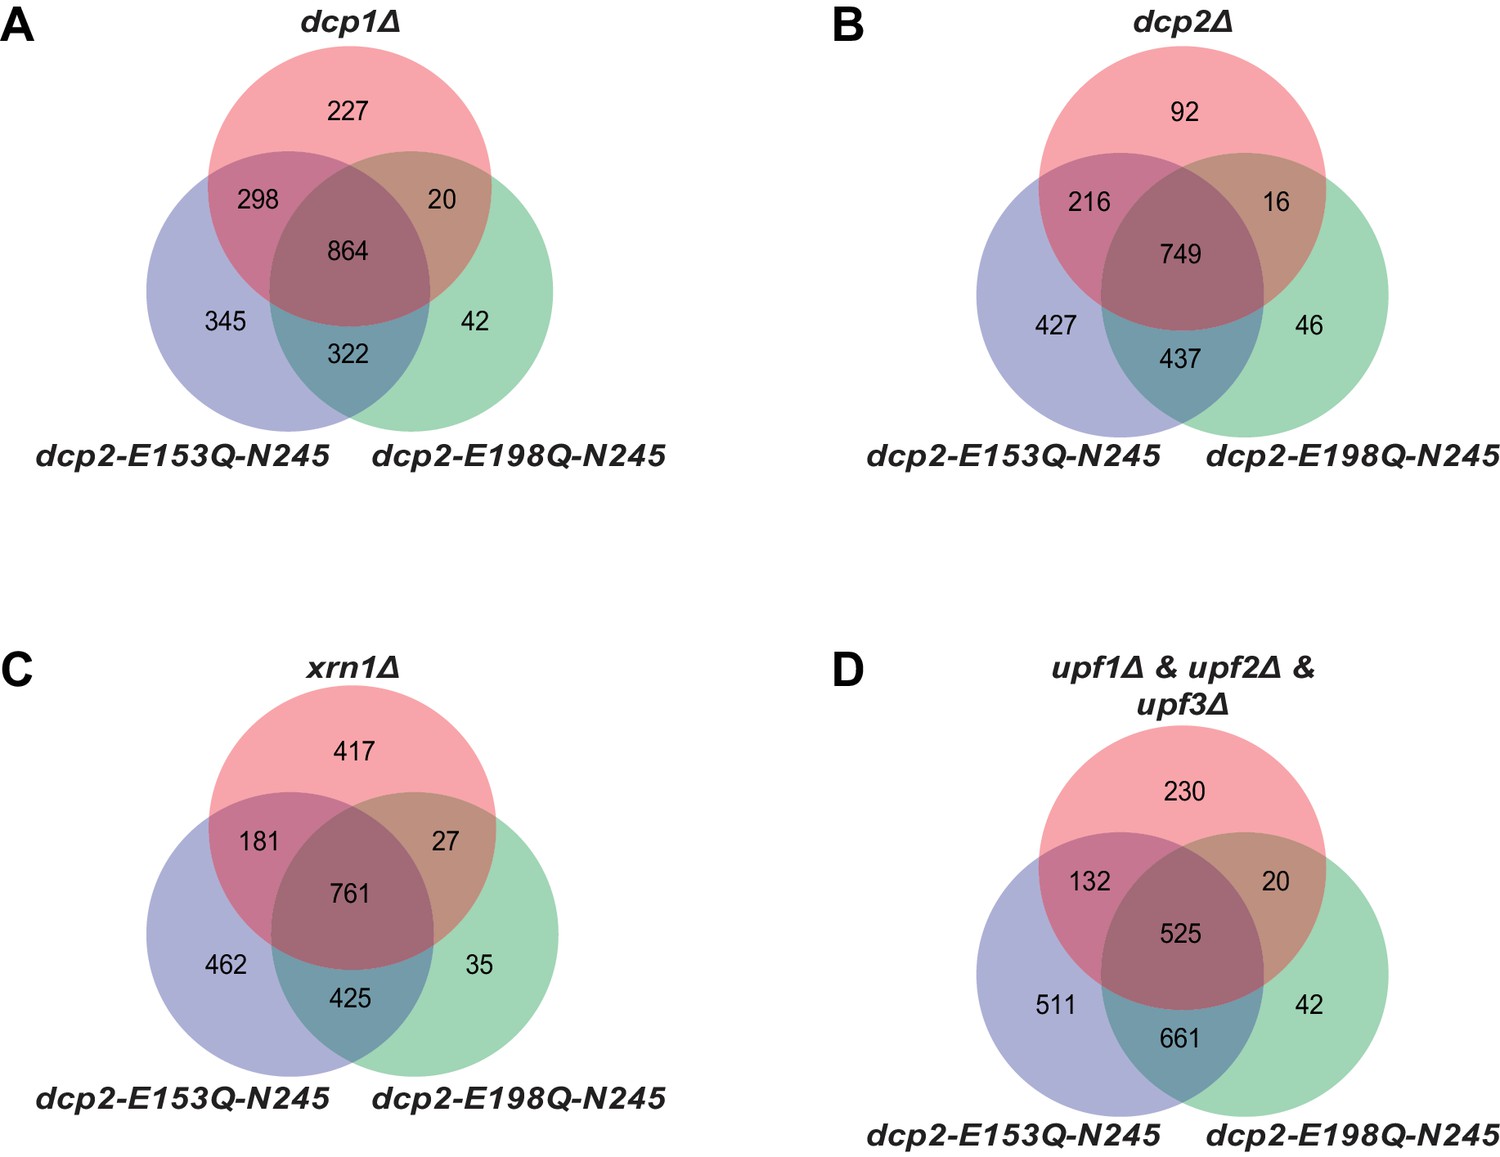
Yeast transcripts stabilized by inactivating the catalytic function of Dcp2 are mostly decapping substrates.
(A-D) Venn diagrams showing the extent of overlap between transcripts up-regulated in dcp2-E153Q-N245 and dcp2-E198Q-N245 cells and those up-regulated in dcp1∆ (A), dcp2∆ (B), xrn1∆ (C), or upf1/2/3∆ (D) cells.
Figure 1—figure supplement 3
Yeast transcripts destabilized by deletion of the large Dcp2 C-terminal domain are not normally typical decapping substrates.
(A-E) Venn diagrams depicting the extent of overlaps between the 264-transcript subset down-regulated only in dcp2-N245 cells (from Figure 1C) and those up-regulated in dcp1∆ (A), dcp2∆ (B), xrn1∆ (C), dcp2-E153Q-N245 (D) or dcp2-E198Q-N245 (E) cells. F to J. Venn diagrams depicting the extent of overlaps between the entire 914-transcript set down-regulated in dcp2-N245 cells (from Figure 1C) and those up-regulated in dcp1∆ (F), dcp2∆ (G), xrn1∆ (H), dcp2-E153Q-N245 (I) or dcp2-E198Q-N245 (J) cells.
Figure 1—figure supplement 4
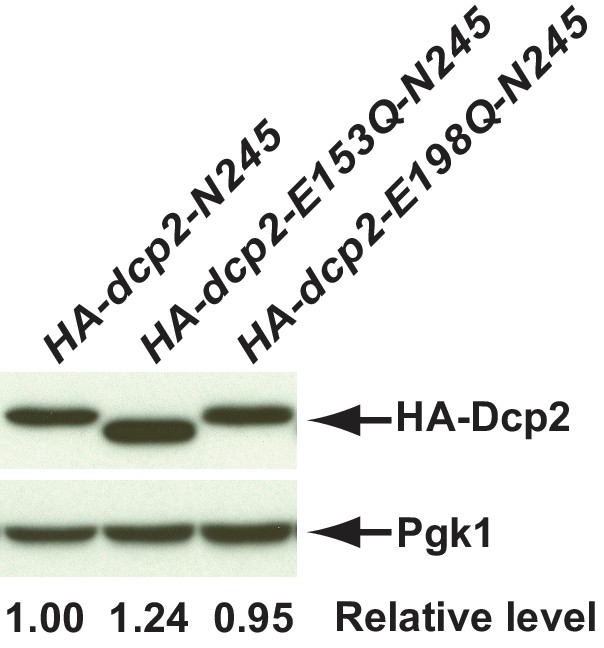
Western blotting analysis of protein levels in cells with different dcp2 alleles.
N-terminal triple-HA tagged dcp2-N245, dcp2-E153Q-N245, and dcp2-E198Q-N245 were constructed and cloned into the yeast single copy expression vector pRS315. The resulting plasmids were transformed into a dcp2∆ strain (CFY1016). Cell extracts were prepared from the respective mutant cells and the levels of dcp2 proteins in the extracts were determined by western blotting using monoclonal antibodies against the HA epitope or Pgk1. The latter served as a loading control. Relative levels of different Dcp2 mutant proteins compared to HA-dcp2-N245 are indicated. HA-dcp2-E153Q-N245 migrated slightly faster in the gel, the cause of which has not yet been determined.
Figure 2
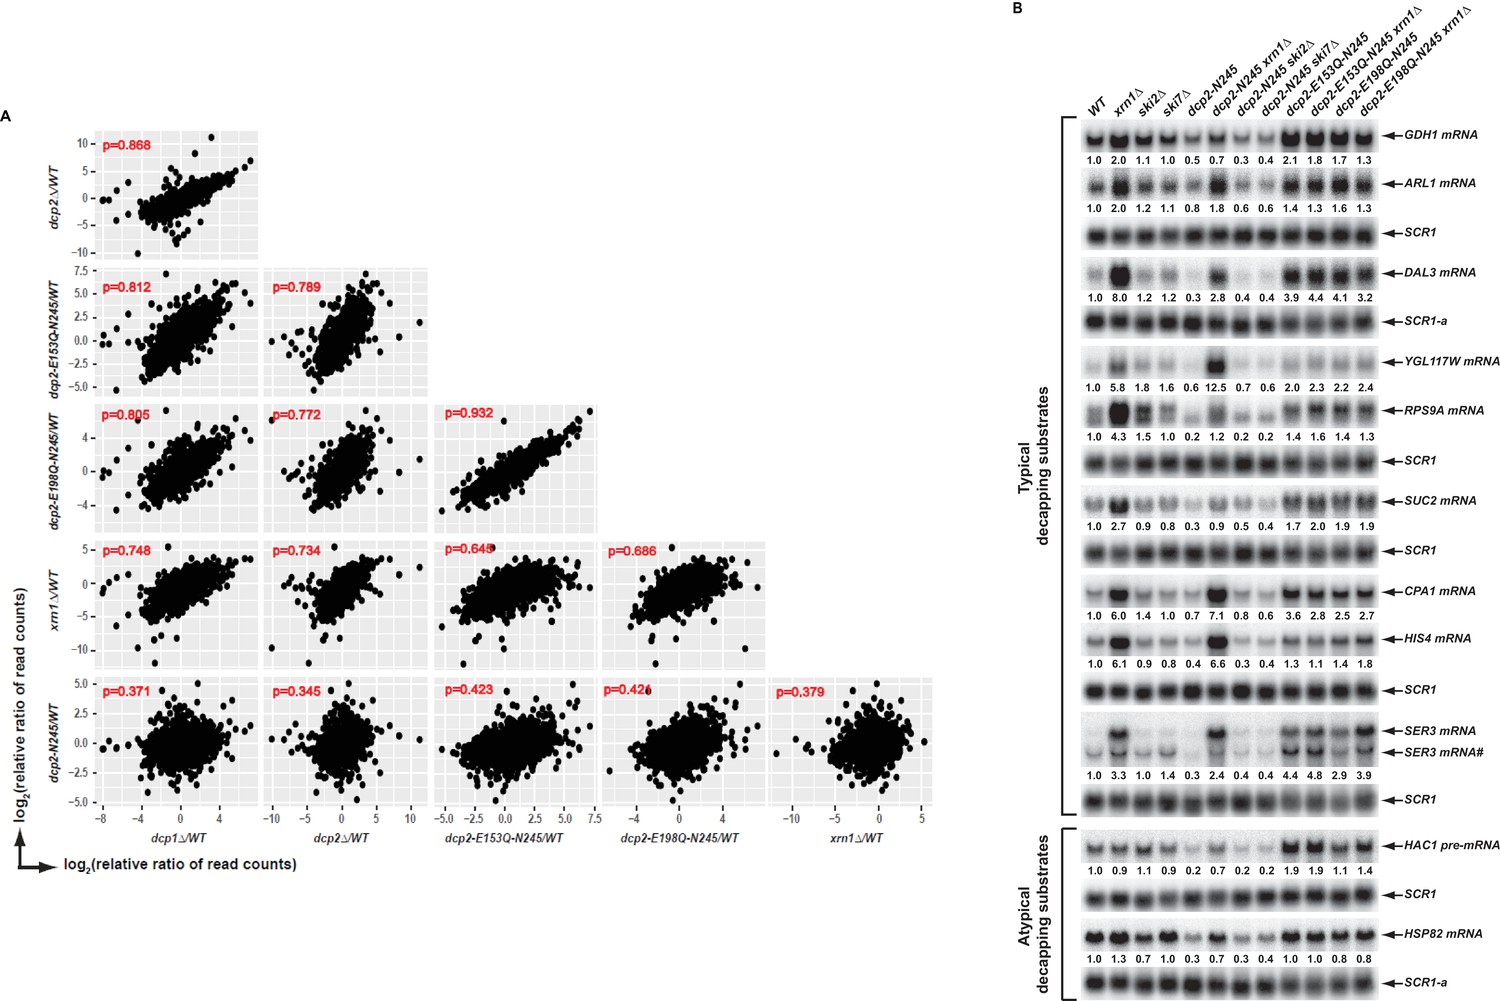
Elimination of the Dcp2 C-terminal domain deregulates mRNA decapping in vivo.
(A) Yeast cells harboring a deletion of the large Dcp2 C-terminal domain exhibit a significantly different genome-wide expression pattern from cells severely comprised in decapping activity or completely lacking decapping or 5’ to 3’ exoribonuclease activities. Scatterplot matrices were used to compare the relative levels of all transcripts in the yeast transcriptome in different mutant strains. The relative levels of individual mRNAs in each of the mutant strains were determined by comparisons to the appropriate wild-type strain. Data for the dcp1∆, dcp2∆, and xrn1∆ strains were from our previous study (Celik et al., 2017). Log2 transformed data were used for this analysis and Pearson correlation coefficients for each comparison are shown in red. (B) Yeast cells harboring a deletion of the large Dcp2 C-terminal domain exhibit accelerated and indiscriminate decapping of mRNAs. Eleven representative transcripts (nine typical decapping substrates and two atypical decapping substrates) from the group of transcripts down-regulated uniquely in dcp2-N245 cells were selected and their levels of expression in the indicated strains were analyzed by northern blotting. In each case, a specific random-primed probe was hybridized to the blot and the SCR1 transcript served as a loading control. The relative levels of specific transcripts in the mutant strains were determined by comparisons to their levels in the wild-type strain (indicated by the values under each blot). For presentation purposes, one of the control SCR1 blots is duplicated and is indicated by the lower case letter ‘a.’ The SER3 locus produces two different transcripts and only the levels of the short isoform (indicated by #) are presented.
Figure 3 with 2 supplements

Identification of transcripts controlled by Pat1, Lsm1, and Dhh1.
(A) Violin and box plots displaying the average and median read count distributions of the RNA-Seq libraries from the WT, pat1Δ, lsm1Δ, and dhh1Δ strains in three independent experiments. (B) Venn diagram displaying the relationships between transcripts up-regulated in pat1Δ, lsm1Δ, and dhh1Δ cells. (C) Venn diagram displaying the relationships between transcripts down-regulated in pat1Δ, lsm1Δ, and dhh1Δ cells. (D) Scatterplots comparing the normalized read counts between the WT and the pat1Δ, lsm1Δ, or dhh1Δ strains for transcripts differentially expressed in each of the mutant strains. Left panel, comparison for the 955 up- and 681 down-regulated transcripts in pat1Δ cells; middle panel, comparison for the 940 up- and 685 down-regulated transcripts in lsm1Δ cells; and right panel, comparison for the 1098 up- and 788 down-regulated transcripts in dhh1Δ cells. (E) Scatterplots comparing the normalized read counts between the pat1Δ and lsm1Δ strains for all transcripts, or between the dhh1Δ strain and the lsm1Δ and pat1Δ strains for transcripts differentially expressed in these two strains compared to the dhh1Δ strain. Left panel, comparison for all transcripts between the pat1Δ and lsm1Δ strains, four differentially expressed transcripts are indicated by red dots; middle panel, comparison for the 1385 up- and 1037 down-regulated transcripts in the lsm1Δ strain with respect to the transcripts of the dhh1Δ strain; and right panel, comparison for the 1332 up- and 874 down-regulated transcripts in the pat1Δ strain with respect to the transcripts of the dhh1Δ strain. For A to E, all analyses were as described in the legend to Figure 1.
Figure 3—figure supplement 1
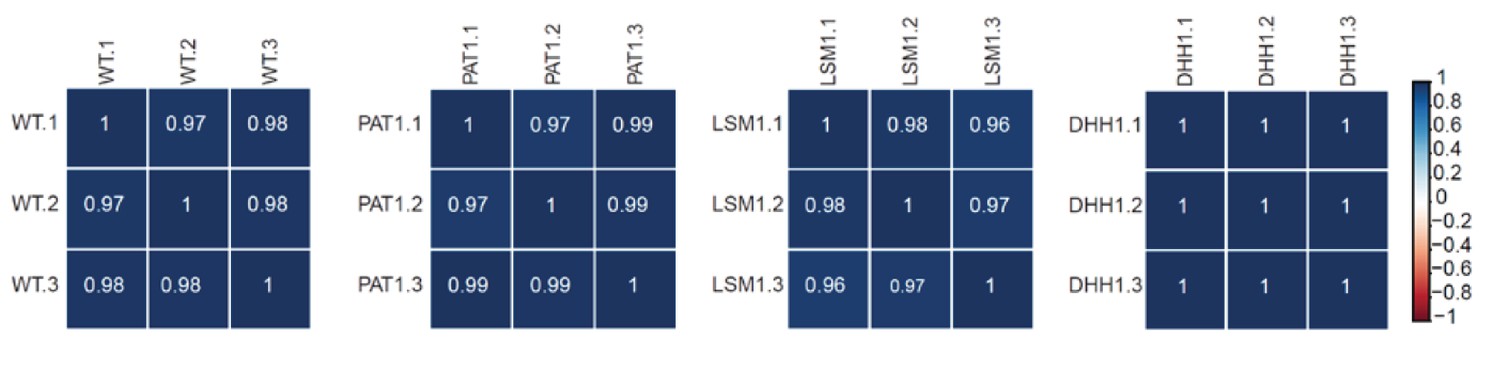
RNA-Seq libraries generated from WT, pat1∆, lsm1∆, and dhh1∆ strains exhibit good correlation between three different biological replicates.
Matrices showing the Pearson correlation coefficients among three independent experiments for RNA-Seq libraries generated from WT, pat1∆, lsm1∆, and dhh1∆ cells. Libraries from strains shown here and in Figure 1—figure supplement 1 were generated at different times and two independent wild-type controls were employed.
Figure 3—figure supplement 2
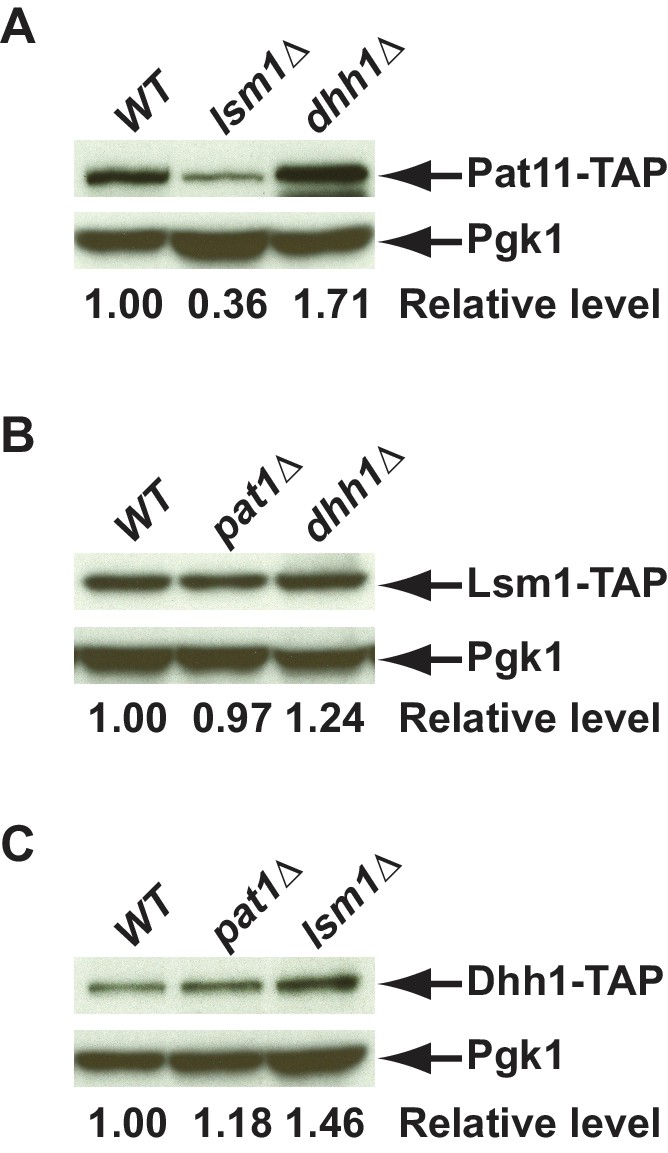
Western blotting analysis of Pat1, Lsm1, and Dhh1 levels in different mutant strains.
Deletions of PAT1, LSM1, or DHH1 were constructed in yeast strains harboring TAP-tagged PAT1, LSM1, or DHH1 alleles at the respective genomic loci. Cell extracts were prepared from yeast strains of the indicated genotypes and the levels of TAP-tagged Pat1(A), Lsm1(B), and Dhh1(C) were determined by western blotting. Blots were probed with rabbit polyclonal antibodies targeting the TAP tag or a mouse monoclonal antibody against Pgk1, with the latter serving as a loading control. Relative levels of TAP-tagged Pat1, Lsm1, or Dhh1 in the different deletion cells compared to their isogenic wild-type cells are indicated.
Figure 4 with 1 supplement
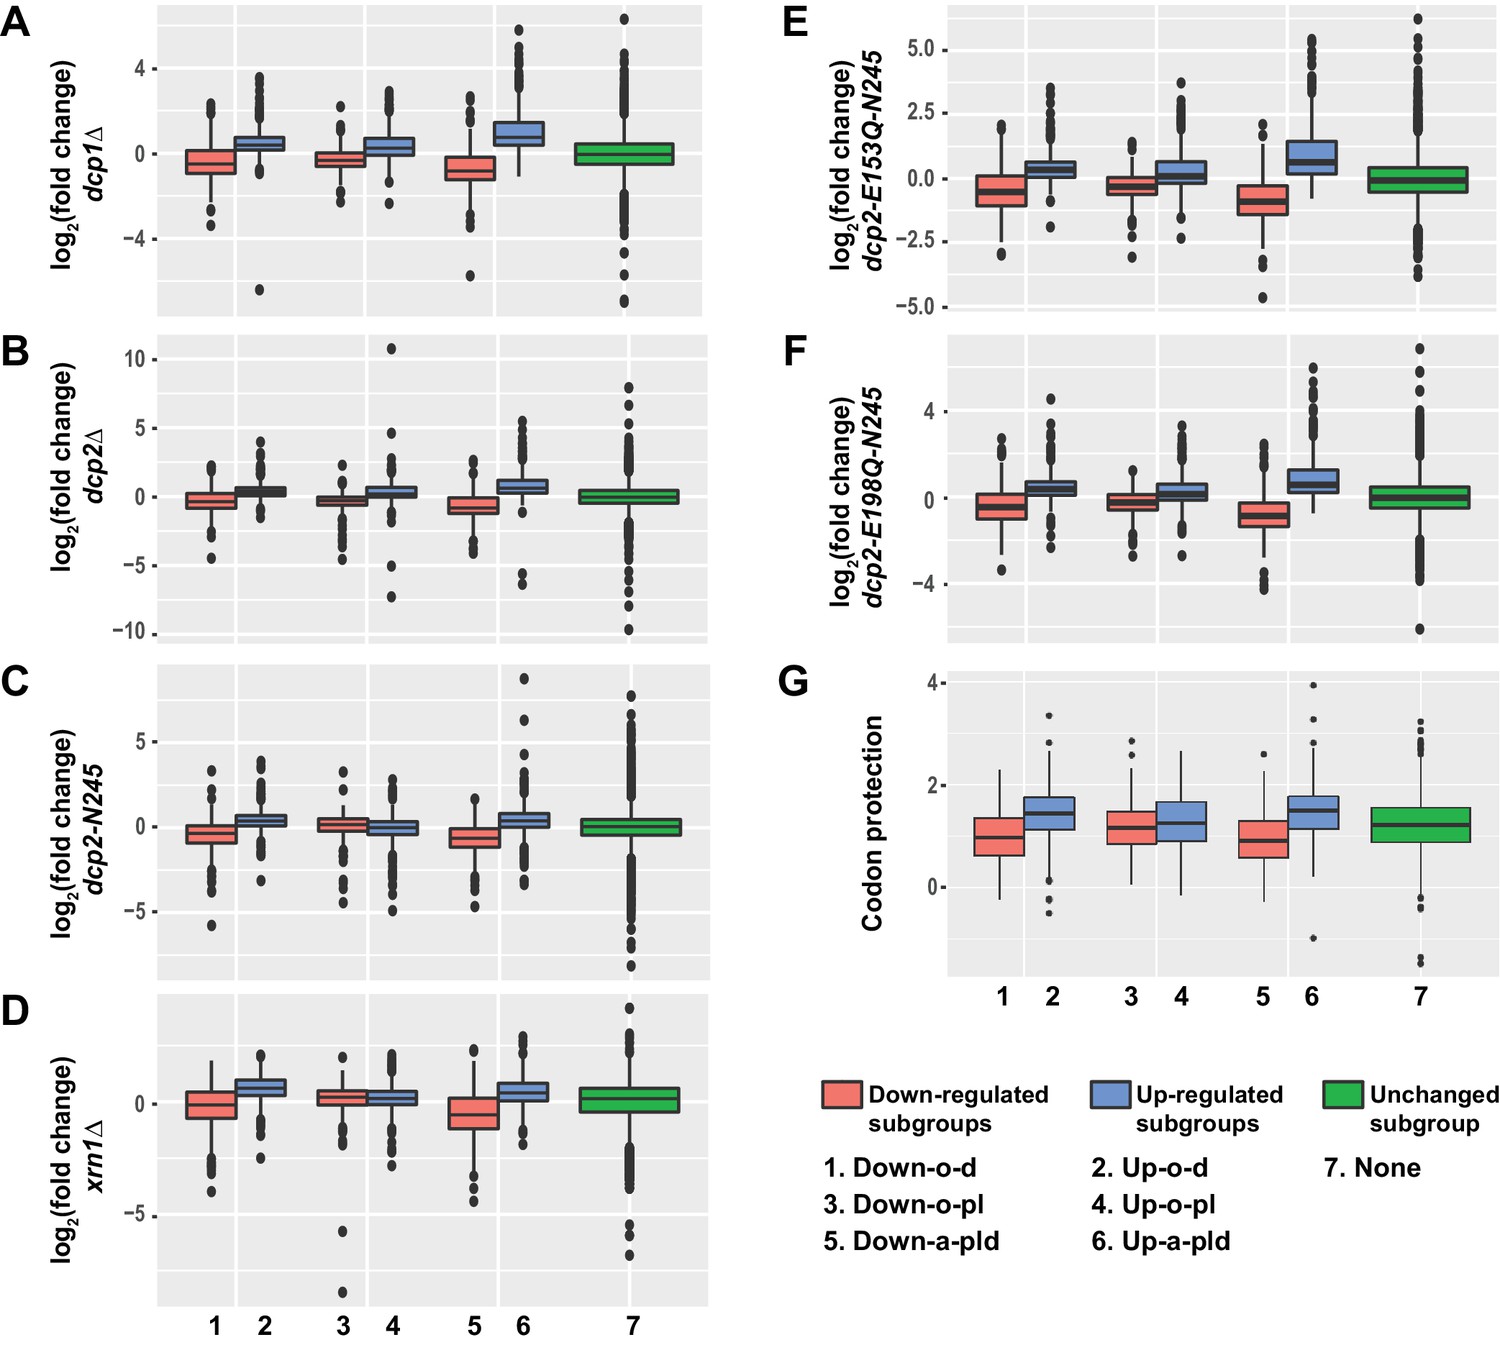
Transcripts from different subgroups of mRNAs regulated by Pat1, Lsm1, or Dhh1 have distinct expression patterns in cells deficient in decapping or 5’ to 3’ exoribonuclease activities and also exhibit distinct extents of co-translational mRNA decay.
Transcripts up-regulated in pat1Δ, lsm1Δ, or dhh1Δ strains were divided into three non-overlapping Up-o-d, Up-o-pl, and Up-a-pld subgroups, representing transcripts up-regulated only in dhh1Δ cells, only in pat1Δ and lsm1Δ cells, and in all three deletion strains, respectively. Similarly, transcripts down-regulated in the three deletion strains were also divided into three non-overlapping Down-o-d, Down-o-pl, and Down-a-pld subgroups, representing transcripts down-regulated only in dhh1Δ cells, only in pat1Δ and lsm1Δ cells, and in all three deletion strains, respectively. Transcripts not regulated by Pat1, Lsm1, or Dhh1 were put into the none subgroup. Boxplots were used to depict the distributions of both the relative expression levels and the codon protection indices for transcripts in each of these subgroups. In these analyses, the relative expression levels of individual mRNAs in each of the mutant strains were determined by comparisons to the corresponding wild-type strain. The codon protection index of individual mRNAs was based on 5’P seq experiments of wild-type cells under normal growth conditions (Pelechano et al., 2015). Log2 transformed data were used to generate all plots except for panel G, and the color codes for the boxplots include: blue for the up-regulated subgroups, red for the down-regulated subgroups, and green for transcripts not regulated by Pat1, Lsm1, or Dhh1. A to F. Boxplots showing the distributions of the relative expression levels for different subgroups in dcp1Δ (A), dcp2Δ (B), xrn1Δ (C), dcp2-N245 (D), dcp2-E153Q-N245 (E), and dcp2-E198Q-N245 (F) cells. (G) Boxplots showing the distributions of the codon protection indices for different subgroups.
Figure 4—figure supplement 1
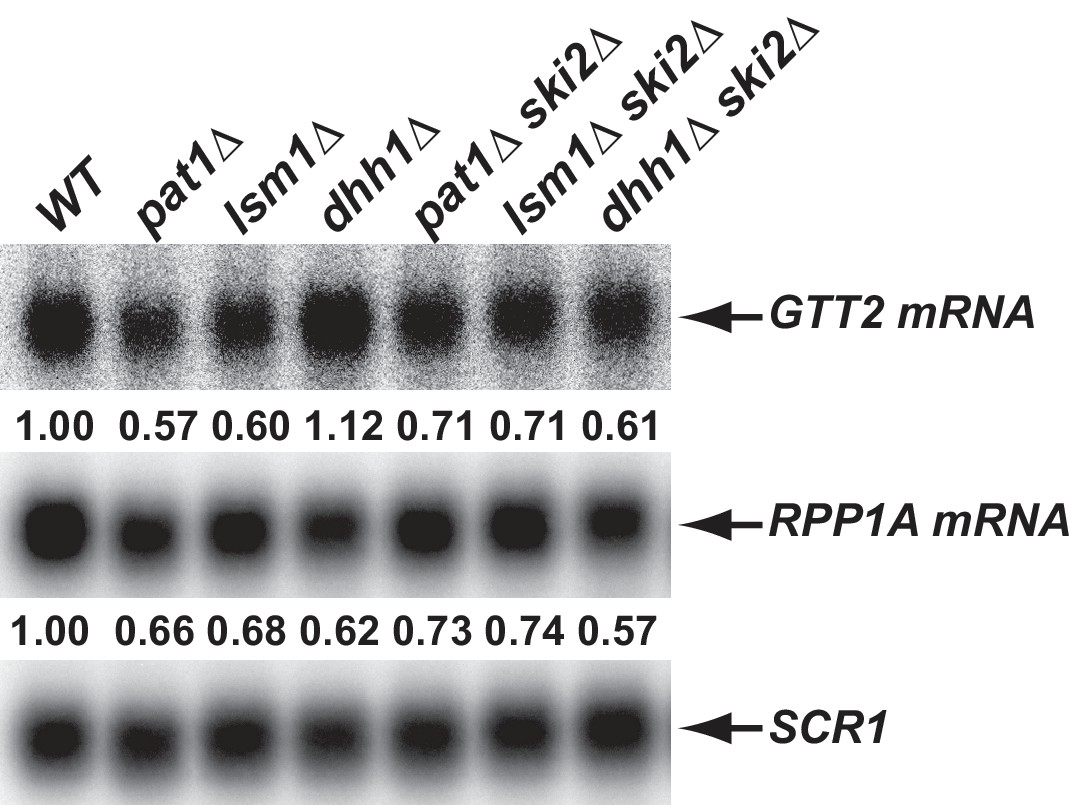
Inhibition of the 3’ to 5’ mRNA decay pathway partially restores the levels of transcripts down-regulated in pat1∆ and lsm1∆ cells, but not in dhh1∆ cells.
Yeast strains harboring double deletions of PAT1, LSM1, or DHH1 and SKI2 were constructed. Total RNA was isolated from these cells as well their isogenic wild-type and single deletion cells. The levels of the GTT2 (from the Down-o-pl subgroup) and RPP1A (from the Down-a-pld subgroup) mRNAs were determined in these strains by northern blotting as described in the legend to Figure 2B. The relative levels of each mRNA in mutant cells (compared to that in wild-type cells) are indicated.
Figure 5
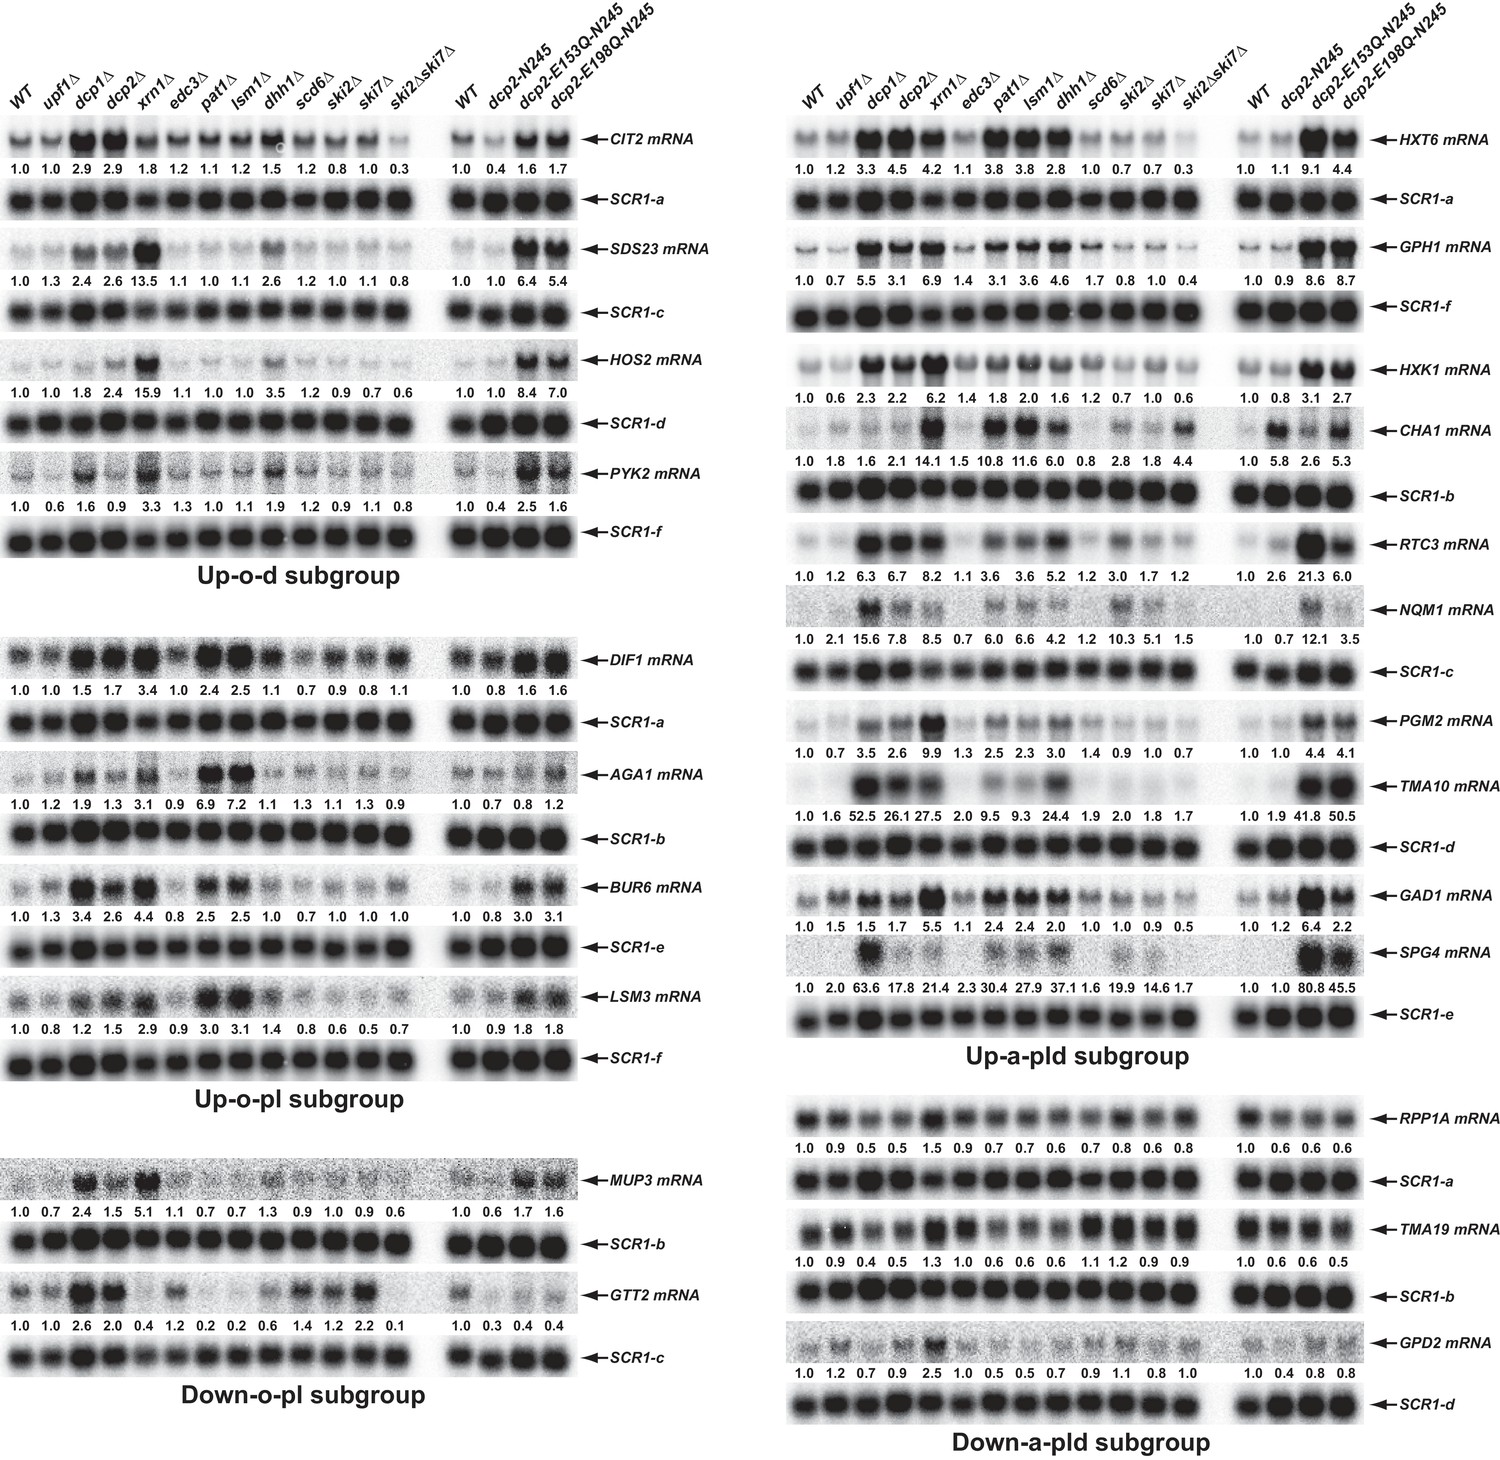
Validation of representative transcripts regulated by Pat1, Lsm1, or Dhh1.
Representative transcripts from five of the subgroups (Up-o-d, Up-o-pl, Up-a-pld, Down-o-pl, and Down-a-pld) described in Figure 4 were selected and their steady-state levels in the indicated strains were analyzed. Since individual blots were reprobed multiple times for different transcripts some SCR1 blots served as controls for different transcripts. The shared SCR1 blots are indicated by lower case letters a, b, c, d, e, and f, respectively.
Figure 6
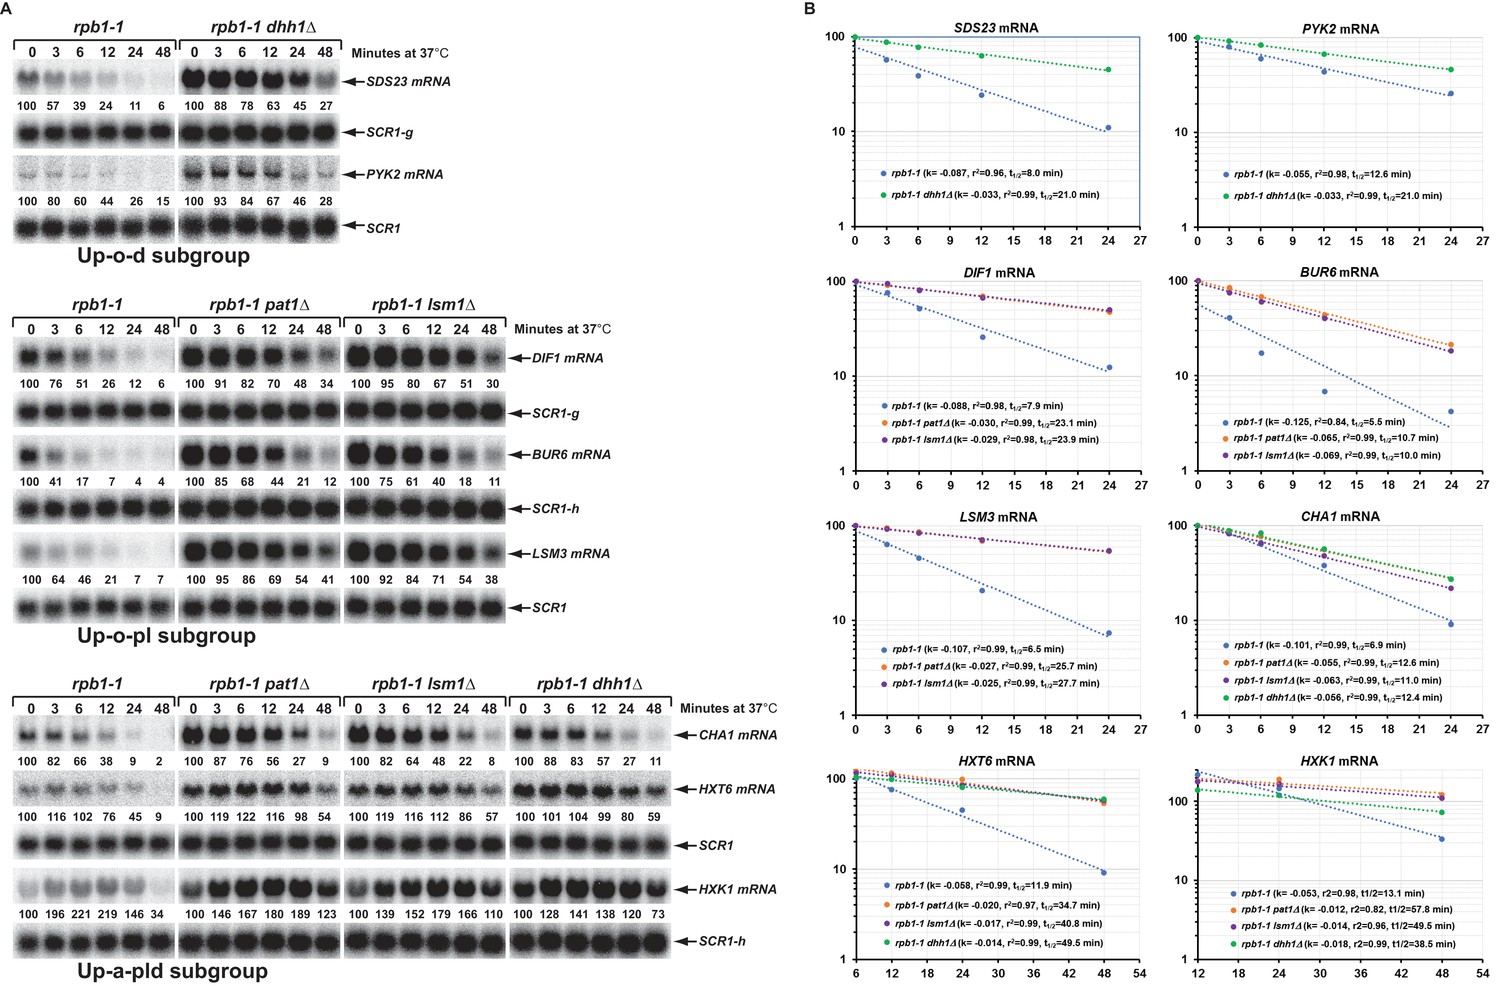
Decay rates of representative transcripts regulated by Pat1, Lsm1, or Dhh1.
Representative transcripts from the upregulated subgroups described in Figure 4 (Up-o-d, Up-o-pl, and Up-a-pld) were selected and their decay rates were determined by northern blot quantitation of the fraction of mRNA remaining after a temperature-shift in rpb1-1, rpb1-1/pat1∆, rpb1-1/lsm1∆, and rpb1-1/dhh1∆ cells. The quantitative data (% of mRNA remaining) at different time points after the temperature shift relative to time point zero for each transcript shown in panel A is plotted in panel B. For each graph in panel B, the Y-axis represents the percentage of mRNA remaining and the X-axis represents time in minutes. In each case, the data were fitted to a single exponential equation and the slope (k) and the squared regression co-efficiency (r2) of the regression line were determined. Half-lives of each transcript in different strains were calculated using the formula T1/2=ln2/k. Data from the first five time points were used for graphing SDS23, PYK2, DIF1, BUR6, and CHA1 mRNA decay rates. However, data from the last four and last three time points were used for graphing HXT6 and HXK1 mRNA decay rates, respectively, as the latter two mRNAs exhibited delayed transcriptional inhibition during the temperature shift. As noted in the legend to Figure 5, individual blots were reprobed for different transcripts. The shared SCR1 blots are indicated by lower case letters g and h.
Figure 7
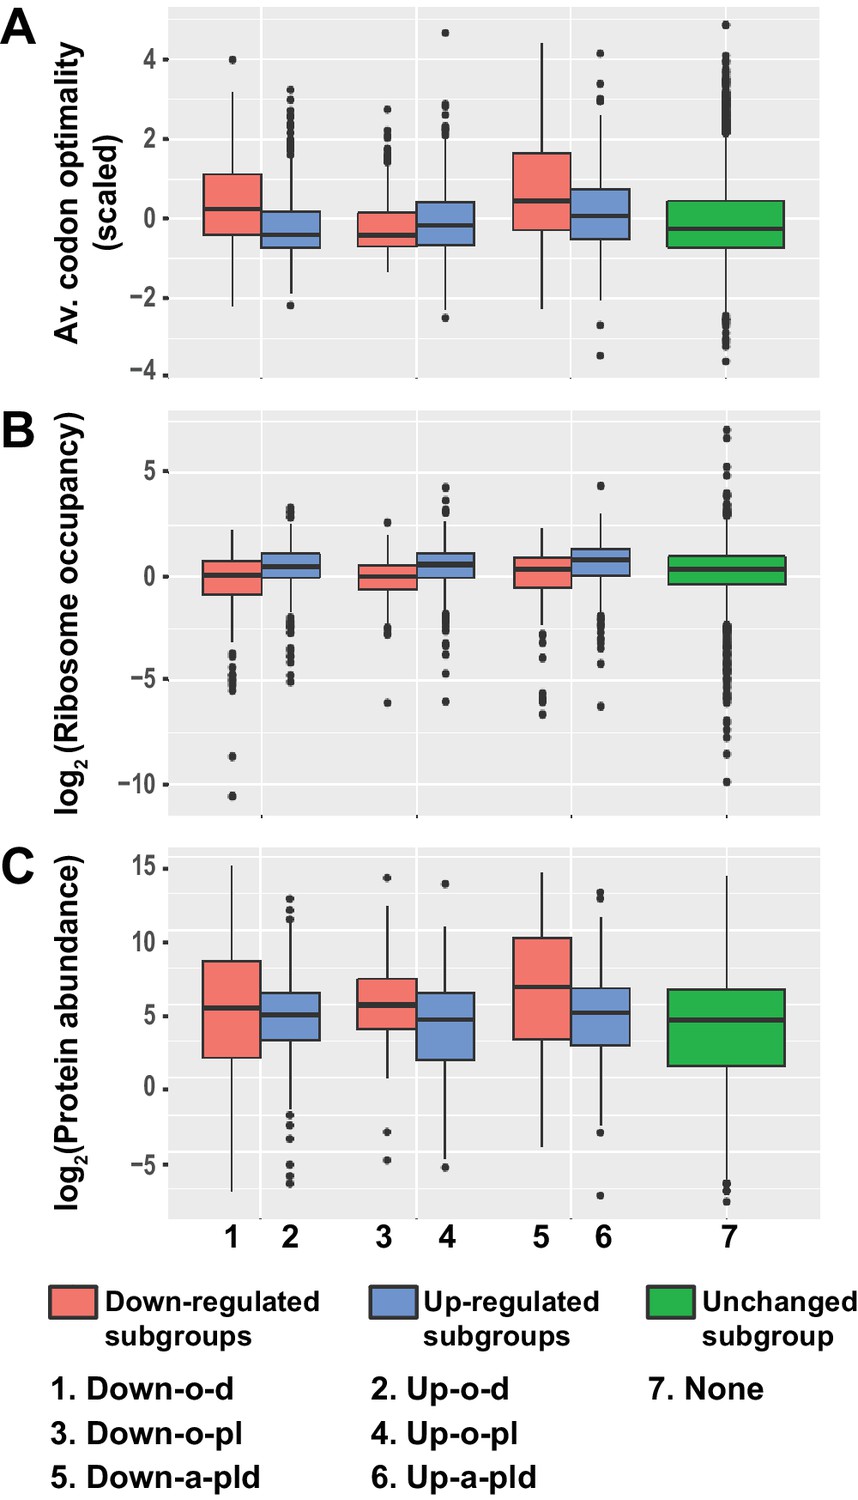
Transcripts from different subgroups of mRNAs regulated by Pat1, Lsm1, and Dhh1 have distinct translational properties.
Boxplots were used to examine the distributions of average codon optimality scores, ribosome occupancies, and scaled protein abundances for transcripts from each of the six regulation subgroups described in Figure 4. In this analysis, codon optimality scores are based on the normalized tRNA adaptation index (Pechmann and Frydman, 2013), ribosome occupancies are based on ribosome footprint profiling data of wild-type cells under normal growth conditions (Young et al., 2015), and protein abundance scores are based on curated data in a database (Wang et al., 2015; Wang et al., 2012). A to C. Boxplots showing the distributions of scaled average codon optimality scores (A) and Log2 transformed data of ribosome occupancies (B) or scaled protein abundances (C). Boxplots are color coded as described in the legend to Figure 4.
Figure 8

Decapping activators have distinct targeting specificities and display dynamic regulation.
(A) Venn diagram depicting minimal significant overlaps between transcripts targeted by the Upf factors and those targeted by Dhh1 or Pat1 and Lsm1. (B) Two-dimensional clustering analysis of differentially expressed transcripts showing distinct expression patterns of yeast cells harboring deletions of the UPF1, UPF2, UPF3, PAT1, LSM1, or DHH1 genes. The relative levels of individual mRNAs in the deletion strains were determined by comparisons to the corresponding wild-type strain. Log2 transformed ratios were used for clustering analyses. The data for the NMD factors were from our previous study (Celik et al., 2017). Color coding used to represent fold change in expression employs red to indicate increases in levels and blue to indicate decreases in levels, with intermediate changes scaled to lighter versions of each color. (C) Venn diagrams depicting the enrichment of NMD-targeted transcripts in the Down-o-d subgroup, but not in the Down-a-pld and Down-o-pl subgroups of mRNAs indirectly controlled by Pat1, Lsm1, and Dhh1. (D) Northen blotting analysis of representative transcripts from the Down-o-d subgroup of mRNAs that are targeted by NMD. Five transcripts were selected, and northern blotting and transcript quantification were as described in the legend to Figure 2B.
Tables
Key resources table
| Reagent type (species) or resource | Designation | Source or reference | Identifiers | Additional information |
|---|---|---|---|---|
| Chemical compound, drug | [α-32P]-dCTP | Perkin Elmer | Blu513Z | |
| Chemical compound, drug | Herring Sperm DNA | Promega | D1815 | |
| Peptide, recombinant protein | Taq DNA polymerase | Roche | 04-728-874-001 | |
| Peptide, recombinant protein | Baseline-ZERO DNase | Epicentre | DB0711K | |
| Peptide, recombinant protein | SuperScript II Reverse Transcriptase | Invitrogen | 18064–022 | |
| Strain, strain background (W303 or BY4741) | Yeast strains used in this study | This paper | Supplementary File 1 | Contains all yeast strains obtained or constructed in this study |
| Recombinant DNA reagent | Plasmids used in this study | This paper | Supplementary File 2 | Contain all plasmids constructed in this study |
| Sequence-based reagent | Oligonucleotides used in this study | This paper | Supplementary File 3 | Contains all oligonucleotides used in this study |
| Antibody | Mouse anti-HA monoclonal antibody | Sigma | H3663 | one to 4000 |
| Antibody | Rabbit anti-TAP Tag polyclonal antibody | Thermo Fisher | CAB1001 | one to 1000 |
| Antibody | Mouse anti-Pgk1 monoclonal antibody | Invitrogen | 459250 | one to 8000 |
| Commercial assay or kit | Ribo-Zero Gold rRNA Removal Kit (Yeast) | Illumina | MRZY1306 | |
| Commercial assay or kit | TruSeq Stranded mRNA LT Sample Prep Kit | Illumina | RS-122–2101 | |
| Commercial assay or kit | Agencourt RNA Clean XP Kit | Beckman-Coulter Genomics | A63987 | |
| Commercial assay or kit | Random Primed DNA labeling Kit | Roche | 11-004-760-001 | |
| Software, algorithm | RSEM | Li and Dewey, 2011 | http://deweylab.biostat.wisc.edu/rsem | |
| Software, algorithm | DESeq | Anders and Huber, 2010 | https://bioconductor.org/packages/release/bioc/html/DESeq2.html | |
| Other (Deposited Data) | R64-2-1 S288C sacCer3 genome assembly | Saccharomyces Genome Database (SGD) | https://downloads.yeastgenome.org/sequence/S288C_reference/genome_releases/ | |
| Other (Deposited Data) | Raw and analyzed data | This paper | GEO: GSE107841 | Contains raw and analyzed RNA-seq data |
| Other (Deposited Data) | Ribosomal profiling data | Young et al., 2015 | GEO: GSE69414 | |
| Other (Deposited Data) | Codon protection index data | Pelechano et al., 2015 | GEO: GSE63120 | |
| Other (Deposited Data) | Normalized yeast codon optimality scores | Pechmann and Frydman, 2013 | http://www.stanford.edu/group/frydman/codons | |
| Other (Deposited Data) | Scaled estimates of yeast proteomic data | Wang et al., 2012 | http://pax-db.org/ |
Additional files
-
Supplementary File 1
Yeast strains used in this study.
- https://doi.org/10.7554/eLife.34409.017
-
Supplementary File 2
Plasmids used in this study.
- https://doi.org/10.7554/eLife.34409.018
-
Supplementary File 3
Oligonucleotides used in this study.
- https://doi.org/10.7554/eLife.34409.019
-
Transparent reporting form
- https://doi.org/10.7554/eLife.34409.020
Download links
A two-part list of links to download the article, or parts of the article, in various formats.
Downloads (link to download the article as PDF)
Open citations (links to open the citations from this article in various online reference manager services)
Cite this article (links to download the citations from this article in formats compatible with various reference manager tools)
General decapping activators target different subsets of inefficiently translated mRNAs
eLife 7:e34409.
https://doi.org/10.7554/eLife.34409


