Robust manipulation of the behavior of Drosophila melanogaster by a fungal pathogen in the laboratory
- University of California, Berkeley, United States
Figures
Figure 1 with 3 supplements
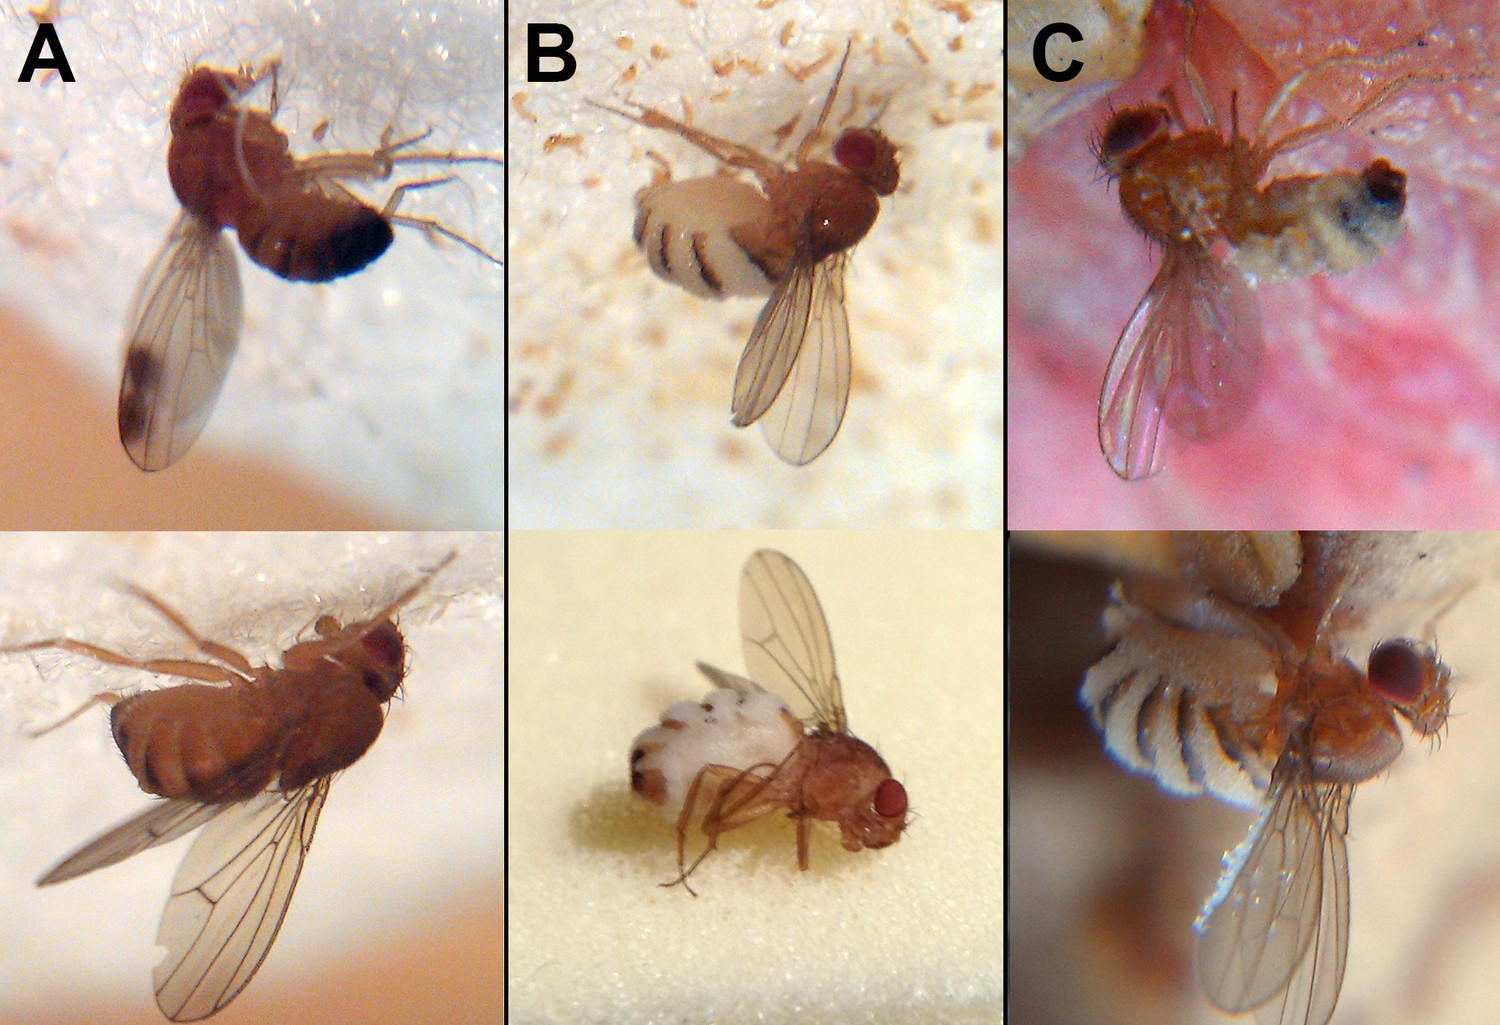
Wild drosophilids killed by Entomophthora muscae ‘Berkeley’.
(A) Cadavers found among sampled flies 65 min (above) and 40 min (below) after sunset. E. muscae 'Berkeley' has not grown through the host cuticle. (B) Cadavers found among sampled flies 120 min (above) and 160 min (below) after sunset. E. muscae 'Berkeley' has grown through the host cuticle and will soon start to eject conidia. (C) Cadavers as discovered in situ in fendel at least 12 hr after sunset. E. muscae 'Berkeley' has grown through the host cuticle and ejected conidia, some of which have landed on the cadavers’ wings. With the exception of the lower image in panel B, all flies were photographed adhered to the substrate in situ.
Figure 1—figure supplement 1
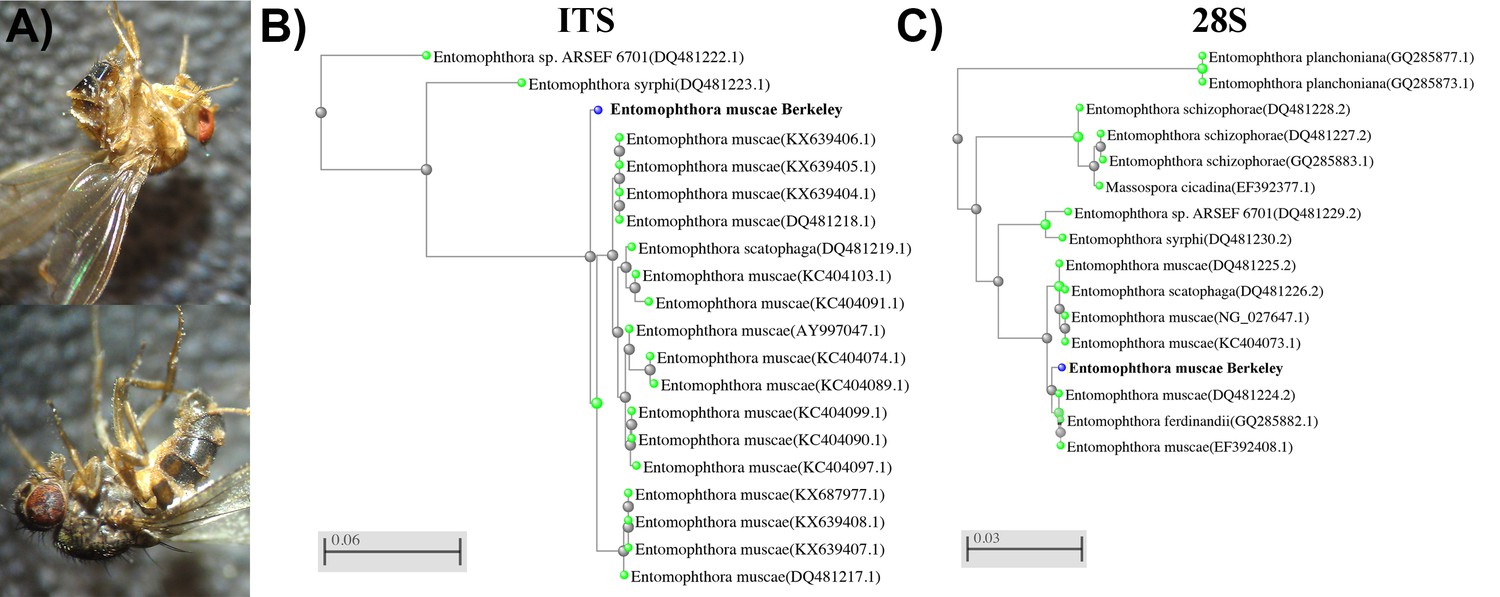
Discovery of E. muscae 'Berkeley'.
(A) E. muscae 'Berkeley'-killed cadavers discovered in bait on July 25, 2015. Note remnants of fungal growth through the intersegmental membrane of dorsal abdomen (above and below) and spores deposited on wings (above and below) and legs (below). (B, C) BLAST (blastn) results as trees (fast minimum evolution) for (B) consensus E. muscae 'Berkeley' ITS (13 sequences) and (C) E. muscae 'Berkeley' 28S (11 sequences). Gray legend bars show difference in percent identity between sequences.
Figure 1—figure supplement 2
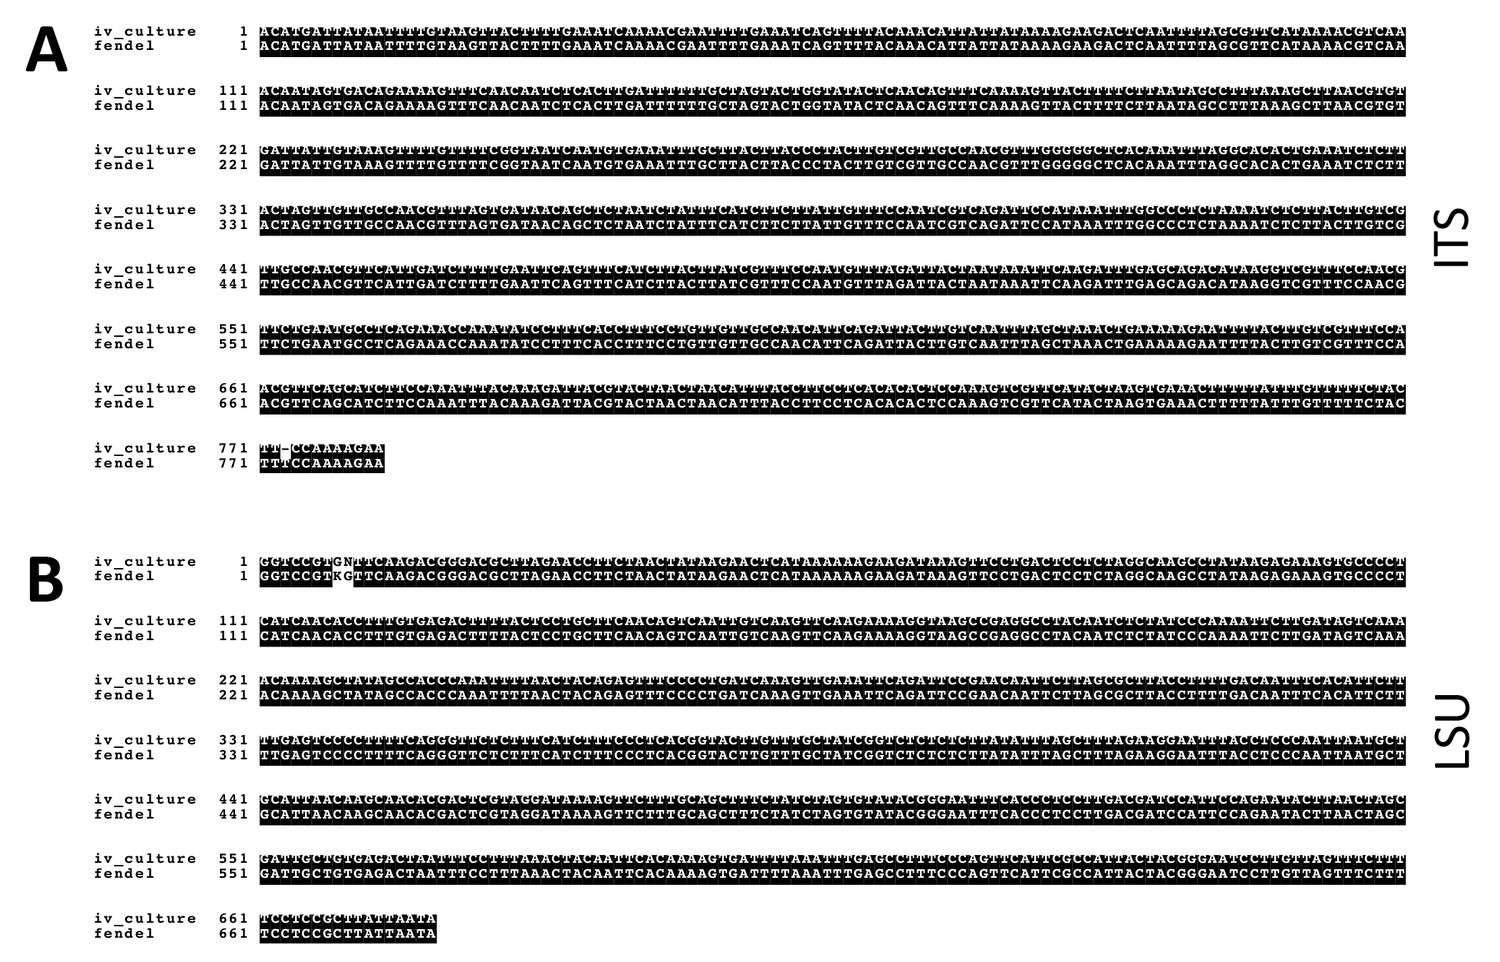
Confirmation that E. muscae 'Berkeley' is growing in vitro.
(A) Alignment of ITS region from in vitro culture (iv_culture) and consensus ITS sequence from fendel cadavers (fendel). (B) Same as A, but for LSU region.
Figure 1—figure supplement 3
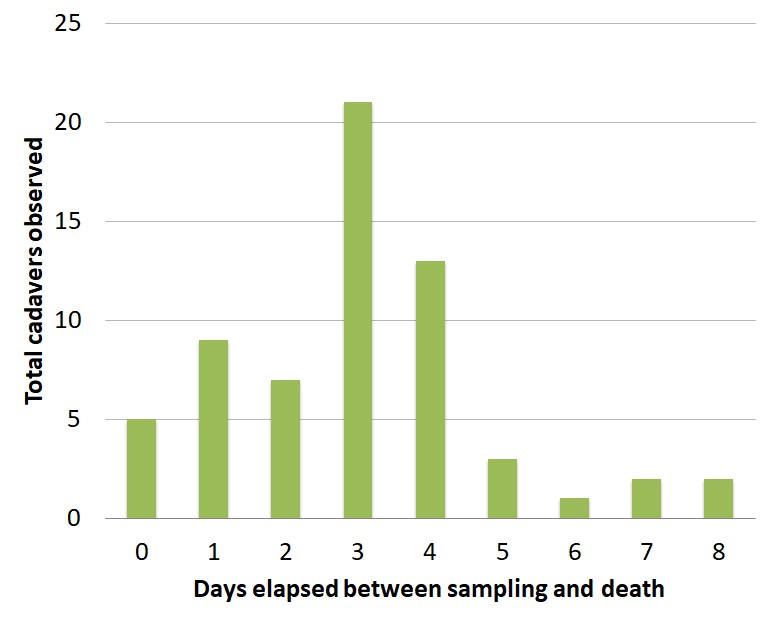
Time between capture of wild Drosophila and death by E. muscae infection when housed on Koshland diet.
Flies were housed at ambient temperature and humidity in a second-story apartment during August and September 2015 in Berkeley, CA. A total of 63 cadavers of wild Drosophila were observed out of approximately 900 flies aspirated and monitored during this time.
Figure 2 with 2 supplements
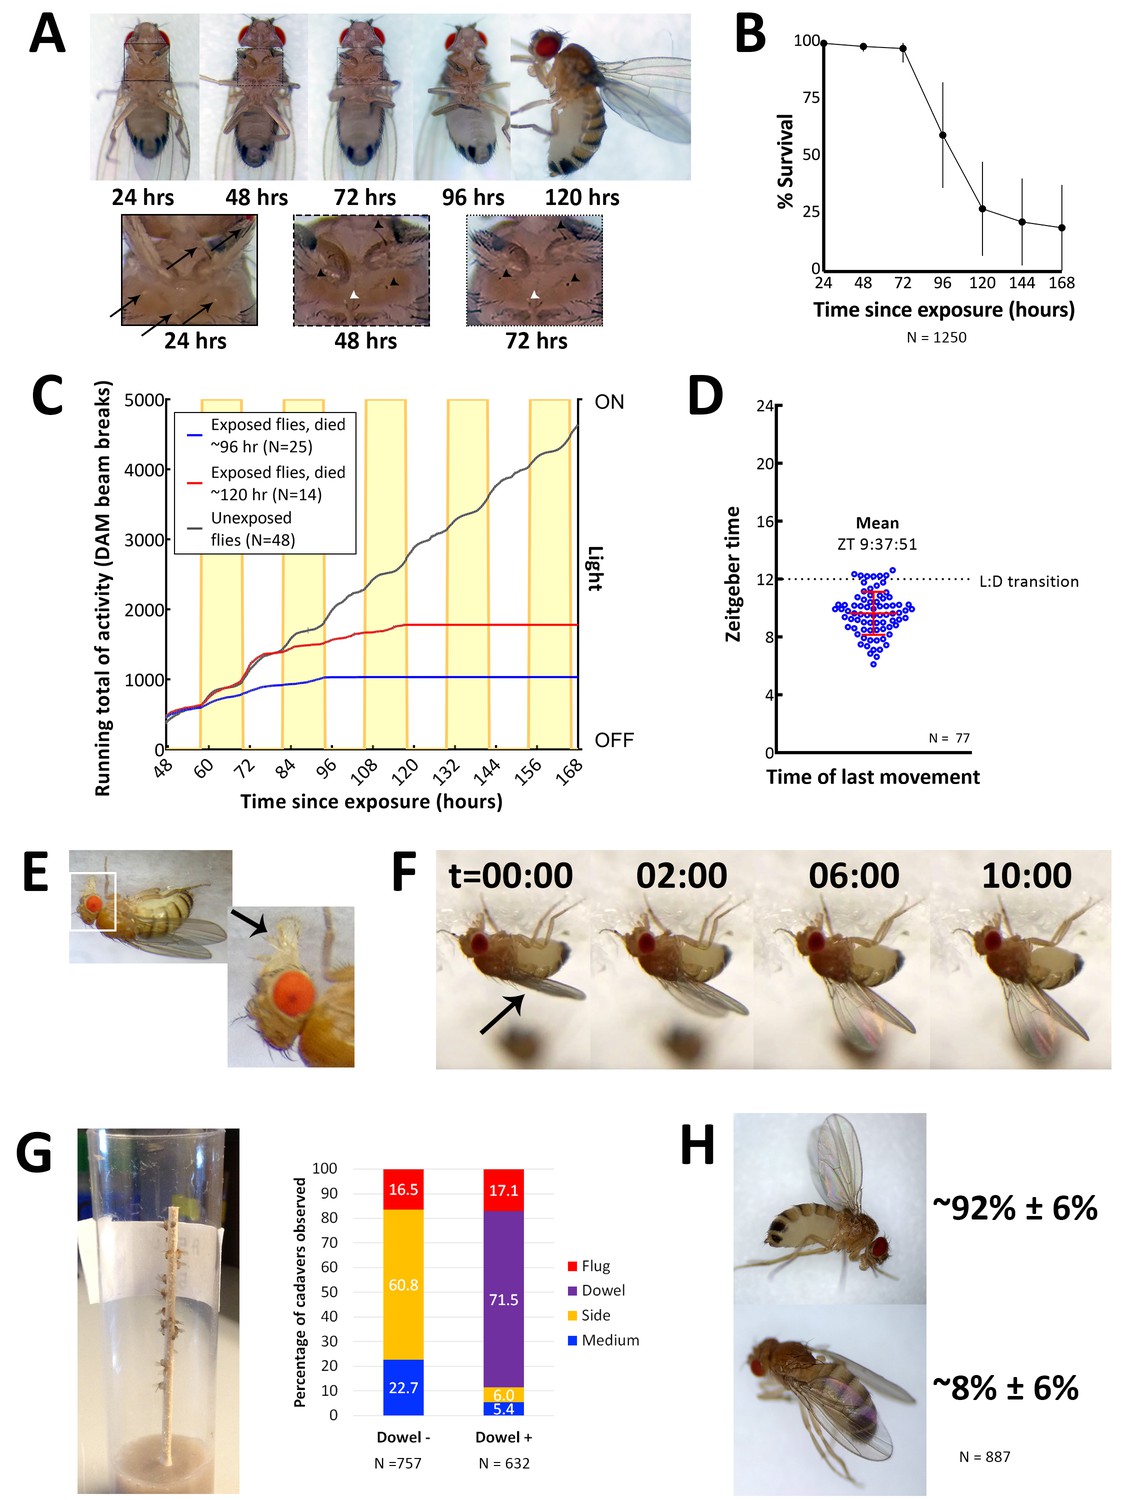
Characteristics of E. muscae 'Berkeley' infected CantonS.
(A) A typical female fly over the course of infection. Arrows denote conidia that have landed on the cuticle but not yet bored into the hemolymph. Arrowheads indicate melanization of the fly cuticle that has occurred in response to conidia boring into hemolymph. (B) Survival curve for flies infected as per standardized protocol (Figure 2—figure supplement 1). Error bars show standard deviation. (C) Activity profile of control flies or E. muscae 'Berkeley'-infected flies measured using the Drosophila activity monitor (DAM). Yellow rectangles indicate photophase in the 12:12 light:dark cycle. Error bars show standard deviation. (D) Time of last movement as measured using the DAM. Each blue circle represents the time of last movement observed for one cadaver. Flies were exposed to E. muscae 'Berkeley' as per standardized protocol. Dotted line indicates the light-dark transition (L:D transition). Error bars show standard deviation. (E) E. muscae 'Berkeley'-infected fly exhibiting proboscis extension tens of minutes before death. Arrow indicates extended proboscis adhered to the surface. Real time footage of an E. muscae 'Berkeley'-infected fly undergoing proboscis extension is available as Video 1. (F) E. muscae 'Berkeley'-infected fly exhibiting wing raising immediately prior to death. Arrow indicates original positioning of wings. Time elapsed is given in minutes:seconds. Real time footage of an E. muscae 'Berkeley'-infected fly undergoing wing raising is available as Videos 2 and 3. (G) E. muscae 'Berkeley'-killed CantonS summited and adhered to a wooden dowel. Graph to the right indicates position of death for flies housed in vials without (Dowel -) or with (Dowel +) a wooden dowel. Percentages of cadavers observed in each location are superimposed on stacked bar plot. (H) Most commonly observed wing positions of E. muscae 'Berkeley'-killed CantonS. Complete wing raising is observed in most cadavers; wing lowering is consistently observed in a small fraction of cadavers.
Figure 2—figure supplement 1

Optimization of in vivo E. muscae infection of CantonS WF D. melanogaster under laboratory conditions.
(A-E) Percentage of infected cadavers at 96 hr (4 days), 120 hr (5 days) or 144 hr (6 days) after exposure to E. muscae 'Berkeley' upon varying (A) age; (B) sex; (C) temperature and humidity; (D) CO2 anesthesia for 20 min at the indicated post-exposure time or (E) housing on 0.09% tegosept for 120 hr beginning 48 hr after exposure. 18°C > 21°C indicates that vials were incubated 24 hr at 18°C, 100% humidity then transferred to 21C, ~60% humidity. If no percent is indicated, then humidity was ~60%. All vials used 4–6 cadavers to establish infection and were set up using the anesthesia-independent protocol. Replicate vials for each condition are shown above the graph. For all panels each vial contained 50 flies. Error bars show standard deviation. (F) Summary of method for in vivo propagation of E. muscae in CantonS WF D. melanogaster. Briefly, 50 healthy, young (eclosed within the last 24 hr) CantonS flies of mixed sex are confined within 2 cm of a circle of 6 cadavers embedded head-first in sucrose agar. Vials are incubated 24 hr at 18°C and ~100% humidity. On Day 1 (24 hours since exposure) the vial plugs are raised to the top of the vial and incubation continues for the next 24 hr at 21°C with ~60% humidity. On Day 2 (48 hours since exposure), flies are moved away from cadavers and onto GB+ diet. From Days 3–7 (96 to 168 hr since exposure), vials are monitored 2–5 hr following ‘sundown’ to collect fresh cadavers. These cadavers are then used to begin new vials (Day 0).
Figure 2—figure supplement 2
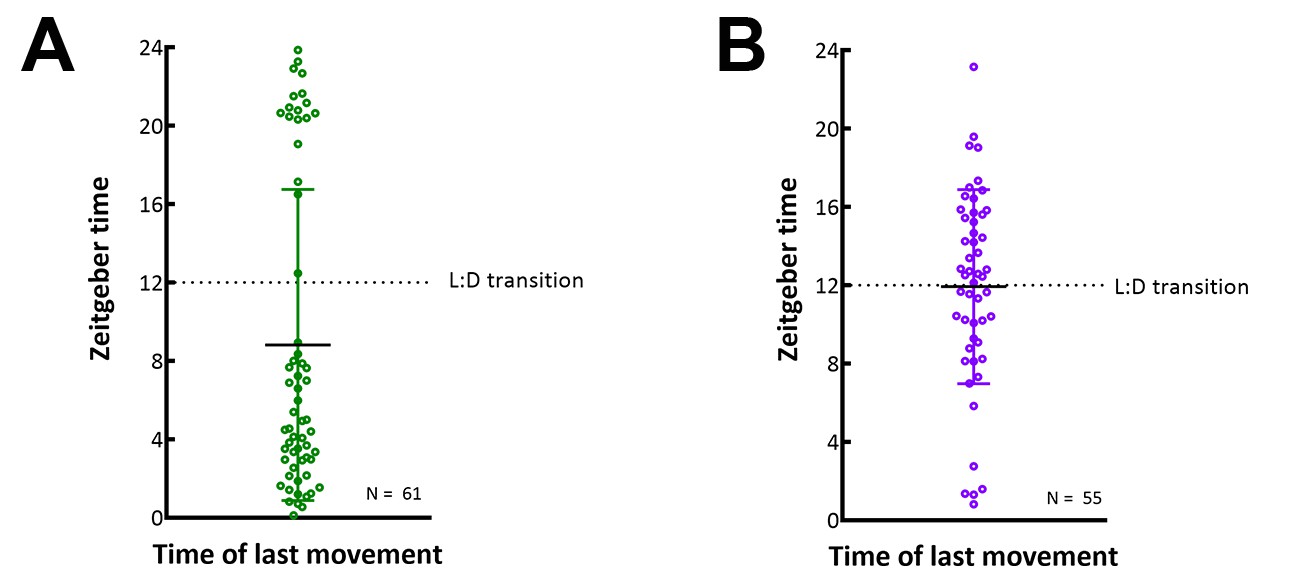
E. muscae 'Berkeley'-infected CantonS flies housed in constant darkness do not consistently die in a gated fashion.
Each circle represents the time of last movement observed for one cadaver as detected by the DAM. Flies were raised on the indicated 12:12 light:dark cycle then exposed to E. muscae 'Berkeley' as per standardized protocol. Dotted line indicates the expected light- dark transition based on the entrained light cycle. (A) Flies entrained on a 12:12 light:dark cycle with photophase beginning at 1 am and scotophase beginning at 1 pm. (B) Flies entrained on a 12:12 light:dark cycle with photophase beginning at 7 pm and scotophase beginning at 7 am. Error bars show standard deviation.
Figure 3 with 1 supplement
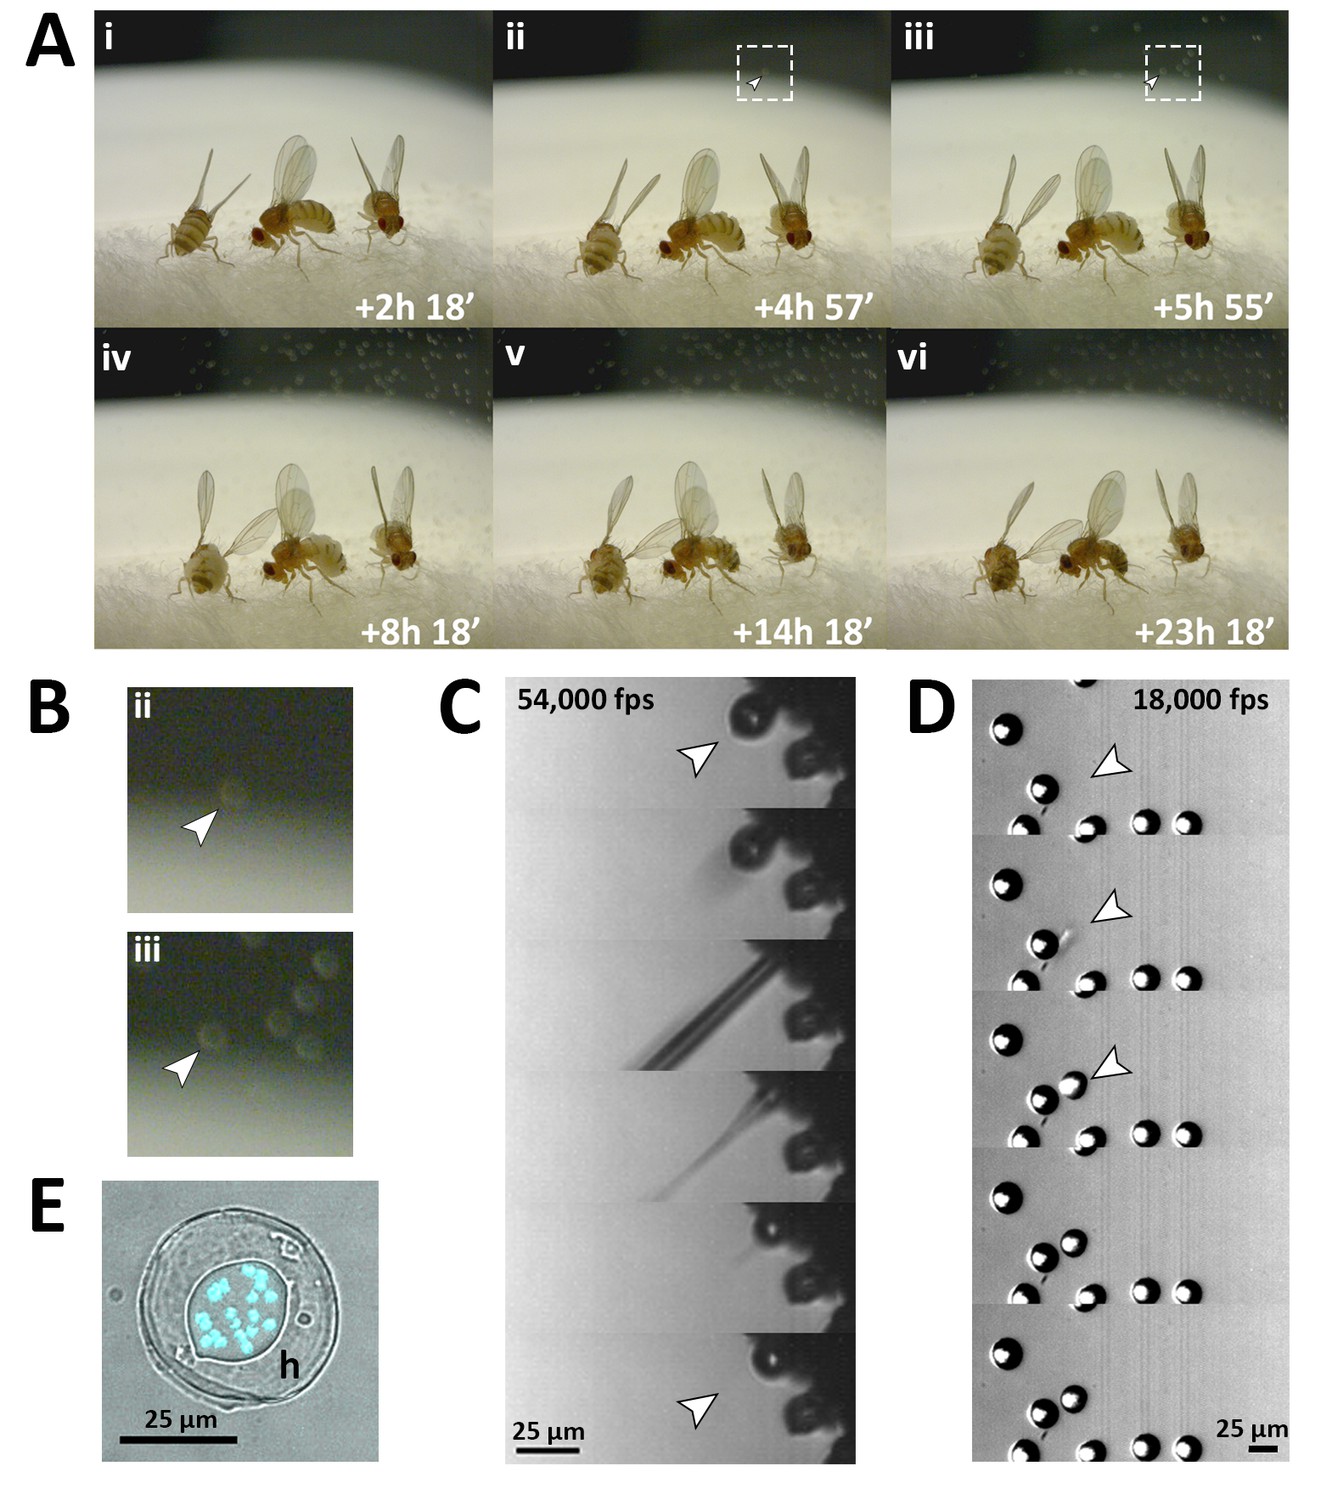
Fungal transmission from E. muscae 'Berkeley' killed cadavers.
(A) Sporulation time lapse in. (E) muscae 'Berkeley' killed cadavers. Time listed in each frame is the time that has elapsed since the light- dark transition. One image was taken every minute for ~24 hr with three cadavers situated on a cotton plug at ambient temperature and humidity. The arrowhead in frames ii, iii and their respect enlarged insets in B indicates the first primary conidium observed to land on the camera’s lens, indicating the start of conidial ejection (i.e. sporulation). Animated time lapse available as Video 5. (B) Enlarged regions outlined in A. (C) Time lapse of the ejection of a primary conidium from a sporulating cadaver as captured at 54,000 frames per second (fps). Arrowheads indicate conidium that launches and the vacant conidiophore that remains after launch. Animated time lapse available as Video 6. (D) Time lapse of a primary conidium landing on the lid of a coverslip as captured at 18,000 fps. The conidium lands as one complete unit, supporting the fungal cannon mechanism of primary conidium ejection in E. muscae. Arrowheads indicates the position where the primary conidium lands (the conidium simply appears from one frame to the next). Animated time lapse available as Video 7. (E) Primary conidium adhered to glass coverslip and stained with fluorescent nuclear dye (Hoechst 33342). The conidium is surrounded by a halo of co-ejected material (h).
Figure 3—figure supplement 1

House flies (M. domestica) infected with E. muscae ‘Berkeley’ five to eight days after exposure to E. muscae ‘Berkeley’-killed D. melanogaster cadavers.
House flies are shown placed in custom, 3D-printed chambers to aid spore collection for microscopy.
Figure 4 with 3 supplements
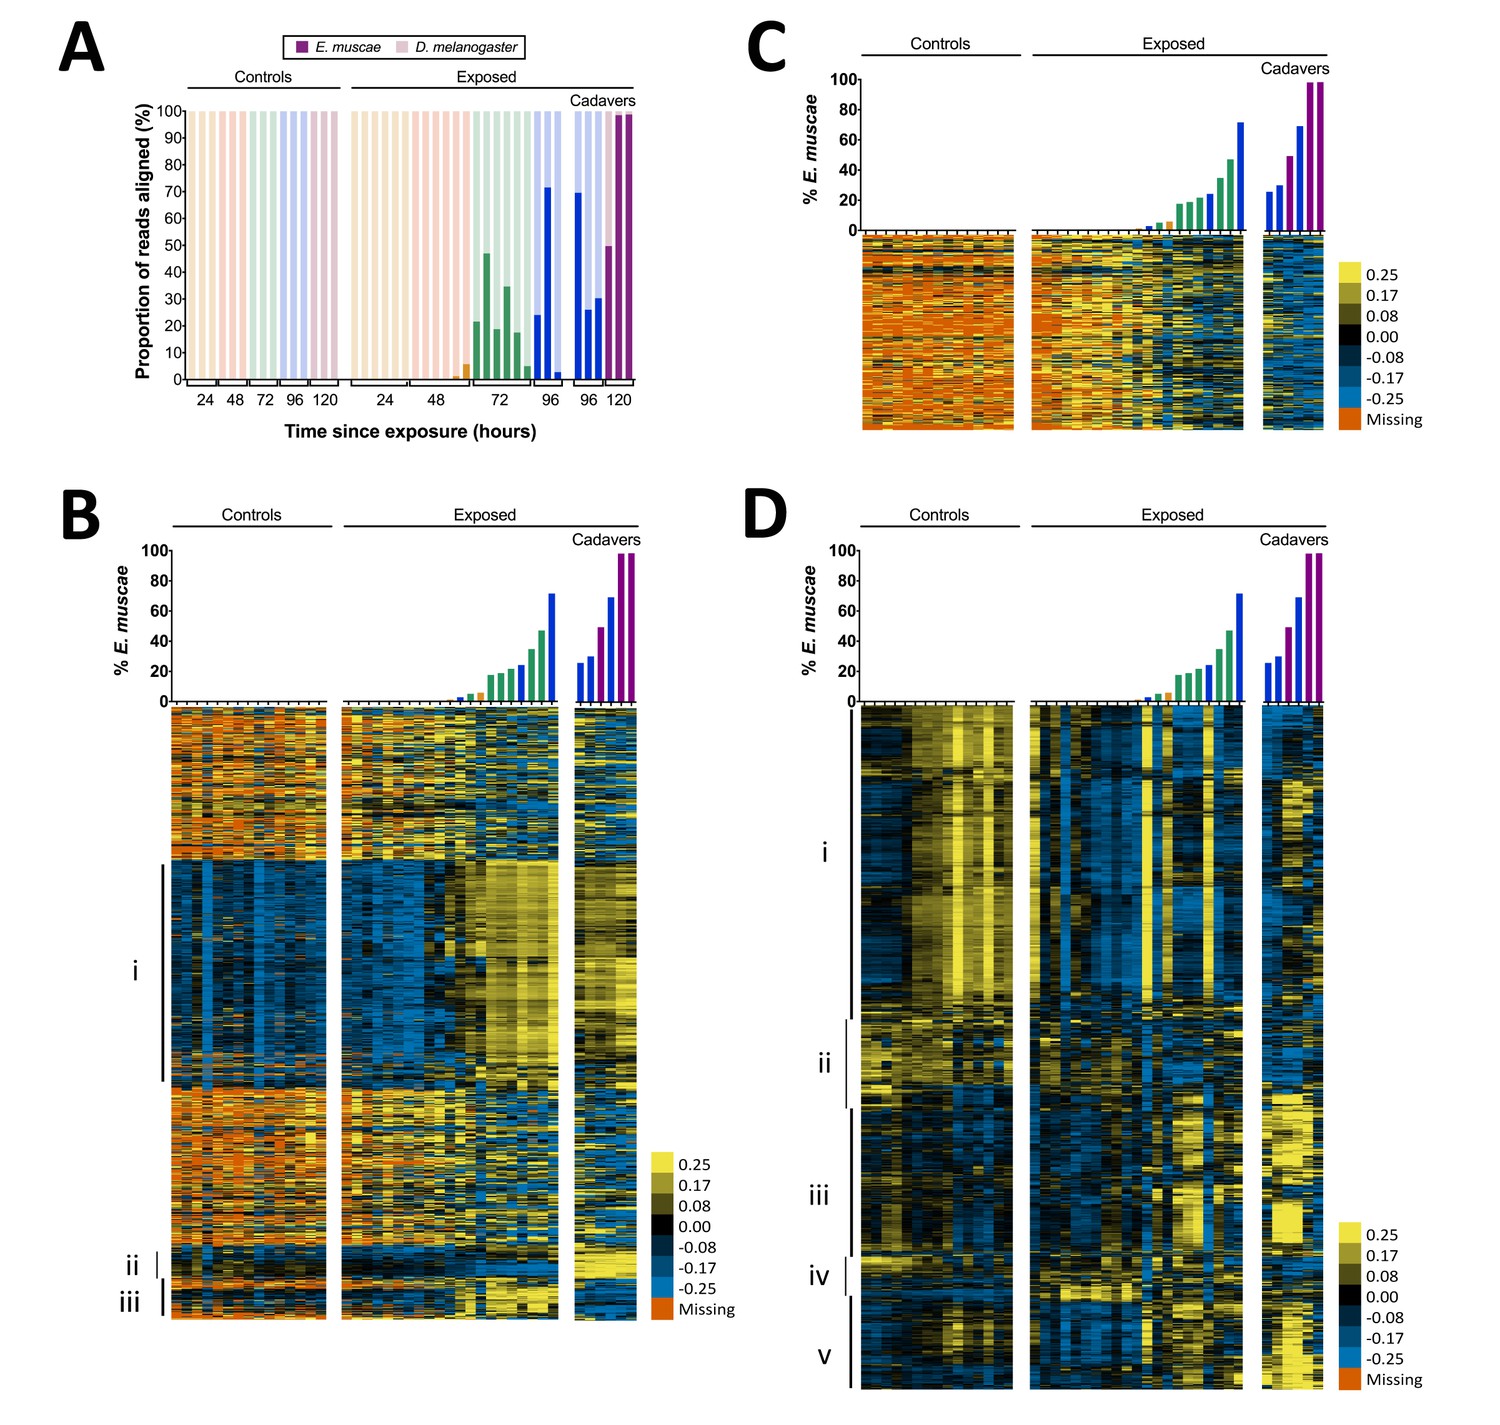
Gene expression time course of E. muscae 'Berkeley'-infected CantonS flies.
(A) Proportion of reads aligned to D. melanogaster reference (mRNA) versus E. muscae 'Berkeley' references (de novo transcriptome and de novo annotated mRNAs in genome) using bowtie2. Samples are separated into controls (healthy animals who were mock exposed), exposed (animals who exposed to E. muscae 'Berkeley' and were alive at the time of sampling) and cadavers (animals who were killed by E. muscae 'Berkeley', dead at the time of sampling) and are color-coded according to the time point at which they were collected (i.e. 24, 48, 72, 96 or 120 hr). (B) E. muscae 'Berkeley' expression data from E. muscae 'Berkeley'- exposed and cadaver samples calculated from alignment to de novo E. muscae transcriptome. Complete linkage hierarchical clustering by gene was performed in Gene Cluster 3.0 after filtering out genes that are not expressed at least at ten TPM in at least three out of 42 samples (9500 transcripts total), then log transforming and centering on the mean value for each transcript. Samples are ordered by percentage of E. muscae 'Berkeley' reads as a fraction of the total reads aligned (above). The scale bar for the heatmap is given to the right of the plot. (C) E. muscae 'Berkeley' expression data from E. muscae 'Berkeley'-exposed and cadaver samples calculated from alignment to de novo E. muscae genome. Complete linkage hierarchical clustering by gene was performed in Gene Cluster 3.0 after filtering out genes that are not expressed at least at two TPM in at least three out of 42 samples (3104 transcripts total), then log transforming and centering on the mean value for each transcript. Samples are ordered by percentage of E. muscae 'Berkeley' reads as a fraction of the total reads aligned (above). The scale bar for the heatmap is given to the right of the plot. (D) D. melanogaster expression data from control, E. muscae 'Berkeley'- exposed and E. muscae 'Berkeley'-killed cadavers. Complete linkage hierarchical clustering by gene was performed in Gene Cluster 3.0 after filtering out genes that are not expressed at least at two TPM in at least three out of 42 samples (10,746 transcripts total), then log transforming and centering on the mean value for each transcript. Samples are ordered by percentage of E. muscae 'Berkeley' reads as a fraction of the total reads aligned (above). The scale bar for the heatmap is given to the right of the plot. Heatmaps are scaled identically between panels (B-D).
Figure 4—figure supplement 1
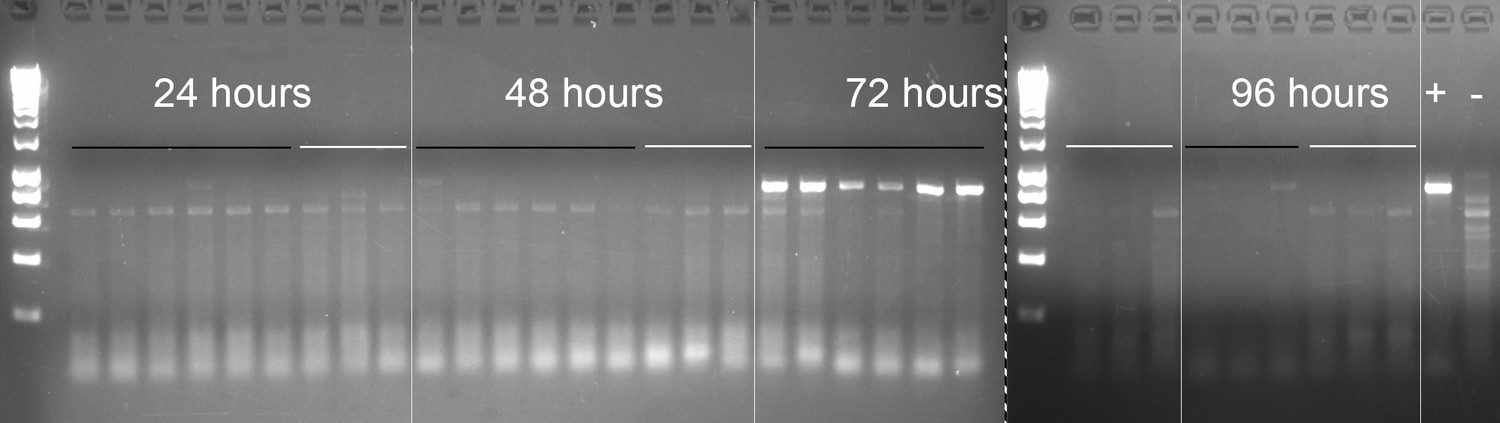
Reverse-transcription PCR of E. muscae 'Berkeley' ITS sequence in exposed and control flies.
All samples were run on the same gel with equal loading volumes; samples to the right of the dashed line were run on the lower half of the same gel containing samples to the left of dotted line (see Materials and methods for sample generation). DNA ladder (5 μL Hyperladder 1 kb, Bioline) was run in the first lane of each gel half. Samples are shown in chronological order, with the time point indicated above the left-most sample. Black lines indicated exposed flies; white lines indicate unexposed flies. Exposed flies collected at 96 hr were cadavers that had died of E. muscae 'Berkeley' infection. Plus (+) indicates positive control (E. muscae 'Berkeley' in vitro RNA template); minus (-) indicates additional negative control (D. melanogaster RNA from earlier experiment, before the discovery and introduction of E. muscae 'Berkeley' to the laboratory).
Figure 4—figure supplement 2
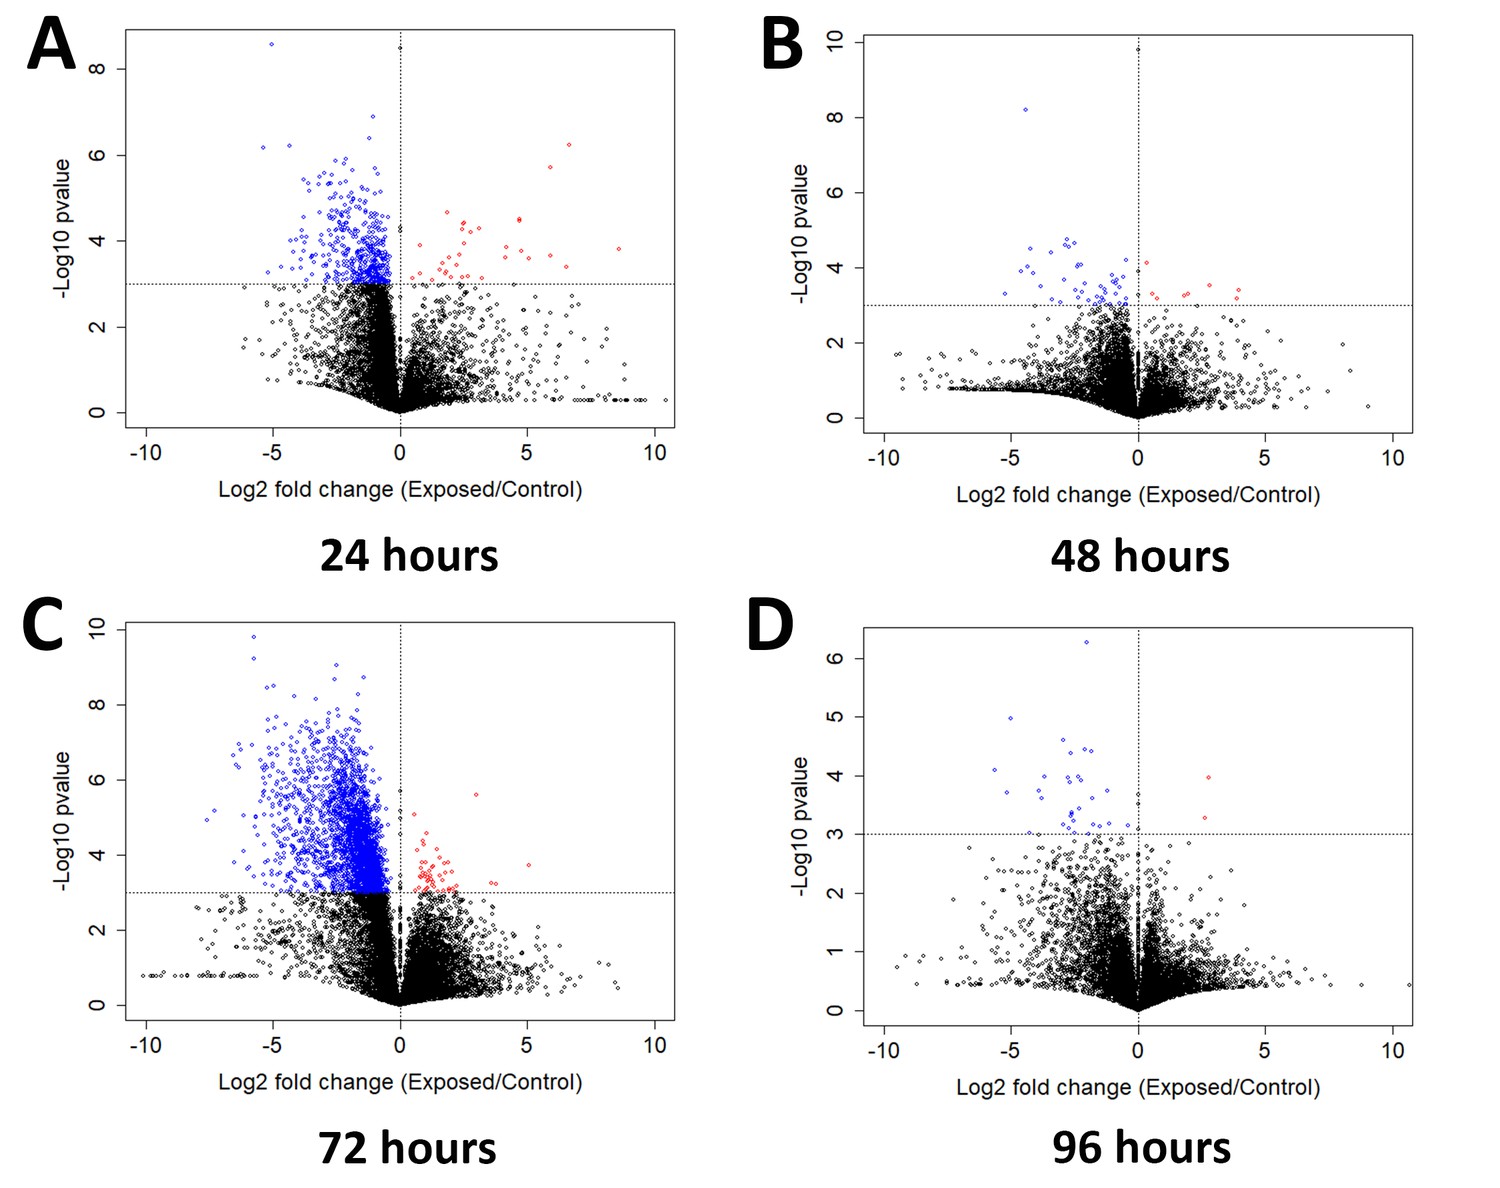
Genes exhibiting differential expression between flies after mock exposure or exposure to E. muscae between living flies collected at individual time points.
Volcano plot for all genes at (A) 24 hr, (B) 48 hr, (C) 72 hr or (D) 96 hr. Genes with p-value<0.001 are shown in color (red denotes higher expression in exposed than control animals; blue denotes the opposite case). P-value is determined by ANOVA grouping control vs. exposed samples.
Figure 4—figure supplement 3
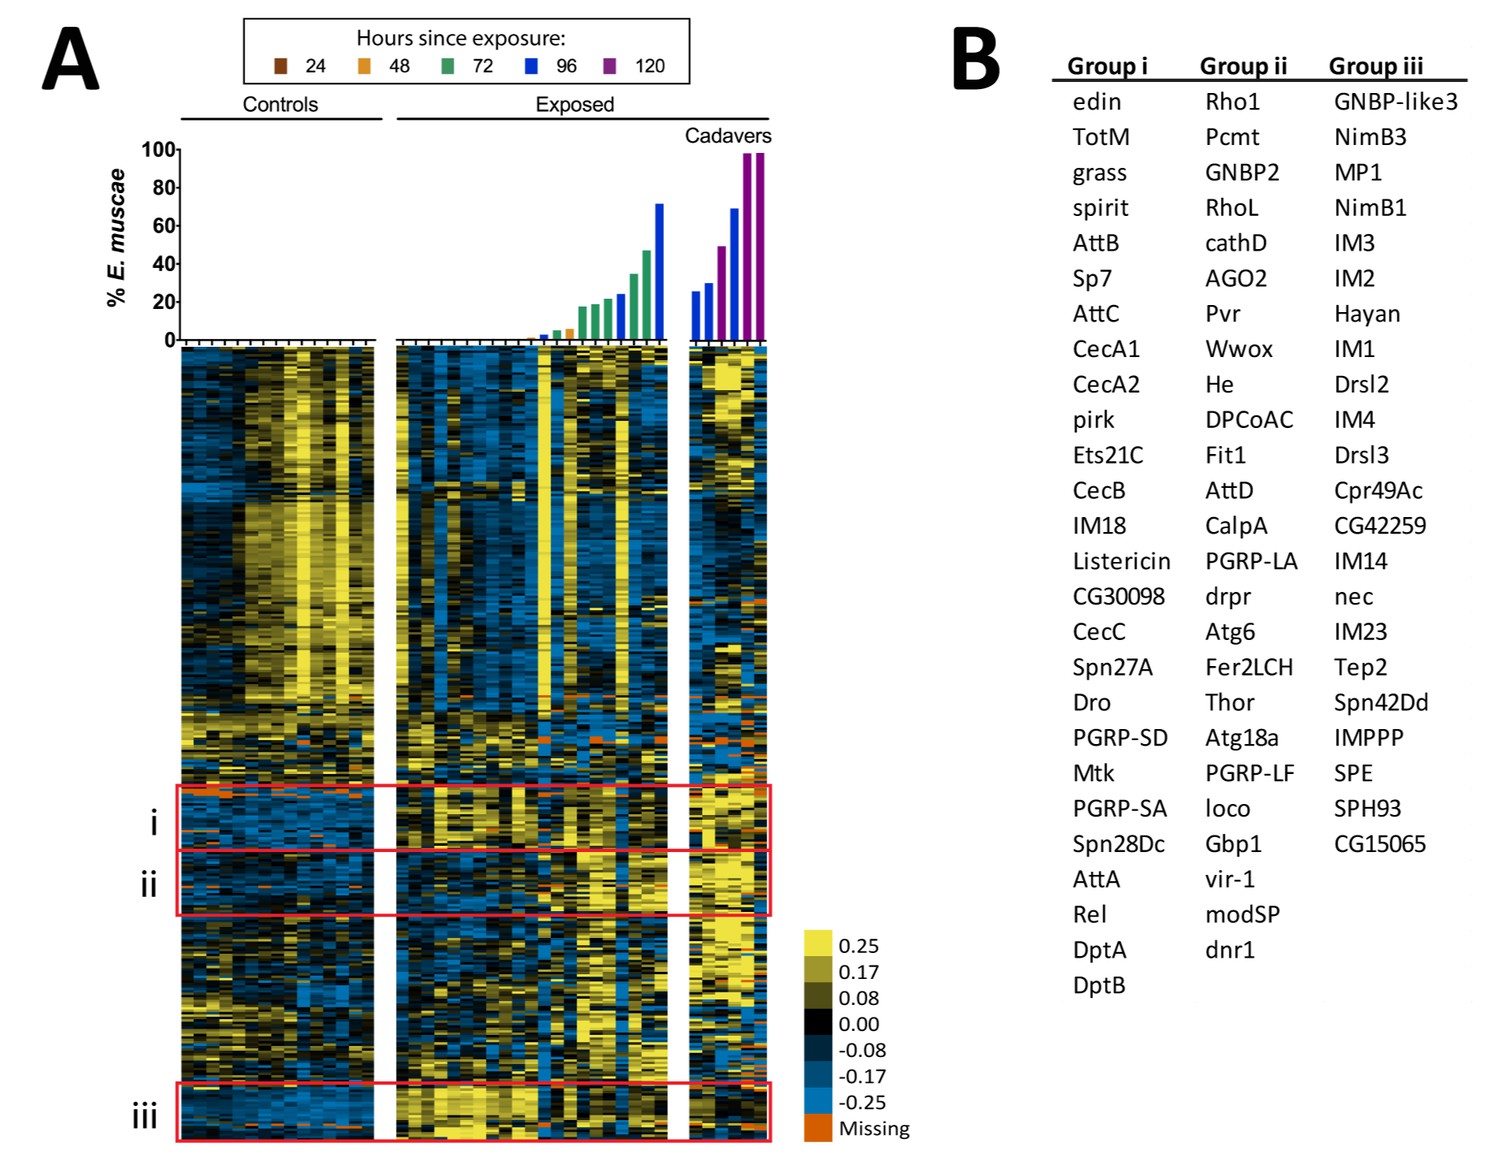
Expression of immune genes over the course of infection of D. melanogaster by E. muscae 'Berkeley'.
Complete linkage hierarchical gene clustering by gene was performed in Gene Cluster 3.0 on all genes annotated with defense response (GO 0006952; 357 transcripts) after filtering out genes that are not expressed at least at two TPM in at least three out of 42 samples (327 transcripts), then log transforming and centering on the mean value for each transcript. Samples are ordered by percentage of E. muscae 'Berkeley' reads as a fraction of the total reads aligned (above). The scale bar for the heatmap is given to the right of the plot.
Figure 5
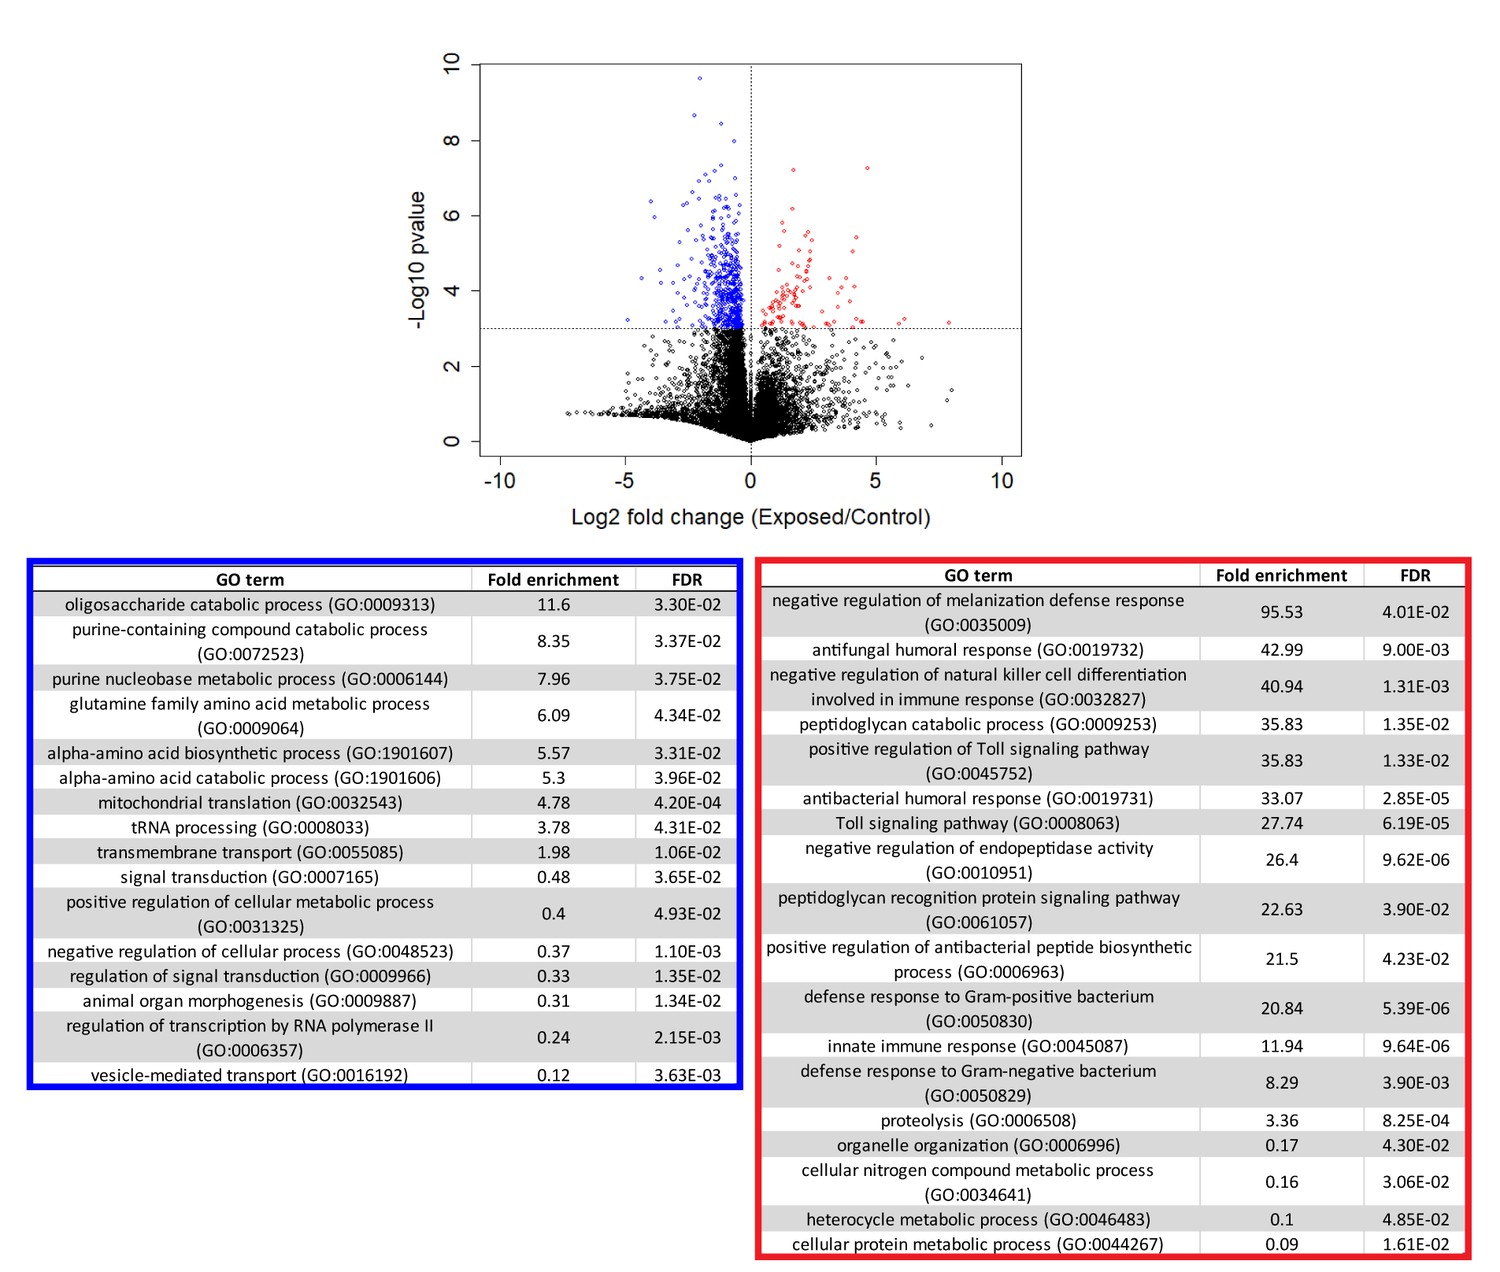
Genes that are consistently over or under-expressed compared to controls over the first 96 hr after exposure to E. muscae 'Berkeley'.
Top: Volcano plot for all genes over the first 96 hr after exposure. P-value is determined by ANOVA grouping 24–96 hr control vs. 24–96 hr exposed samples. Genes with p-value below 0.001 are shown in color. Bottom: PANTHER Gene Ontology (GO)-term analysis (complete biological process) of genes overexpressed (red) or under-expressed (blue) in exposed animals compared to controls. FDR column lists the p-value from a Fisher’s Exact test with false discovery rate correction for multiple testing.
Figure 6
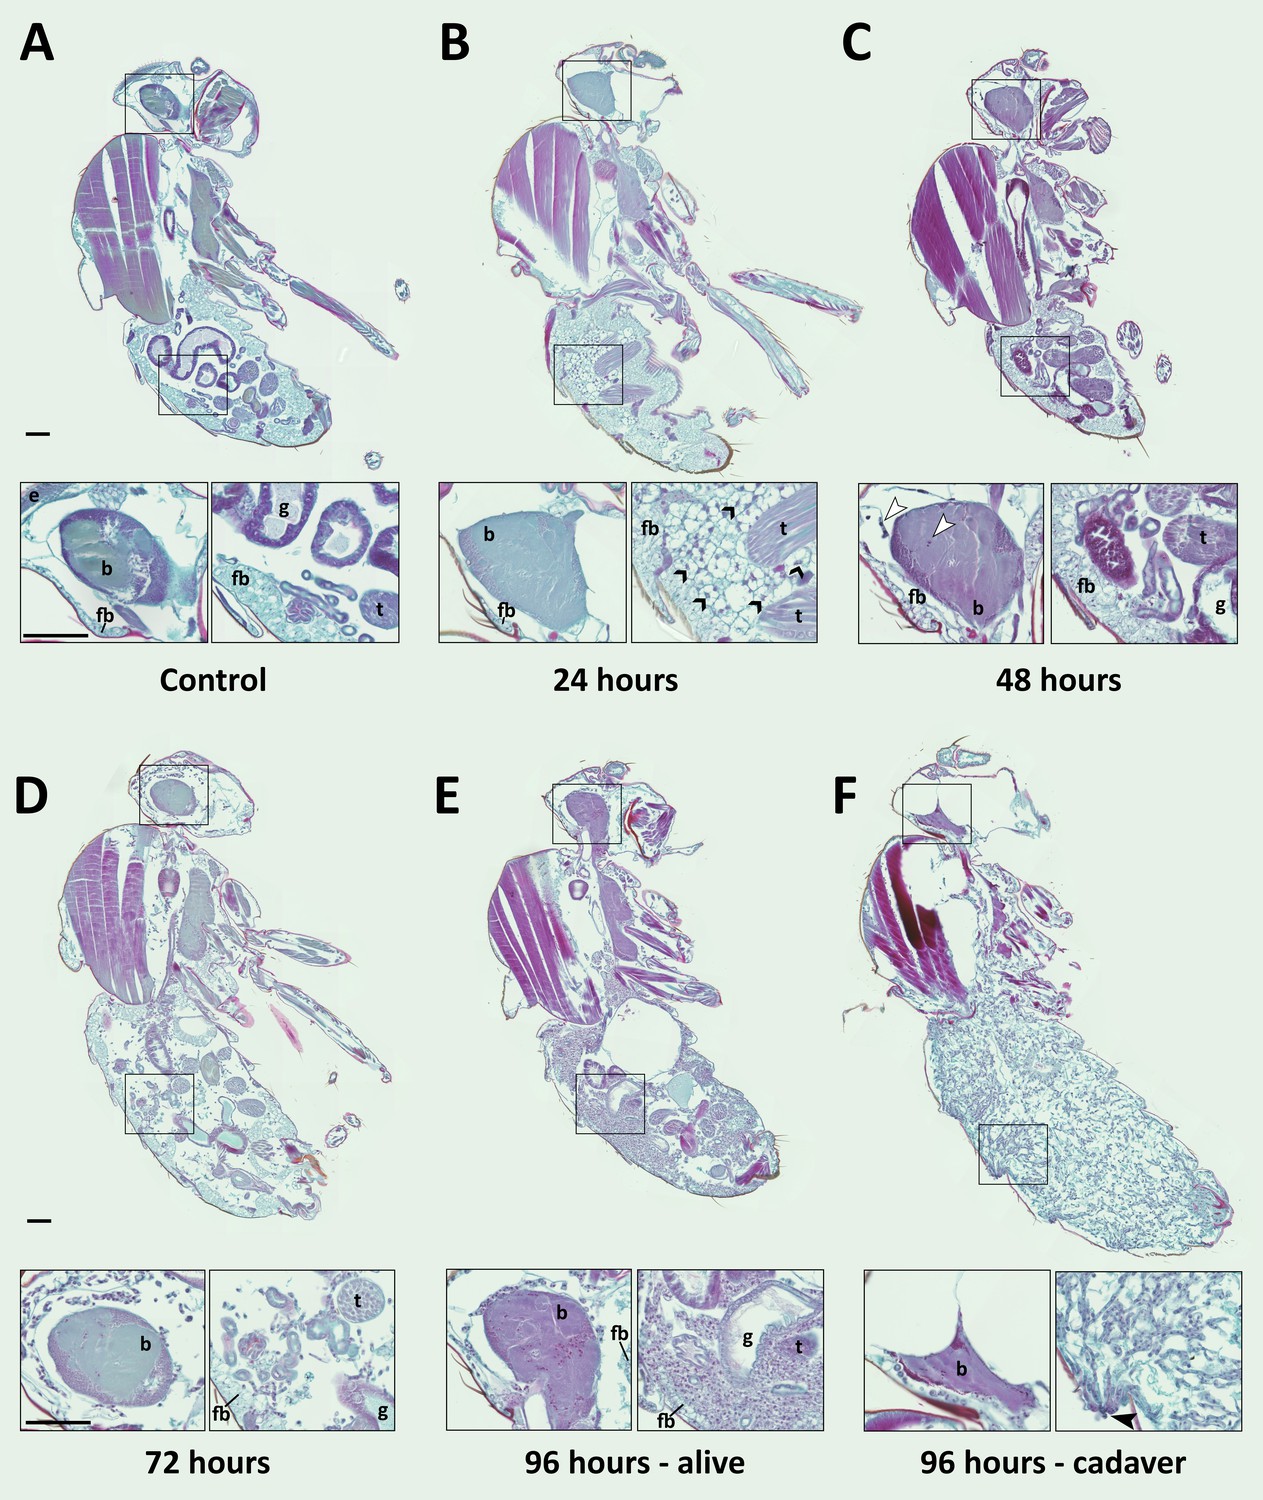
E. muscae 'Berkeley' is consistently present in the nervous system starting 48 hr after exposure.
CantonS flies were exposed or mock-exposed (control) to E. muscae 'Berkeley' starting 3–5 hr after the light-dark transition and were subsequently sampled at 24, 48, 72 or 96 hr for histological analysis. For each time point, 4–6 individual, paraffin-embedded flies were sectioned at 8 µm, stained using Safranin O/Fast Green to identify fungal morphology and location and imaged at 20x magnification (Zeiss Axio Scan.Z1 slide scanner). Representative images from each time point are shown. Only male flies are shown here for ease of comparison. No differences in the progression of the infection were observed between males and females. An inset of the brain and the abdomen are shown for each sample. (A) Uninfected fly with major anatomical features labeled as follows: e - eye, b - brain, g - gut, t - testes, fb - fat body. (B) At 24 hr after exposure there is significant inflammation observed in the abdominal fat body (black arrowheads label a few clear examples); the nervous system is devoid of fungal cells. (C) At 48 hr after exposure E. muscae 'Berkeley' cells are present in the brain (white arrowheads) and/or ventral nerve cord (VNC) of all but one sample where E. muscae 'Berkeley' cells abut but have not yet entered brain. E. muscae 'Berkeley' cells are sparsely observed in the abdominal and/or thoracic hemolymph at 48 hr. The gut and testes are not invaded by fungus. (D) At 72 hr after exposure, E. muscae 'Berkeley' can be found throughout the body cavity and the amount of visible fat body has decreased. E. muscae 'Berkeley' titers have increased in the nervous system. (E) In a living fly at 96 hr after exposure (the first point at which a fly may be killed by E. muscae 'Berkeley' infection), fungus occupies virtually all available volume in the hemolymph. E. muscae 'Berkeley' titers have increased in the nervous system, gut and gonads remain uninvaded. (F) In an E. muscae 'Berkeley'-killed fly (cadaver) at 96 hr after exposure, only traces of host organs remain in the abdomen and the nervous system has been considerably degraded. No fat body cells are observed. E. muscae 'Berkeley' cells differentiate into conidiophores, cell-walled structures that will pierce through weak points of the cuticle to produce and launch infectious conidia. Black scale bars are 100 µm. All living animals shown are males; cadaver’s sex is undetermined (the gonads have been consumed by the fungus).
Figure 7
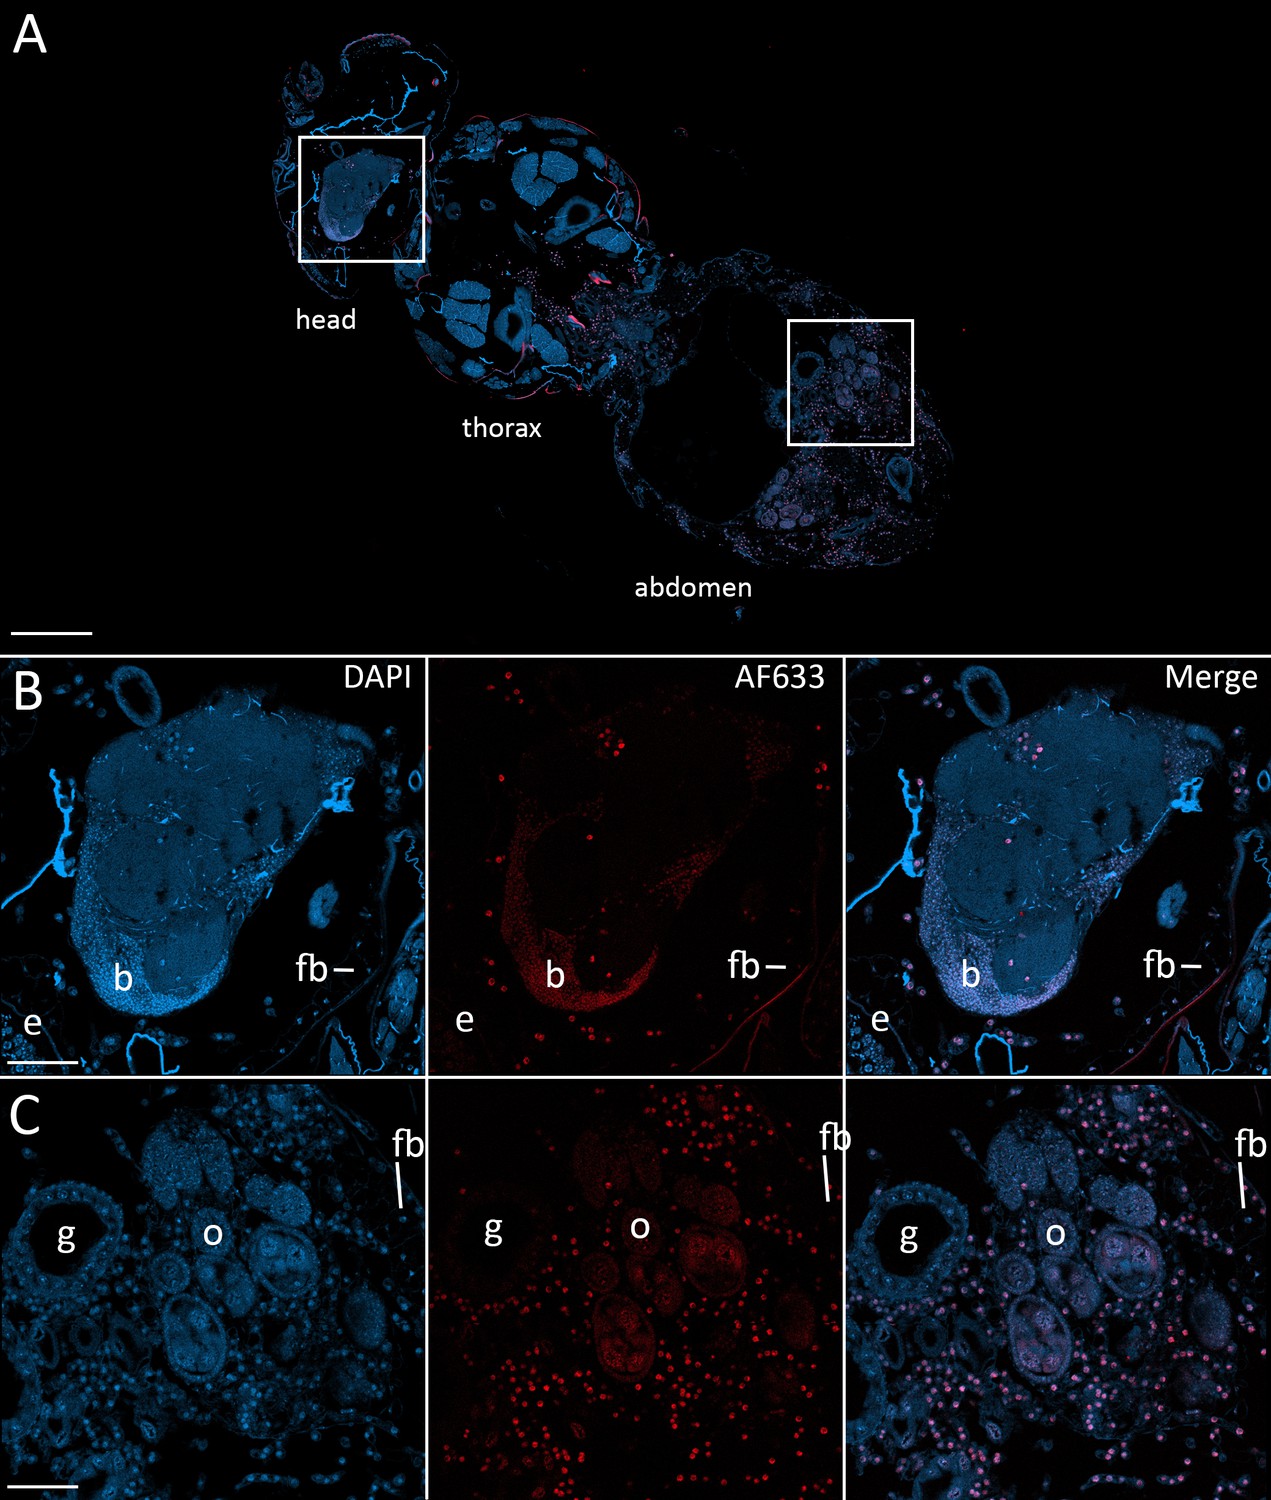
Fluorescence in situ hybridization confirms that E. muscae 'Berkeley' resides in the nervous system during infection.
CantonS flies were exposed or mock-exposed (control) to E. muscae 'Berkeley' starting 3–5 hr after the light:dark transition and were subsequently sampled at 24, 48, 72 or 96 hr for histological analysis. For time points 48 hr and later, at least 3 individual, paraffin-embedded flies were sectioned at 8 µm and subjected to FISH with an E. muscae 'Berkeley'-specific 18mer DNA probe labeled at the 5’ end with AlexaFluor633. Sections were imaged at 40x magnification on a confocal fluorescent microscope (Zeiss 800 LSM). (A) Pseudo-coronal section of a female sampled 96 hr after infection stained with an E. muscae 'Berkeley'-specific probe and DAPI. Regions shown at higher detail in B and C located are denoted by white boxes. Scale bar is 200 µm. (B) Enlargement of top region in A showing each DAPI, AlexaFluor633 and merged images of this area. E. muscae 'Berkeley' nuclei are strongly labeled and can be observed inside the host neuropil. Fungal nuclei are also observed in the head outside of the brain. Scale bar is 50 µm. Major anatomical features labeled as follows: e - eye, b - brain, fb - fat body. (C) Enlargement of bottom region in A showing each DAPI, AlexaFluor633 and merged images of this area. E. muscae nuclei are observed in abundance outside of gut and ovaries. Scale bar is 50 µm. Major anatomical features labeled as follows: g - gut, o - ovaries, fb - fat body.
Figure 8 with 1 supplement
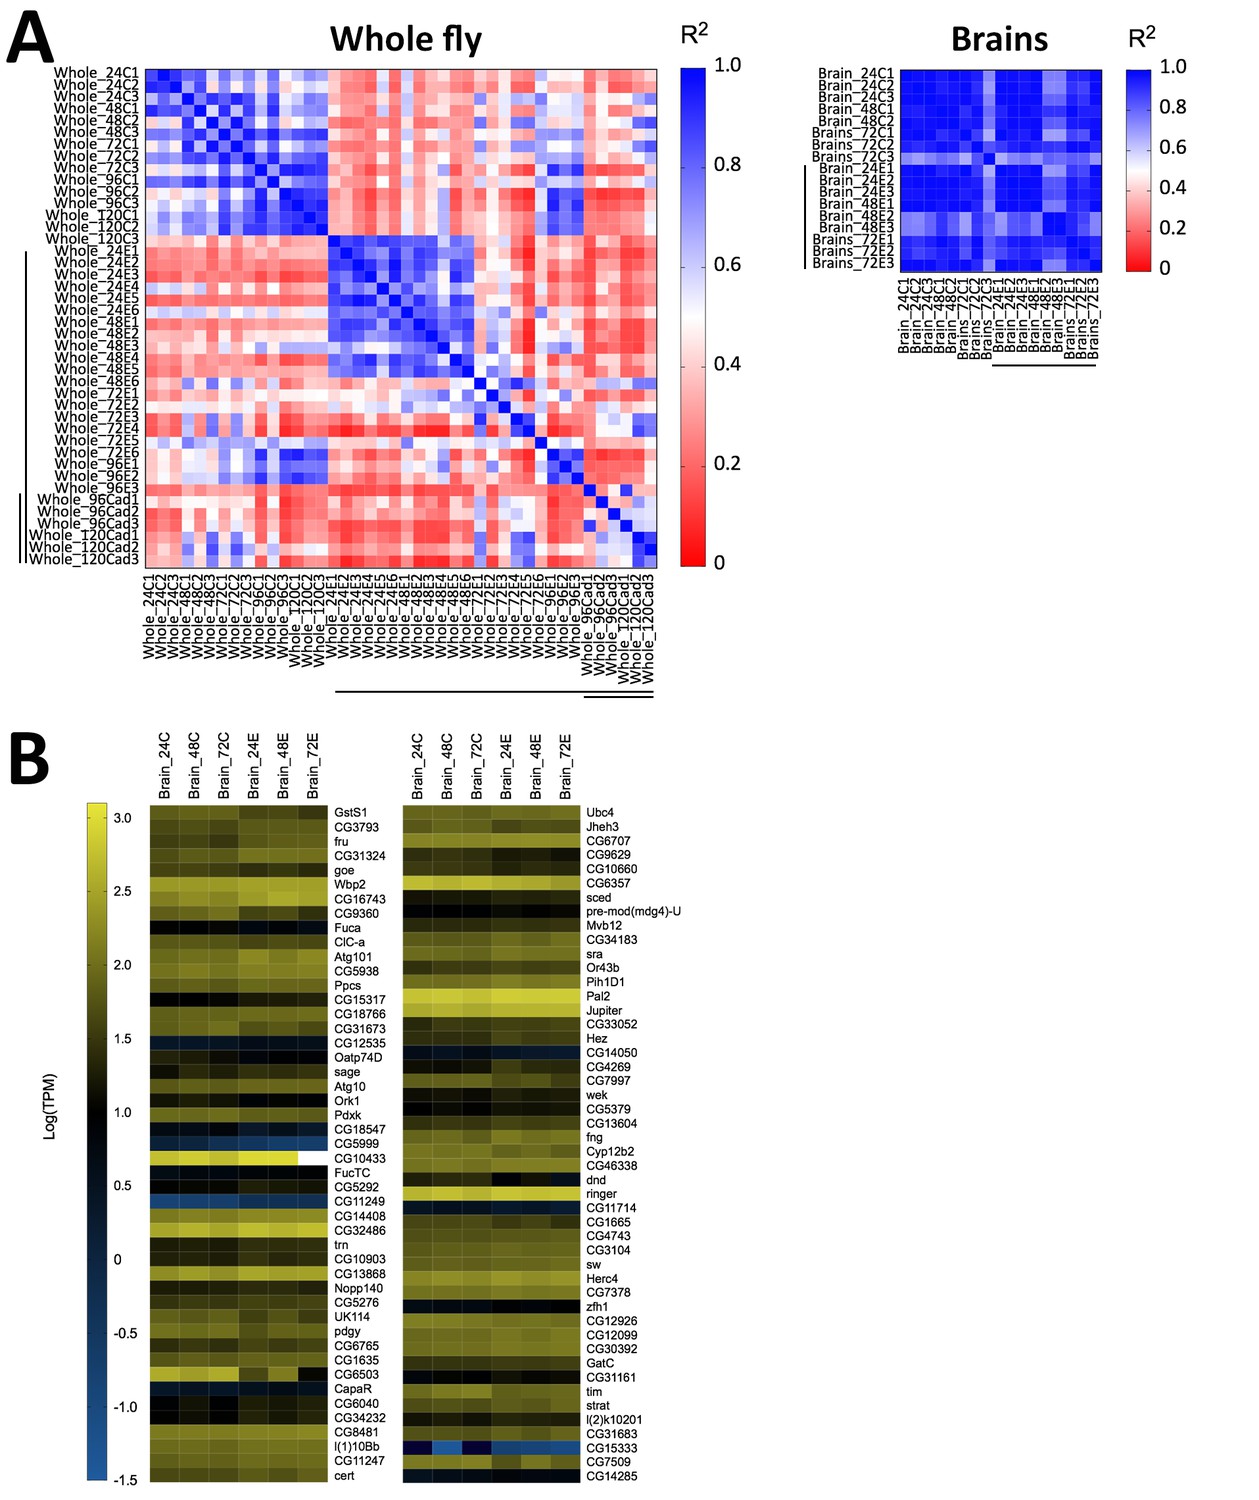
Host gene expression in the brain is minimally altered over the first 72 hr of E. muscae 'Berkeley' infection.
(A) Left) All pairwise linear correlations between samples from E. muscae 'Berkeley'- infected whole fly RNAseq time course. Right) All pairwise linear correlations between samples from E. muscae 'Berkeley'-infected dissected brain pilot RNAseq time course. Samples are named in the following format: Tissue_HourTreatmentReplicate, with ‘C’ indicating controls, ‘E’ indicating exposed flies living at the time sampled and ‘cad’ indicates that the fly had been killed by E. muscae 'Berkeley' before sampling. For example, ‘Whole_24C1’ indicates the first replicate control sample (uninfected fly) of a whole animal taken at 24 hr after mock exposure. Living, exposed samples are denoted on each axis with a black bar; infected cadaver samples are denoted with a double black bar. (B) Heatmap showing all genes that are differentially expressed (p value < 0.001) between controls (uninfected) and exposed flies at 24–72 hr, as determined by ANOVA. Genes are shown in order of increasing p-value from top left corner to bottom right corner.
Figure 8—figure supplement 1
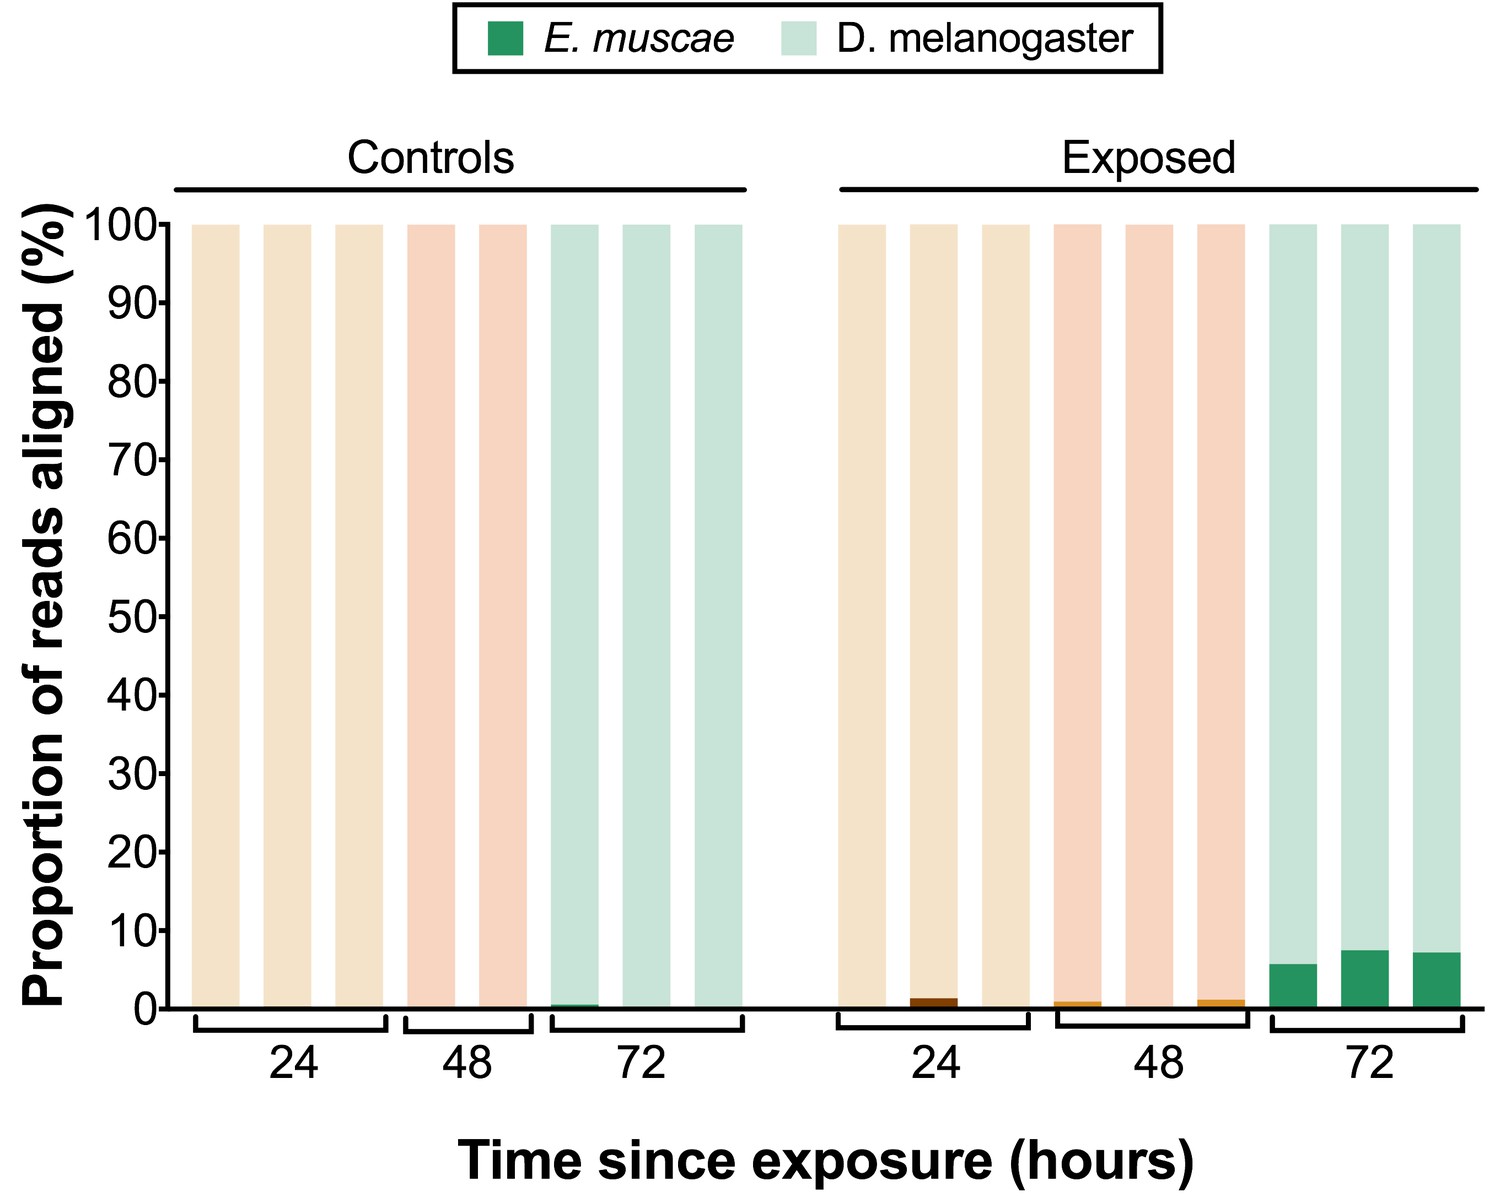
E. muscae ‘Berkeley’ transcripts detected in dissected brains.
Proportion of reads aligned to D. melanogaster reference (mRNA) versus E. muscae 'Berkeley' references (de novo transcriptome and de novo annotated mRNAs in genome) using bowtie2. Samples are separated into controls (healthy animals who were mock exposed), exposed (animals who exposed to E. muscae 'Berkeley' and were alive at the time of sampling) and cadavers (animals who were killed by E. muscae 'Berkeley', dead at the time of sampling) and are color-coded according to the time point at which they were collected (i.e. 24, 48 or 72 hr).
Videos
Video 1
E. muscae 'Berkeley'-infected CantonS fly undergoing end-of-life proboscis extension.
Video recorded through the eyepiece of a dissecting microscope on a Nexus 5x phone (Google). Capture and playback are in real time.
Video 2
E. muscae 'Berkeley'-infected CantonS fly undergoing end-of-life wing raising, viewed from the side.
Video was captured with a Nexus 5x phone (Google) and macro lens (Luxsure). Capture and playback are in real time.
Video 3
E. muscae 'Berkeley'-infected CantonS fly undergoing end-of-life wing raising, viewed head-on.
Video was captured with a Nexus 5x phone (Google) and macro lens (Luxsure). Capture and playback are in real time.
Video 4
Formation of primary conidia atop conidiophores.
The intersegmental membranes of a fresh E. muscae 'Berkeley'-killed cadaver were imaged at 20x magnification every minute for 222 min beginning 4 hr and 10 min after sunset. The time lapse is played back at 10 fps. Scale bar is 50 µm.
Video 5
Animated time lapse of E. muscae 'Berkeley'-infected CantonS cadavers undergoing spore production and ejection.
Sporulation time lapse in E. muscae 'Berkeley'-killed cadavers. Time listed at the top right corner of each frame is the time that has elapsed since the light-dark transition. One image was taken every minute for ~24 hr with three cadavers situated on a cotton plug at ambient temperature and humidity. Images are played back at 10 fps.
Video 6
A primary conidium is ejected from a conidiophore formed in an E. muscae 'Berkeley'- killed cadaver.
Arrowheads indicate conidium that launches and the vacant conidiophore that remains after launch. Video was captured at 54,000 frames per second (fps) at 5x magnification; frames are played back at 5 fps. Scale bar is 25 µm.
Video 7
A primary conidium lands on the lid of a polystryene petri dish.
The conidium lands as one complete unit, supporting the fungal cannon mechanism of primary conidium ejection in E. muscae. Video was captured at 18,000 fps at 5x magnification; frames are played back at 5 fps. Scale bar is 25 µm.
Video 8
Formation of secondary conidia from off-target primaries.
The wing of an E. muscae 'Berkeley'-killed cadaver was imaged at 20x magnification every minute for 361 min beginning 10 hr and 30 min after the light-dark transition. The time lapse is played back at 10 fps. Scale bar is 100 µm.
Additional files
-
Supplementary file 1
Summary of E. muscae infected Drosophila observed in California from 2014 until 2017.
- https://doi.org/10.7554/eLife.34414.029
-
Supplementary file 2
Morphology of primary conidia of E. muscae 'Berkeley' compared to other reported E. muscae strains.
- https://doi.org/10.7554/eLife.34414.030
-
Supplementary file 3
PANTHER functional classification of blastx results for fungal transcript groups as given in Figure 4B.
Transcripts in groups i-iii were translated and queried against the UniProt Swiss-Prot database using blastx. Uniprot identification numbers of transcripts with matches with an e- value less than 1e-40 were analyzed using PANTHER’s functional classification analysis.
- https://doi.org/10.7554/eLife.34414.031
-
Supplementary file 4
GO term enrichments of host gene groups as given in Figure 4D.
PANTHER GO-term analysis (complete biological process) for genes in Groups i-v (Figure 4D). FDR column lists the p-value from a Fisher’s Exact test with false discovery rate correction for multiple testing.
- https://doi.org/10.7554/eLife.34414.032
-
Supplementary file 5
GO term enrichments of host gene groups as given in Figure 4—figure supplement 2.
PANTHER GO-term analysis (complete biological process) for colored genes in Figure 4—figure supplement 2. FDR column lists the p-value from a Fisher’s Exact test with false discovery rate correction for multiple testing.
- https://doi.org/10.7554/eLife.34414.033
-
Supplementary file 6
PANTHER functional classification of blastx results for fungal transcripts that are overexpressed in exposed compared to control samples at 72 hr post-exposure.
Transcripts in were translated and queried against the UniProt Swiss-Prot database using blastx. Uniprot identification numbers of transcripts with matches with an e-value less than 1e-40 were analyzed using PANTHER’s functional classification analysis.
- https://doi.org/10.7554/eLife.34414.034
-
Transparent reporting form
- https://doi.org/10.7554/eLife.34414.035
Download links
A two-part list of links to download the article, or parts of the article, in various formats.
Downloads (link to download the article as PDF)
Open citations (links to open the citations from this article in various online reference manager services)
Cite this article (links to download the citations from this article in formats compatible with various reference manager tools)
Robust manipulation of the behavior of Drosophila melanogaster by a fungal pathogen in the laboratory
eLife 7:e34414.
https://doi.org/10.7554/eLife.34414


