The transcriptomic and epigenetic map of vascular quiescence in the continuous lung endothelium
- Heidelberg University, Germany
- German Cancer Research Center (DKFZ-ZMBH Alliance), Germany
- German Cancer Research Center, Germany
- Institute for Research in Biomedicine (IRB Barcelona), The Barcelona Institute for Science and Technology, Spain
- Institució Catalana de Recerca i Estudis Avançats, Spain
- German Cancer Consortium, Germany
Figures
Figure 1 with 2 supplements
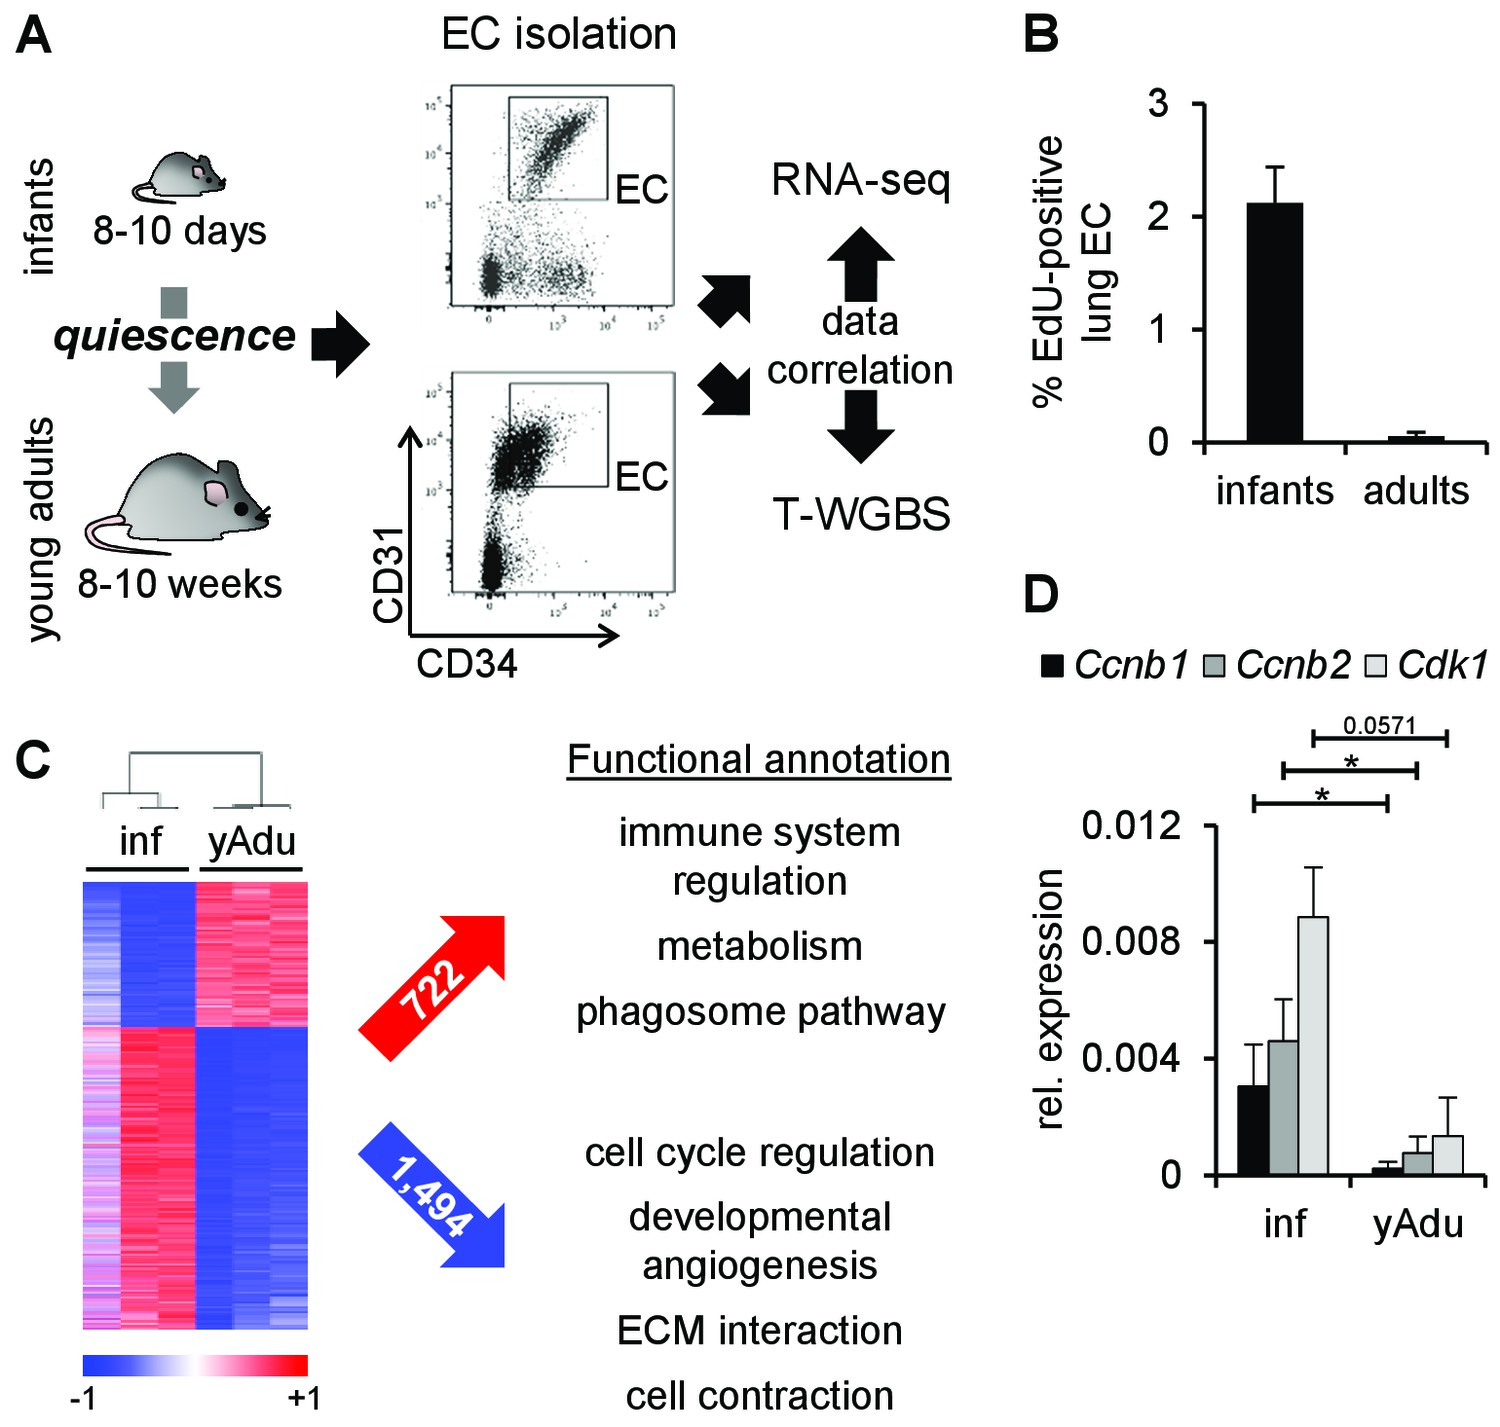
Transcriptomic changes of endothelial cells during acquisition of quiescence.
(A) Scheme depicting the workflow of lung EC isolation by FACS from infant (inf) and young adult (yAdu) mice followed by transcriptome profiling by RNA-sequencing and DNA methylome analysis by tagmentation-based WGBS (T-WGBS). Shown are representative FACS profiles for the two different endothelial cell populations. (B) Analysis of lung EC proliferation in vivo by EdU assay. EdU was injected i.p. and lung EC were analyzed by FACS 17 hr later. n = 3; mean ± SD. (C) Hierarchical clustering of differentially expressed genes and functional annotation by Reactome overlap analysis of the 722 induced and 1,494 repressed genes regulated during the acquisition of EC quiescence. (D) Validation of the differential expression of cell cycle genes in infant and young adult lung EC using qPCR. n ≥ 3; mean ± SD; *p<0.05; Mann-Whitney Test.
-
Figure 1—source data 1
Functionally enriched KEGG pathways Identified for (i) seeds in the EC maturation network, (ii) proteins in the EC maturation network as well as (iii) for all 3223 seeds.
For each pathway the adjusted p‐value and the number of proteins, that is, count, are specified.
- https://doi.org/10.7554/eLife.34423.006
-
Figure 1—source data 2
Cell cycle genes regulated in EC during the transition to a quiescent state.
The highlighted genes were selected for validation by qPCR (see Figure 1D and Figure 1 – figure supplement 1E).
- https://doi.org/10.7554/eLife.34423.007
Figure 1—figure supplement 1
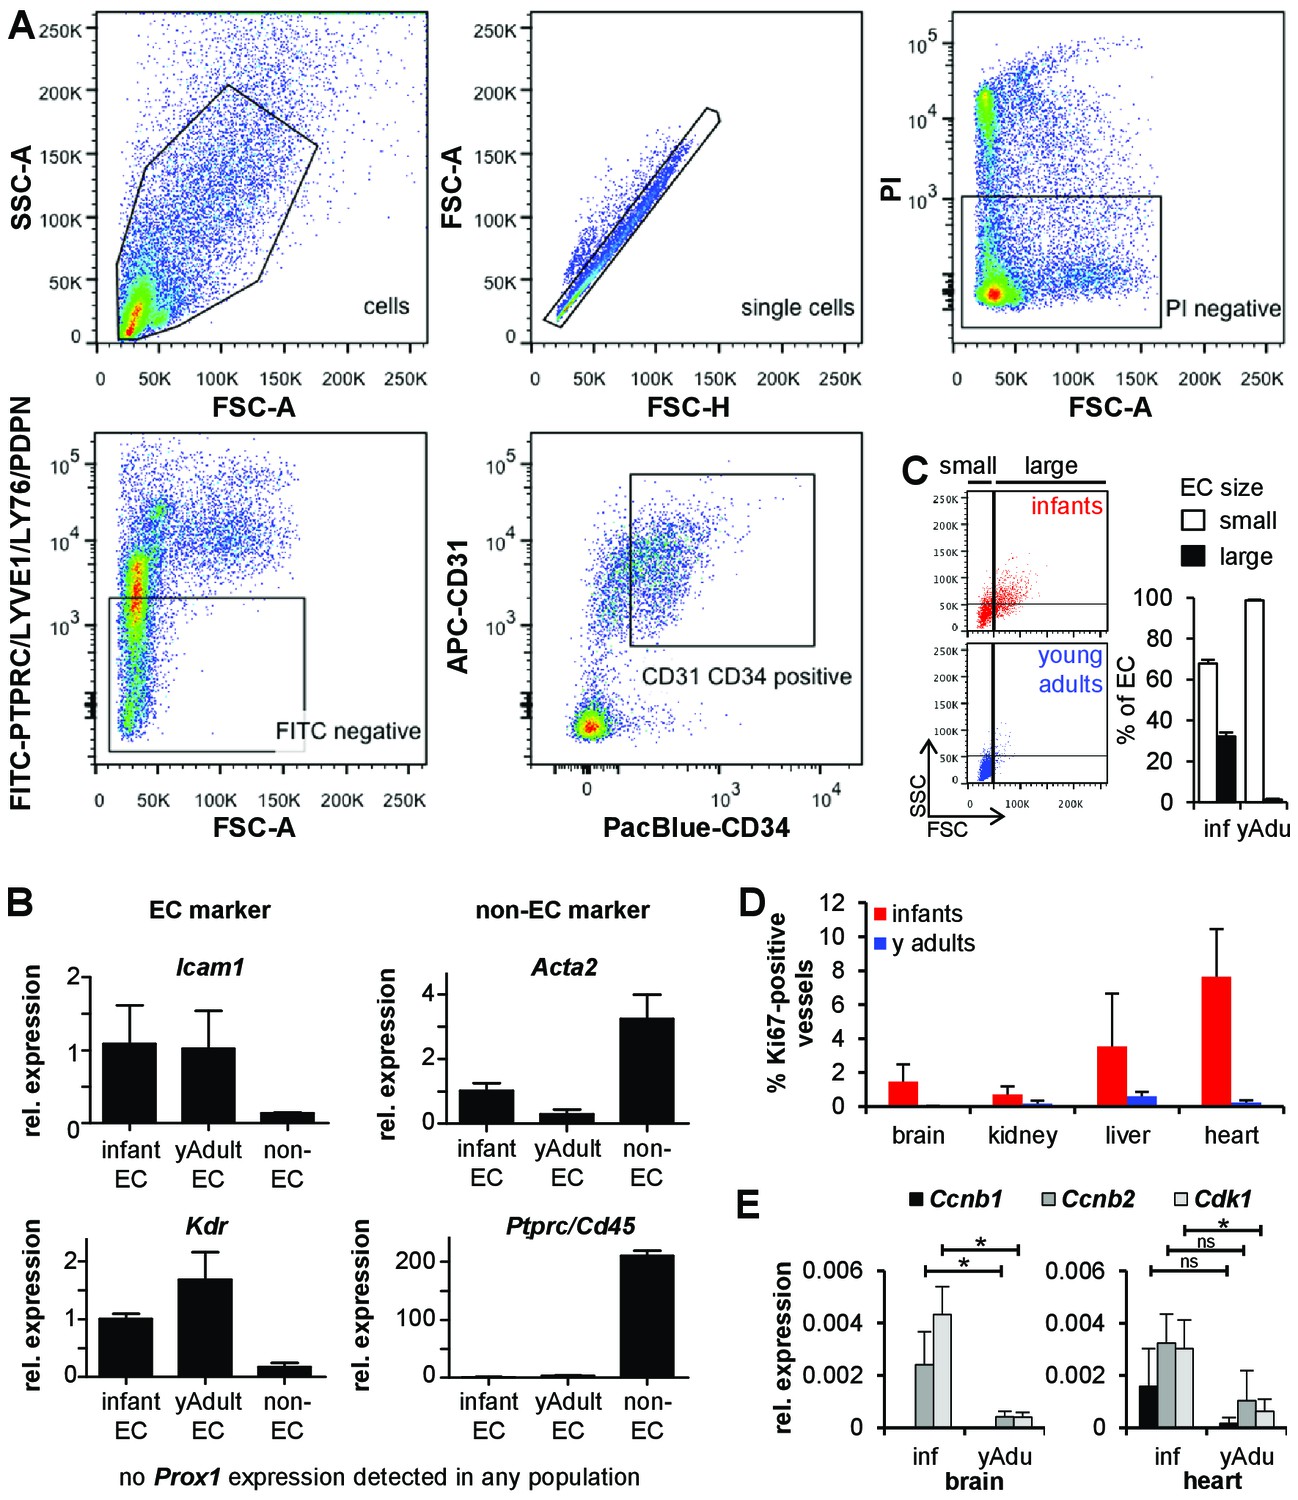
Characterization of endothelial cell populations.
(A) Sorting strategy for lung EC isolation. PTPRC‐LYVE1‐LY76‐PDPN‐PI‐CD31+CD34+ cells were used for transcriptome and methylome analysis. Propidium iodide (PI) was used to discriminate between live (PI‐) and dead (PI+) cells. (B) Validation of the sorted EC populations by marker gene expression analysis using qPCR. n = 3; mean ± SD. (C) Size analysis of EC populations (CD31+CD34+) isolated from infant and young adult mice. (D) Analysis of EC proliferation from brain, kidney, liver and heart by Ki67 and Cd31 co-staining. n ≥ 5; mean ± SD. (E) Validation of the differential expression of cell cycle genes in infant and young adult brain and heart EC using qPCR. n ≥ 3; mean ± SD; *p<0.05; Mann-Whitney Test.
Figure 1—figure supplement 2
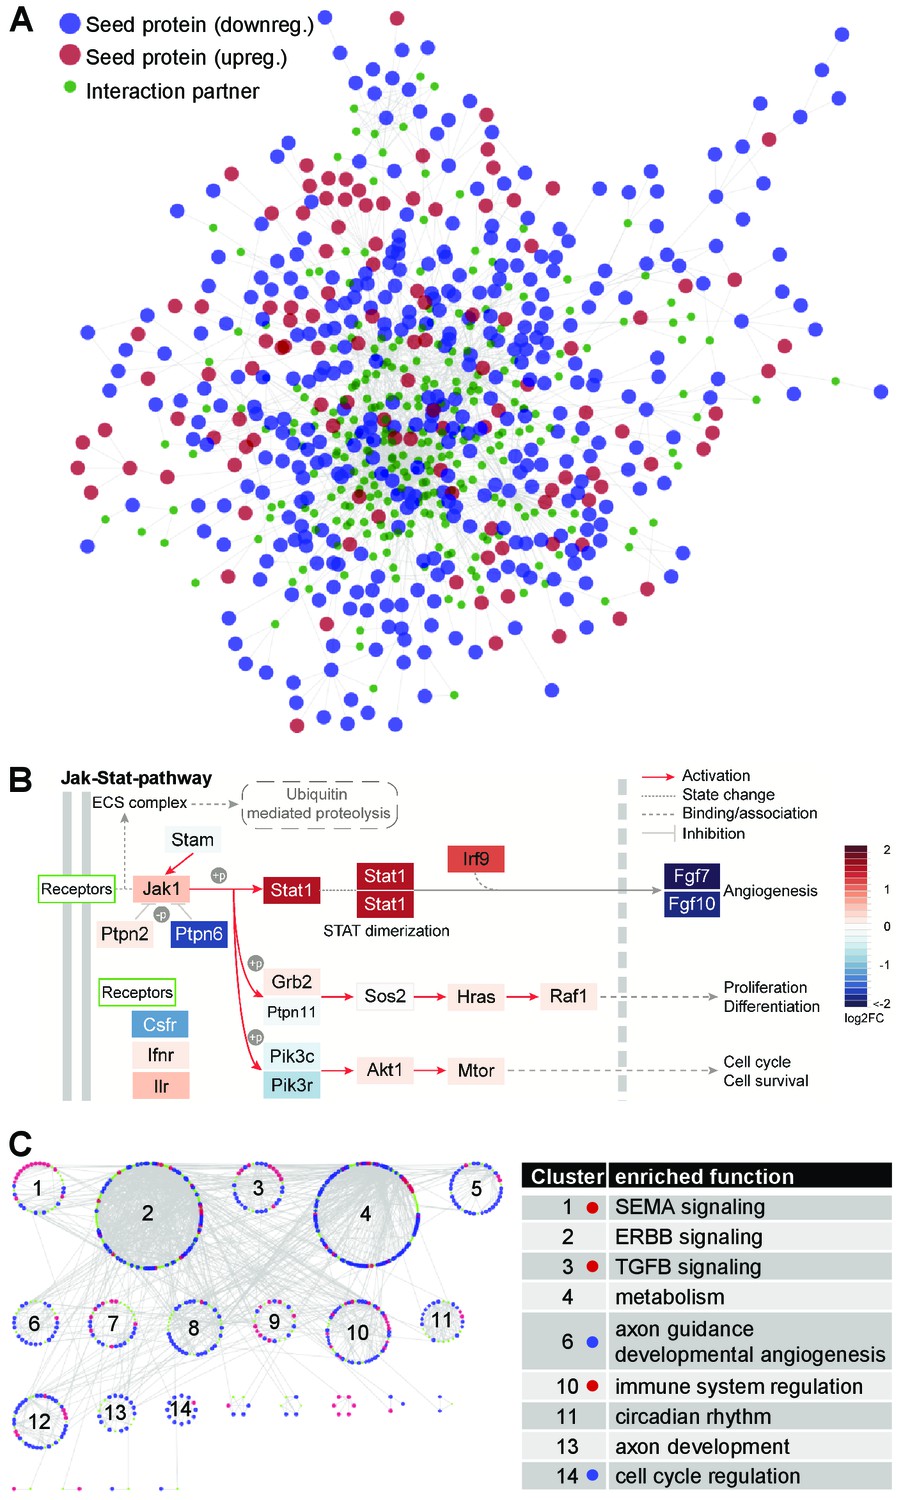
The quiescence-dependent interactome of lung EC.
(A) The EC quiescence interactome. EC quiescence-specific network generated from differentially regulated ‘seed’ genes (p<0.05). By means of the DIAMOnD algorithm (Ghiassian et al., 2015), a network was created starting from this set of proteins by integrating related proteins based on their topological relevance. The final network contained 745 proteins and 1661 interactions, including 484 seed gene products (57.3%). Seeds are shown as big circles (red and blue indicating up and down regulation, respectively), while candidate maturation-related proteins are shown as small green circles. (B) Functional enrichment analysis of the EC quiescence interactome led to the identification of JAK-STAT signaling being highly enriched (p=5.7×10⁻¹¹). Shown by color-code is the quiescence-dependent gene regulation of individual JAK-STAT pathway members (red, upregulated; blue, downregulated). (C) Clustering of the quiescence-dependent interactome identified densely connected gene communities (left). Functional enrichment analysis associated the clusters with biological meaning (right). Color-code as in (A). Dots in table indicate significant overrepresentation of up- (red) or down- (blue) regulated seed proteins.
Figure 2 with 1 supplement
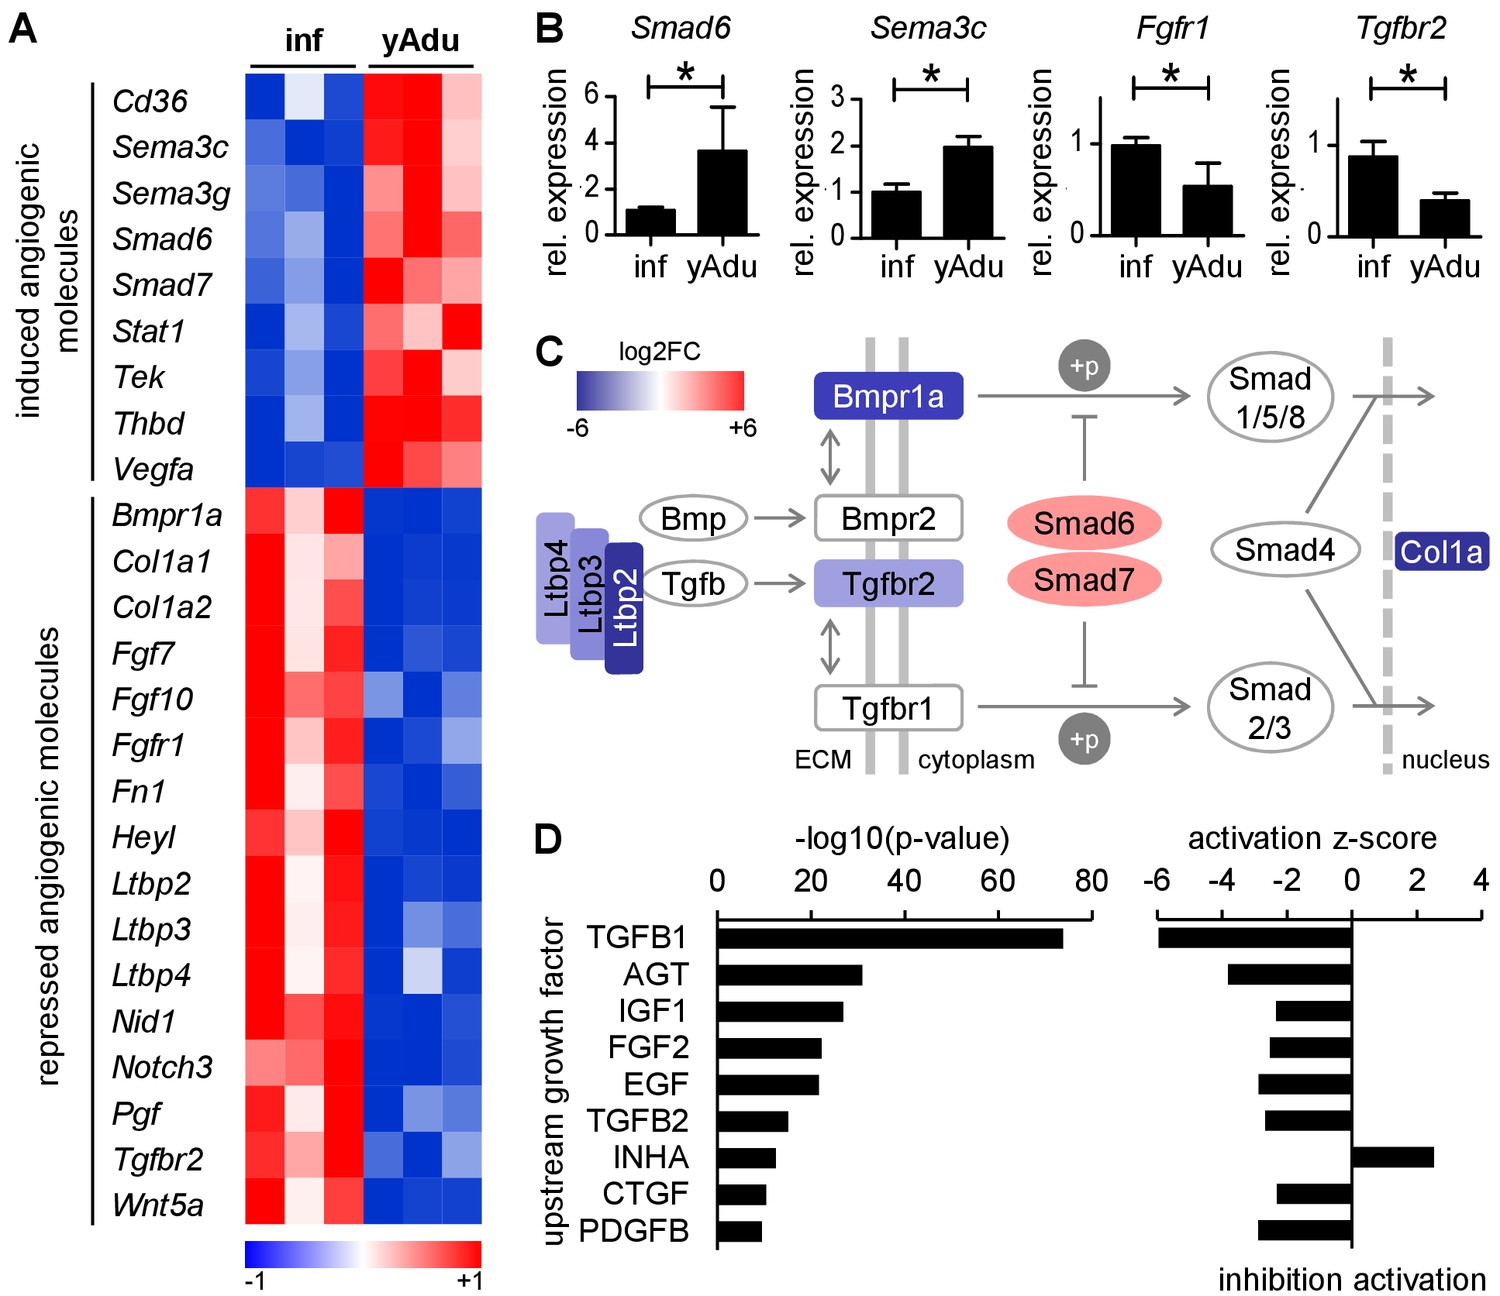
TGFß family signaling is inhibited in quiescent EC.
(A) Heatmap depicting the expression of anti- and pro-angiogenic molecules during the acquisition of vascular quiescence. Depicted are significantly regulated genes (p<0.05) that are differentially expressed by at least 1.75 fold. (B) Validation of the expression pattern of anti- and pro-angiogenic molecules in lung EC by qPCR in independent biological samples. n ≥ 3; mean ±SD; *p<0.05; Mann-Whitney Test. (C) Schematic representation of the regulation of TGFβ family signaling molecules during acquisition of vascular quiescence emphasizing the overall inhibition of this pathway. Shown by color-code is the gene regulation of individual TGFβ family pathway members (red, upregulated; blue, downregulated; log2FC: log2 fold change). Ltbp: latent TGF-beta binding protein; Bmpr1a: Bone Morphogenetic Protein Receptor Type 1A/Alk3; Bmpr2: Bone Morphogenetic Protein Receptor Type 2; Tgfbr2: Transforming Growth Factor Beta Receptor 2; Tgfbr1: Transforming Growth Factor Beta Receptor 1/Alk5; Smad6 and Smad7: inhibitory SMADs; Smad1/5/8 and Smad2/3: receptor-regulated SMADs; Smad4: Co-SMAD; Col1a: TGFß target gene Collagen type I alpha. (D) Upstream growth factor analysis with activation state prediction of all differentially expressed genes during transition to EC quiescence. Depicted are the transformed (-log10) p-value and the predicted activation state (z-score) of the upstream growth factor according to Ingenuity Pathway Analysis. See methods section for further details. The following figure supplements are available for Figure 2.
Figure 2—figure supplement 1
Analysis of vascular quiescence-dependent gene expression.
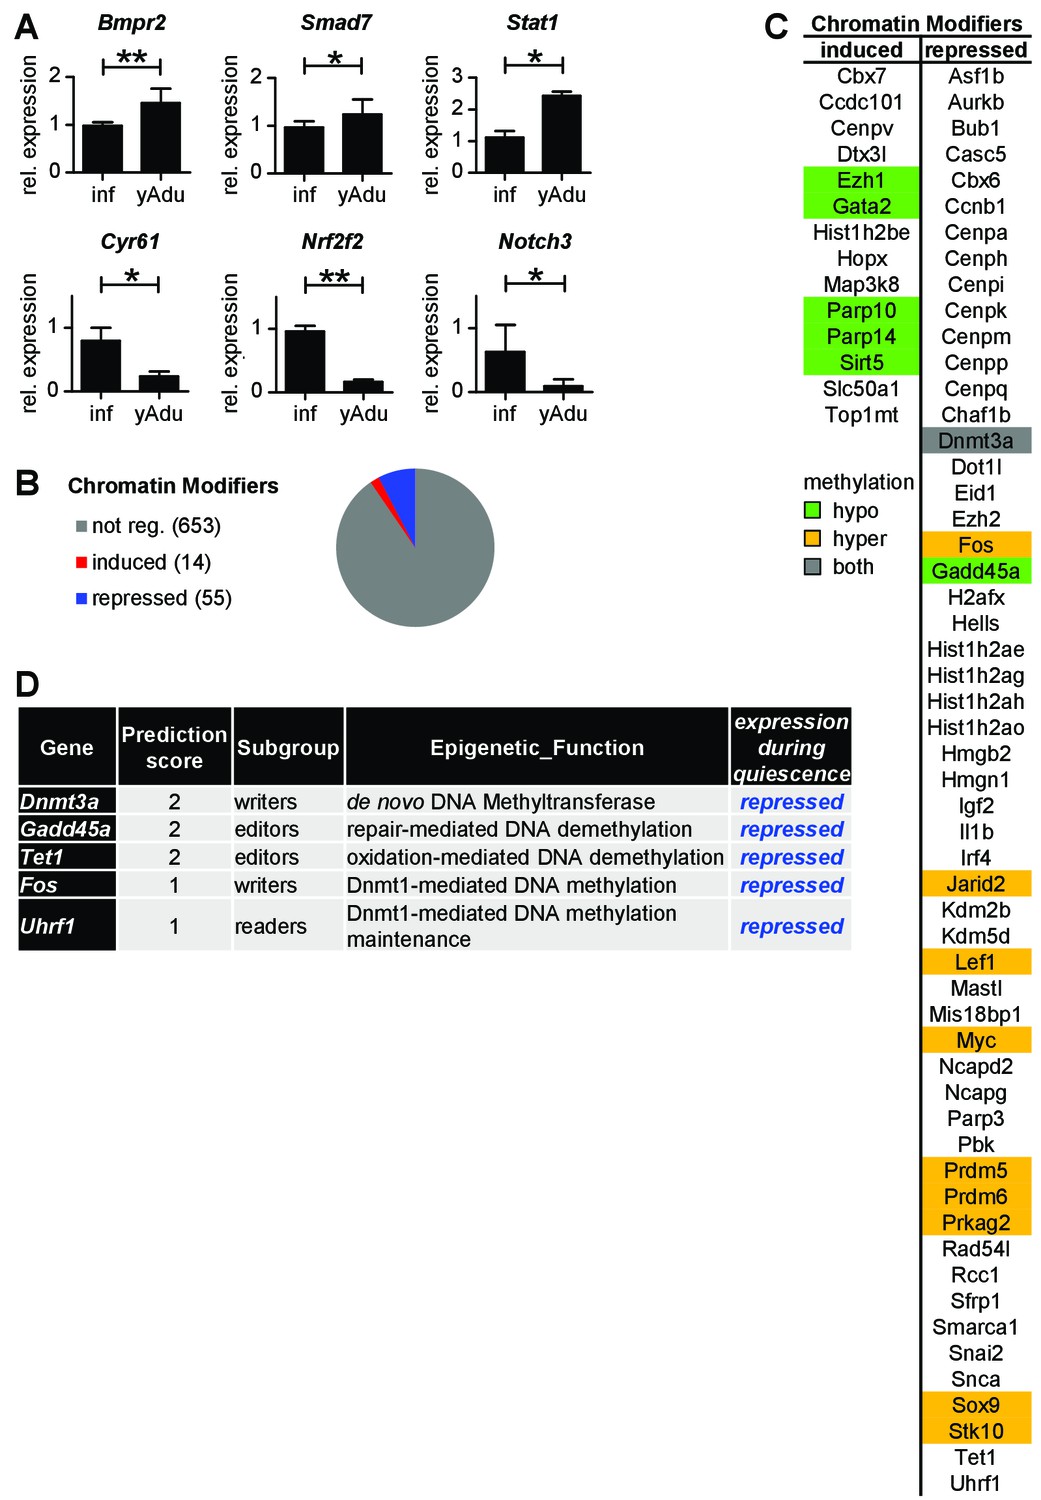
(A) Validation of the expression pattern of anti- and pro-angiogenic molecules in lung EC by qPCR in independent biological samples. n ≥ 3; mean ±SD; *p<0.05; Mann-Whitney Test. (B) Quiescence-dependent expression analysis of chromatin modifying enzymes. (C) Differentially expressed chromatin modifiers as identified by RNA-seq analysis. (D) Quiescence-dependent expression analysis of chromatin modifying enzymes with focus on DNA methylation modifiers.
Figure 3 with 1 supplement
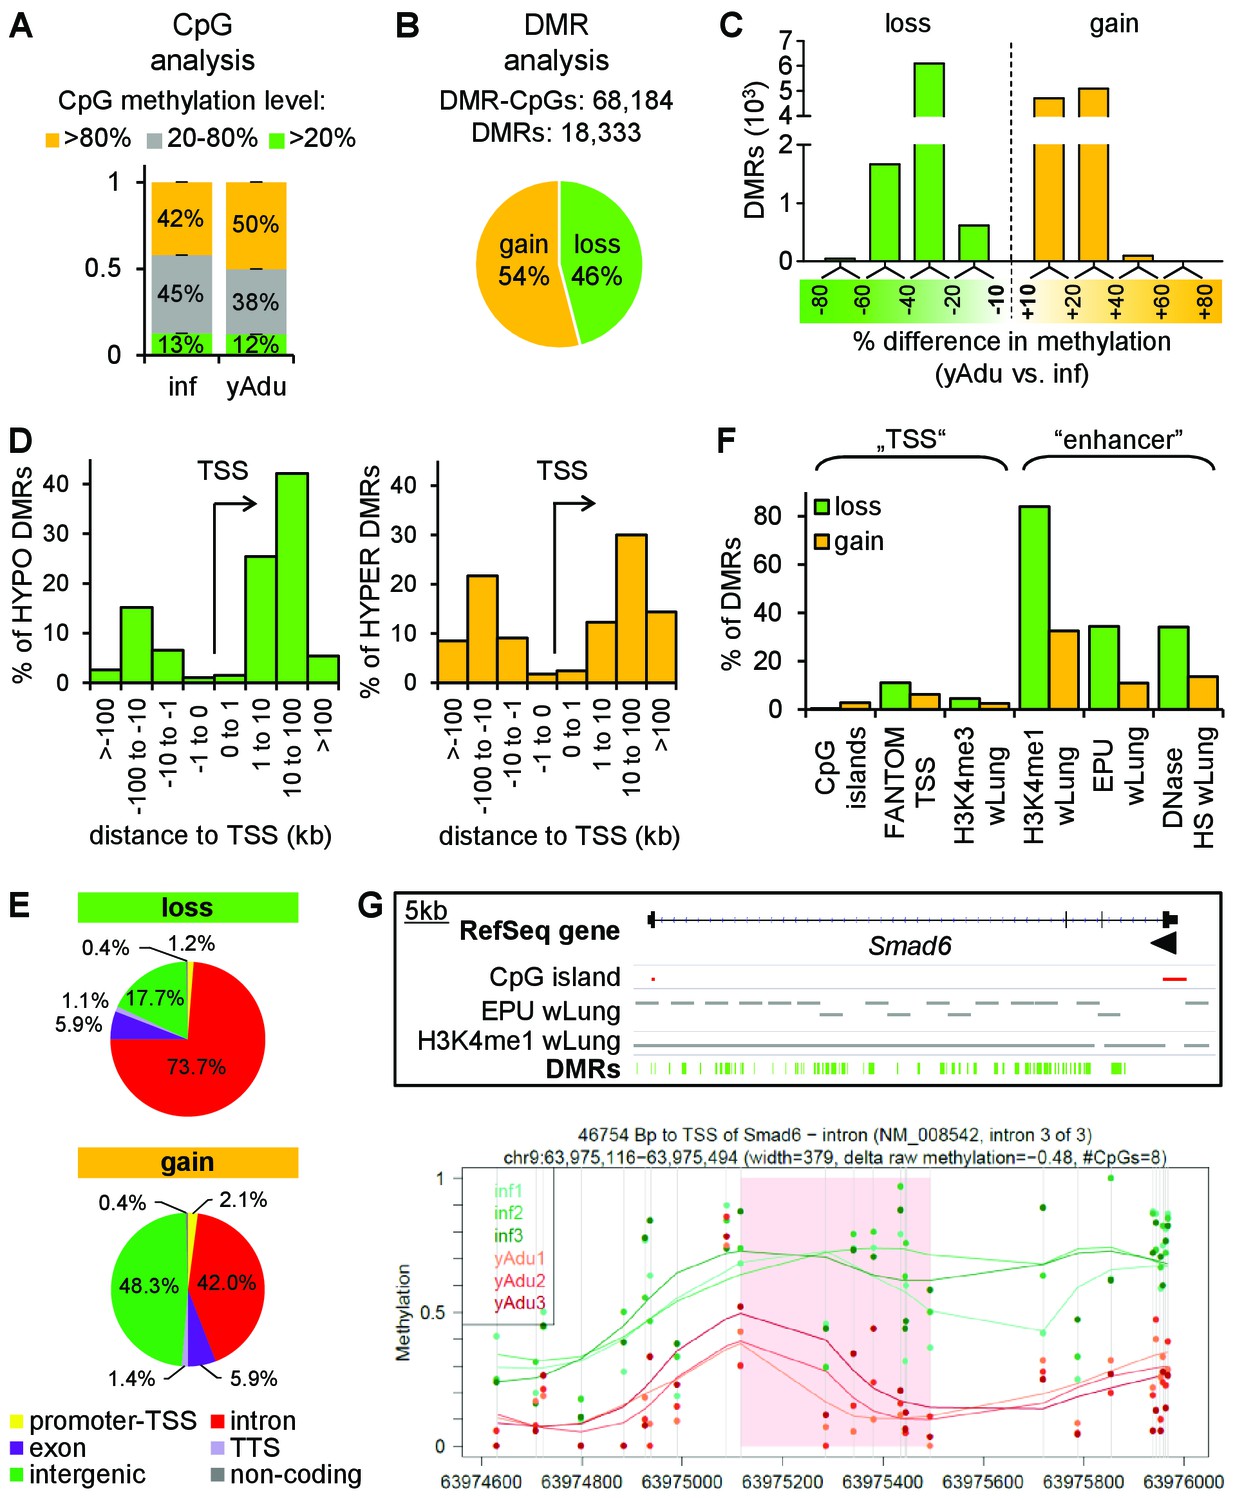
Vascular quiescence is accompanied by a prominent loss of DNA methylation at intronic enhancer regions.
(A, B) Data of tagmentation-based WGBS of infant and young adult lung EC were analyzed on the level of single CpGs (A) and differentially methylated regions (DMRs) (B). (C) Distribution of the methylation difference (in %) of DMRs during the acquisition of EC quiescence. Depicted are all changes ≥ 10% between young adult and infant EC. (D) Localization of hypo- (left) and hyper- (right) methylated DMRs relative to the transcription start site (TSS) in kb. (E) Genomic location of the hypo- (top) and hyper- (bottom) methylated DMRs. TTS = transcription termination site. (F) Overlap analysis of DMRs with known regulatory DNA elements of the lung. wLung = whole lung tissue, EPU = enhancer promoter units, HS = hypersensitivity. (G) Top: Genome browser view of the Smad6 gene locus. Green bars represent the DMRs showing significant loss of methylation during the acquisition of vascular quiescence. Arrowhead represents the transcription start site. Grey bars represent putative enhancer regions previously defined. Bottom: Detailed view of one representative DMR (transparent red) showing the raw (dots) and the smoothed (lines) methylation data of EC from three infant (green) and three young adult (red) mice. CpGs are represented by vertical lines. The following figure supplements are available for Figure 3.
Figure 3—figure supplement 1
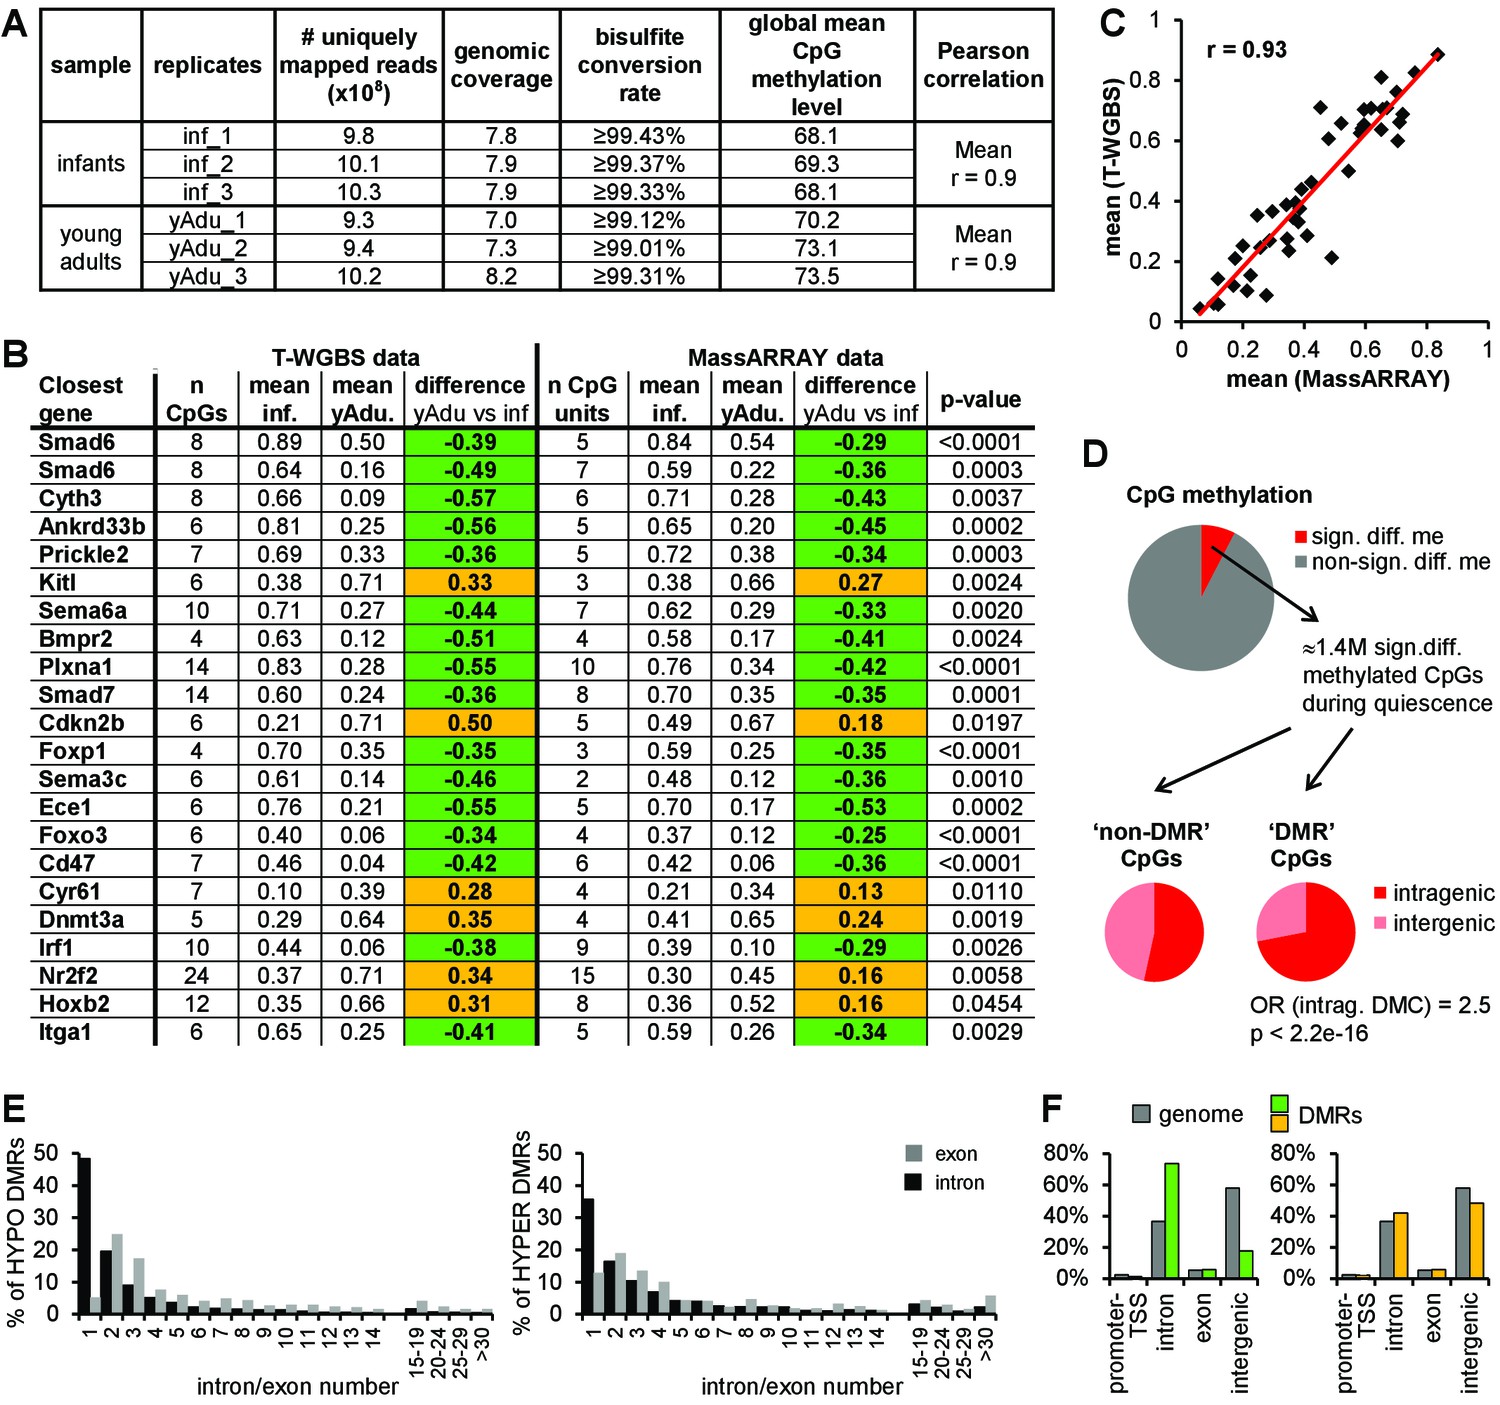
DNA methylation profiling of lung EC during transition to vascular quiescence.
(A) Tagmentation-based WGBS data QC. (B) Validation of 22 DMRs identified by T-WGBS by MassARRAY. The difference in methylation is highlighted in green (loss of methylation during vessel maturation) or orange (gain of methylation during vessel maturation). (C) Correlation of mean methylation per region of T-WGBS and MassARRAY data. (D) Genomic distribution of differentially methylated CpGs external (’non-DMR’ CpGs) and within (‘DMR’ CpGs) DMRs. OR = odds ratio, Fisher's Exact Test. (E) Detailed analysis of intragenic DMRs concerning exon/intron location. (F) Distribution of the loss (green) and gain (yellow) of methylation DMRs compared to the genomic distribution.
Figure 4 with 1 supplement
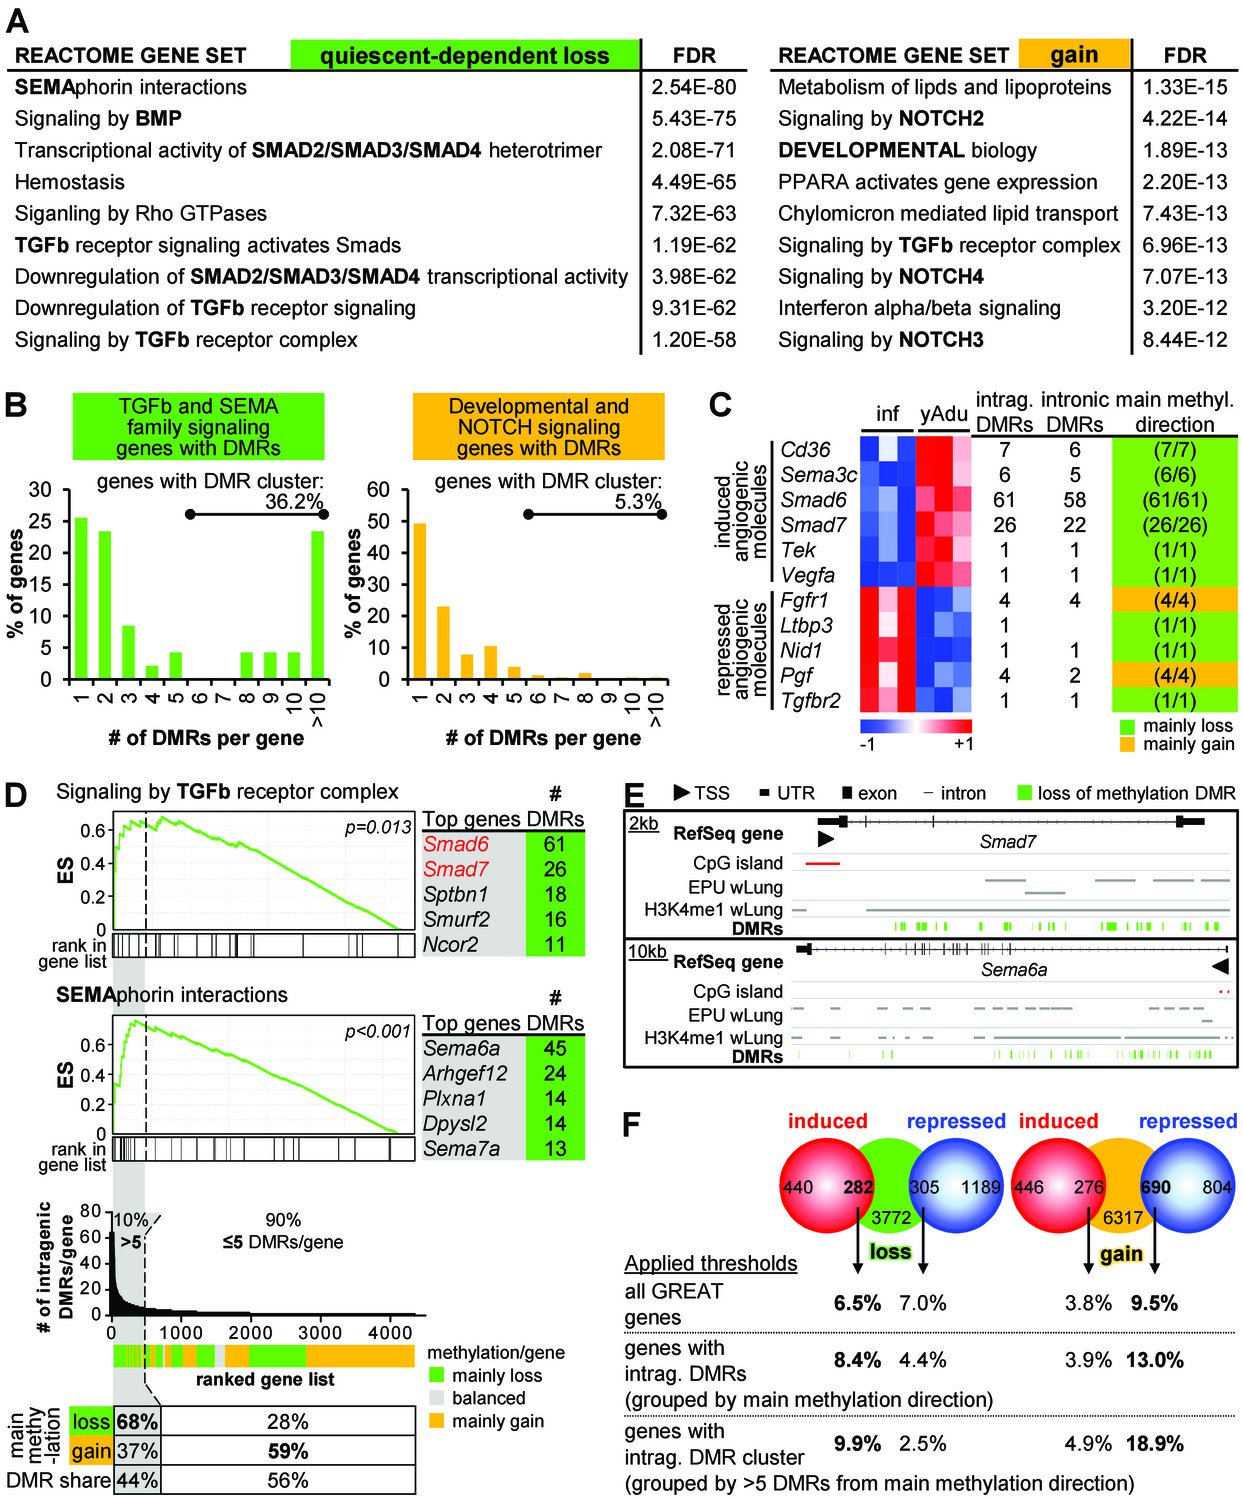
Clustering of loss of methylation DMRs in genes of TGFβ and semaphorin signaling.
(A) Functional annotation of genes next to loss of methylation DMRs by the GREAT tool. Listed are the top Reactome gene sets according to the FDR value (sorted in ascending order). (B) Distribution of DMR number/gene (with percentage of genes containing DMR clusters). (C) Characteristics of differentially expressed angiogenic molecules during vascular quiescence that were also differentially methylated (see Figure 2A). (D) Ranking of genes according to the number of intragenic DMRs. The subset of genes containing >5 DMRs (=DMR cluster) is highlighted in grey. Top: Enrichment analysis of the ranked list of genes demonstrated an overrepresentation of semaphorin and TGFβ signaling genes among the genes containing DMR cluster. Red genes: expression significantly induced >1.75 fold, p<0.05. ES = enrichment score. Bottom: Methylation direction and DMR distribution among genes with >5 or≤5 DMRs/gene, respectively. (E) Genome browser views of gene loci with large DMR clusters (Smad7, Sema6a). Putative enhancer regions are shown as grey bars (EPU = enhancer promoter units; wLung = whole lung tissue). (F) Direct correlation of significantly differentially expressed (red and blue circles) and methylated (green and orange circles) genes applying different thresholds to the number of DMRs per gene: no limitations, only genes with intragenic DMRs and only genes with DMR cluster. Numbers in circles represent the overlap without thresholding the number of DMRs. Percentages refer to the fraction of differentially methylated genes that overlap with differentially expressed genes. The following figure supplements are available for Figure 4.
Figure 4—figure supplement 1
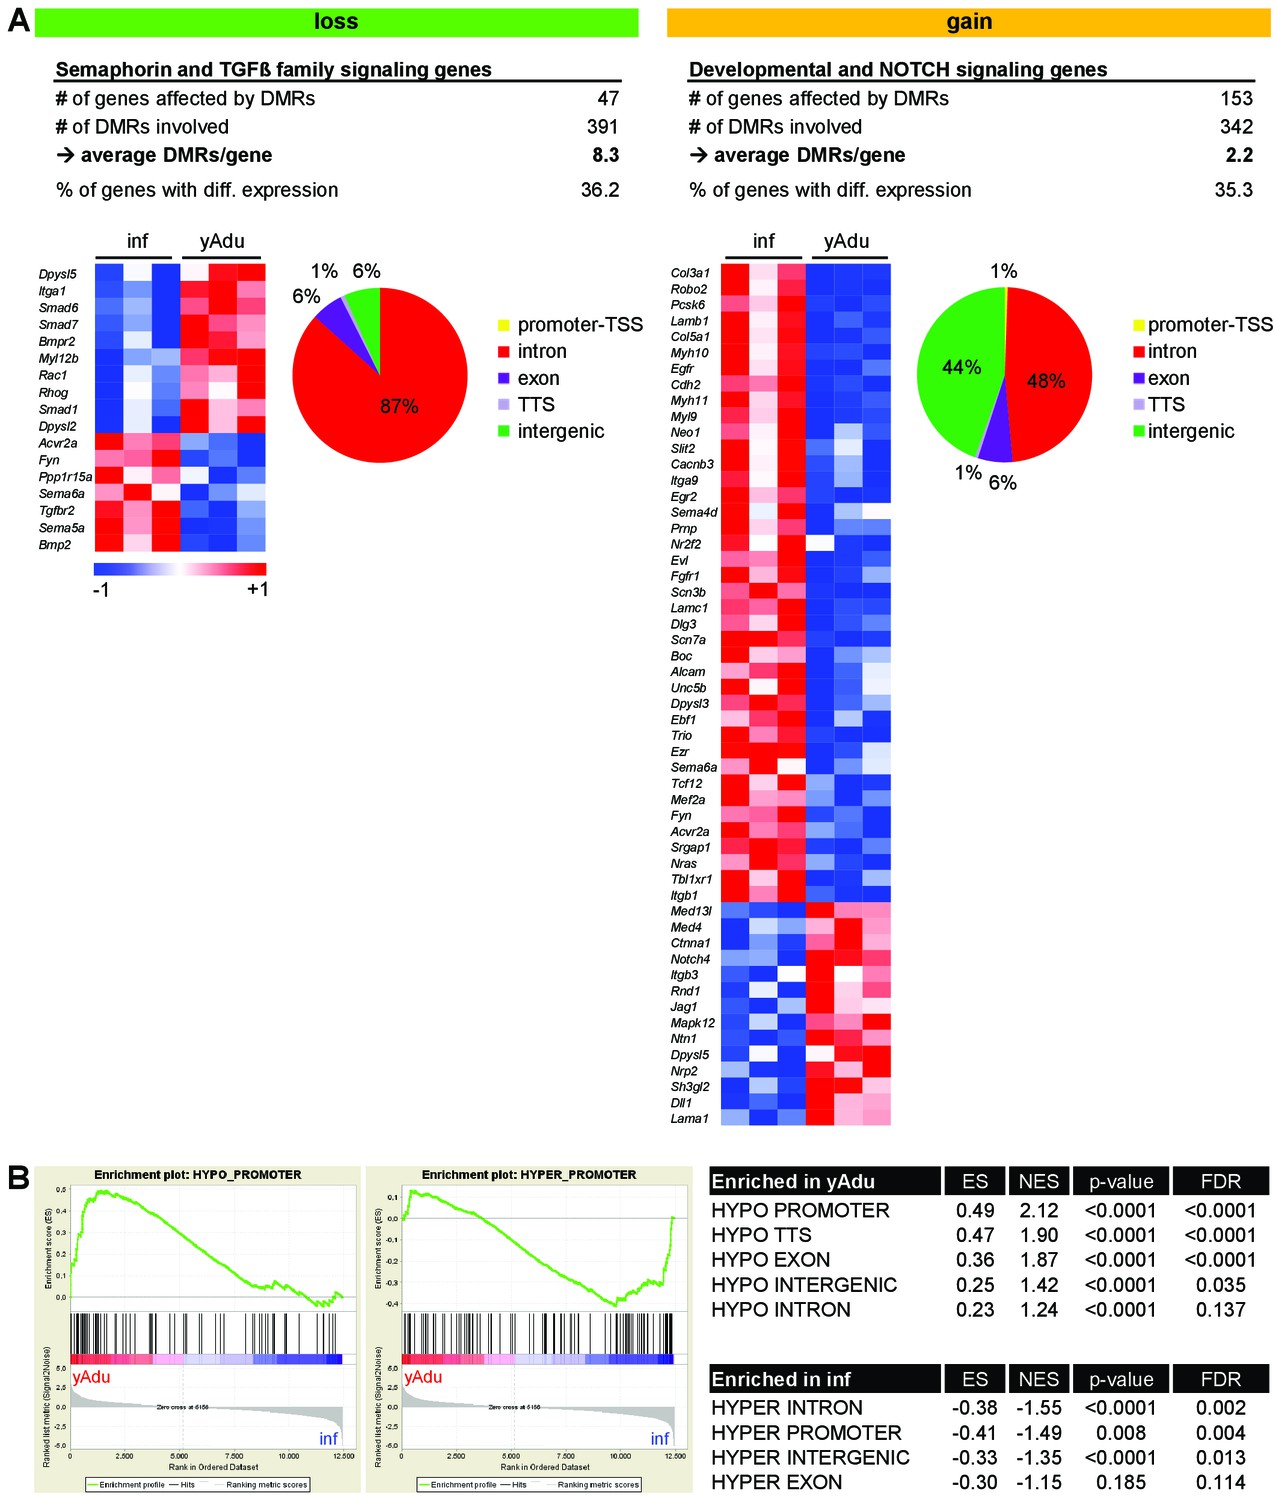
Correlation of gene expression and DNA methylation profiles of endothelial cell during the acquisition of quiescence.
(A) Characterization of DMRs next to genes involved in semaphorin, TGFß family, NOTCH and developmental signaling: Heatmap of gene expression data and the genomic location of DMRs. (B) Gene set enrichment analysis (GSEA) with gene sets defined by DMR location and methylation direction. ES = enrichment score, NES = normalized enrichment score, FDR = false discovery rate.
Figure 5 with 2 supplements
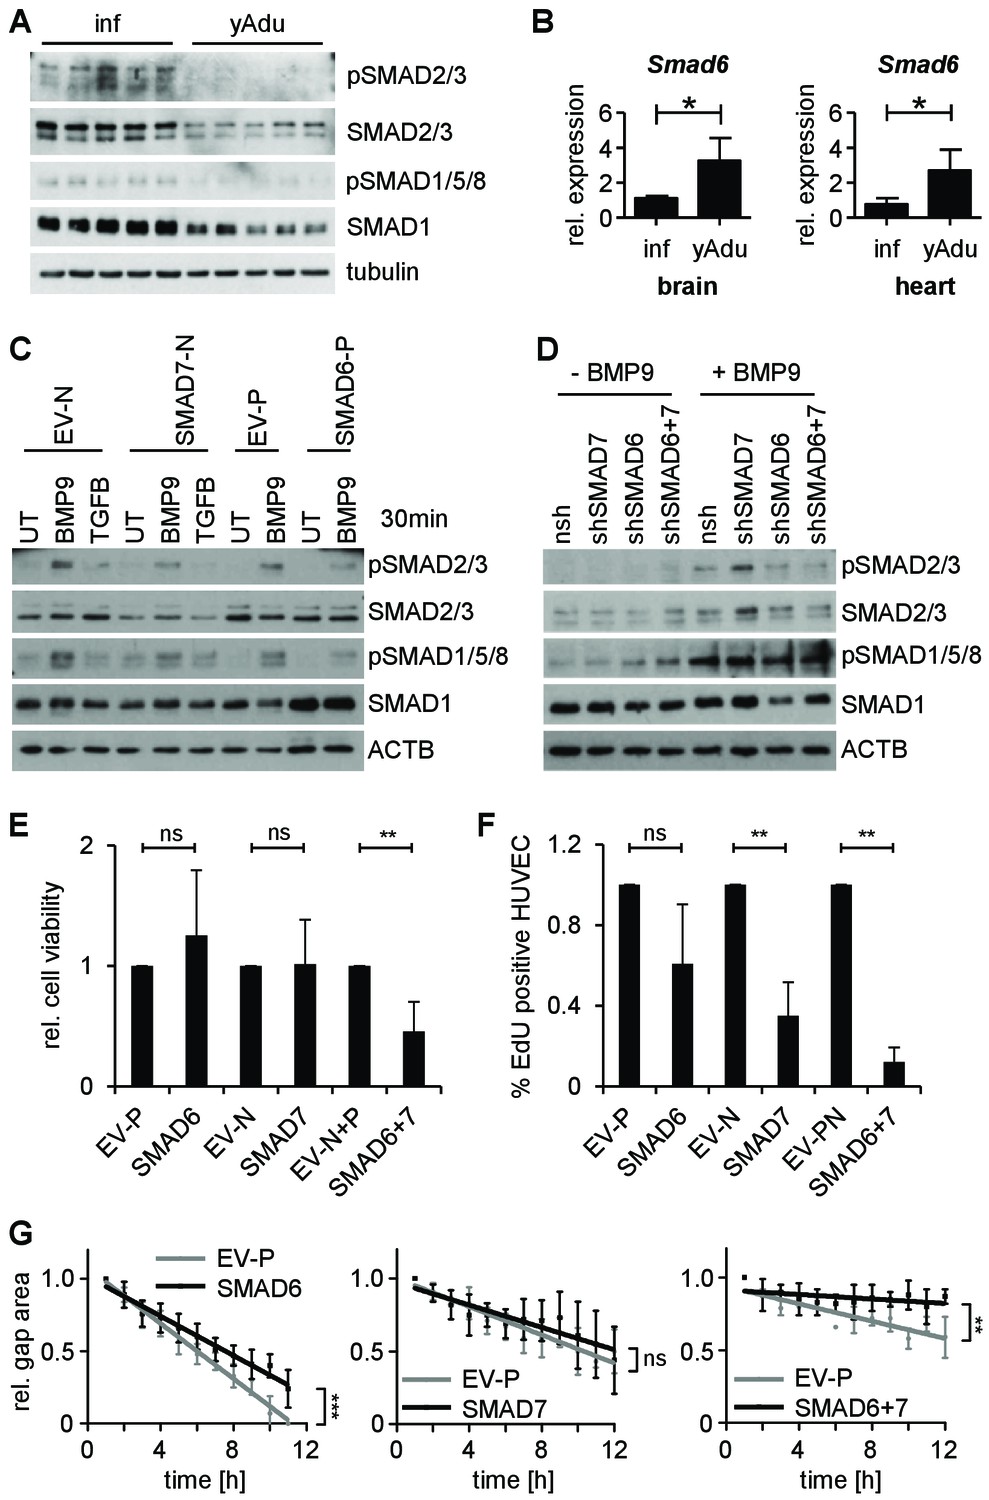
SMAD6 and SMAD7 control endothelial quiescence.
(A) Immunoblot showing the analysis of TGFβ family signaling in whole lung lysates of infant (n = 5) and young adult (n = 5) mice. (B) Validation of Smad6 induction during maturation in the brain and the heart by qPCR. n = 4; mean ±SD; *p<0.05; Mann-Whitney Test. (C,D) Immunoblots showing the analysis of TGFβ family signaling in HUVEC stably expressing (C) or with silenced (D) SMAD6 or SMAD7. UT = untreated, nsh = non silencing shRNA. (E) Analysis of cell viability by MTT assay. ns = non significant; **p<0.01; unpaired t-test. (F) Analysis of HUVEC proliferation by EdU incorporation assay (4 hr) followed by FACS analysis. n ≥ 3; ns = non significant; **p<0.01; unpaired t-test. (G) Analysis of HUVEC migration by lateral scratch wound assay. The gap was measured every hour. EV = empty vector, N/p=neomycin/puromycin resistance. ns = non significant; **p<0.01; ***p<0.001; Linear Regression Analysis. The following figure supplements are available for Figure 5.
Figure 5—figure supplement 1
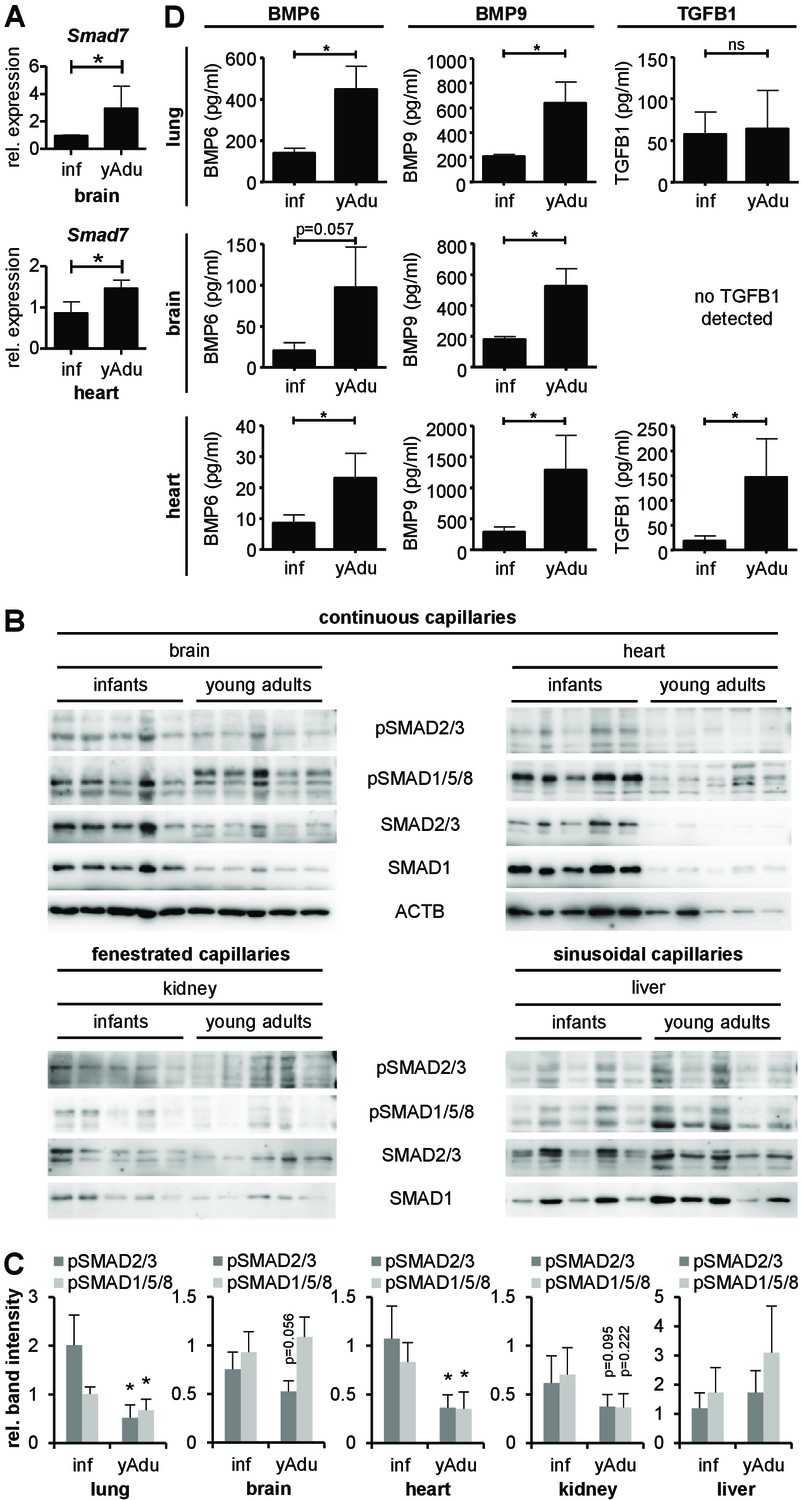
TGFß family signaling in different organs of infant and young adult mice.
(A) Validation of Smad7 induction during vessel maturation in brain and heart by qPCR. n = 4; mean ±SD; *p<0.05; Mann-Whitney Test. (B) Immunoblot showing the analysis of TGFβ family signaling in whole brain, heart, kidney and liver lysates of infant (n = 5) and young adult (n = 5) mice. (C) Quantification of immunoblots showing pSMAD2/3 and pSMAD1/5/8 level in different tissues. n = 5; mean ±SD; *p<0.05; Mann-Whitney Test. (D) BMP6, BMP9 and TGFB1 level measured by ELISA in lung, brain and heart. n = 4; mean ±SD; *p<0.05; Mann-Whitney Test.
Figure 5—figure supplement 2
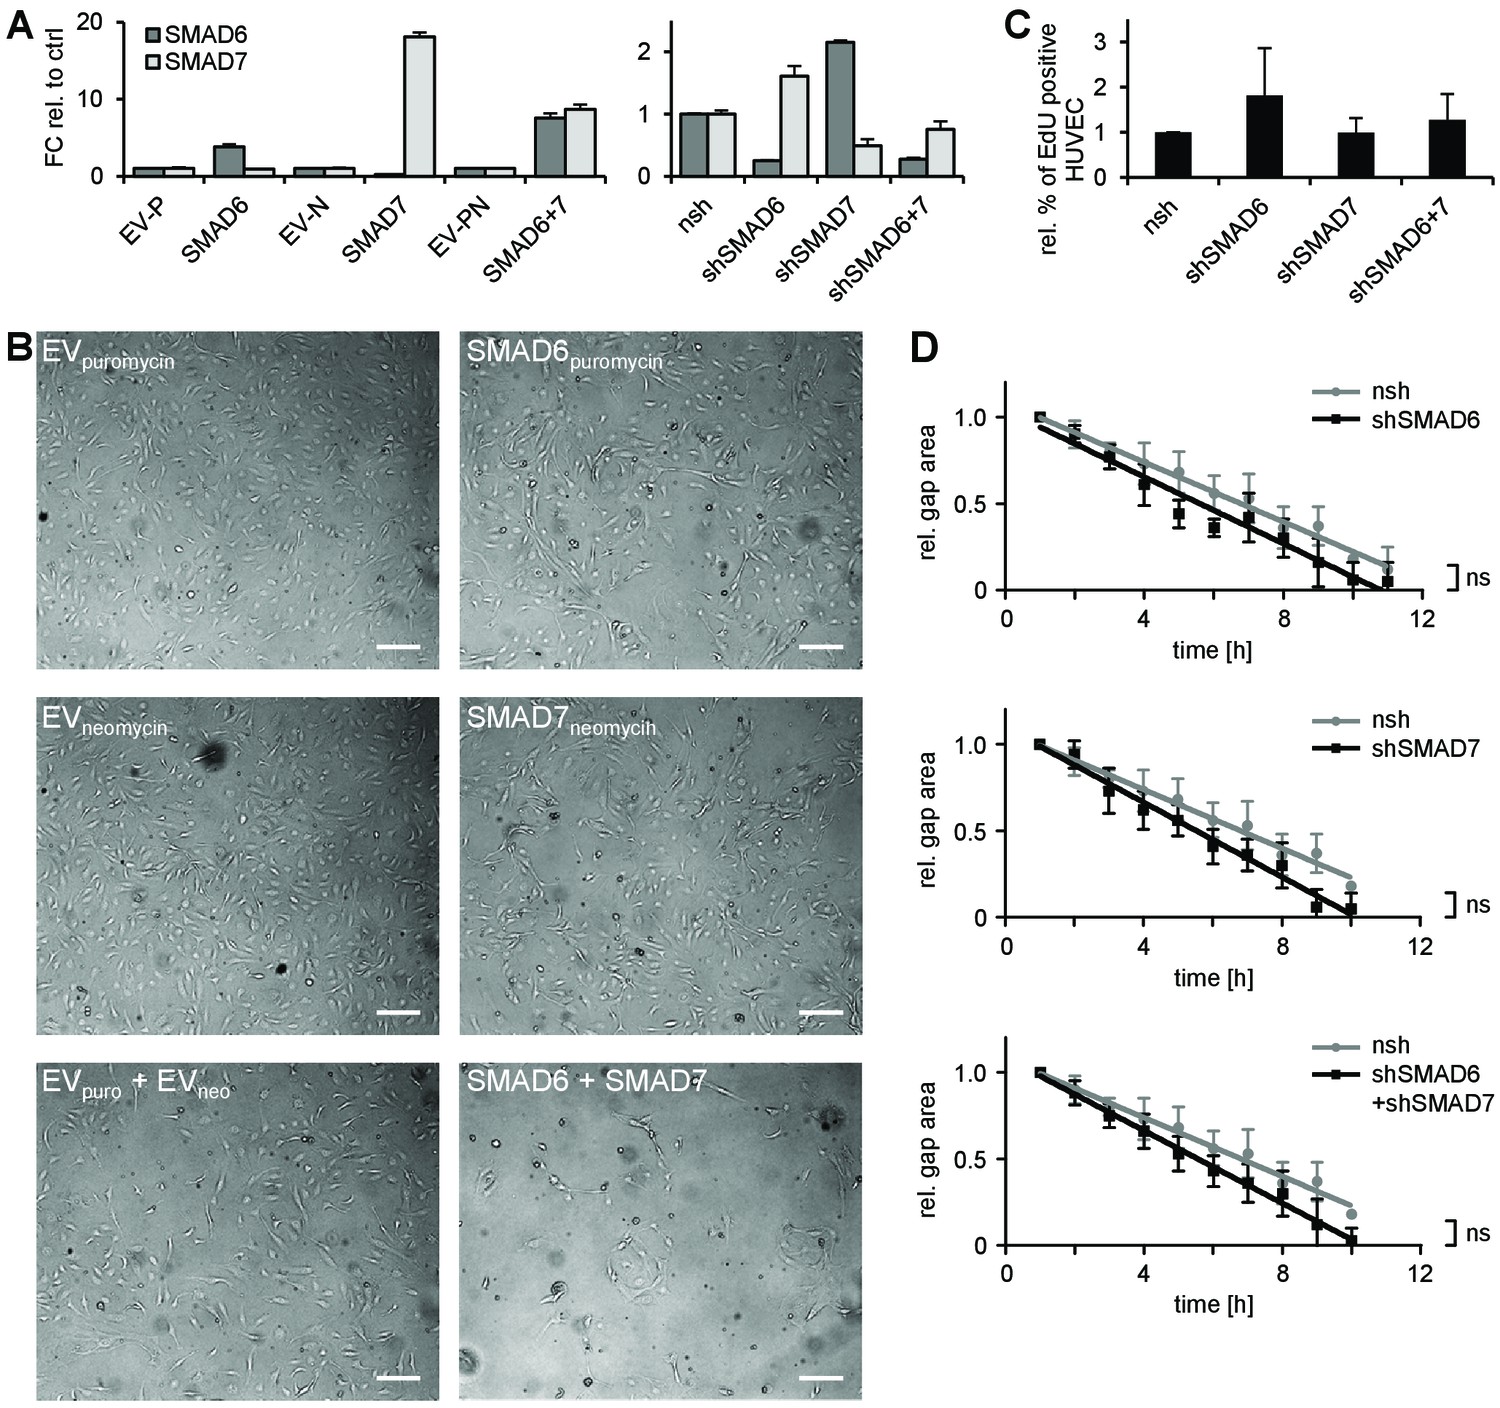
Characterization of the role of SMAD6 and SMAD7 in endothelial cells.
(A) Representative qPCR confirming the enforced expression (left) or silencing (right) of SMAD6 and/or SMAD7 in HUVEC. Mean ±SD. (B) Phenotype of HUVEC overexpressing SMAD6 and/or SMAD7. Scale bar = 50 µm. (C) Analysis of EC proliferation by EdU incorporation assay (4 hr) followed by FACS analysis, n = 5. (D) Analysis of HUVEC migration by lateral scratch assay. The gap was measured once per hour. Mean ±SD; ns = non significant; Linear regression analysis.
Author response image 1
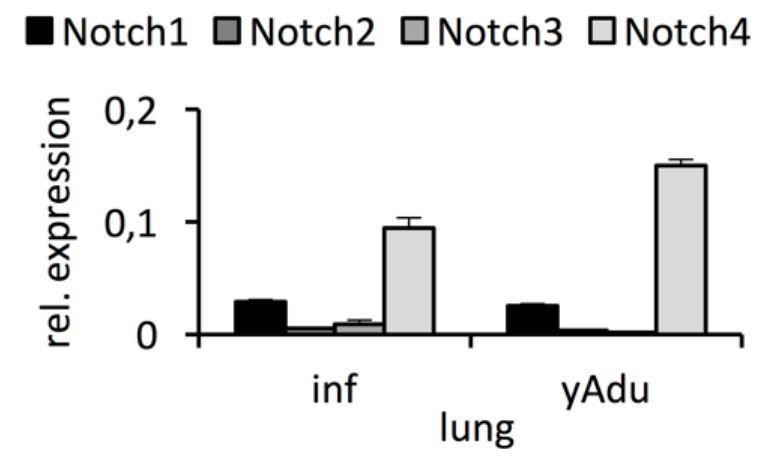
Expression of Notch receptors in lung EC.
qPCR analysis was performed in independent biological samples. n≥3; mean ± SD..
Author response image 2
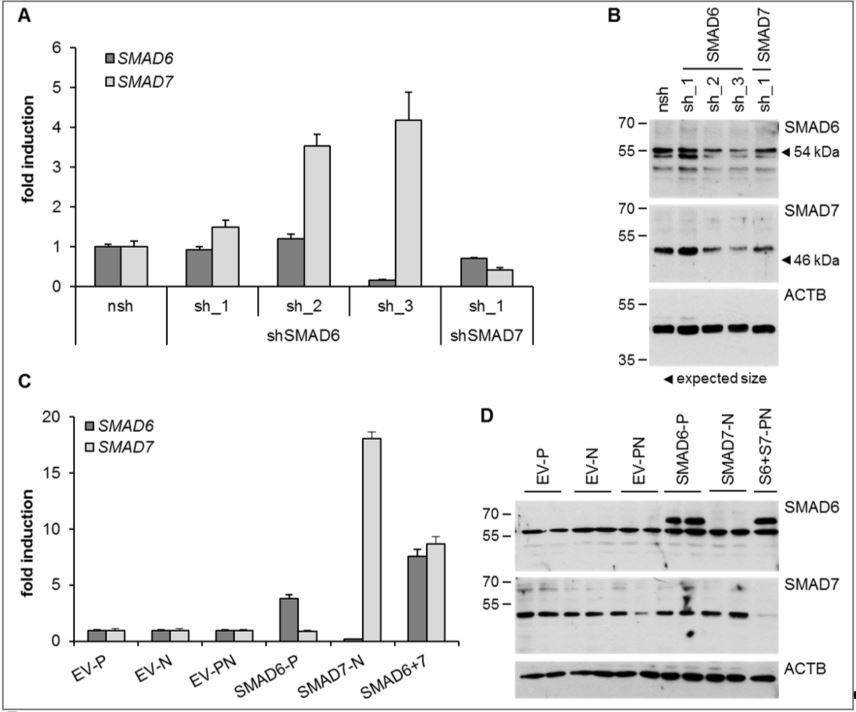
HUVEC were either depleted for (A, B) or overexpressing (C, D) SMAD6 and/or SMAD7.
Both, shRNAs or overexpression constructs were introduced by lentiviral transduction followed by selection with puromycin (P) or neomycin (N). Panel A and C represents Taqman-based qPCR data and panel B and D the corresponding protein expression data from the same treatment replicates. SMAD6 antibody from Life Technologies (PA1-41026), SMAD7 antibody from R&D systems (MAB2029).
Additional files
-
Supplementary file 1
Key resource table.
- https://doi.org/10.7554/eLife.34423.017
-
Transparent reporting form
- https://doi.org/10.7554/eLife.34423.018
Download links
A two-part list of links to download the article, or parts of the article, in various formats.
Downloads (link to download the article as PDF)
Open citations (links to open the citations from this article in various online reference manager services)
Cite this article (links to download the citations from this article in formats compatible with various reference manager tools)
The transcriptomic and epigenetic map of vascular quiescence in the continuous lung endothelium
eLife 7:e34423.
https://doi.org/10.7554/eLife.34423


