Predicting the likelihood and intensity of mosquito infection from sex specific Plasmodium falciparum gametocyte density
- London School of Hygiene and Tropical Medicine, United Kingdom
- Radboud University Medical Center, Netherlands
- Institut de Recherche en Sciences de la Santé, Direction, Burkina Faso
- MIVEGEC (UM-CNRS 5290-IRD 224), France
- University of Science, Techniques and Technologies of Bamako, Mali
- Université de Douala, Cameroon
- University of California, San Francisco, United States
- Centre National de Recherche et de Formation sur le Paludisme, Burkina Faso
- Imperial College London, United Kingdom
Figures
Figure 1 with 1 supplement
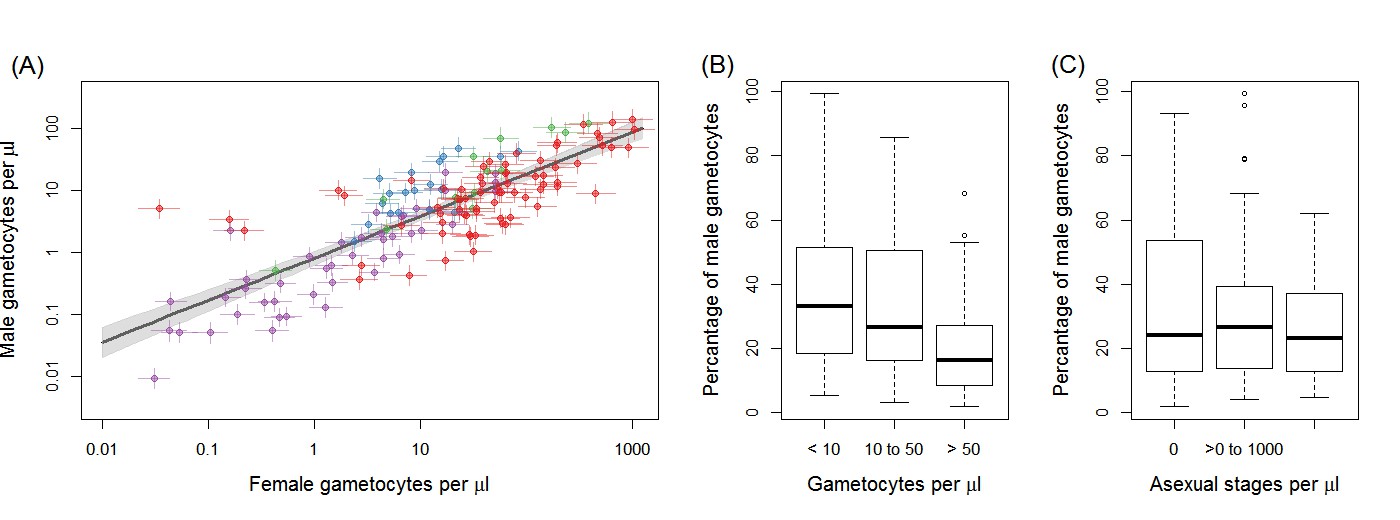
Gametocyte density in natural infections.
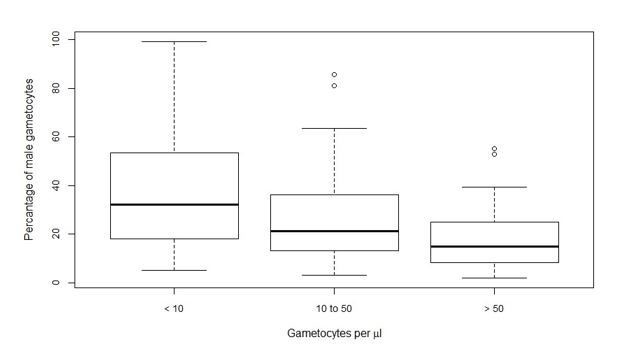
The density of female gametocytes and male gametocytes is presented in panel (A) for samples from Ouelessebougou, Mali (red), Yaoundé, Cameroon (green), Bobo-Dioulasso, Burkina Faso (blue) and Balonghin, Burkina Faso (purple). Female and male gametocyte densities were positively associated (r = 0.79, p<0.001) with the best fit relationship shown by the black solid line (grey shaded area showing 95% the confidence interval around this line). Coloured horizontal and vertical lines indicate Bayesian credible intervals (CIs) around point estimates. The proportion of gametocytes that were male was negatively associated with total gametocyte density (B) but not with asexual parasite density (C). All raw data can be found in Figure 1—source data 1 whilst a description of the relationship modelled in (A) is provided in Figure 1—source data 2. The relationship between gametocyte density as measured by microscopy and PCR is given for each site in Figure 1—figure supplement 1.
-
Figure 1—source data 1
Raw data presented in Figure 1.
- https://doi.org/10.7554/eLife.34463.004
-
Figure 1—source data 2
Description of the statistical model determining the shape of the relationship between female gametocyte density and male gametocyte density.
- https://doi.org/10.7554/eLife.34463.005
Figure 1—figure supplement 1
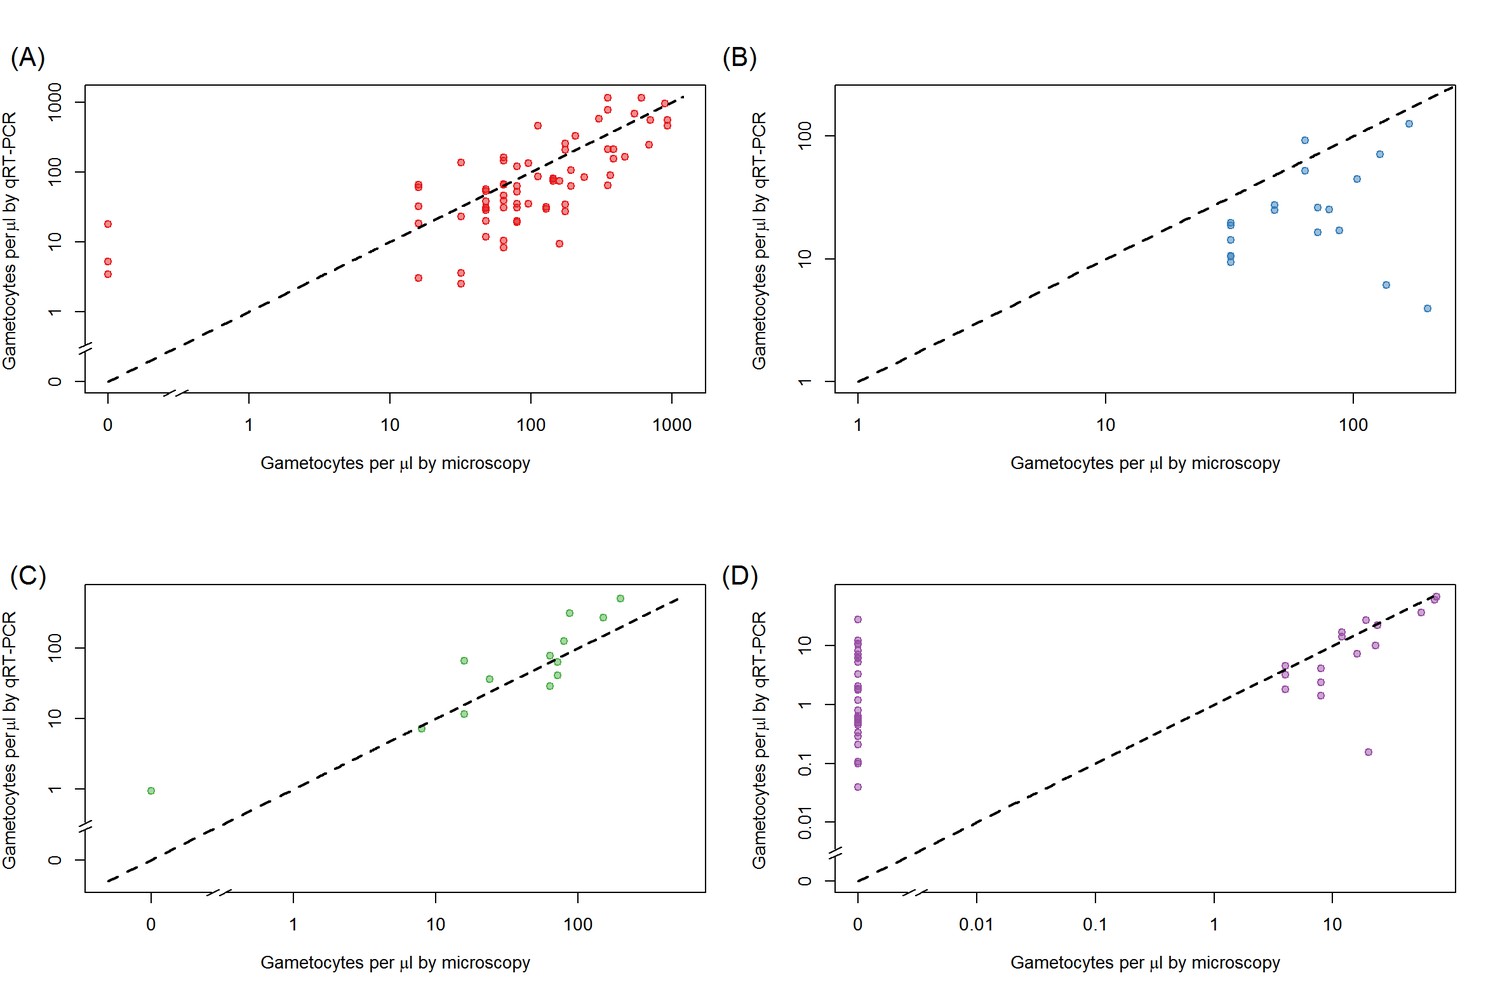
Relationship between total gametocyte densities as measured by microscopy or female gametocyte densities quantified by Pfs25 quantitative reverse-transcriptase PCR.
Relationship is shown separately for each of the different sites, be it (A) Ouelessebougou, Mali (red), (B) Bobo-Dioulasso, Burkina Faso (blue), (C) Yaoundé, Cameroon (green), and (D) Balonghin, Burkina Faso (purple). Black dashed line shows the 1:1 relationship for each site.
Figure 2 with 2 supplements

The relationship between Plasmodium falciparum gametocyte density and the proportion of mosquitoes that develop oocysts.
(A) The association with female gametocyte density. The solid black line indicates the best-fit statistical model with grey shaded 95% Bayesian credible intervals (CI). Infectivity depends on both the density of male and female gametocytes so the figure uses the relationship between male and female gametocyte density defined in Figure 1A to predict overall transmission. Point colour denotes the study from which the observation came (red = Ouelessebougou, Mali, green = Yaoundé, Cameroon, blue = Bobo Dioulasso, Burkina Faso and purple = Balonghin, Burkina Faso) and point size is proportional to the number of mosquitoes dissected. Horizontal and vertical lines indicate 95% CIs around point estimates. To aid clarity the figure shows points and model predictions scaled to the largest dataset (i.e. each site was scaled by the relative infectivity compared to the Mali dataset). A version of the figure without this scaling is shown in Figure 2—figure supplement 1, which shows all raw data and separate model predictions for each site. (B) Relationship between female gametocyte density and the proportion of infected mosquitoes for different male gametocyte densities for experiments from Mali (n = 71). Points are coloured according to the density of male gametocytes (<10 male gametocytes/µL = pink,≥10 male gametocytes/µL = dark blue). Note bloodmeals containing lower numbers of male parasites typically have lower infectivity for a given female density. Figure 2—figure supplement 2 shows the same figure but differentiating between points using the sex ratio instead of absolute male density. (C) Model predictions for the reduction in the proportion of mosquitoes infected due to male gametocyte density. Data points are the observed infectivity divided by the predicted infectivity as predicted by the statistical model using the density of female gametocytes in the sample (colours matching panel A). Values less than one indicate reductions in relative transmission. The solid black line shows the best fit model for this restriction from the model in 2A, with shaded area and horizontal and vertical lines indicating 95% CIs. (D) illustrates the best fit model predictions for the 3D relationship between female gametocyte density, male gametocyte density and the percentage of mosquitoes which develop oocysts (colour scale from 0 to ≥50% infected mosquitoes, see legend). All raw data can be found in Figure 2—source data 1 whilst statistical comparisons of the different curves tested in (A) are provided in Figure 2—source data 2.
-
Figure 2—source data 1
Raw data presented in Figure 2.
- https://doi.org/10.7554/eLife.34463.010
-
Figure 2—source data 2
Description of the statistical model determining the shape of the relationship between gametocyte density and mosquito infection.
- https://doi.org/10.7554/eLife.34463.011
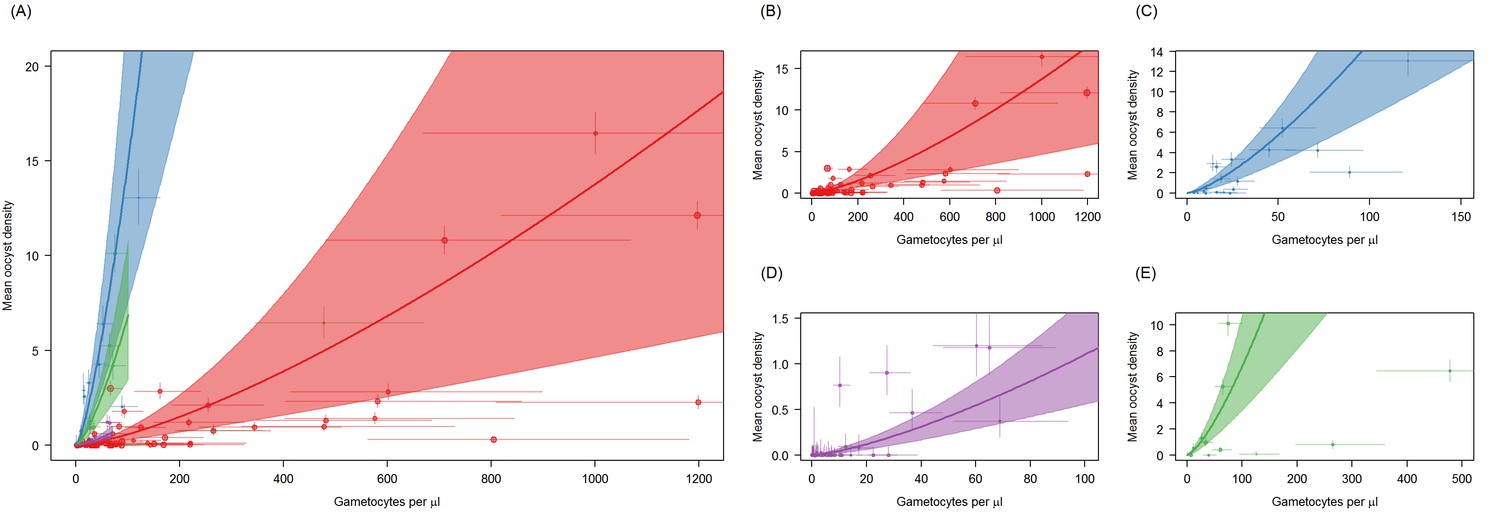
Figure 2—figure supplement 1
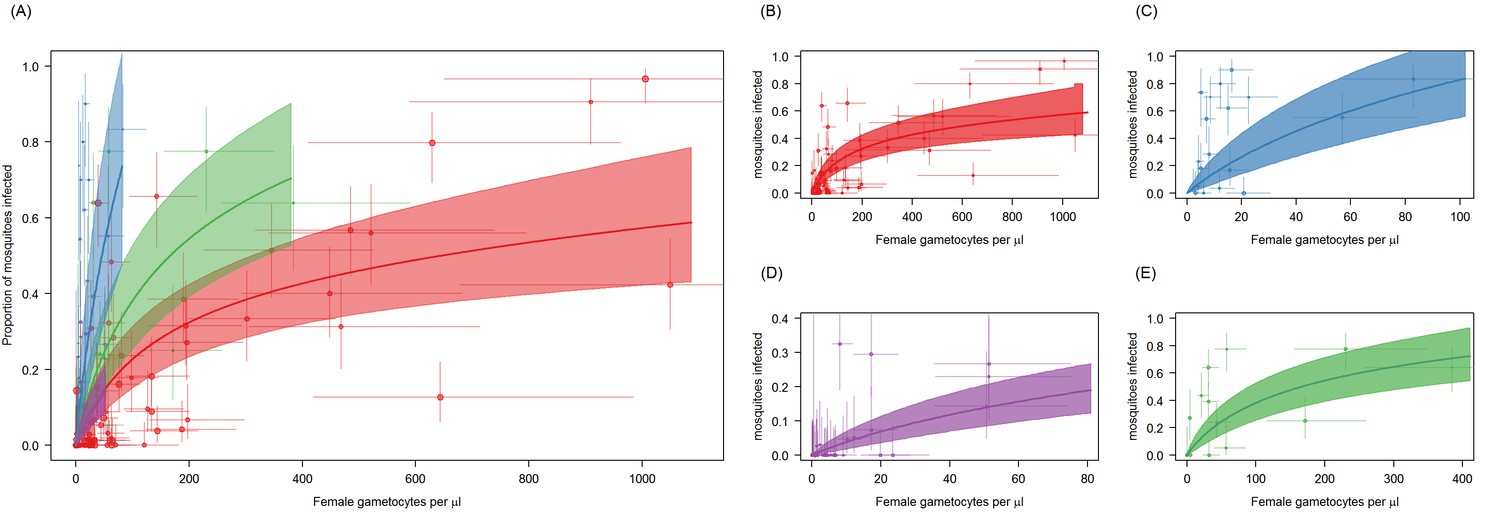
Site-specific differences in the relationship between Plasmodium falciparum female gametocyte density and the proportion of mosquitoes that develop oocysts.
Figure is the same as Figure 2A but without the scaling the mean proportion of mosquitoes infected to the Mali dataset. Panel (A) shows all sites together whilst (B–E) show figures for each site independently. Point colour denotes the study from which the observation came: Ouelessebougou, Mali (red, (B)), Bobo-Dioulasso, Burkina Faso (blue, (C)), Yaoundé, Cameroon (green, (D)) and Balonghin, Burkina Faso (purple, (E)). Horizontal and vertical lines indicate 95% Bayesian credible intervals (CIs) around point estimates. The coloured lines indicate the best-fit model for each site with the shaded area indicates the 95% CI uncertainty around these lines. The colours of the lines correspond to the colours of the points. Best fit model predictions are projected across the gametocyte-density range observed per site.
Figure 2—figure supplement 2

Relationship between female gametocyte density and the proportion of infected mosquitoes for different male gametocyte densities for experiments from Mali (n = 71).
Points are coloured according to gametocyte sex ratio: green >= 16% male, brown <16% male (16% is the median value). At low and intermediate female densities (between 1 and 100 female gametocytes per microlitre), a high proportion of males results in higher transmission because a minimum density of males is required for successful transmission. But for higher female densities, only a small proportion of males is needed to bring the density of males over the threshold for successful transmission, and beyond that extra females contribute more to infectivity.
Figure 3 with 1 supplement
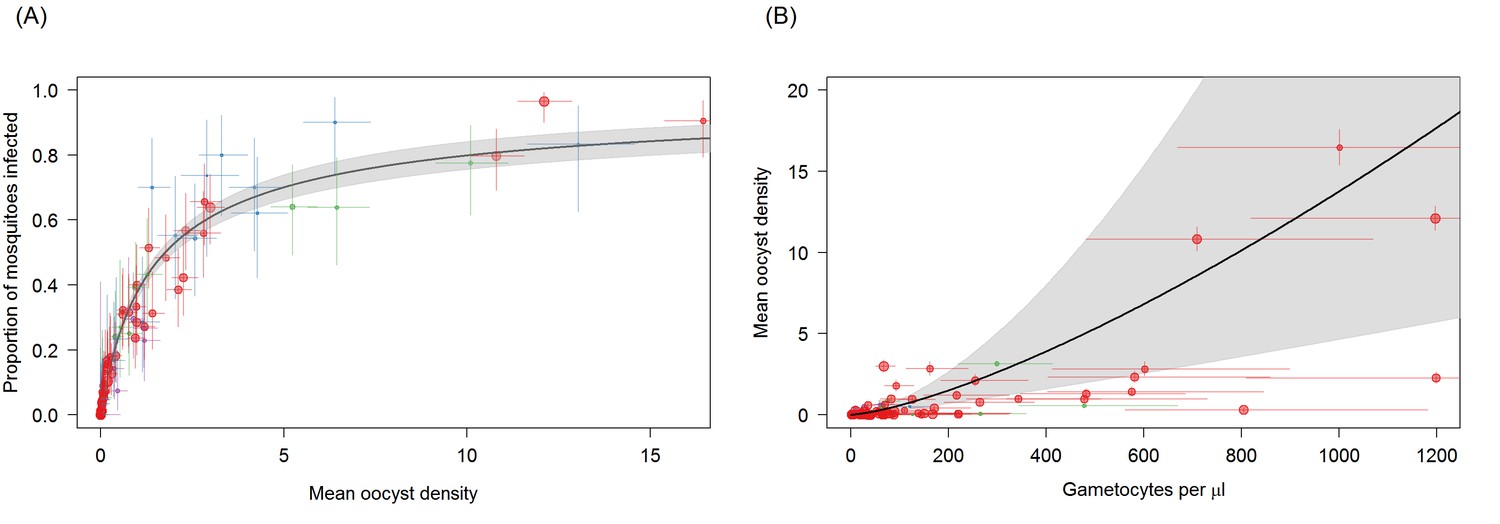
Associations between mean oocyst density; the proportion of mosquitoes that develop oocysts; and gametocyte density.
(A) The relationship between mean oocyst density and the proportion of mosquitoes that develop oocysts (red = Ouelessebougou, Mali, green = Yaoundé, Cameroon, blue = Bobo Dioulasso, Burkina Faso, purple = Balonghin, Burkina Faso; point size is proportional to the number of mosquitoes dissected). A Hill function gave the best fit to these data (DIC linear = 1310; power = 602; Hill = 434). (B) The relationship between total gametocyte density and the mean oocyst density in all mosquitoes. The power function gave the best fit to these data (DIC linear = 1042; hyperbolic = 1044; gompertz = 1067; power = 1036); total gametocyte density gave a better fit than only female gametocyte density (best DIC = 1061). Horizontal and vertical lines indicate 95% Bayesian credible intervals (CIs) around point estimates, solid black line indicates the best-fit model with grey shaded area indicates the 95% CI around this line. Like Figure 2A, Panel 3B aids clarity by scaling model and data to the average infectivity of the largest dataset though the raw data and model fits are provided in Figure 3—figure supplement 1.
Figure 3—figure supplement 1
Site-specific differences in the relationship between Plasmodium falciparum female gametocyte density and the proportion of mosquitoes that develop oocysts.
Figure is the same as Figure 3B but without the scaling average oocyst density to the Mali dataset. Panel (A) shows all sites together whilst (B–E) show figures for each site independently. Point colour denotes the study from which the observation came: Ouelessebougou, Mali (red, (B)), Bobo-Dioulasso, Burkina Faso (blue, (C)), Yaoundé, Cameroon (green, (D)), and Balonghin, Burkina Faso (purple, (E)). Horizontal and vertical lines indicate 95% Bayesian credible intervals (CIs) around point estimates. The coloured lines indicate the best-fit model for each site with the shaded area indicates the 95% CI uncertainty around these lines. The colours of the lines correspond to the colours of the points. Best fit model predictions are projected across the gametocyte-density range observed per site.
Author response image 1
Tables
Table 1
Characteristics of gametocyte carriers and mosquito feeding assays.
https://doi.org/10.7554/eLife.34463.006| Ouelessebougou, Mali | Bobo Dioulasso, Burkina Faso | Balonghin, Burkina Faso | Yaoundé, Cameroon | |
|---|---|---|---|---|
| Number of experiments | 71 | 19 | 45 | 13 |
| Enrolment criteria: | Detection of gametocytes by microscopy | Detection of gametocytes by microscopy | Detection of gametocytes by molecular QT-NASBA | Detection of gametocytes by microscopy |
| Period and season of data collection | January 2013-November 2014 (dry and wet season) | April-June 2016 (dry season) | October-November 2014 (wet season) | October-December 2015 (wet season) |
| P. falciparum parasite prevalence in cross-sectional surveys in the study area (microscopy) | 70.2% in children < 5 years, 2015–16 (Mahamar et al., 2017) | 40.9–61.7% in children 1–9 years, 2014–2015 (Hien et al., 2017) | 59.7% in children < 15 years, 2014 wet season (Gonçalves et al., 2017) | 44.7–55.6% in children 4–15 years, 2013–2014 (Sandeu et al., 2017) |
| Age, median (IRQ) | 11 (7–25) | 5–15 (range)* | 10 (8–13) | 9 (6–11) |
| Asexual parasite prevalence % (n/N) | 64.8 (46/71) | 73.7 (14/19) | 73.3 (33/45) | 76.9 (10/13) |
| Asexual parasite density per µL, median (IQR) | 432 (96–2880) | 360 (240–1040) | 658 (336–1237) | 944 (288–4224) |
| Total gametocyte density per µL, median (IQR) | 62.8 (31.4–146.8) | 19.2 (10.5–26.1) | 4.0 (0.6–11.0) | 64.4 (11.7–126.2) |
| Percentage of male gametocytes, median (IQR) | 14% (7–25%) | 51% (39–66%) | 30% (18–40%) | 32% (27–53%) |
| Number of mosquitoes examined per experiment, median (IQR) | 70 (63–79) | 29 (28–30) | 40 (35–45) | 37 (32–45) |
| Infectious individuals, % (n/N) | 74.7 (53/71) | 84.2 (16/19) | 22.2 (10/45) | 76.9 (10/13) |
| Infected mosquitoes, % (n/N) | 17.0 (842/4960) | 39.2 (208/531) | 3.5 (63/1783) | 38.1 (184/483) |
-
*the age of individual gametocyte donors was not recorded in Bobo Dioulasso; gametocyte carriers were recruited from the age range 5–15 years; asexual parasite density was determined by microscopy, gametocyte density by quantitative reverse transcriptase PCR. QT-NASBA = Pfs25 mRNA quantitative nucleic acid sequence based amplification.
Table 2
Primer sequences for the Pfs25 female marker, and male marker PfMGET.
https://doi.org/10.7554/eLife.34463.014| Gene target | Forward primer | Reverse primer |
|---|---|---|
| Pfs25 | GAAATCCCGTTTCATACGCTTG | AGTTTTAACAGGATTGCTTGTATCTAA |
| PFMGET | CGGTCCAAATATAAAATCCTG | GTGTTTTTAATGCTGGAGCTG |
Additional files
-
Transparent reporting form
- https://doi.org/10.7554/eLife.34463.015
Download links
A two-part list of links to download the article, or parts of the article, in various formats.
Downloads (link to download the article as PDF)
Open citations (links to open the citations from this article in various online reference manager services)
Cite this article (links to download the citations from this article in formats compatible with various reference manager tools)
Predicting the likelihood and intensity of mosquito infection from sex specific Plasmodium falciparum gametocyte density
eLife 7:e34463.
https://doi.org/10.7554/eLife.34463


