Cellular diversity in the Drosophila midbrain revealed by single-cell transcriptomics
- The University of Oxford, United Kingdom
Figures
Figure 1 with 4 supplements
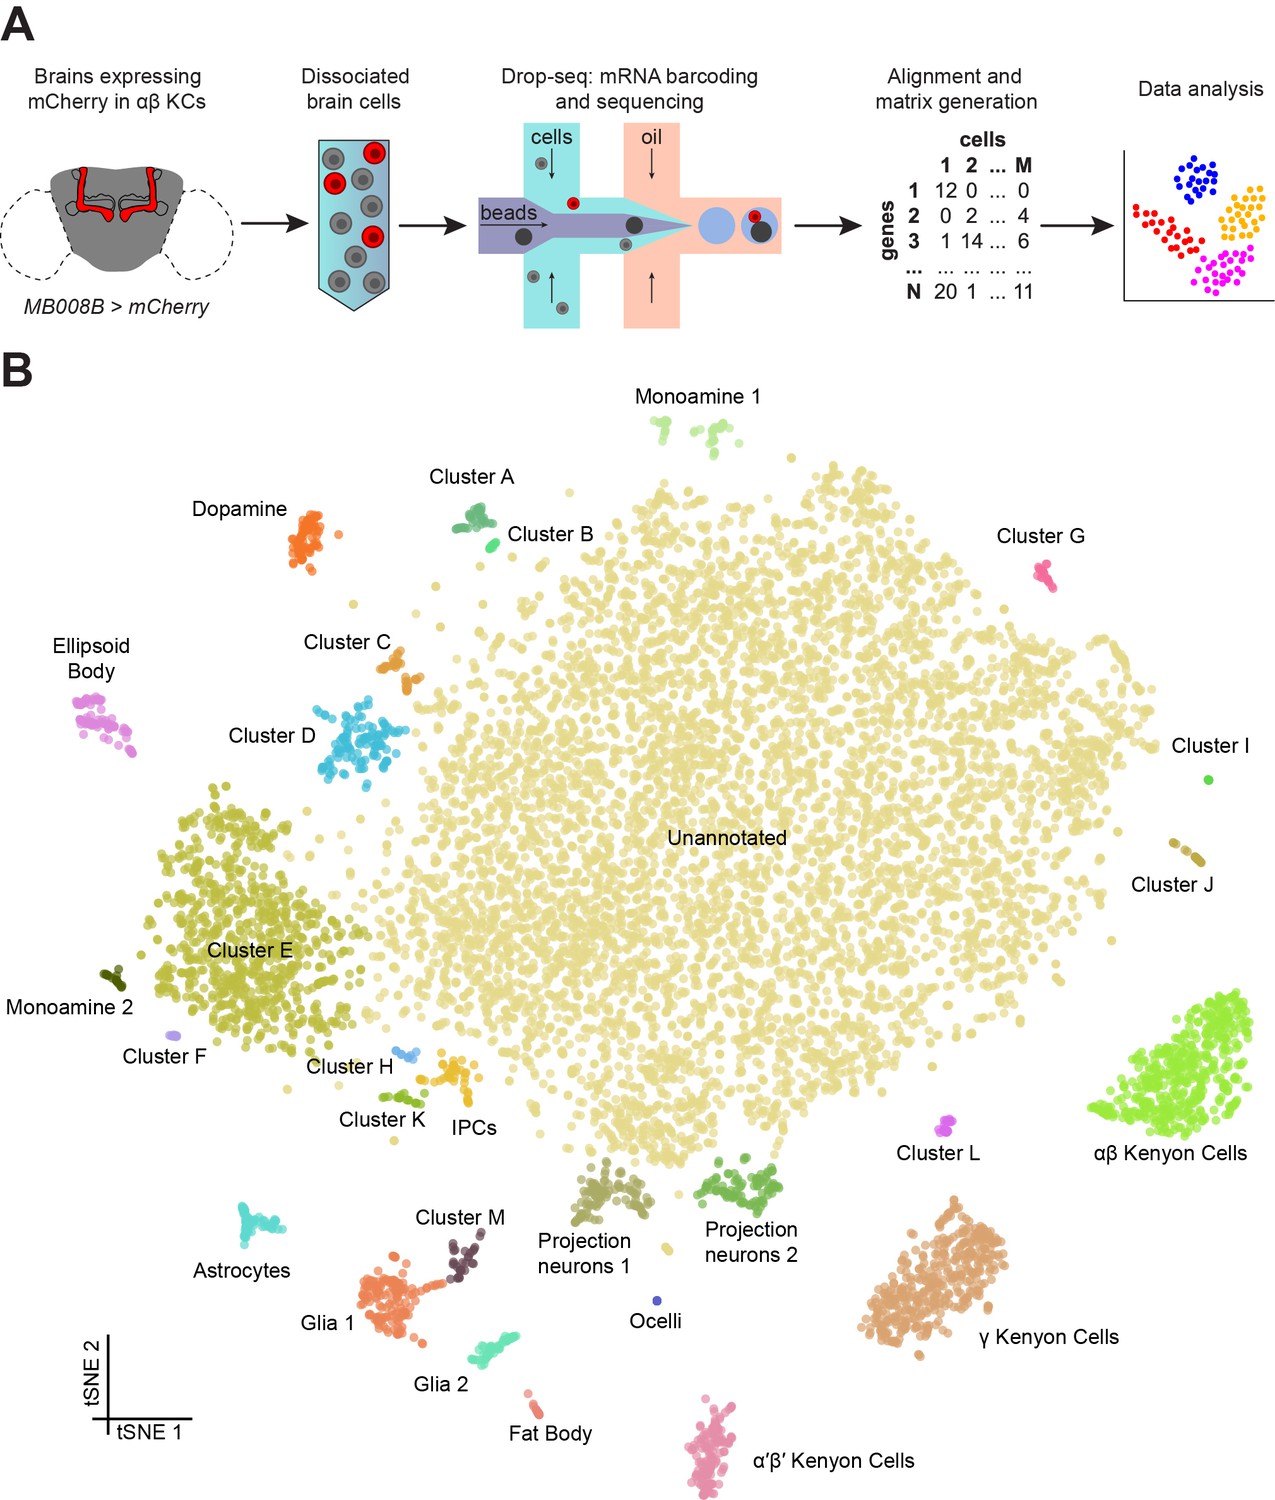
Drop-seq reveals neuronal clusters in the Drosophila brain.
(A) Schematic of the experimental procedure. Drosophila brains were dissected and dissociated prior to Drop-seq. After sequencing and alignment, a digital expression matrix containing information about the number of UMIs found for each gene, in each cell, was generated and used for PCA and subsequent analyses. See Materials and methods section for details. (B) Two-dimensional representation (t-SNE) of 10,286 Drosophila brain cells, manually classified into 28 clusters. Based on the recovery of cell-types of known abundance in the brain, we estimate that there are 45,000 cells in the fly midbrain.
-
Figure 1—source data 1
Digital Expression Matrix.
Zip-archive containing individual digital expression matrices of all 8 biological replicates.
- https://doi.org/10.7554/eLife.34550.007
-
Figure 1—source data 2
List of marker genes for each cluster in Figure 1.
Table showing the average log-fold change values of marker genes for each incluster, including adjusted p-values.
- https://doi.org/10.7554/eLife.34550.008
Figure 1—figure supplement 1

Preliminary validation of Drop-seq on insect cells.
(A) Schematic of a Drop-seq experiment that was run to analyze a mixture of Drosophila (S2; blue) and Spodoptera (Sf9; red) cells. (B) Scatter plot (Barnyard) indicating the number of transcripts from Drosophila or Spodoptera associated with each STAMP. Of 768 STAMPs analyzed, only 12 (1.56%) carried transcripts from both species (purple dots).
Figure 1—figure supplement 2

– Comparison of different quality filters.
(A–C) Left: histograms representing the distribution of numbers of UMIs per cell selected with cutoffs of 200 (A), 800 (B) and 1800 (C) UMIs per cell. Right: t-SNE plots of the same data set as in Figure 1B. obtained with these cutoffs to compare the impact of number of cells and UMI coverage on t-SNE clusters.
Figure 1—figure supplement 3
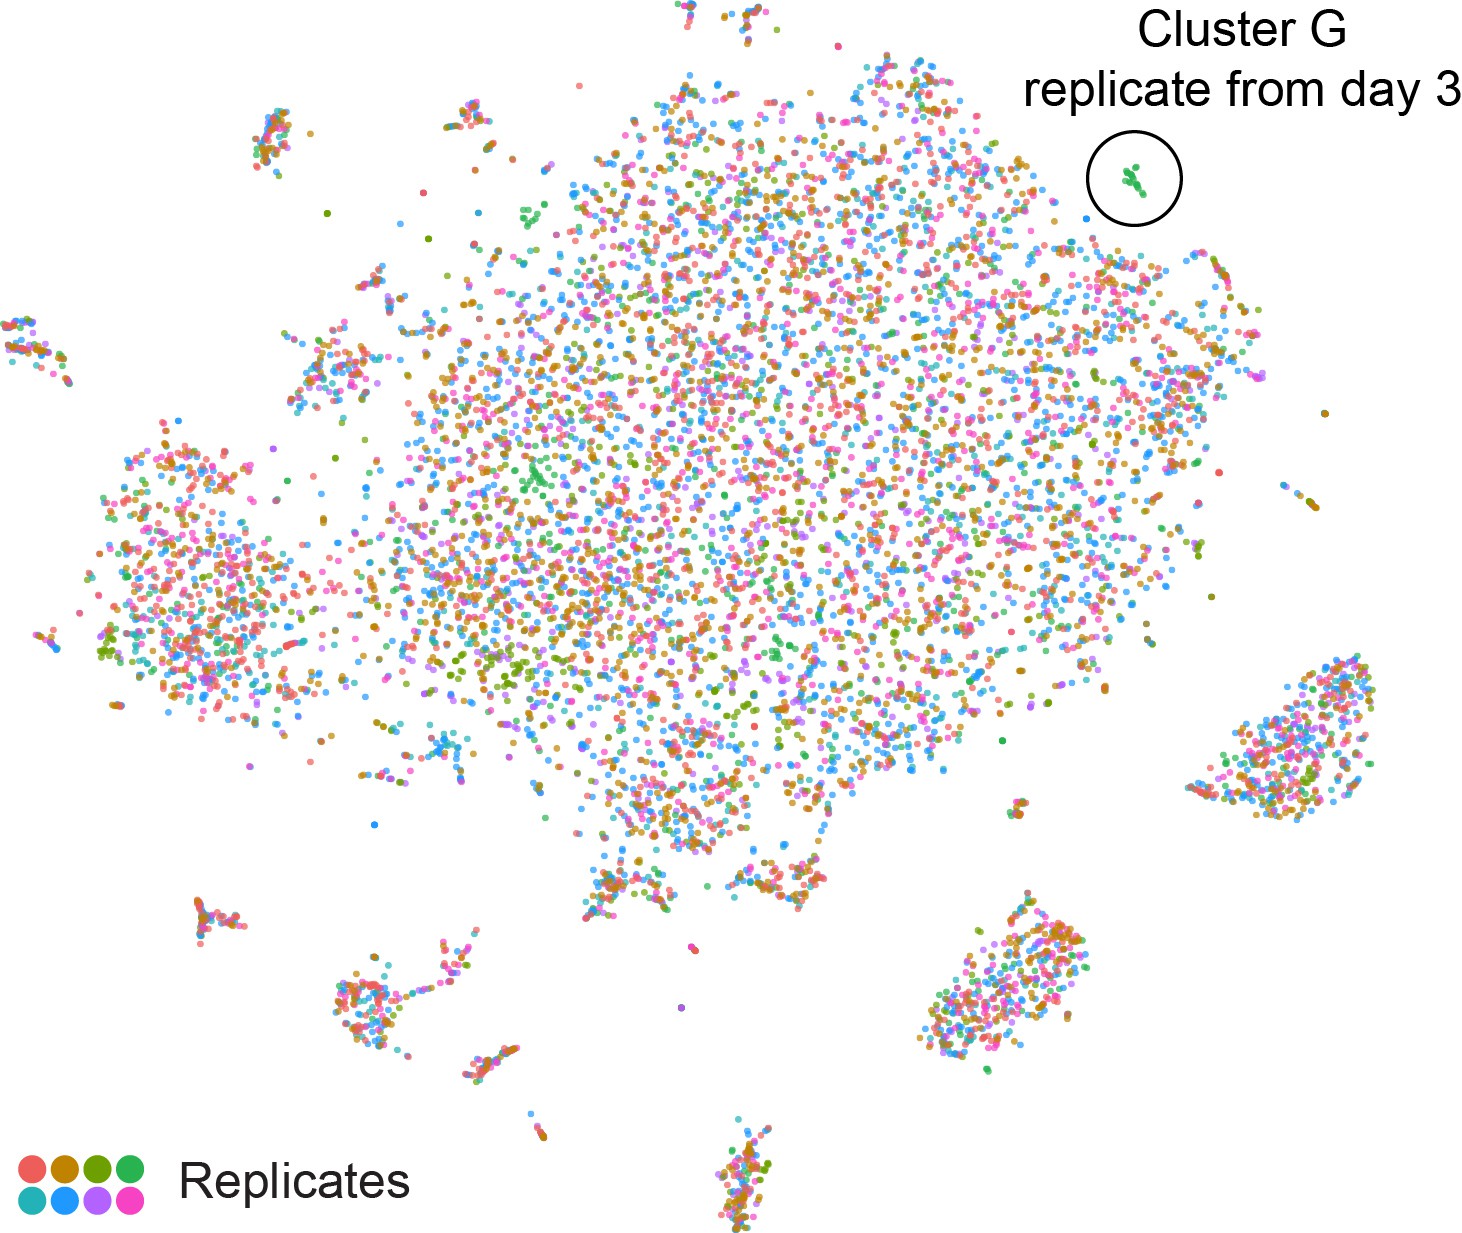
– t-SNE plot showing all eight replicates.
t-SNE plot as in Figure 1B, with cells from each replicate in a different color.
Figure 1—figure supplement 4
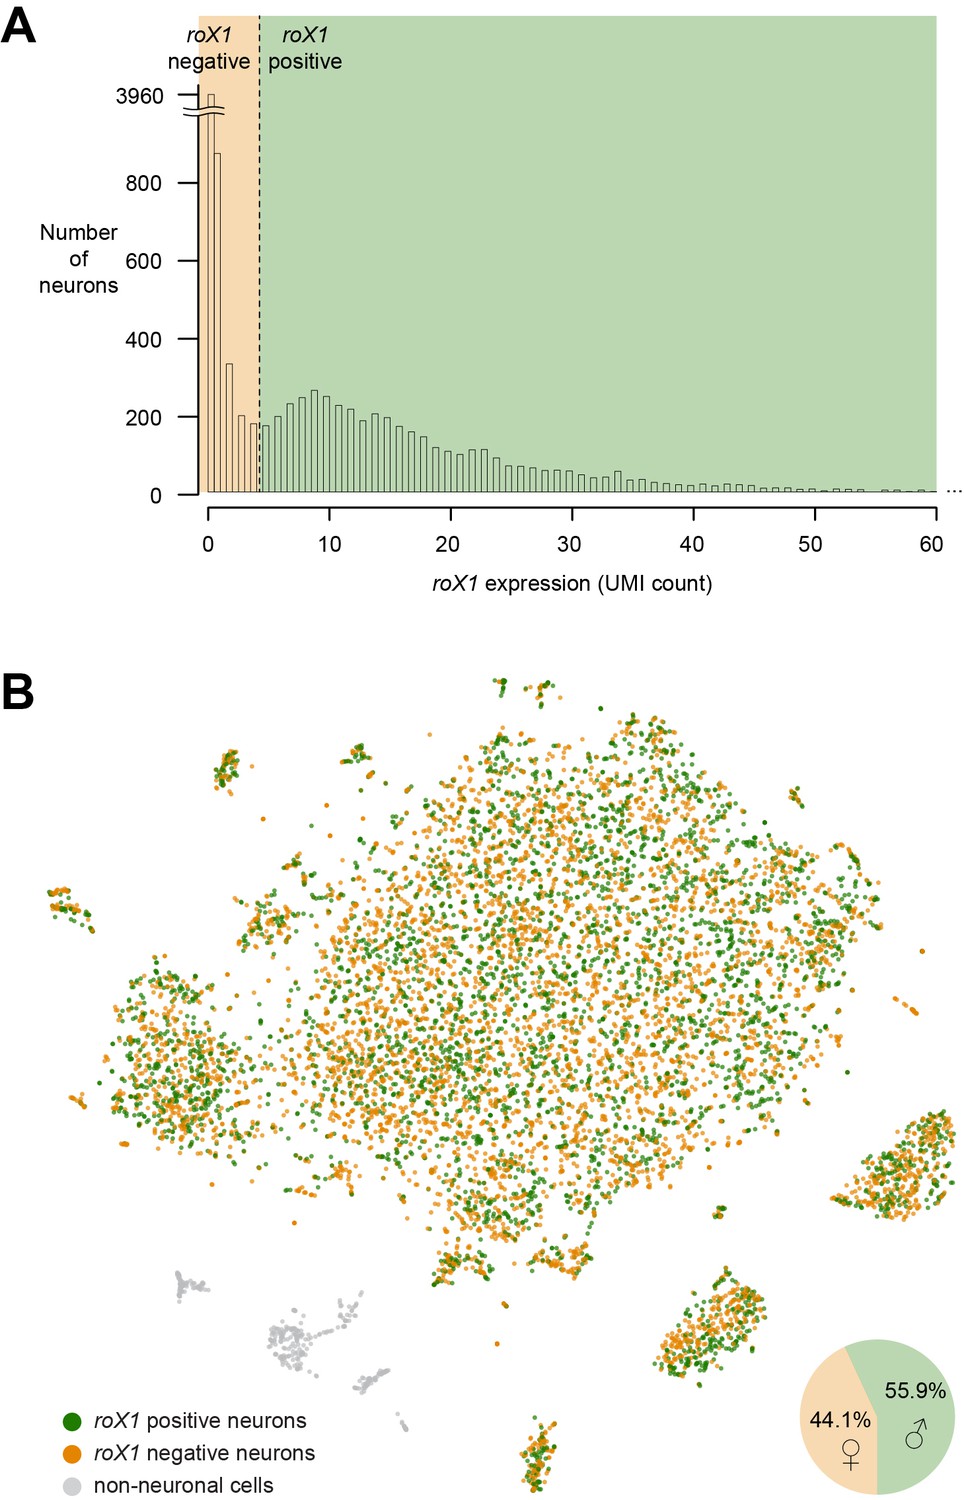
– Sex-determination of individual neurons.
(A) Histogram showing the number of UMIs per neuron. The dashed line indicates the threshold that was chosen to separate roX1-positive and roX1-negative neurons. (B) t-SNE plot showing putative male and female cells, based on roX1 expression. Pie-chart shows the frequency of ‘male’ and ‘female’ neurons.
Figure 2 with 1 supplement

Identification of Kenyon Cells and mushroom body-specific genes.
(A) mCherry labeling of MB008B neurons in the Drosophila brain. Neuropil, labeled by nc82 anti-Brp antibody, is shown in grey. (B) Expression of mCherry in the t-SNE-clustered brain cells shown in Figure 1B. mCherry-positive cells are labeled red and identify this cluster as αβ Kenyon Cells (KCs). Intensity of red (or other colors in the panels below) is proportional to the normalized expression level. (C) and (D) Expression of eyeless and Dop1R2 (damb), in t-SNE-clustered brain cells. The three numbered clusters containing indigo cells are KCs. (E) Expression of sNPF, Fas2 and trio in the three t-SNE clusters numbered in (C) and (D). Cells in light blue, orange and purple express each of these genes in αβ, γ, and α´β´ KCs, respectively. sNPF and Fas2 are mostly expressed in αβ and γ KCs, while trio is mostly detected in γ and α´β´ KCs. (F) Violin plots showing the main markers that distinguish KC subtypes from each other (pairwise comparisons for genes expressed in >50% of cells in either cluster; Log2 FC >1.5, Wilcoxon rank-sum test with Bonferroni-corrected p-value<0.01). The column on the right (grey) indicates the level of expression of these genes across all non-MB neurons in the brain.
-
Figure 2—source data 1
Primer pairs used for qPCR.
List of primer pairs and UPL probe numbers used for qPCR show in Figure 2—figure supplement 1.
- https://doi.org/10.7554/eLife.34550.011
Figure 2—figure supplement 1
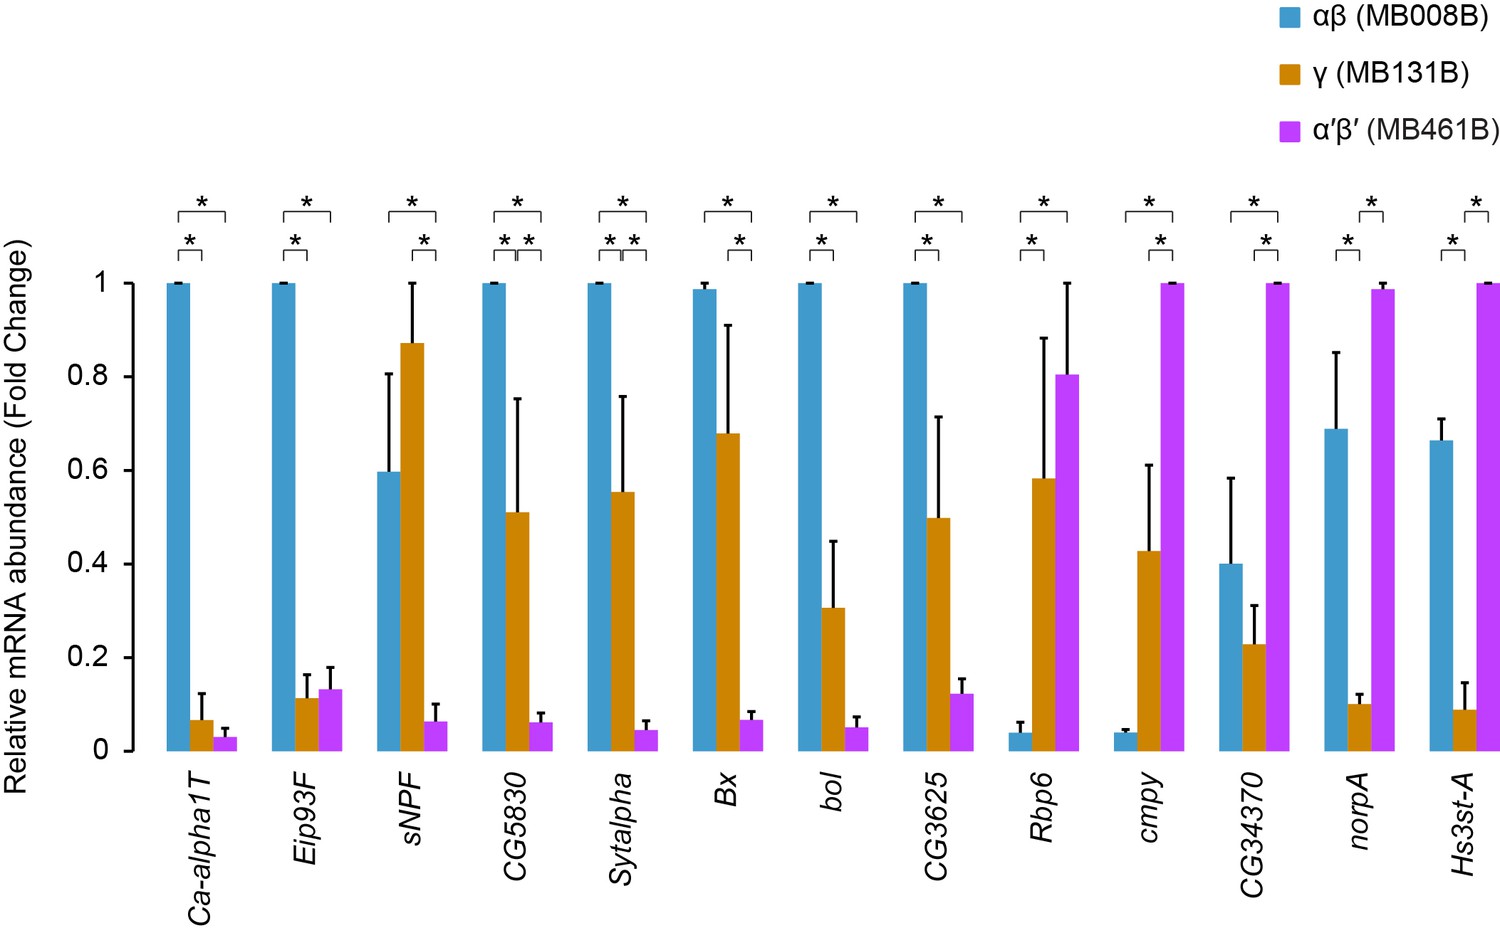
– Confirmation of Kenyon Cell type specific gene expression using qPCR on FAC-sorted cells.
Relative difference of expression levels for some of the genes identified in Figure 2F. For each gene, in each replicate, expression values were normalized to the lowest ΔCt across the three lobes. n = 3, * Adjusted p-value<0.05 (Two-way ANOVA with Tukey's multiple comparisons test).
Figure 3

Sub-populations of olfactory projection neurons.
(A) Re-clustering of the two Projection Neuron (PN) clusters from Figure 1B. Clusters are color-coded. (B) Dot plots showing the main markers distinguishing PN populations from each other (pairwise comparisons for genes expressed in >50% of cells in either cluster; Log2 FC >1.5, Wilcoxon rank-sum test with Bonferroni-corrected p-value<0.01). Dot diameter represents the fraction of cells expressing each gene in each cluster, as shown in scale. Color intensity represents the average normalized expression level. (C) t-SNE-plots for some known markers of PNs. ct labels all PN clusters, acj6 and vvl are mutually exclusive in Clusters 1, 2 and 4, versus Cluster 3, while Lim1 is specifically expressed in Cluster 4. Some of these cells may be antennal lobe local interneurons.
Figure 4 with 1 supplement
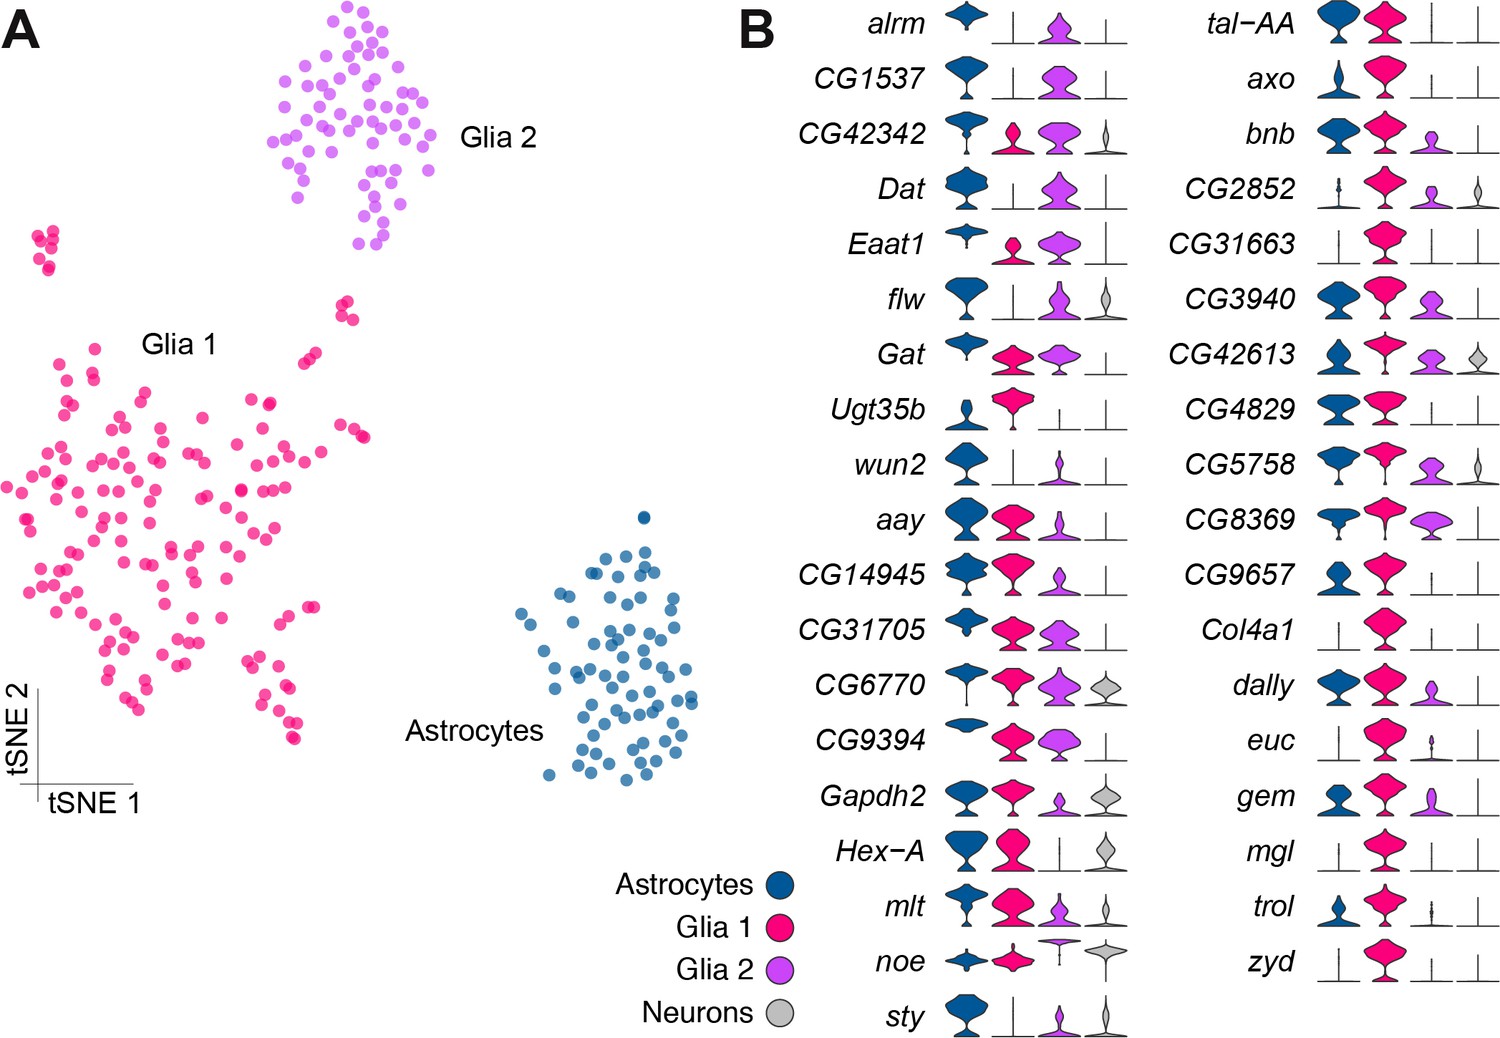
Genetic markers of glial subtypes.
(A) Re-clustering of the glial and astrocyte populations identified in Figure 1B. The same three sub-clusters are identified. (B) Violin plots showing the main markers that distinguish glial subtypes from each other (pairwise comparisons for genes expressed in >75% of cells in either cluster; Log2 FC >2, Wilcoxon rank-sum test with Bonferroni-corrected p-value<0.01). The column on the right (grey) indicates the level of expression of each gene across all neurons in the brain (excluding glia, astrocytes and fat body).
Figure 4—figure supplement 1
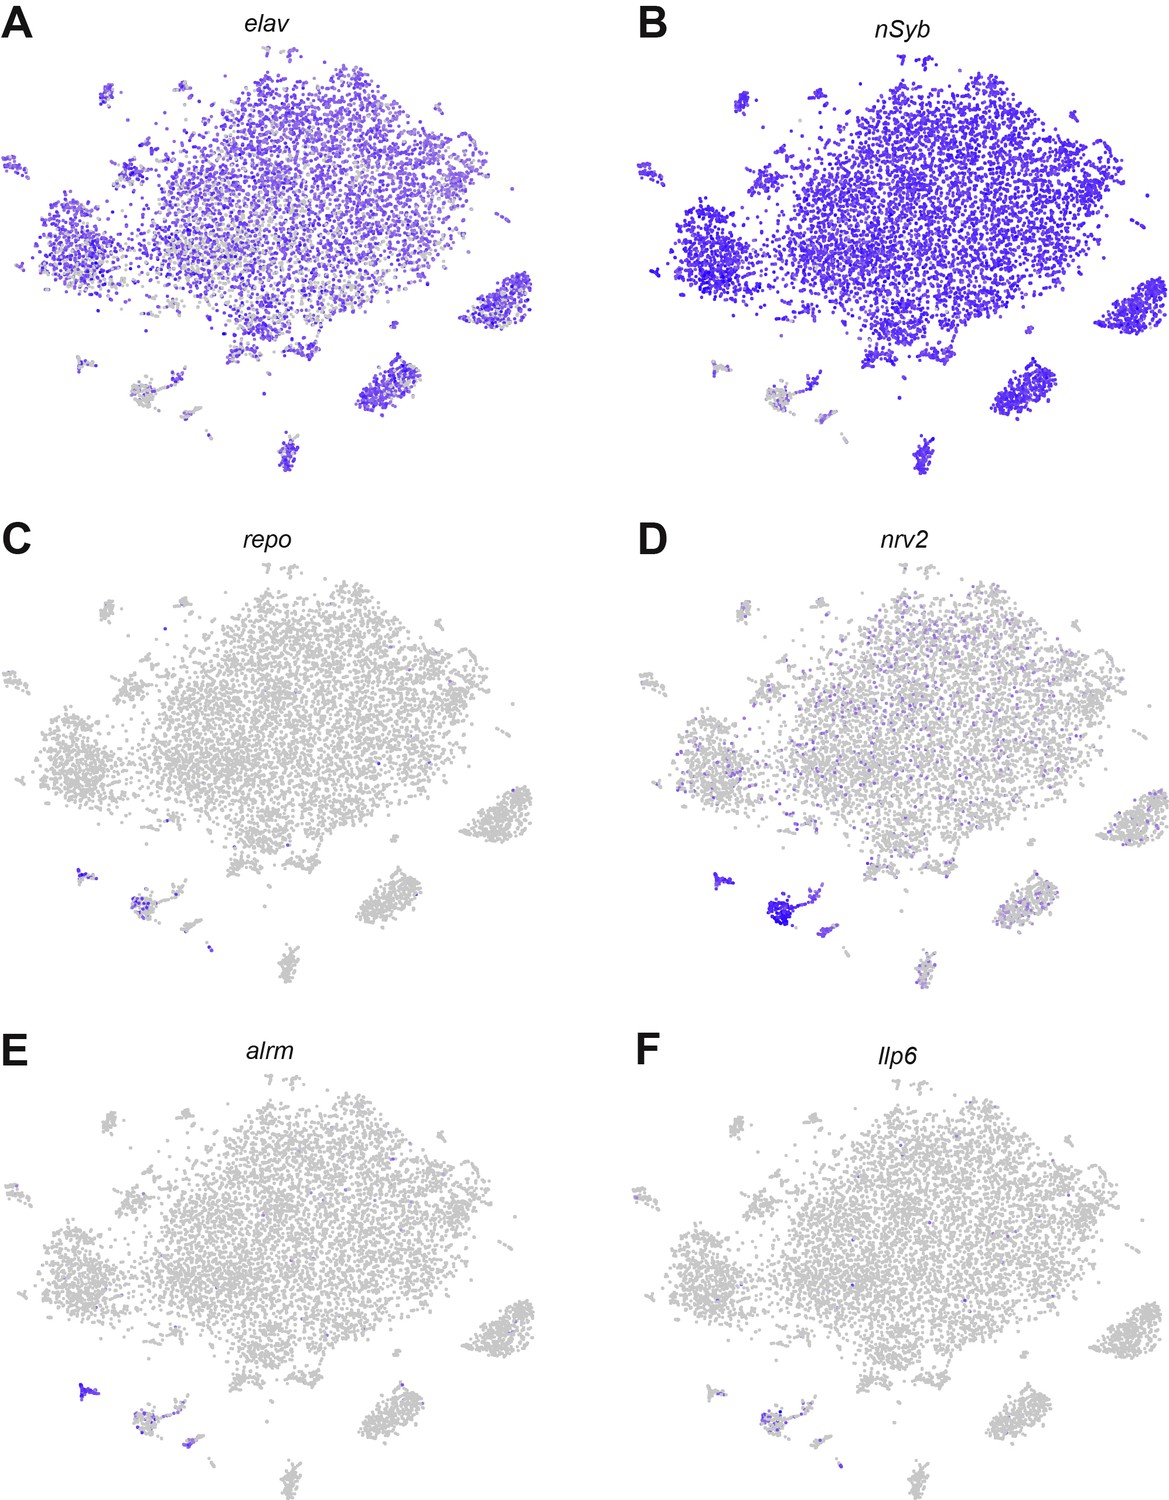
Expression levels of glia-specific genes and Ilp 6.
(A–B) tSNE plots showing the expression levels of the neuronal markers embryonic lethal abnormal vision (elav) and neuronal synaptobrevin (nSyb). (C–E) tSNE plots showing the expression levels of the glial markers reversed polarity (repo) and nervana 2 (nrv2), and the astrocyte marker astrocytic leucine-rich repeat molecule (alrm) (Doherty et al., 2009). (F) tSNE plots showing the expression levels of Insulin-like peptide 6 (Ilp6), confirming its expression in glia.
Figure 5
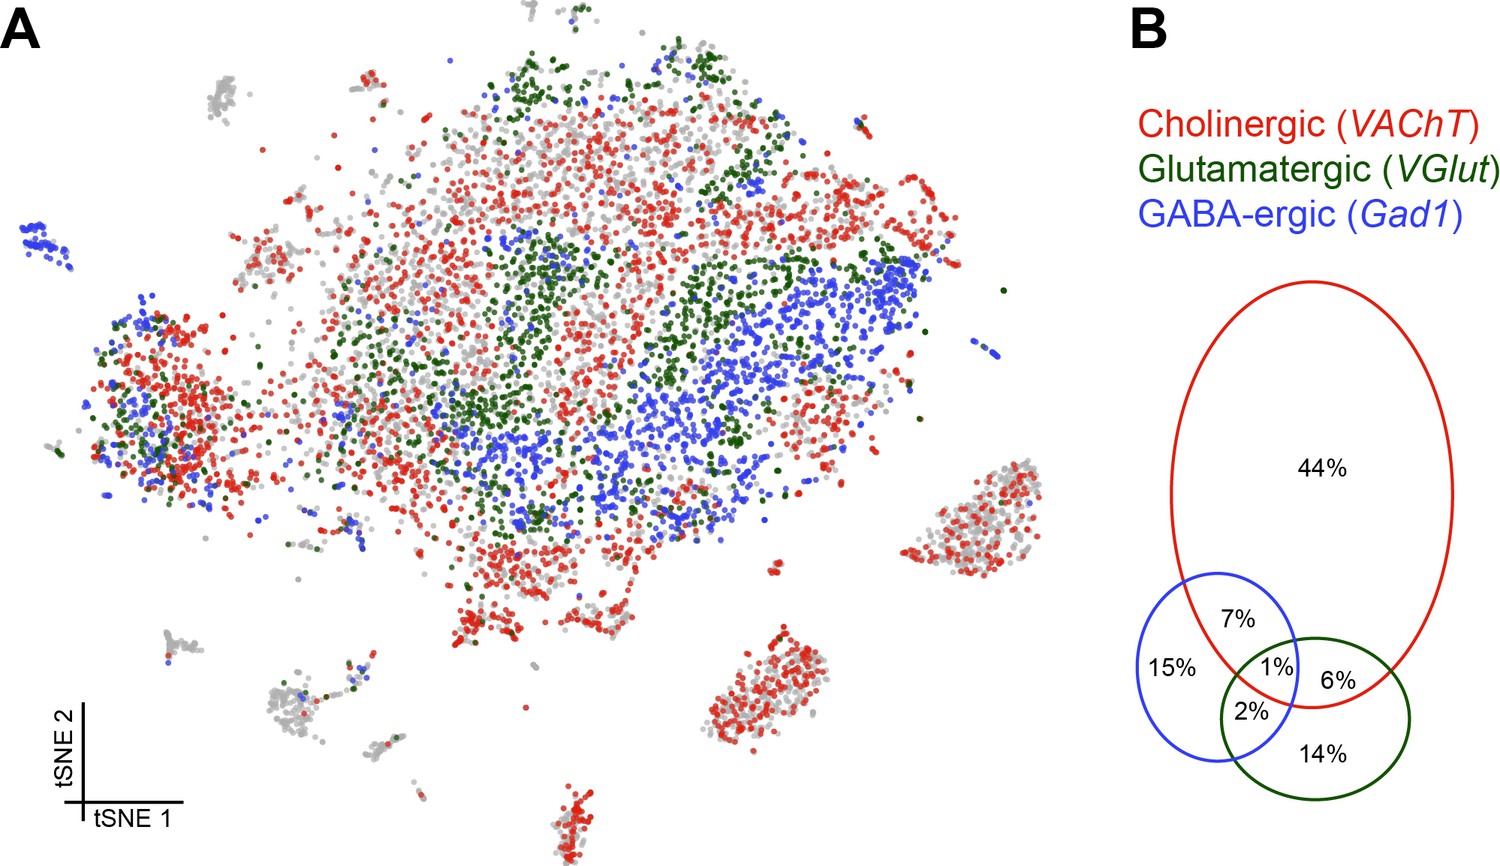
Distribution of fast-acting neurotransmitters.
(A) t-SNE plot showing the distribution of cells expressing vesicular acetylcholine transporter (VAChT, cholinergic neurons), vesicular glutamate transporter (VGlut, glutamatergic neurons) and glutamic acid decarboxylase 1 (Gad1, GABA-ergic neurons). For graphical reasons only cells expressing each marker above a log normalized value of 2 are shown. (B) Quantification of cells expressing markers displayed in A. The difference to 100% are cells that did not express any of the three markers.
Figure 6
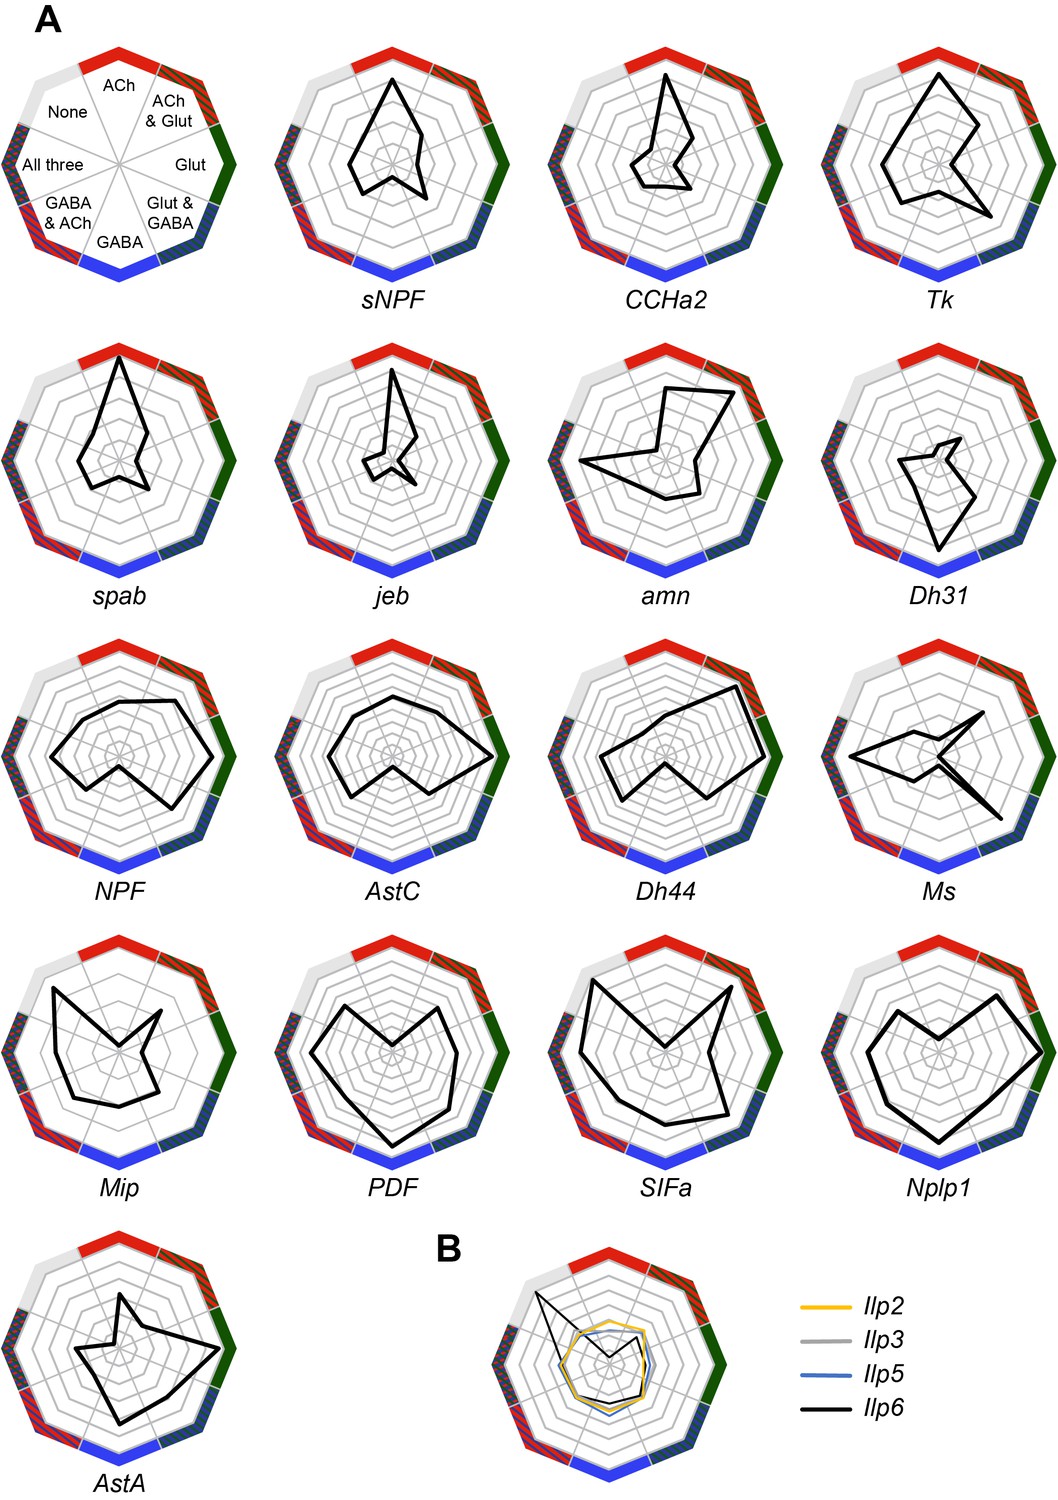
Co-expression of neuropeptides with fast-acting neurotransmitters.
(A) Radar plots showing the co-expression of 16 neuropeptides with the three fast-acting neurotransmitters. Data represents the relative abundance of cells expressing a neuropeptide and either VAChT (ACh), VGlut (Glut), Gad1 (GABA), combinations of these three genes, or none of them. (B) Co-expression of four insulin-like peptides, including the non-neuronal Ilp6, with fast-acting neurotransmitters.
Figure 7
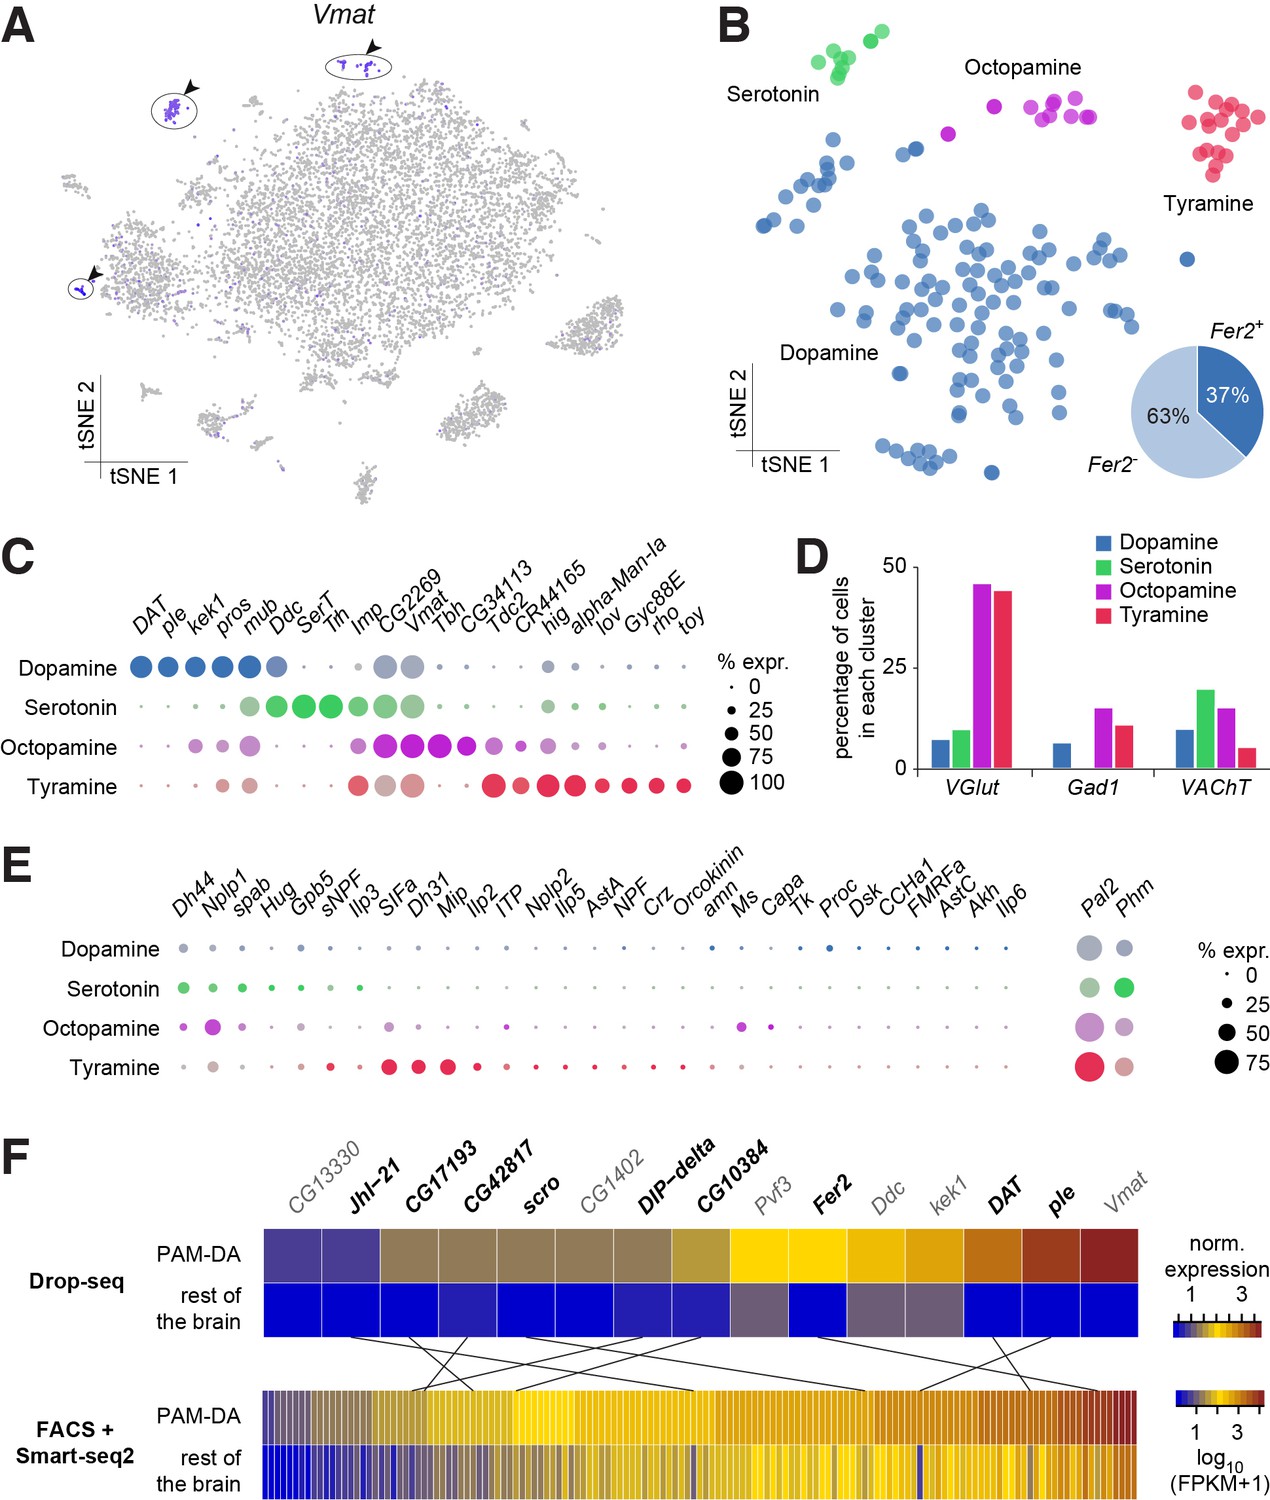
Genetic markers and co-transmission in monoaminergic neurons.
(A) Expression of the Vesicular Monoamine Transporter (Vmat) labels three clusters from Figure 1B (cells in indigo, highlighted with arrowheads and circles. (B) Re-clustering of the three cell populations labeled in (A). Four sub-clusters are identified, representing dopaminergic, tyraminergic, octopaminergic, and serotonergic neurons. (C) Dot plots showing the main markers distinguishing monoamine populations from each other (pairwise comparisons for genes expressed in >50% of cells in either cluster; Log2 FC >1, Wilcoxon rank sum test with Bonferroni-corrected p-value<0.01). Dot diameter represents the fraction of cells expressing each gene in each cluster, as shown in scale. Color intensity represents the average normalized expression level. (D) Percentage of cells in each monoaminergic cluster that are co-expressing markers for fast neurotransmitter-releasing neurons (VGlut, Gad1, and VAChT). (E) Dot plots showing expression of genes encoding neuropeptides and neuropeptide amidating enzymes across monoaminergic populations. Dot diameter represents the fraction of cells expressing each gene in each cluster, as shown in scale. Color intensity represents the average normalized expression level. (F) Comparison of genes overexpressed in PAM dopaminergic neurons compared to the rest of the brain, measured with Drop-seq or with FACS and Smart-seq2. 9 of the 15 genes identified with Drop-seq (labeled in bold) were also found in the Smart-seq2 dataset.
Figure 8
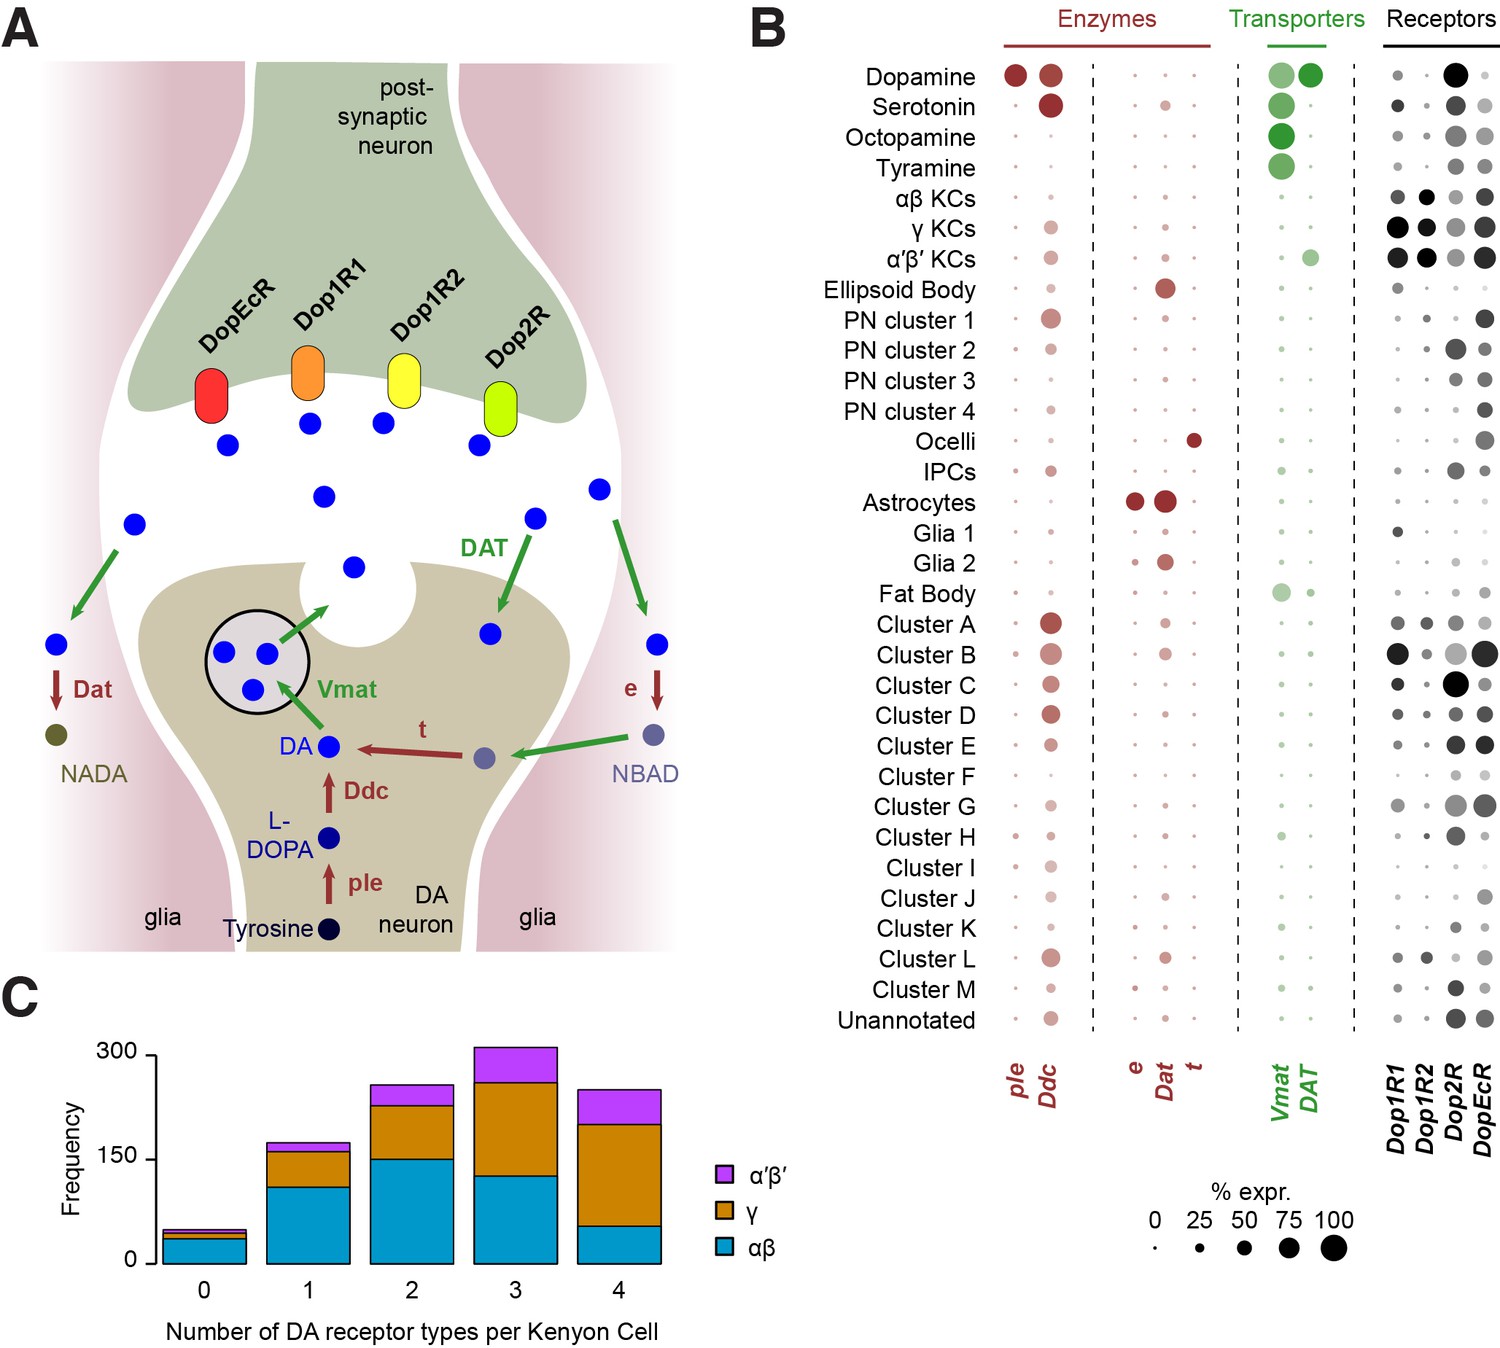
Localization of genes involved in dopamine metabolism and signaling.
(A) Schematic of a dopaminergic synapse, representing the major proteins involved in dopamine signaling and metabolism. Drawing inspired by Yamamoto and Seto (2014) (B) Dot plots showing the expression of these genes across all cell populations identified in the Drosophila brain. Dot diameter represents the fraction of cells expressing each gene in each cluster, as shown in scale. Color intensity represents the average normalized expression level. (C) Histogram showing the number of DA receptor types in Kenyon Cells (as labeled in Figure 2C & D). Most cells express a combination of several receptor types.
Figure 9
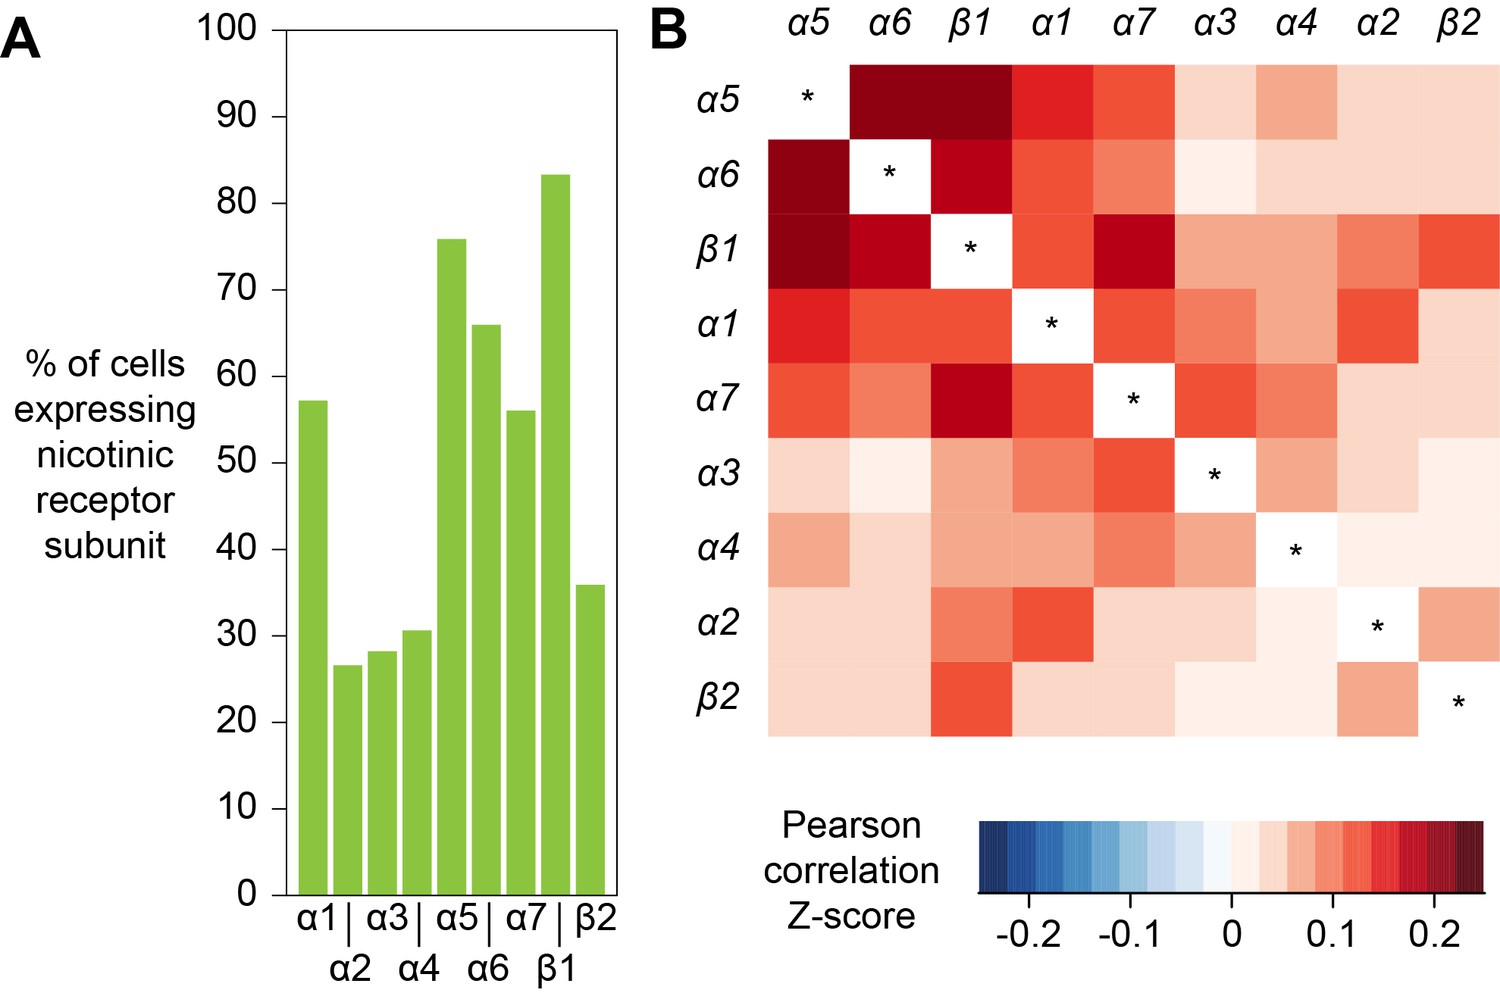
Expression patterns of nicotinic acetylcholine receptor subunits.
(A) Prevalence of nicotinic receptor subunits. (B) Heatmap showing Pearson correlation coefficient Z-scores for each receptor subunit pair.
Figure 10
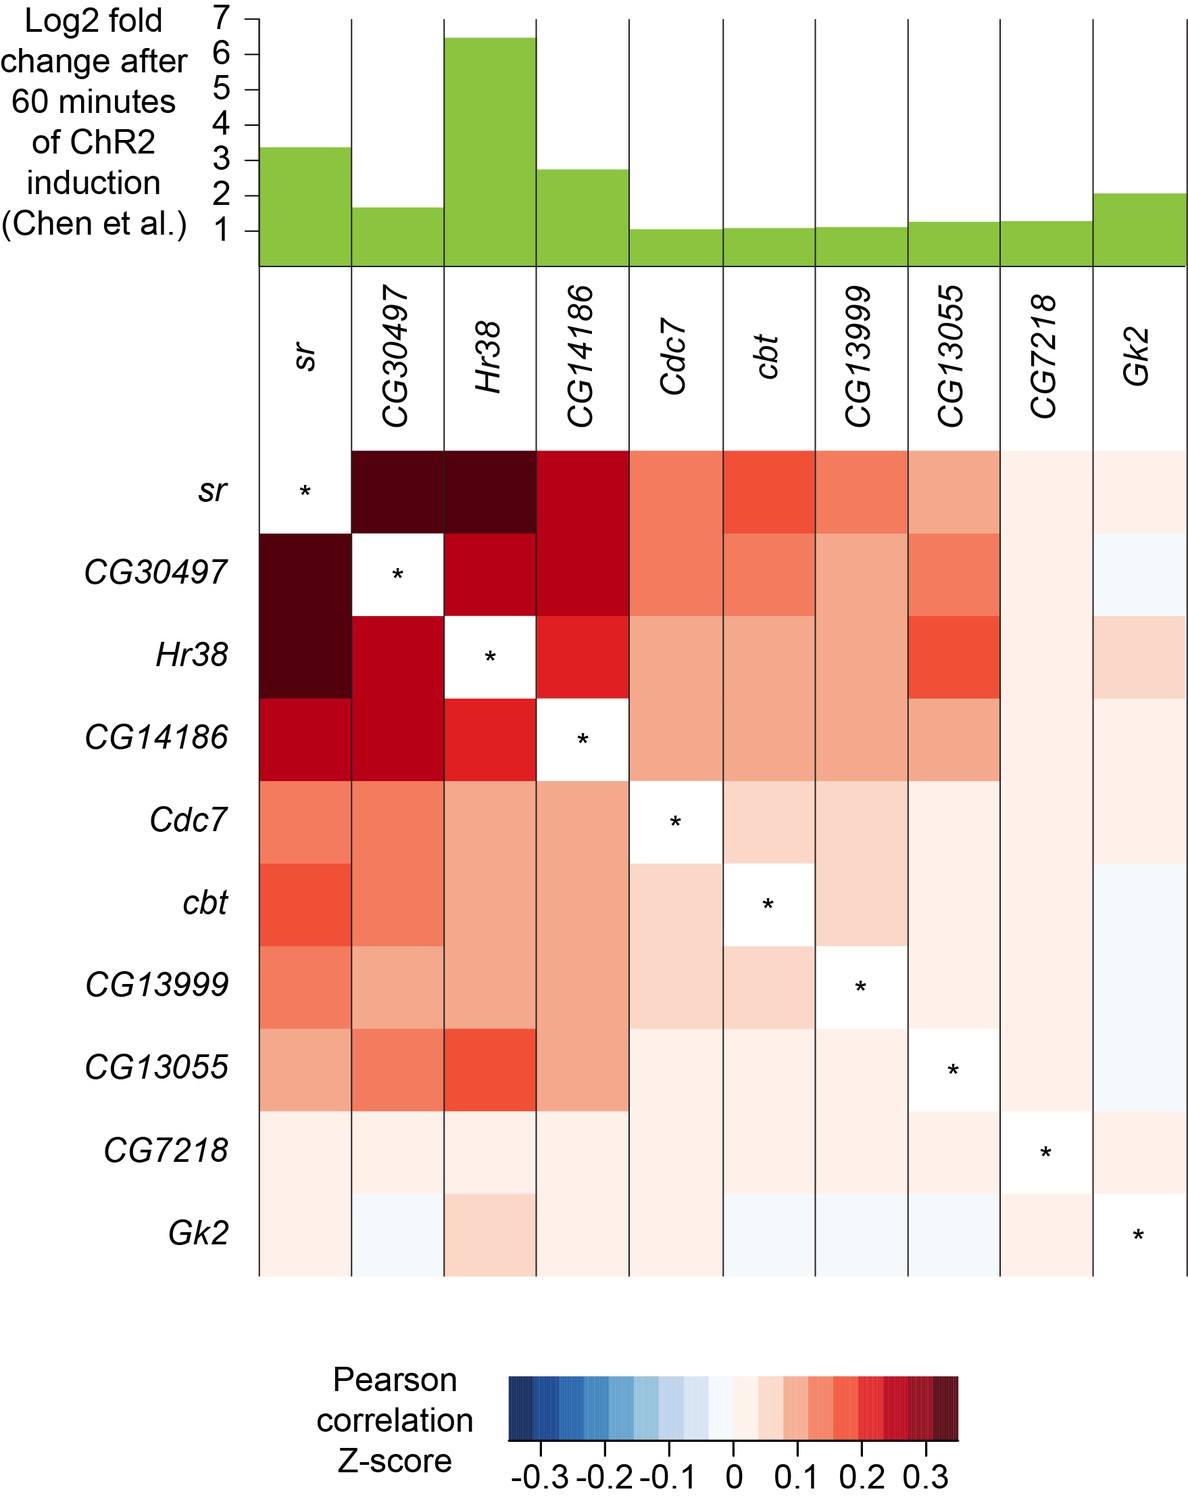
Co-expression of neuronal activity markers.
Heatmap showing Pearson correlation coefficient Z-scores of activity-regulated genes, as reported by Chen et al., 2016 (histogram on top). Ten most highly upregulated genes following ChR2-XXL-induced activation of all neurons that are expressed in the brain, ranked by their correlation.
Tables
Key resources table
| Reagent type (species) or resource | Designation | Source or reference | Identifiers | Additional information |
|---|---|---|---|---|
| Genetic reagent (Drosophila melanogaster) | MB008B | Bloomington Drosophila Stock Center | RRID:BDSC_68291 | |
| Genetic reagent (D. melanogaster) | MB131B | Bloomington Drosophila Stock Center | RRID:BDSC_68265 | |
| Genetic reagent (D. melanogaster) | MB461B | Bloomington Drosophila Stock Center | RRID:BDSC_68327 | |
| Genetic reagent (D. melanogaster) | uas-mCherry (III) | other | uas-mCherry(III) | lab stock |
| Cell line (D. melanogaster) | Drosophila S2 Cells in Schneider's Medium | Gibco, Waltham, MA | R69007 | |
| Cell line (Spodoptera frugiperda) | Sf9 cells in Sf-900 III SFM | Gibco | 12659–017 | |
| Sequence-based reagent | Template switch oligo | Sigma, St. Louis, MO | AAGCAGTGGTATCAACGCAGAGTGAATrGrGrG | |
| Chemical compound, drug | Schneider's medium | Gibco | 21720–001 | |
| Chemical compound, drug | FBS | Sigma | F0804 | |
| Chemical compound, drug | penicillin-streptomycin | Gibco | 15070–063 | |
| Chemical compound, drug | Sf-900 III SFM | Gibco | 12658019 | |
| Chemical compound, drug | DPBS (calcium and magnesium free) | Gibco | 14190–086 | |
| Chemical compound, drug | Papain | Sigma | P4762 | |
| Chemical compound, drug | Collagenase | Sigma | C2674 | |
| Chemical compound, drug | d(−)−2-amino-5-phosphonovaleric acid | Sigma | A8054 | |
| Chemical compound, drug | 6,7-dinitroquinoxaline-2,3-dione | Sigma | D0540 | |
| Chemical compound, drug | tetrodotoxin | Abcam, UK | ab120054 | |
| Other | 10 µm CellTrix strainer | Sysmex, Japan | 04-0042-2314 | |
| Other | Fuchs-Rosental hemocytometer | VWR, Radnor, PA | 631–1096 | |
| Commercial assay or kit | Single Cell RNA-Seq system | Dolomite Bio, UK | 3200537 | |
| Chemical compound, drug | Barcoded Beads SeqB | ChemGenes Corp., Wilmington, MA | ||
| Chemical compound, drug | Ficoll PM-400 | VWR | 17-0300-10 | |
| Chemical compound, drug | N-Lauroylsarcosine sodium salt solution | Sigma | L7414 | |
| Chemical compound, drug | QX200 Droplet generation oil for EvaGreen | Biorad, Hercules, CA | 1864006 | |
| Chemical compound, drug | DTT | Life Technologies, Carlsbad, CA | P2325 | |
| Chemical compound, drug | Maxima H Minus Reverse Transcriptase | Thermo Scientific, Waltham, MA | EP0753 | |
| Chemical compound, drug | Exonuclease I | NEB, Ipswich, MA | M0293L | |
| Sequence-based reagent | SMART PCR primer | Sigma | AAGCAGTGGTATCAACGCAGAGT | |
| Chemical compound, drug | Hifi HotStart Readymix | Kappa Biosystems, Switzerland | KK2602, KK2611 | |
| Chemical compound, drug | Agencourt AMPure XP beads | Beckman-Coulter, Brea, CA | A63880 | |
| Commercial assay, kit | Bioanalyzer High-Sensitivity DNA kit | Agilent, Santa Clara, CA | 5067–4626 | |
| Commercial assay, kit | Nextera XT DNA Sample Preparation Kit | Illumina, San Diego, CA | FC-131–1024 | |
| Sequence-based reagent | New-P5-SMART PCR hybrid | Sigma | AAT GAT ACG GCG ACC ACC GAG ATC TAC ACG CCT GTC CGC GGA AGC AGT GGT ATC AAC GCA GAG T*A*C | |
| Commercial assay, kit | PicoPure™ RNA Isolation Kit | Applied Biosystems, Foster City, CA | KIT0204 | |
| Commercial assay, kit | SuperScript III First-Strand Synthesis SuperMix | Invitrogen, Carlsbad, CA | 18080400 | |
| Commercial assay, kit | QIAquick PCR Purification Kit | Qiagen, Germany | 28106 | |
| Commercial assay, kit | Universal Probe Library system | Roche, Switzerland | 04683633001,04869877001 | |
| Commercial assay, kit | LightCycler® 480 Probes Master | Roche | 4887301001 | |
| Commercial assay, kit | SMART-Seq v4 Ultra Low Input RNA Kit for Sequencing | Takara Clontech, Japan | 634890 | |
| Commercial assay, kit | TruSeq RNA Library Prep Kit v2 | Illumina | RS-122–2001 |
Additional files
-
Transparent reporting form
- https://doi.org/10.7554/eLife.34550.021
Download links
A two-part list of links to download the article, or parts of the article, in various formats.
Downloads (link to download the article as PDF)
Open citations (links to open the citations from this article in various online reference manager services)
Cite this article (links to download the citations from this article in formats compatible with various reference manager tools)
Cellular diversity in the Drosophila midbrain revealed by single-cell transcriptomics
eLife 7:e34550.
https://doi.org/10.7554/eLife.34550


