Gradient-reading and mechano-effector machinery for netrin-1-induced axon guidance
- Nara Institute of Science and Technology, Japan
- University of California, Davis, United States
- University of Tokyo, Japan
Figures
Figure 1 with 3 supplements
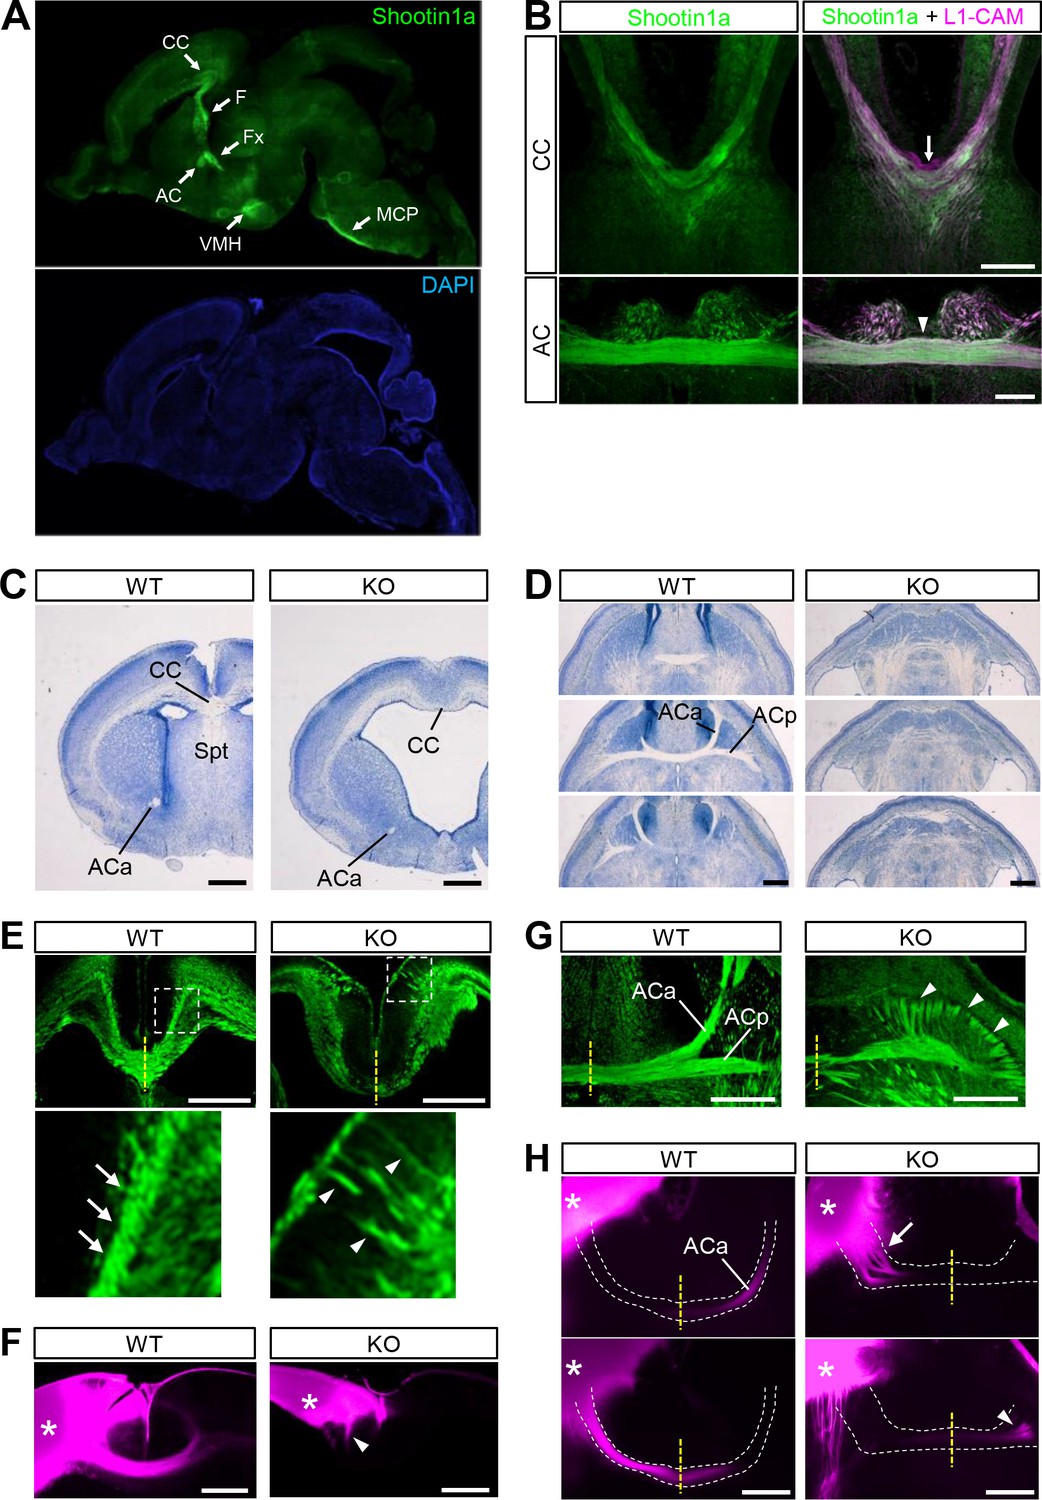
Shootin1 knockout mice display abnormal projection of forebrain commissural axons.
(A) A representative sagittal section of a P0 mouse brain immunolabeled with shootin1a antibody (green) and counterstained with DAPI (blue). (B) Coronal sections of E16.5 mouse brains double-immunolabeled with anti-shootin1a (green) and anti-L1-CAM (magenta) antibodies. The arrow and arrowhead indicate the corpus callosum and anterior commissure, respectively. (C) Coronal sections of the forebrain of wild-type and Shootin1 knockout mice at P0 stained for Nissl substance. (D) Serial horizontal sections of the ventral forebrain of wild-type and Shootin1 knockout mice at P0 stained for Nissl substance. (E) Coronal sections of wild-type and Shootin1 knockout mouse brains at P0 immunolabeled with anti-L1-CAM antibody (green). Ectopic axonal projections were observed in the neocortex (arrowheads). In the knockout mice, the prominent axonal tracts observed in the intermediate zone of the neocortex of wild-type mice (arrows) were undetectable and ectopic axonal projections were observed (arrowheads). Lower panels show enlarged views of the rectangles. (F) Coronal sections of wild-type and Shootin1 knockout mouse brains at P0. DiI crystals (magenta) were placed into the neocortex (asterisks) to label callosal axons. An arrowhead indicates incomplete contralateral projections of callosal axons. (G) Horizontal sections of wild-type and Shootin1 knockout mouse brains at P0 immunolabeled with anti-L1-CAM antibody (green). In Shootin1 knockout mice, the bundling of the commissural axons was disrupted (arrowheads). (H) Horizontal sections of wild-type and Shootin1 knockout mouse brains at P0. DiI crystals (magenta) were placed in the anterior piriform cortex (asterisks) to label the anterior limb of the anterior commissure. Defasciculation and misprojection of the commissural axons are indicated by the arrow and arrowhead, respectively. Dashed lines indicate the anterior limb of the anterior commissure. Abbreviations: AC, anterior commissure; ACa, anterior limb of the anterior commissure; ACp, posterior limb of the anterior commissure; CC, corpus callosum; F, fimbria; Fx, fornix; KO, Shootin1 knockout mouse; MCP, middle cerebellar peduncle; Spt, Septum; VMH, ventromedial hypothalamic nucleus; WT, wild-type mouse. Scale bars: 500 μm.
Figure 1—figure supplement 1
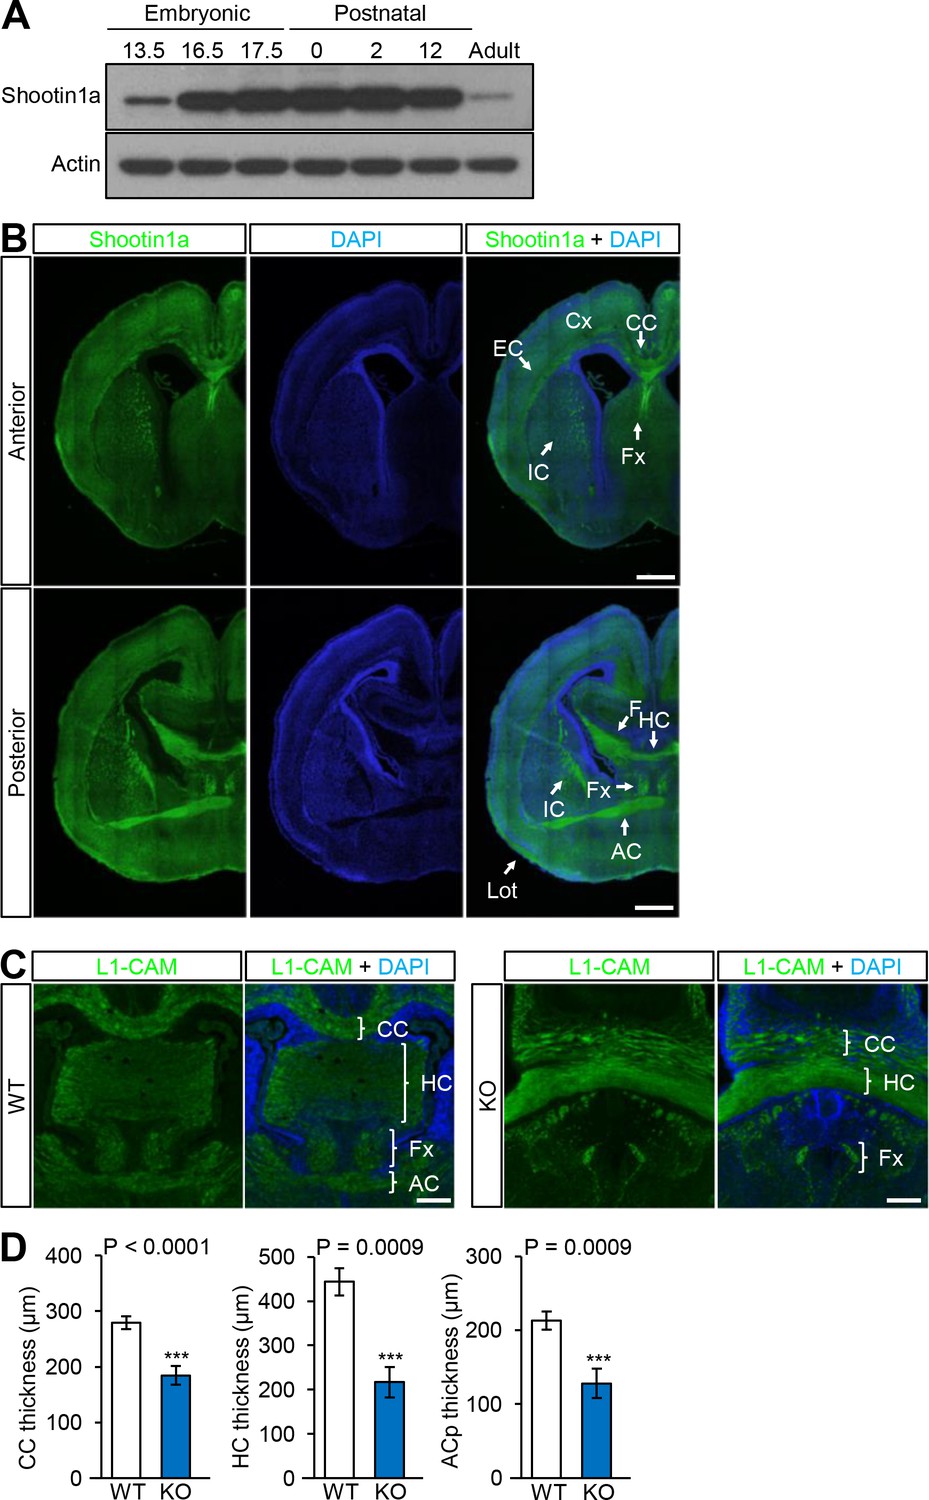
Expression and distribution of shootin1a in mouse brain and phenotype of Shootin1 knockout mice forebrain.
(A) Immunoblot analysis of shootin1a in mouse brain at various developmental stages. The same amounts (20 μg) of protein were loaded in each lane and immunoblotted by anti-shootin1a and anti-actin antibodies. (B) Coronal sections of P0 mouse brains immunolabeled with shootin1a antibody (green) and counter-stained with DAPI (blue). Bars: 500 μm. (C) Coronal sections of P0 brain from wild-type and Shootin1 knockout mouse at P0 labeled with anti-L1-CAM (green) antibody and DAPI (blue). Bars: 200 μm. (D) Quantitative analyses of the thickness of the corpus callosum (WT, n = 9; KO, n = 18), hippocampal commissure (WT, n = 5; KO, n = 6) and anterior commissure (WT, n = 9; KO, n = 18). The thicknesses were measured at the midline of the commissures of Nissl-stained sections. Data represent means ± SEM; ***p<0.01 (unpaired Student’s t-test). Abbreviations: Cx, cerebral cortex; EC, external capsule; HC, hippocampal commissure; IC, internal capsule; Lot, lateral olfactory tract.
-
Figure 1—figure supplement 1—source data 1
Quantitative analyses of the thickness of the corpus callosum, hippocampal commissure and anterior commissure related to Figure 1—figure supplement 1D.
- https://doi.org/10.7554/eLife.34593.005
Figure 1—figure supplement 2
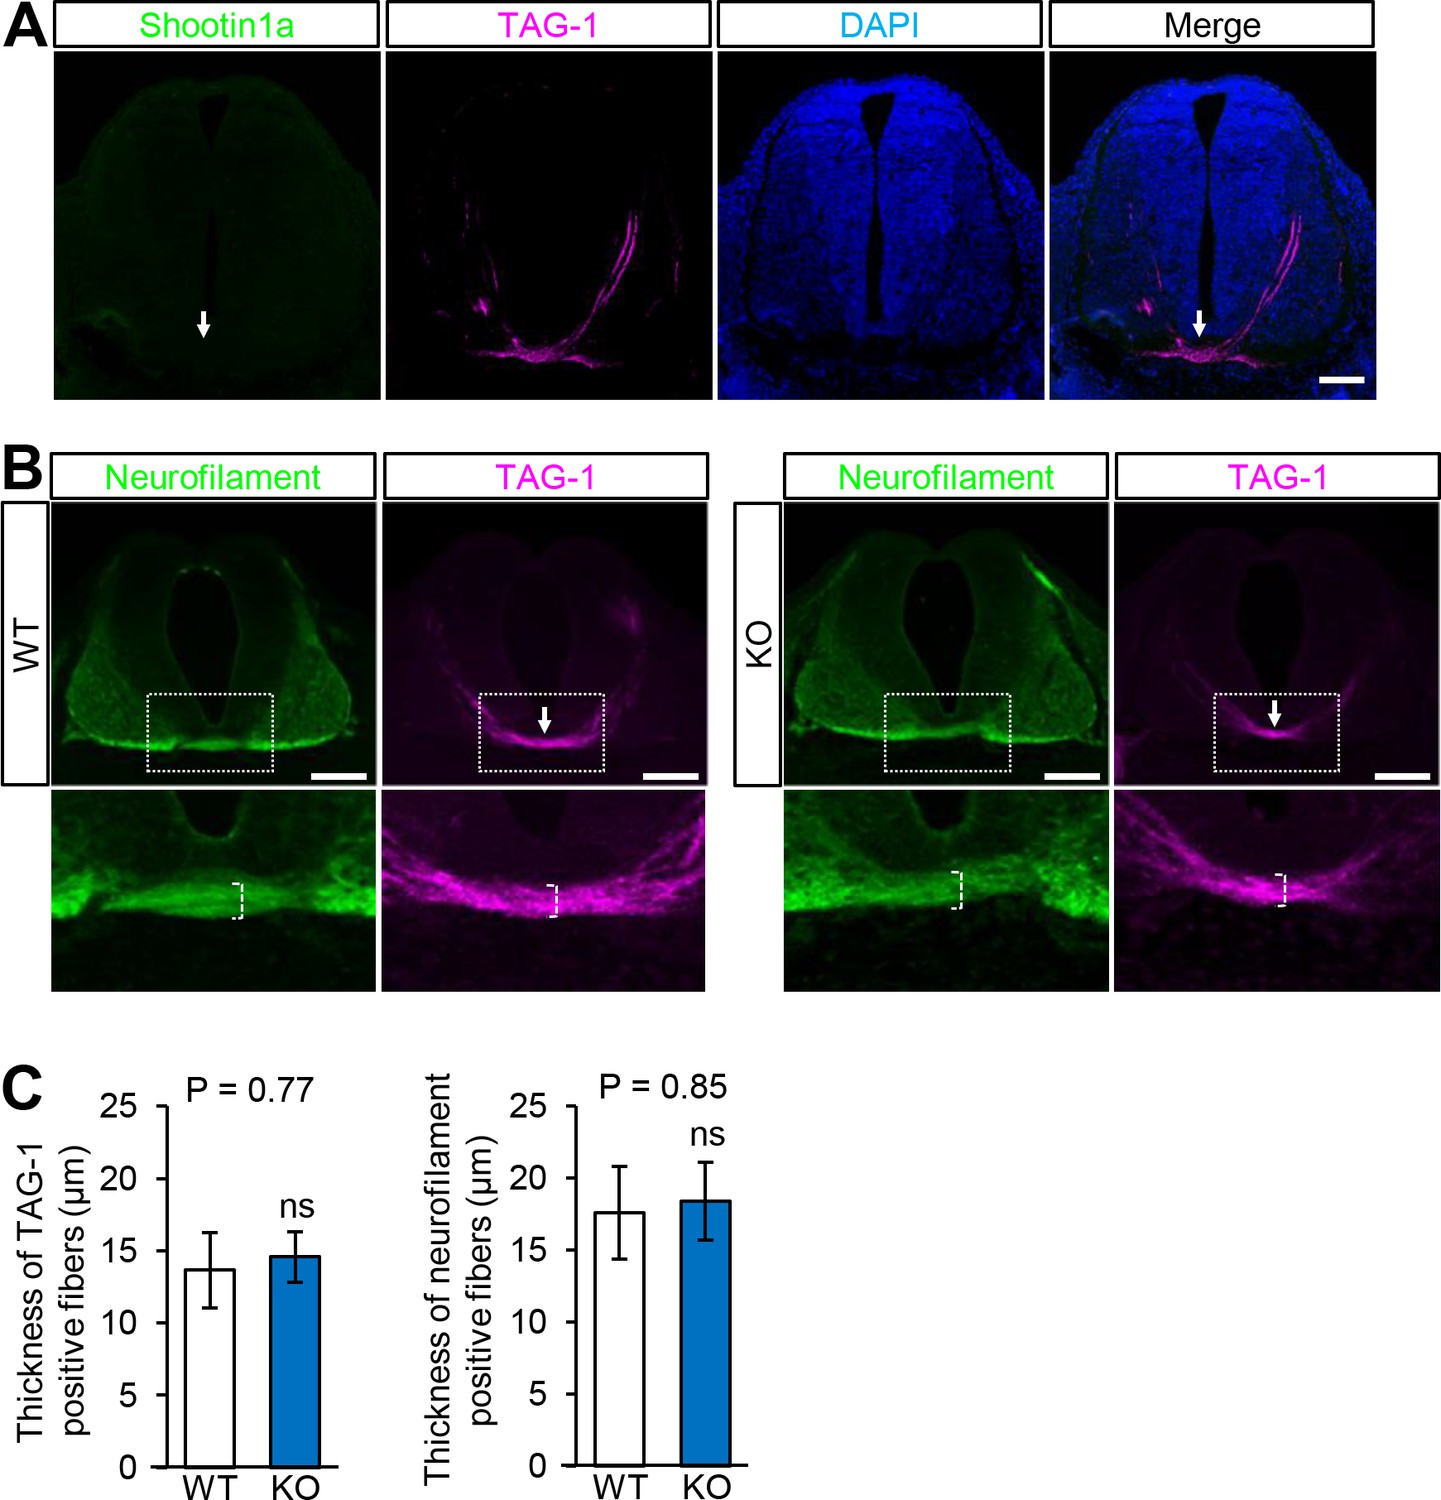
Distribution of shootin1a in mouse spinal cord and phenotype of Shootin1 knockout spinal cord.
(A) A coronal section of E12.5 mouse spinal cord labeled with anti-shootin1a antibody (green), anti-TAG-1 (magenta) antibody and DAPI (blue). TAG-1 is a marker for ventral spinal commissural axons (Dodd et al., 1988). The arrows indicate the ventral commissure. Bar: 500 μm. (B) Coronal sections of the spinal cord at E12.5 from wild-type and Shootin1 knockout mice labeled with aniti-neurofilament (green) and anti-TAG-1 (magenta) antibodies. The arrows indicate the ventral commissure. The images below show enlarged views of the ventral commissures in the rectangles. Bars: 500 μm. (C) Quantitative analyses of the thickness of the ventral spinal commissure of wild-type and Shootin1 knockout mice labeled with anti-neurofilament and anti-TAG-1 antibodies in (B). The thicknesses were measured at the midline of the commissures (B, dashed square brackets) (WT, n = 9; KO, n = 9). Data represent means ± SEM; ns, not significant (unpaired Student’s t-test).
-
Figure 1—figure supplement 2—source data 1
Quantitative analyses of the thickness of the ventral spinal commissure related to Figure 1—figure supplement 2C.
- https://doi.org/10.7554/eLife.34593.007
Figure 1—figure supplement 3
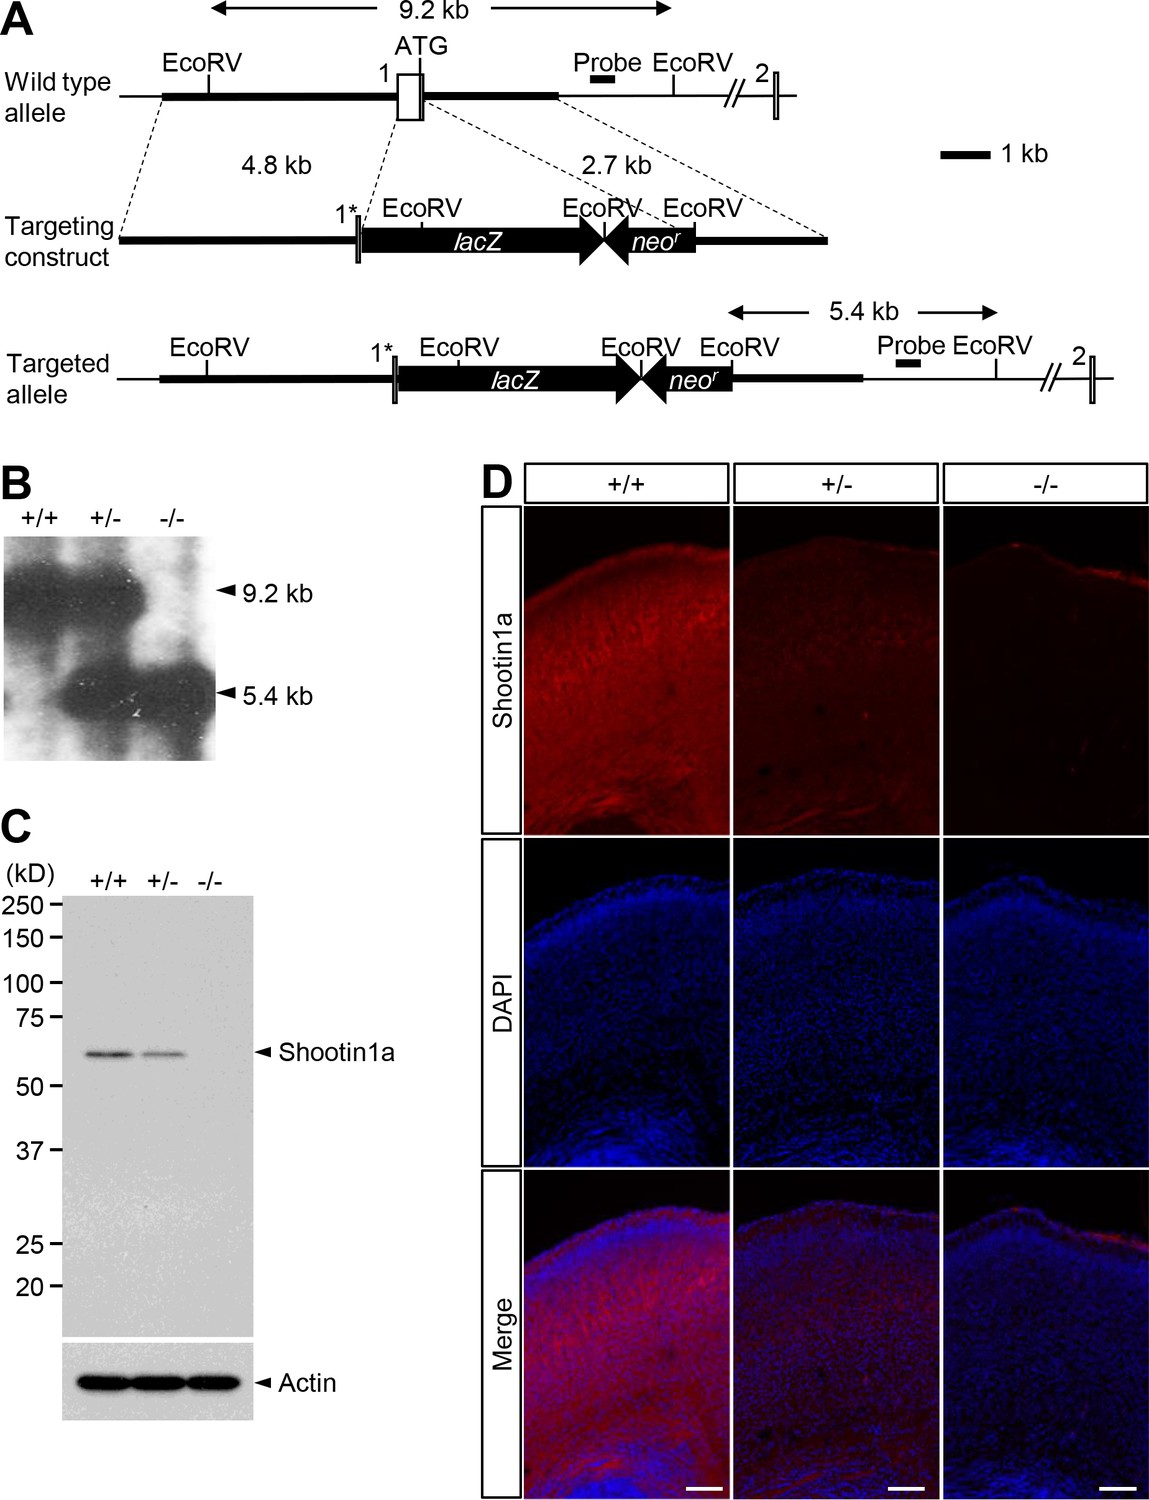
Generation of Shootin1 knockout mice.
(A) Schematic representations of Shootin1 gene-targeting strategy. Upper panel, Shootin1 genomic locus including exons 1 and 2. Middle panel, targeting vector for homologous recombination. The targeting vector deleted a 509-base genomic sequence including exon one with the start codon (asterisk). Lower panel, targeted gene after homologous recombination. The probe used in Southern blot analysis is indicated. (B) Genomic DNAs isolated from wild-type (+/+), heterozygous (+/-) and homozygous (-/-) mouse tails were digested with EcoRV and then analyzed by Southern blot analysis using the probe. DNA fragments of 9.2 and 5.4 kb are expected for the wild-type allele and mutant allele, respectively. (C) Immunoblot analysis of brain lysates prepared from wild-type (+/+), heterozygous (+/-) and homozygous (-/-) mouse brains, at P0 using anti-shootin1a and anti-actin antibodies. (D) Coronal sections of mouse cerebral cortex at P0 from wild-type (+/+), heterozygous (+/-) and homozygous (-/-) mice labeled with anti-shootin1a antibody (red) and DAPI (blue). Bars: 500 μm.
Figure 2 with 2 supplements

Netrin-1 gradients induce asymmetrically localized phosphorylation of shootin1a within single growth cones.
(A) A schematic diagram of the device with microjet arrays that generates gradients of diffusible molecules in the culture medium. (B) Time-lapse fluorescence images of fluorescent dye (Alexa Fluor 488-BSA) in the cell culture area of the device in (A, red rectangle). See Video 1. The graph (right) depicts line scans of the fluorescence intensity across the field at 10 min (black line) and 430 min (blue line) during time-lapse imaging. A stable gradient of Alexa Fluor 488-BSA was generated in the device. Bar: 100 μm. (C) Neurons cultured in the device were labeled with CMAC (blue) and exposed to gradients of netrin-1 and Alexa Fluor 488-BSA (green) for 30 min. They were then fixed and immunolabeled with an antibody that recognizes shootin1a phosphorylation at Ser249 (red). The right panels show the fluorescent signals of CMAC and phospho-shootin1a in the growth cone located in the corresponding dashed rectangle. Yellow lines and dotted lines indicate the boundary and center line of the growth cone, respectively. A higher level of phospho-shootin1a immunolabeling was observed on the netrin-1 source side. Bar: 10 μm. (D) Quantification of relative phospho-shootin1a immunolabeling levels (phosopho-shootin1a immunoreactivity/CMAC staining) in the netrin-1 source side (high side) and control side (low side) of single growth cones. n = 12 growth cones. Data represent means ± SEM; ***p<0.01 (unpaired Student’s t-test).
-
Figure 2—source data 1
Quantification of relative phospho-shootin1a immunolabeling levels related to Figure 2D.
- https://doi.org/10.7554/eLife.34593.014
Figure 2—figure supplement 1
Netrin-1 gradients produced on the substrate.
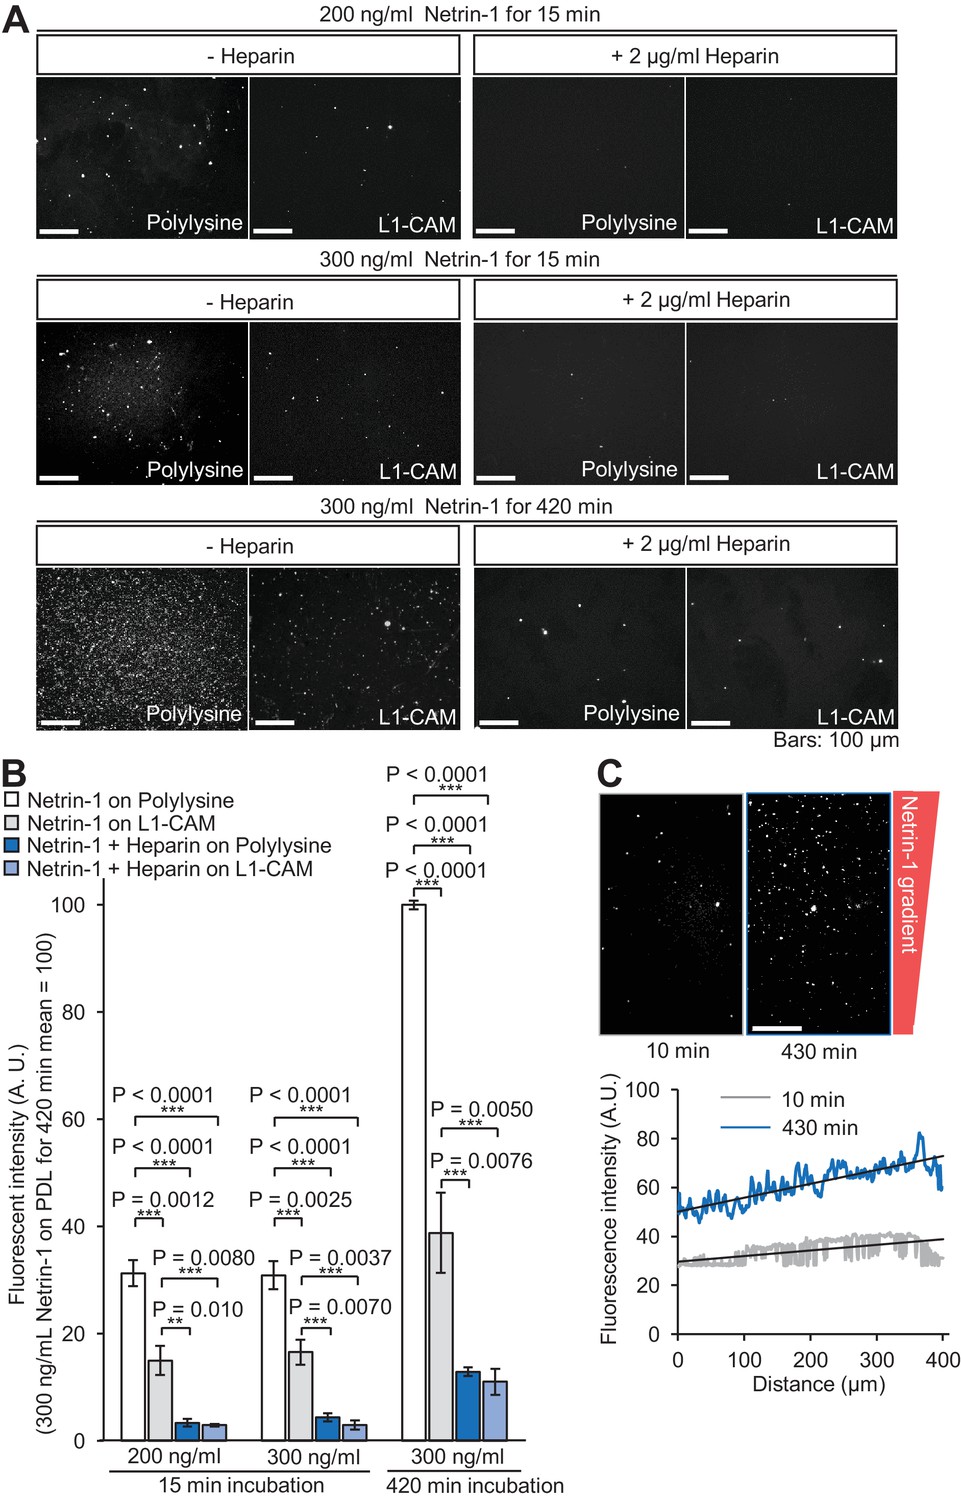
(A) Glass coverslips coated with polylysine or coated sequentially with polylysine and L1-CAM-Fc were incubated with the culture medium and netrin-1 containing a 10-His tag at the C-terminus, in the absence or presence of 2 μg/ml heparin. The glasses were then labeled with anti-His antibody and fluorescence images were acquired using a fluorescence microscope. (B) Quantitative analyses of the netrin-1 attached to the glass coverslips in (A). Fluorescence images were acquired using a fluorescence microscope and quantified using ImageJ. Data represent means ± SEM (n = 3 independent experiments); ***p<0.01; **p<0.02 (one-way ANOVA with Tukey’s post hoc test). (C) Glass coverslips coated sequentially with polylysine and L1-CAM-Fc were incubated for 10 or 430 min with the netrin-1 gradients produced by the device in Figure 2A (red rectangle). The glasses were then labeled with anti-His antibody, and fluorescence images of netrin-1 were acquired using a fluorescence microscope. The lower graph depicts line scans of the immunolabeled netrin-1 across the field (upper panels). The black lines were fitted with a least-squares method. The differences in the netrin-1 concentrations at the source side end and the other end of the area that expands 400 μm of the linear gradient, estimated by the fluorescence intensity, were 24% for 10 min and 31% for 430 min, respectively. As the regular growth cone width of cultured hippocampal neurons is about 10 μm, we estimate that the gradient steepness of netrin-1 that covers growth cones is about 0.6% at 10 min and 0.8% at 430 min. Bars: 100 μm.
-
Figure 2—figure supplement 1—source data 1
Quantitative analyses of the netrin-1 attached to the glass coverslips related to Figure 2—figure supplement 1B.
- https://doi.org/10.7554/eLife.34593.011
Figure 2—figure supplement 2

BSA gradients do not elicit polarized phosphorylation of shootin1 within growth cones.
(A) Neurons cultured in the device (Figure 2A, red rectangle) were labeled with CMAC (blue) and exposed to gradients of Alexa Fluor 488-BSA (green) for 30 min. They were then fixed and immunolabeled with an antibody that recognizes shootin1a phosphorylation at Ser249 (red). The right panels show the fluorescence signals of CMAC and phospho-shootin1a in the growth cone located in the corresponding dashed rectangle. Yellow lines and dotted lines indicate the boundary and center line of the growth cone, respectively. Bar: 10 μm. (B) Quantification of relative phospho-shootin1a immunolabeling levels (phosopho-shootin1a immunoreactivity/CMAC staining) in the BSA source side (high side) and control side (low side) of single growth cones. n = 8 growth cones. Data represent means ± SEM; ns, not significant (unpaired Student’s t-test).
-
Figure 2—figure supplement 2—source data 1
Quantification of relative phospho-shootin1a immunolabeling levels related to Figure 2—figure supplement 2B.
- https://doi.org/10.7554/eLife.34593.013
Figure 3

Pak1-mediated shootin1a phosphorylation enhances the interaction between shootin1a and L1-CAM.
(A) In vitro binding assay using purified shootin1a-WT (100 nM) and purified GST-L1-CAM-ICD (100 nM). Proteins were incubated with Glutathione Sepharose 4B and GST-L1-CAM-ICD was eluted. The eluate was then analyzed by SDS-PAGE and CBB staining; 0.2% of the input proteins were also analyzed. (B and C) In vitro binding assay using purified shootin1a-WT or purified shootin1a-DD and purified GST-L1-CAM-ICD. Shootin1a-DD or shootin1a-WT at increasing concentrations was incubated with GST-L1-CAM-ICD and Glutathione Sepharose 4B. GST-L1-CAM-ICD was eluted. After SDS-PAGE, the eluate was immunoblotted with anti-shootin1 antibody or stained with CBB (B), and the bound shootin1a-DD and shootin1a-WT were then quantified (C). Data represent means ± SEM (n = 3 independent experiments). (D and E) In vitro binding assay using Pak1-phosphorylated purified shootin1a and purified GST-L1-CAM-ICD. Shootin1a-WT (100 nM) or Pak1-phosphorylated shootin1a-WT (100 nM) was incubated with GST-L1-CAM-ICD and Glutathione Sepharose 4B. GST-L1-CAM-ICD was eluted. After SDS-PAGE, the eluate was immunoblotted with anti-shootin1 antibody or stained with CBB (D). Input proteins (1%) were also analyzed with anti-shootin1, anti-pSer101-shootin1 or anti-pSer249-shootin1 antibody. Quantitative data for bound shootin1a are shown in (E) (n = 3 independent experiments). Data represent means ± SEM; ***p<0.01 (unpaired Student’s t-test).
-
Figure 3—source data 1
Quantitative data for Kd value related to Figure 3C.
- https://doi.org/10.7554/eLife.34593.017
-
Figure 3—source data 2
Quantitative data for bound shootin1a related to Figure 3E.
- https://doi.org/10.7554/eLife.34593.018
Figure 4
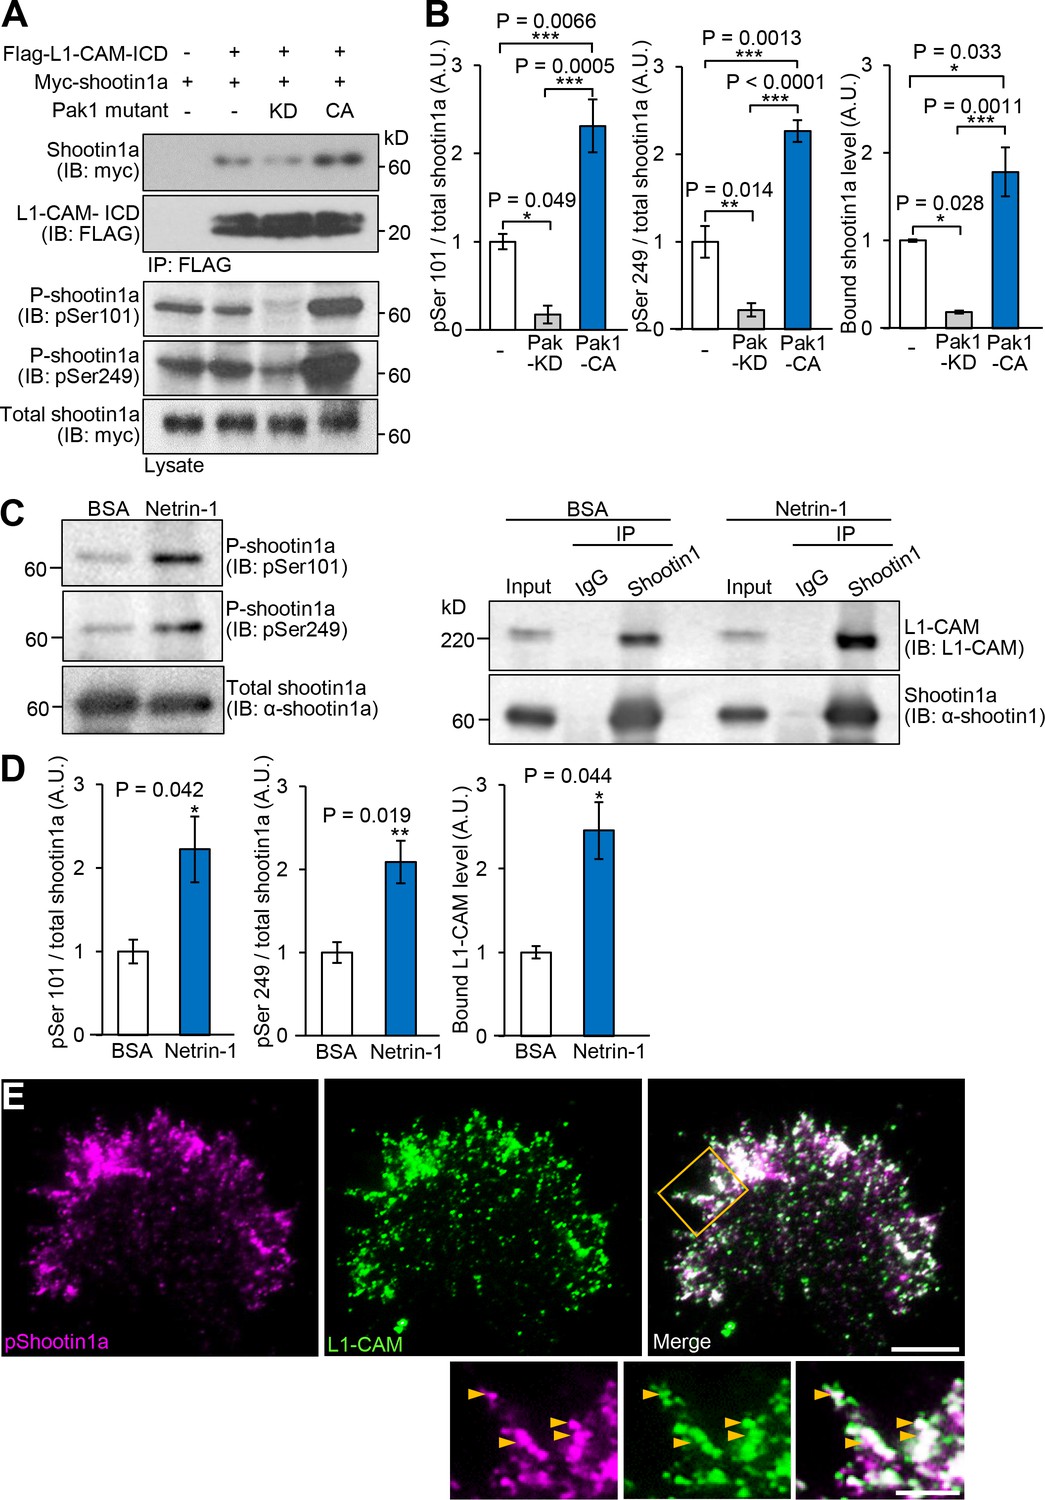
Netrin-1–induced Pak1-mediated shootin1a phosphorylation enhances the interaction between shootin1a and L1-CAM.
(A and B) Co-immunoprecipitation of myc-shootin1a and FLAG-L1-CAM-ICD in HEK293T cells. Cells were transfected with vectors to express myc-shootin1a and FLAG-L1-CAM-ICD; some of them were also co-transfected with a vector to express dominant negative Pak1 (KD) or constitutively active Pak1 (CA) as indicated. Cell lysates were then incubated with anti-FLAG antibody. The immunoprecipitates were immunoblotted with anti-myc or anti-FLAG antibody (A). Cell lysates (1%) were also analyzed with anti-pSer101-shootin1, anti-pSer249-shootin1, or anti-myc antibody. Quantitative data for phosphorylated and bound shootin1a are shown in (B) (n = 3 independent experiments). Data represent means ± SEM; ***p<0.01; **p<0.02; *p<0.05 (One-way ANOVA with Tukey’s post hoc test). (C and D) Co-immunoprecipitation of shootin1a and L1-CAM in cultured cortical neurons. After incubation of neurons with 4.4 nM netrin-1 or BSA (control) for 1 hr, cell lysates were prepared and incubated with anti-shootin1 antibody (right panel). The immunoprecipitates were immunoblotted with anti-shootin1 or anti-L1-CAM antibody. The cell lysates (5%) were also analyzed with anti-pSer101-shootin1, anti-pSer249-shootin1, or anti-shootin1a antibody (left panel). Quantitative data for phosphorylated shootin1a and bound L1-CAM are shown in (D) (n = 3 independent experiments). Data represent means ± SEM; **p<0.02; *p<0.05 (Unpaired Student’s t-test). (E) Fluorescence images of an axonal growth cone labeled with anti-pSer249-shootin1a (magenta) and anti-L1-CAM (green) antibodies. The cells were observed using a TIRF microscope. An enlarged view of the filopodium in the rectangle is shown in the lower panel. Arrowheads indicate phosphorylated shootin1a colocalized with L1-CAM. Bar: 5 μm (in the inset, 2 μm).
-
Figure 4—source data 1
Quantitative data for phosphorylated and bound shootin1a related to Figure 4B.
- https://doi.org/10.7554/eLife.34593.020
-
Figure 4—source data 2
Quantitative data for phosphorylated shootin1a and bound L1-CAM related to Figure 4D.
- https://doi.org/10.7554/eLife.34593.021
Figure 5
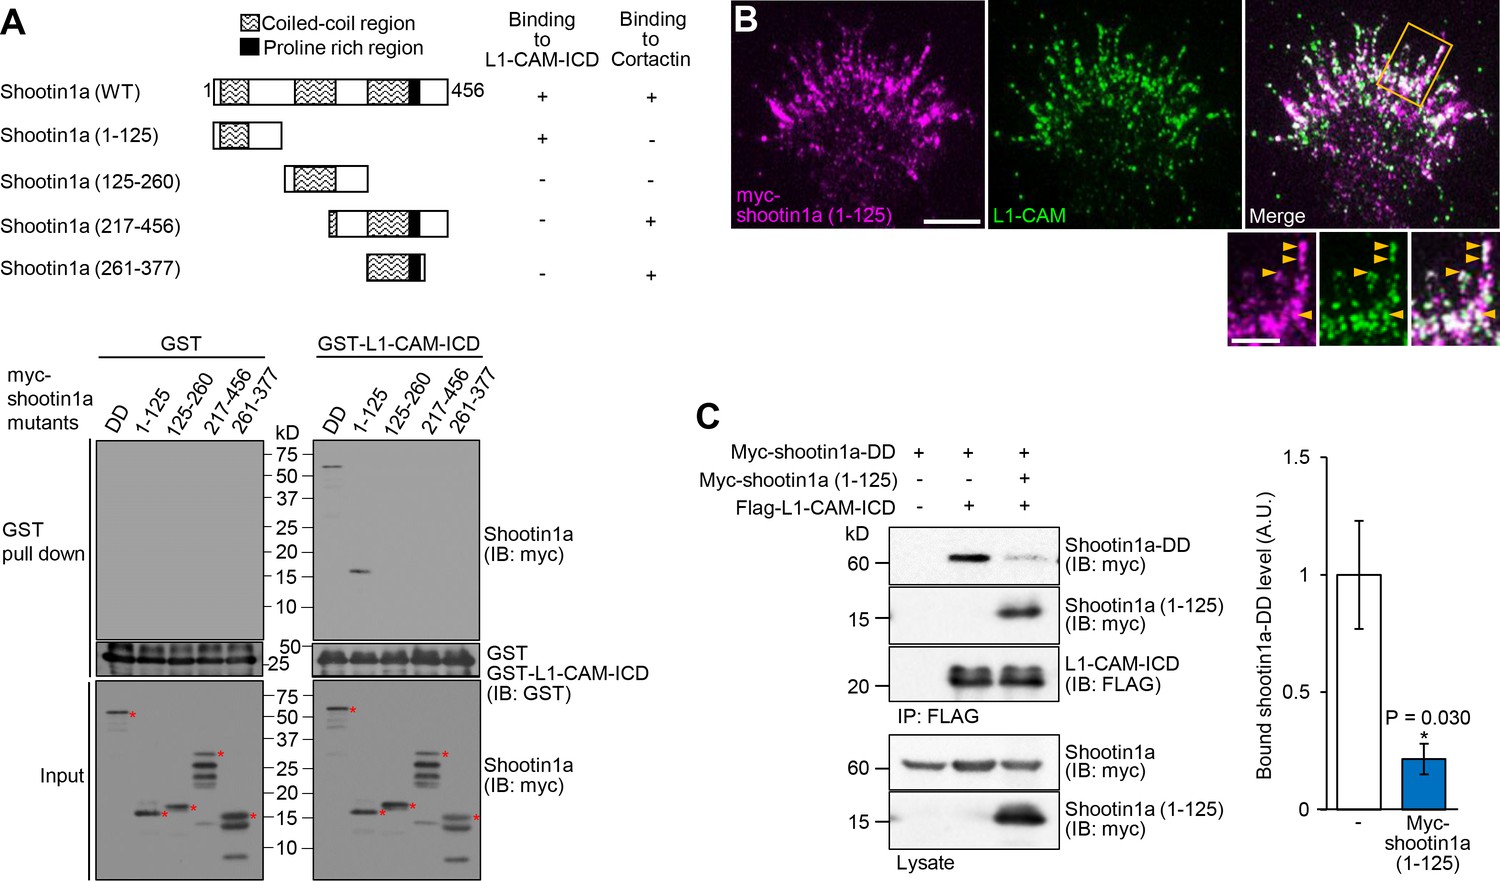
Shootin1a (1-125) interacts with L1-CAM and disturbs the interaction between shootin1a and L1-CAM.
(A) Upper panel: schematic representation of shootin1a (WT) and shootin1a deletion mutants, and their ability to interact with L1-CAM-ICD and cortactin. Lower panel: in vitro binding assay using purified myc-tagged shootin1a mutants and purified GST-L1-CAM-ICD. Myc-shootin1a mutants (100 nM) were incubated with GST-L1-CAM-ICD (100 nM) and Glutathione Sepharose 4B. GST-L1-CAM-ICD was eluted. After SDS-PAGE, the eluate was immunoblotted with anti-myc or anti-GST antibody. Asterisks denote myc shootin1a mutants. (B) Neurons transfected with myc-shootin1a (1-125) were labeled with anti-myc (magenta) and anti-L1-CAM (green) antibodies. The cells were observed using a TIRF microscope. An enlarged view of the filopodium in the rectangle is shown in the inset. Arrowheads indicate shootin1a (1-125) colocalized with L1-CAM. Bar: 5 μm (in the inset, 2 μm). (C) Overexpressed shootin1a (1-125) inhibits the interaction between shootin1a and L1-CAM-ICD. HEK293T cells were transfected with vectors to express myc-shootin1a and FLAG-L1-CAM-ICD; some of them were also co-transfected with a vector to overexpress myc-shootin1a (1-125) as indicated. Cell lysates were prepared and incubated with anti-FLAG antibody. The immunoprecipitates were immunoblotted with anti-myc or anti-FLAG antibody. The cell lysates (1%) were also analyzed with anti-myc antibody. The graph (right) shows quantitative data for bound shootin1a-DD (n = 3 independent experiments). Data represent means ± SEM; *p<0.05 (unpaired Student’s t-test).
-
Figure 5—source data 1
Quantitative data for bound shootin1a-DD related to Figure 5C.
- https://doi.org/10.7554/eLife.34593.023
Figure 6 with 1 supplement
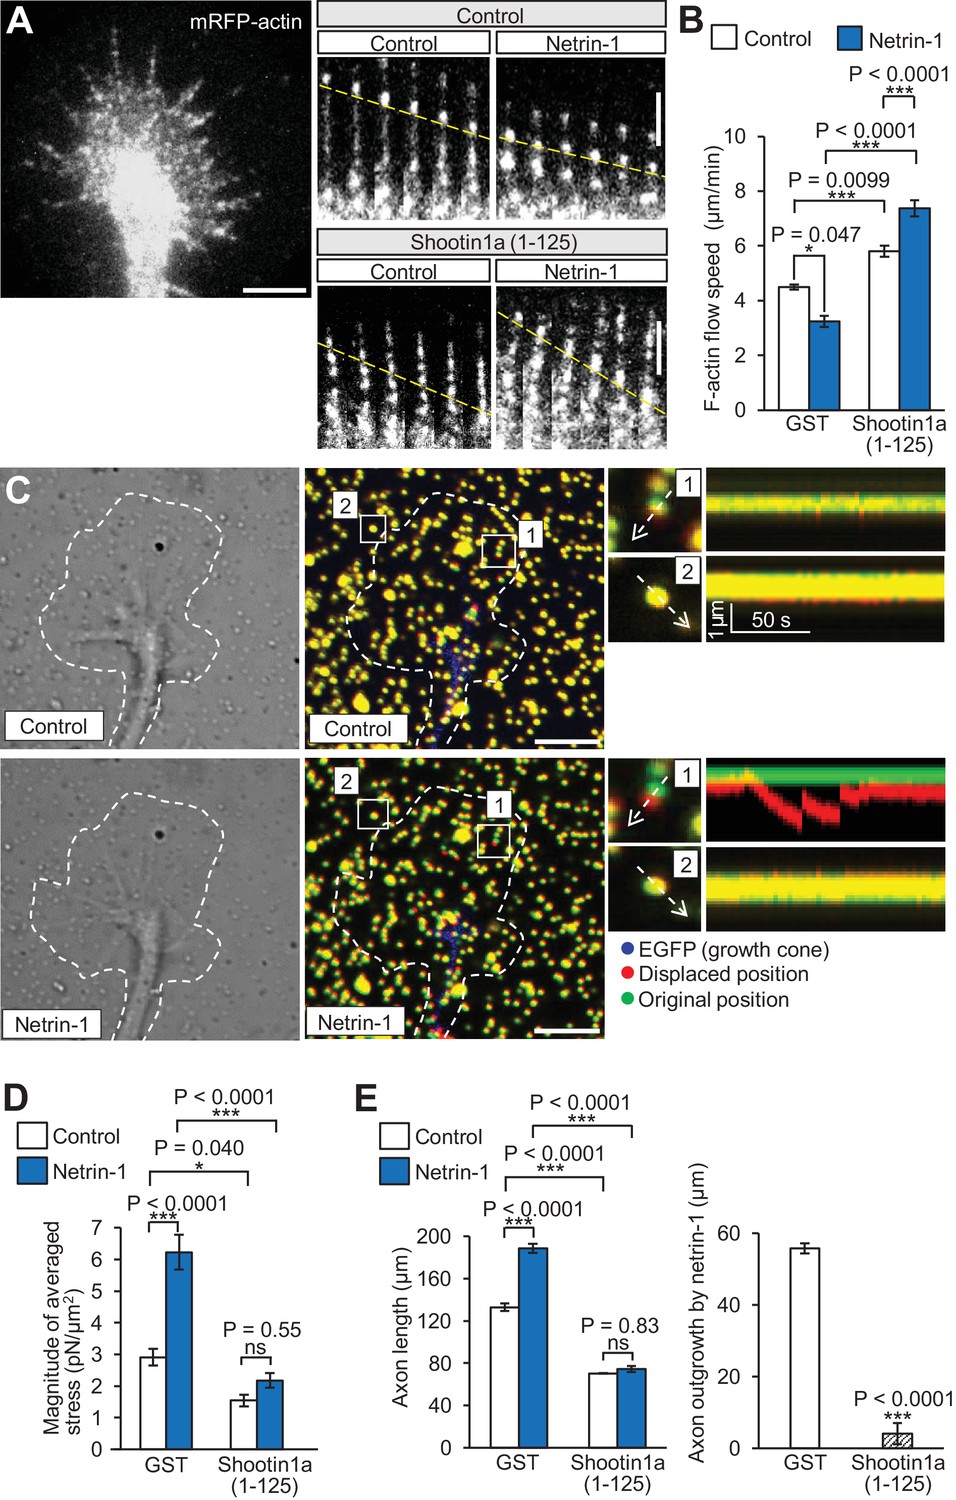
Shootin1a–L1-CAM interaction mediates netrin-1–induced F-actin adhesion coupling and mechanoresponse for axon outgrowth.
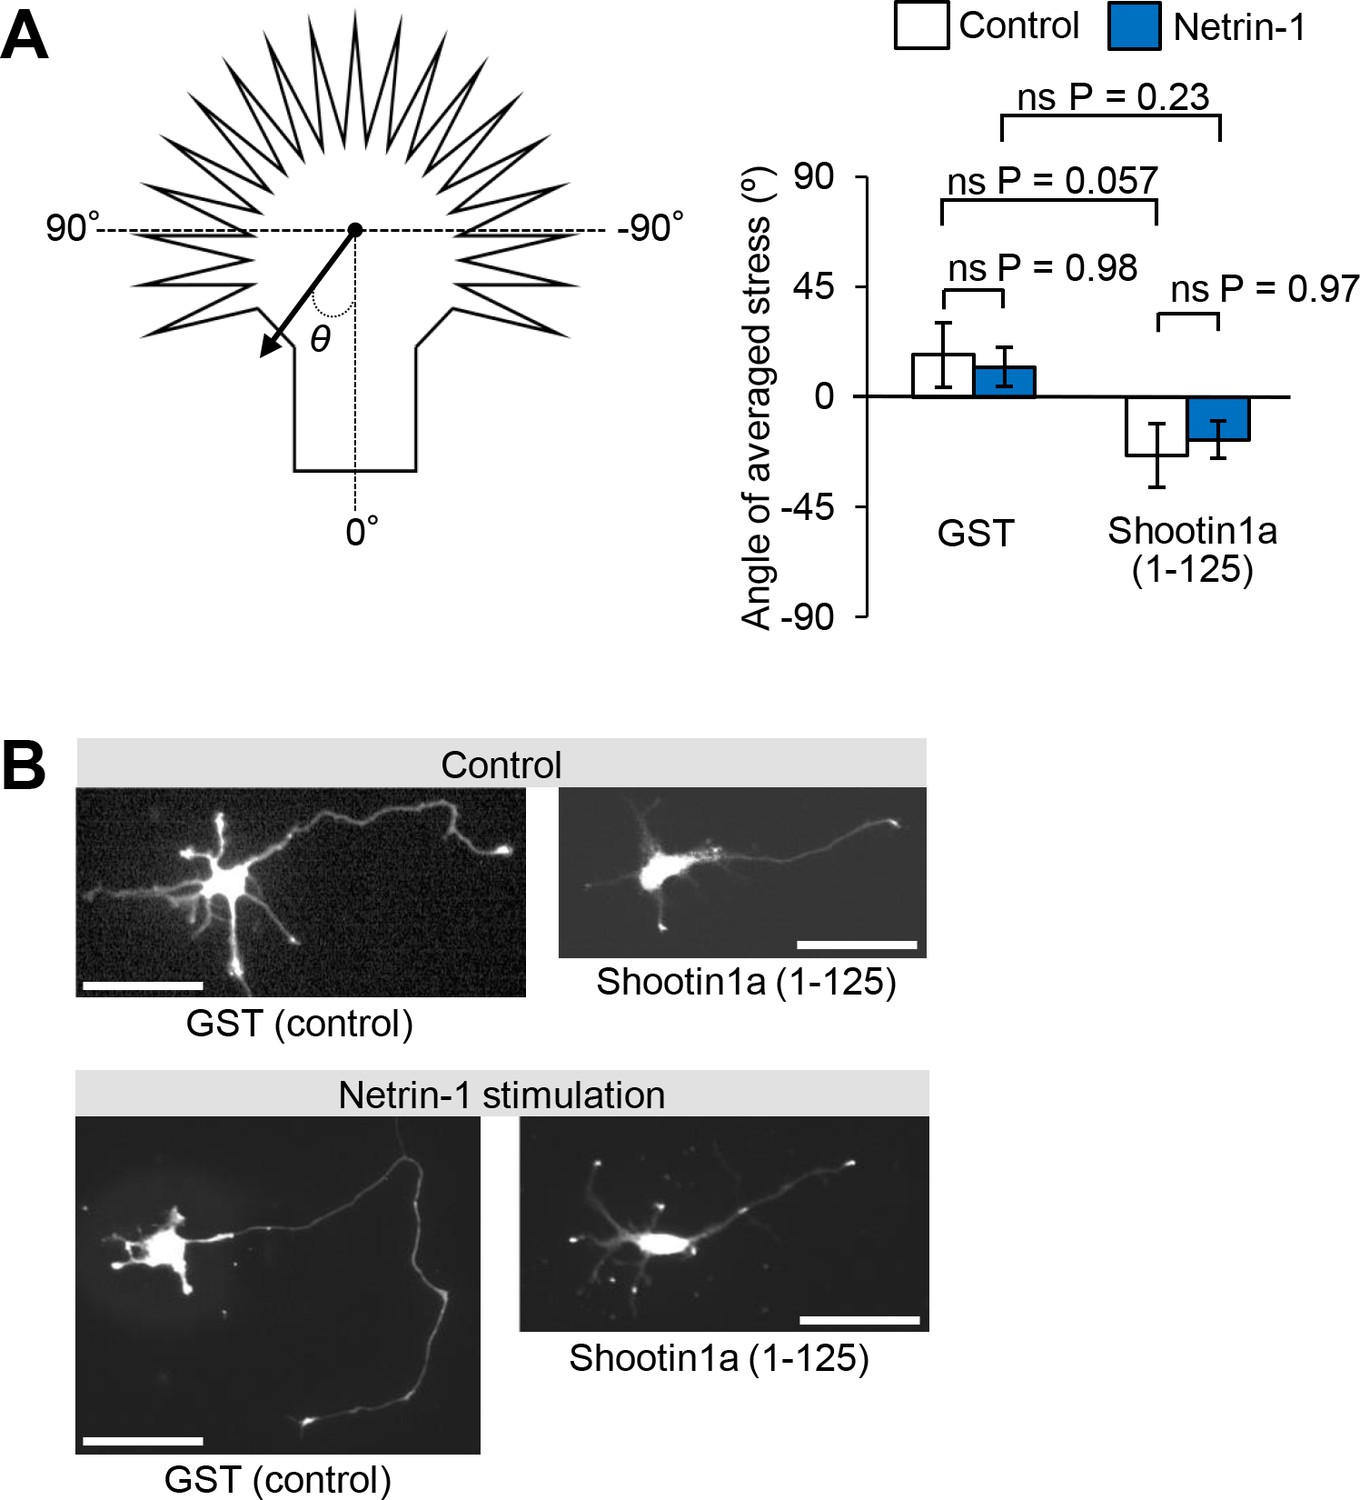
(A) Fluorescent feature images of mRFP-actin at axonal growth cones overexpressing myc-GST (control) or myc-shootin1a (1-125) in the absence (control) or presence of 4.4 nM netrin-1 (see Video 2). Kymographs of the fluorescent features of mRFP-actin in filopodia at 5 s intervals are shown (F-actin flows are indicated by dashed yellow lines). (B) F-actin retrograde flow speed measured from the kymograph analysis in A; 120 fluorescent features (47 growth cones) were analyzed. One-way ANOVA with Tukey’s post hoc test was used. (C) DIC and fluorescence images (left panel) showing an axonal growth cone of a DIV2 neuron overexpressing EGFP and cultured on L1-CAM–coated polyacrylamide gel with embedded 200 nm fluorescent beads. The panels show representative images from time-lapse series taken every 3 s for 150 s before (control) and 60 min after netrin-1 (4.4 nM) stimulation (see Video 3). The original and displaced positions of the beads in the gel are indicated by green and red colors, respectively. Dashed lines indicate the boundary of the growth cone. The kymographs (right panel) along the axis of bead displacement (white dashed arrows) at the indicated areas 1 and 2 of the growth cone show movement of beads recorded every 3 s. The bead in area two is a reference bead. (D) Analyses of the magnitude of the traction forces under axonal growth cones overexpressing myc-GST (control) or myc-shootin1a (1-125) before (control) or after netrin-1 stimulation (see Figure 6—figure supplement 1A for the direction of the traction forces, n = 14 growth cones). One-way ANOVA with Tukey’s post hoc test was performed. (E) Three hours after plating, hippocampal neurons overexpressing myc-GST (control) or myc-shootin1a (1-125) were incubated with BSA (control) or 4.4 nM netrin-1 for 40 hr, and then immunolabeled by anti-myc antibody (see Figure 6—figure supplement 1B). Axon length was then analyzed (n = 909 neurons). One-way ANOVA with Schaffer’s post hoc test was performed in the left graph, while an unpaired Student’s t-test was used in the right graph. Data represent means ± SEM; ***p<0.01; *p<0.05; ns, not significant. Bars: 5 μm (in the kymographs of A, 2 μm).
-
Figure 6—source data 1
Quantitative data for F-actin retrograde flow speed related to Figure 6B.
- https://doi.org/10.7554/eLife.34593.027
-
Figure 6—source data 2
Quantitative data for the magnitude of the traction forces related to Figure 6D.
- https://doi.org/10.7554/eLife.34593.028
-
Figure 6—source data 3
Quantitative data for axon length and axon outgrowth by netrin-1 related to Figure 6E.
- https://doi.org/10.7554/eLife.34593.029
Figure 6—figure supplement 1
Shootin1a–L1-CAM interaction mediates netrin-1–induced axon outgrowth.
(A) Statistical analyses of the angle (°) of the traction forces under axonal growth cones overexpressing myc-GST (control) or myc-shootin1a (1-125) before (control) or after netrin-1 stimulation (see Figure 6C and D, n = 14 growth cones). Data represent means ± SEM; ns, not significant (one-way ANOVA with Tukey’s post hoc test). (B) Three hours after plating, hippocampal neurons overexpressing myc-GST (control) or myc-shootin1a (1-125) were incubated with BSA (control) or 4.4 nM netrin-1 for 40 hr; they were then immunolabeled by anti-myc antibody (see also quantitative data in Figure 5E). Bars: 50 μm.
-
Figure 6—figure supplement 1—source data 1
Statistical analyses of the angle (°) of the traction forces related to Figure 6—figure supplement 1A.
- https://doi.org/10.7554/eLife.34593.026
Figure 7 with 4 supplements
Shootin1a and shootin1a–L1-CAM interaction mediate netrin-1–induced axon guidance.
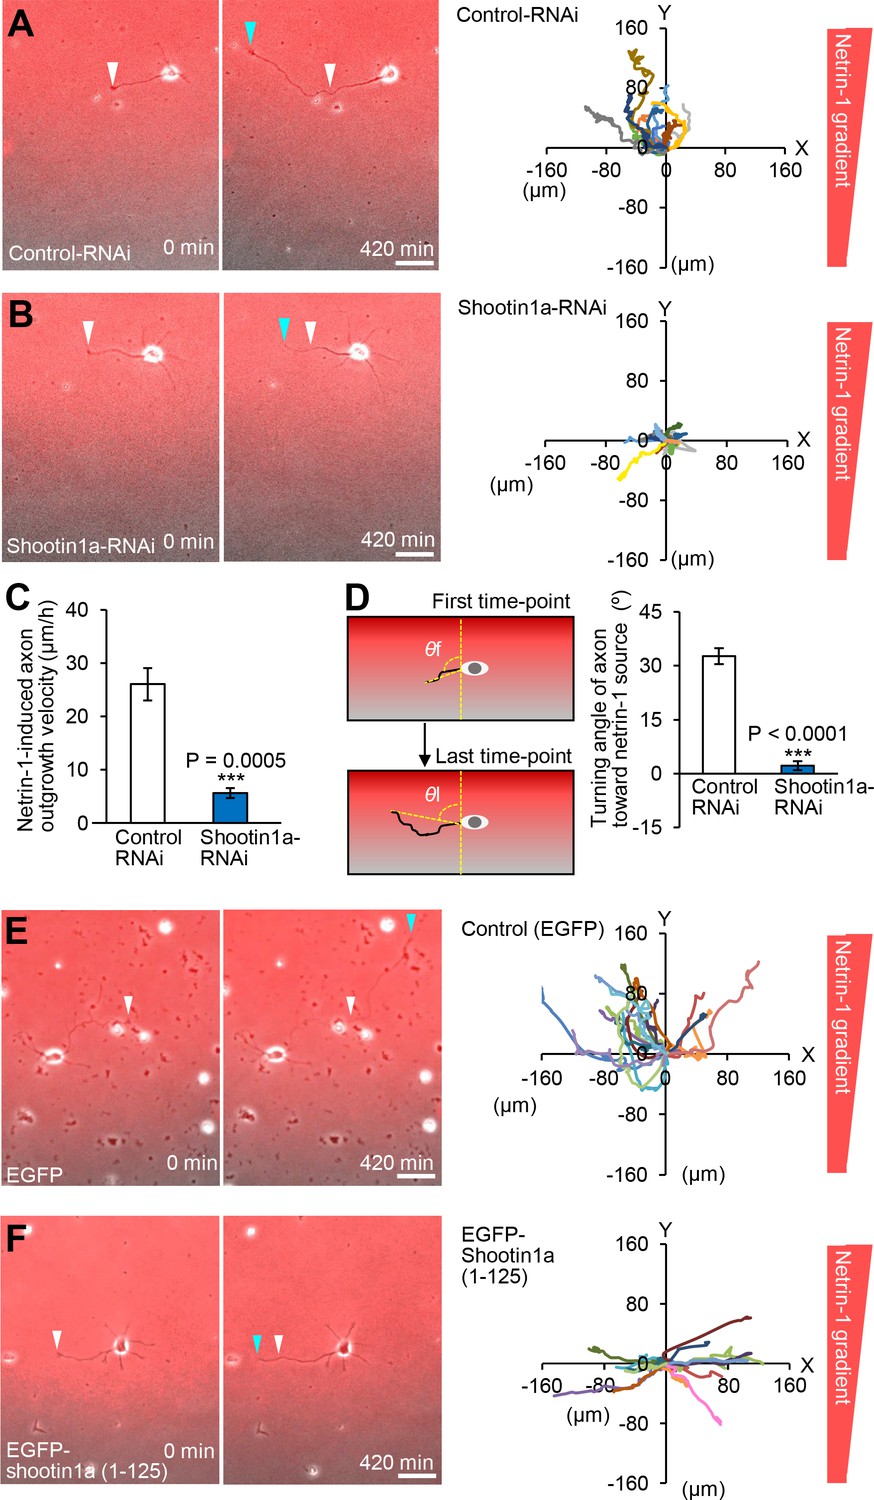
(A and B) Time-lapse phase-contrast/fluorescence images of hippocampal neurons expressing control miRNA (A) and shootin1a miRNA (B) under the gradients of netrin-1 and Alexa Fluor 594-BSA. White and blue arrowheads indicate growth cones at the first and last time-points, respectively. See Videos 6 and 7. The right panels depict trajectories of individual growth cone migrations. The initial growth cone positions are normalized at (x = 0 μm, y = 0 μm). Bars: 50 μm. (C) Axon outgrowth velocity obtained from the analyses in (A and B) (n = 24 growth cones). See also the legend for Figure 8C about quantitative data. (D) Turning angle of axon toward the netrin-1 source was obtained from the analyses in (A and B), by calculating the difference between the angles of the axonal tip at the first and last time-points of the observations (θf - θl). The graph shows quantified data (n = 24 growth cones). See also the legend for Figure 8D about quantitative data. (E and F) Time-lapse phase-contrast/fluorescence images of hippocampal neurons expressing EGFP (control) (E) and EGFP-shootin1a (1-125) (F) under gradients of netrin-1 and Alexa Fluor 594-BSA (red). White and blue arrowheads indicate growth cones at the first and last time-points, respectively. See Videos 8 and 9. The right panels depict trajectories of individual growth cone migrations. The initial growth cone positions are normalized at (x = 0 μm, y = 0 μm). See also quantitative data in Figure 7—figure supplement 3. Bars: 50 μm. Data represent means ± SEM; ***p<0.01 (one-way ANOVA with Schaffer’s post hoc test).
-
Figure 7—source data 1
Quantitative data for axon outgrowth velocity related to Figure 7C.
- https://doi.org/10.7554/eLife.34593.048
-
Figure 7—source data 2
Quantitative data for turning angle of axon toward the netrin-1 source related to Figure 7D.
- https://doi.org/10.7554/eLife.34593.049
Figure 7—figure supplement 1
Soluble and substrate-bound netrin-1 contribute to axon turning.
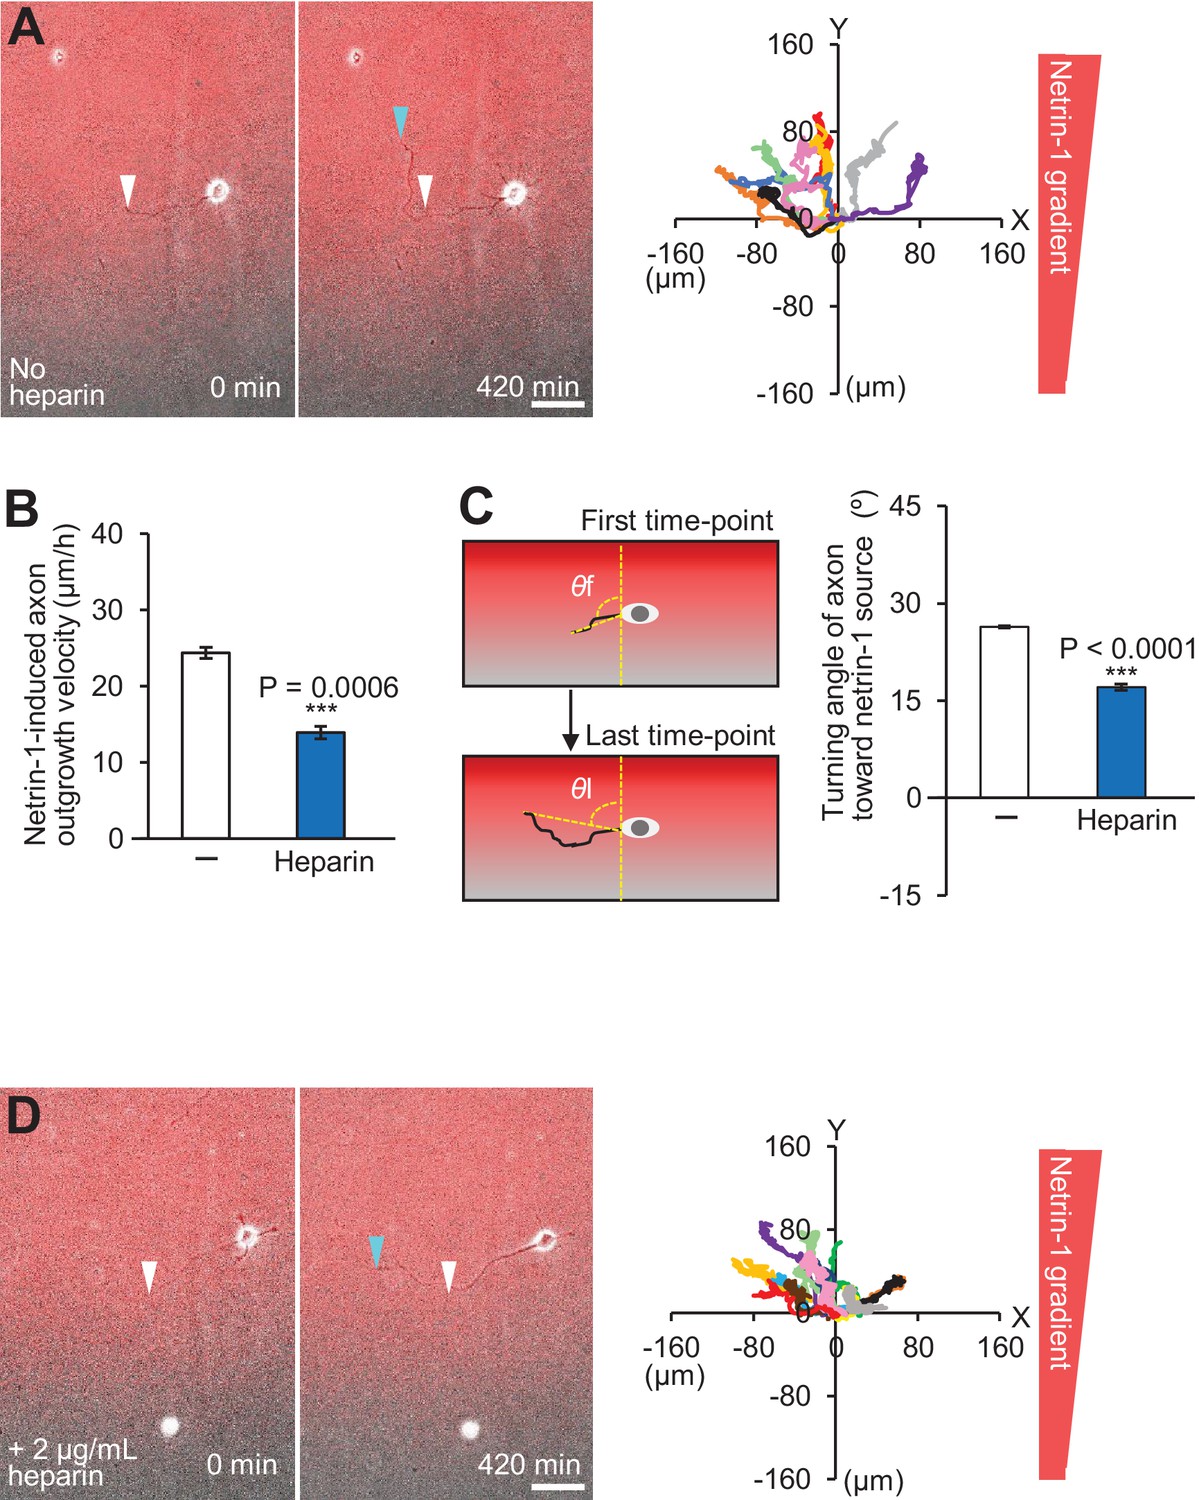
(A and D) Time-lapse phase-contrast/fluorescence images of hippocampal neurons under the gradients of netrin-1 and Alexa Fluor 594-BSA without (A) and with (D) 2 μg/ml heparin. White and blue arrowheads indicate growth cones at the first and last time-points, respectively. See Videos 4 and 5. The right panels depict trajectories of individual growth cone migrations. The initial growth cone positions are normalized at (x = 0 μm, y = 0 μm). Bars: 50 μm. (B) Axon outgrowth velocity obtained from the analyses in (A and D) (n = 22 growth cones). (C) Turning angle of axon toward the netrin-1 source was obtained from the analyses in (A and D), by calculating the difference between the angles of the axonal tip at the first and last time-points of the observations (θf - θl). The graph shows quantified data (n = 22 growth cones). Data represent means ± SEM; ***p<0.01 (unpaired Student’s t-test).
-
Figure 7—figure supplement 1—source data 1
Quantitative data for axon outgrowth velocity related to Figure 7—figure supplement 1B.
- https://doi.org/10.7554/eLife.34593.036
-
Figure 7—figure supplement 1—source data 2
Quantitative data for turning angle of axon toward the netrin-1 source related to Figure 7—figure supplement 1C.
- https://doi.org/10.7554/eLife.34593.037
Figure 7—figure supplement 2
Shootin1 knockout leads to inhibition of netrin-1–induced axon outgrowth and turning.
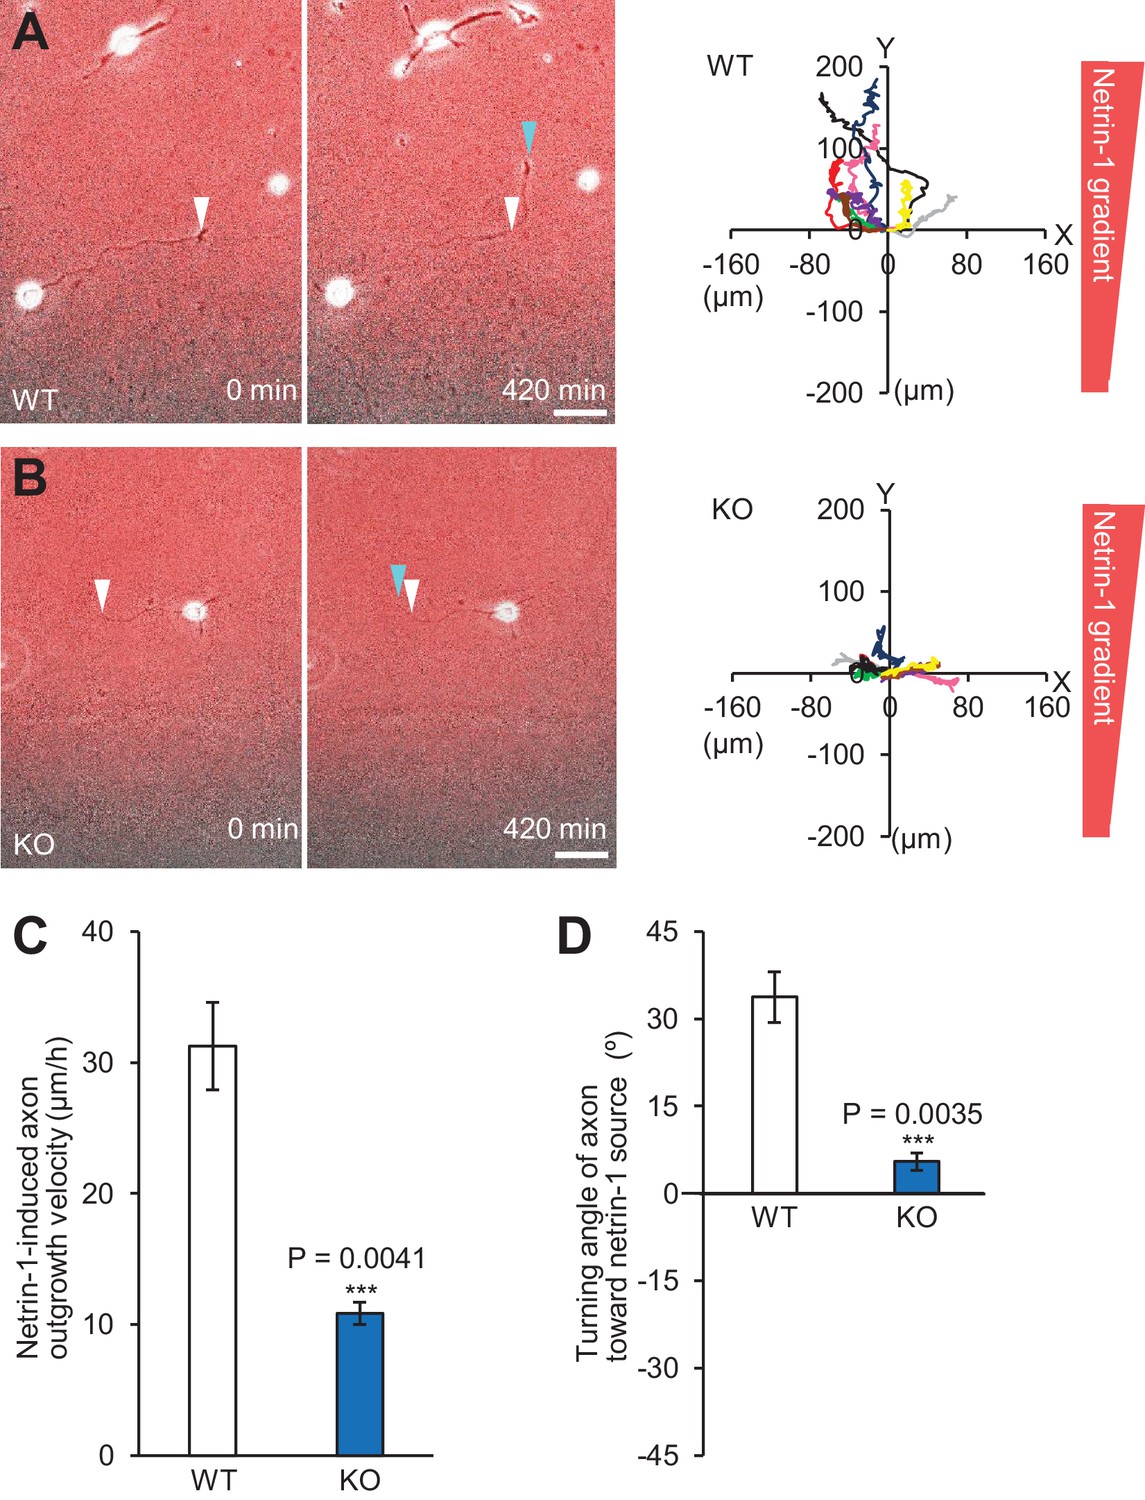
(A and B) Time-lapse phase-contrast/fluorescence images of wild-type (A) and Shootin1 knockout (B) neurons under the gradients of netrin-1 and Alexa Fluor 594-BSA. White and blue arrowheads indicate growth cones at the first and last time-points, respectively. The right panels depict trajectories of individual growth cone migrations. The initial growth cone positions are normalized at (x = 0 μm, y = 0 μm). Bars: 50 μm. (C) Axon outgrowth velocity obtained from the analyses in (A and B) (n = 18 growth cones). (D) Turning angle of axon toward the netrin-1 source was obtained from the analyses in (A and B), by calculating the difference between the angles of the axonal tip at the first and last time-points of the observations (θf - θl). The graph shows quantified data (n = 18 growth cones). Data represent means ± SEM; ***p<0.01 (unpaired Student’s t-test).
-
Figure 7—figure supplement 2—source data 1
Quantitative data for axon outgrowth velocity related to Figure 7—figure supplement 2C.
- https://doi.org/10.7554/eLife.34593.039
-
Figure 7—figure supplement 2—source data 2
Quantitative data for turning angle of axon toward the netrin-1 source related to Figure 7—figure supplement 2D.
- https://doi.org/10.7554/eLife.34593.040
Figure 7—figure supplement 3
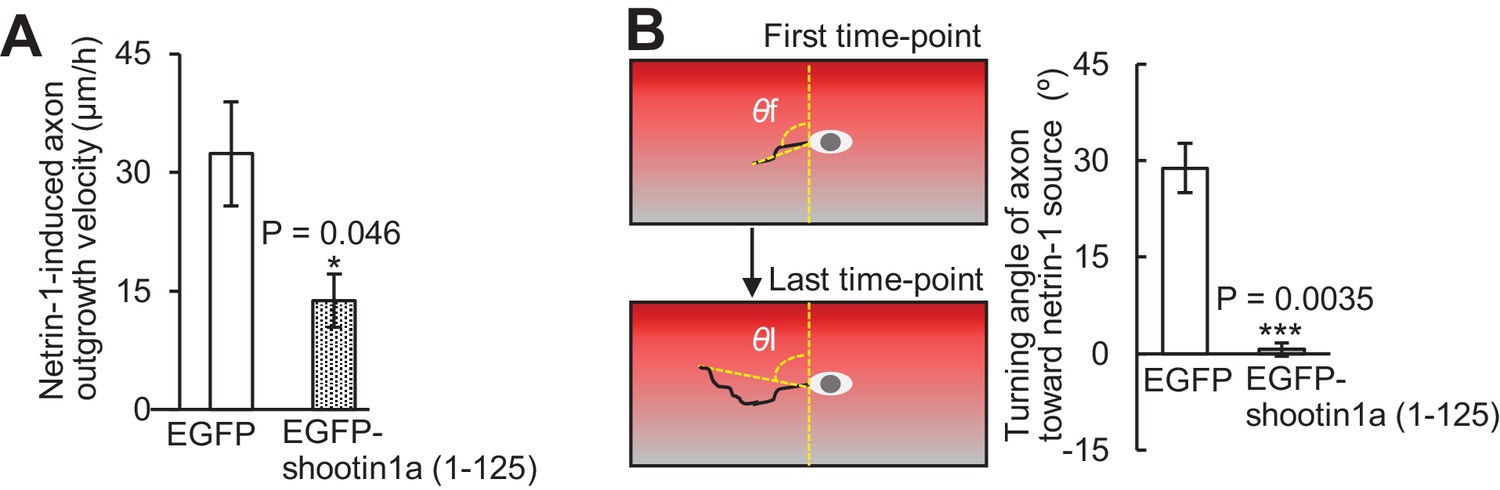
Shootin1a–L1-CAM interaction mediates netrin-1–induced axon guidance.
(A) Axon outgrowth velocity obtained from the analyses in Figure 7E and F (n = 33 growth cones). (B) Turning angle of axon toward the netrin-1 source was obtained from the analyses in Figure 7E and F, by calculating the difference between the angles of the axonal tip at the first and last time-points of the observations (θf - θl). The graph shows quantified data (n = 33 growth cones). Data represent means ±SEM; ***, p<0.01; *, p<0.05 (unpaired Student’s t-test).
-
Figure 7—figure supplement 3—source data 1
Quantitative data for axon outgrowth velocity related to Figure 7—figure supplement 3A.
- https://doi.org/10.7554/eLife.34593.042
-
Figure 7—figure supplement 3—source data 2
Quantitative data for turning angle of axon toward the netrin-1 source related to Figure 7—figure supplement 3B.
- https://doi.org/10.7554/eLife.34593.043
Figure 7—figure supplement 4

Shootin1a–L1-CAM interaction mediates netrin-1–induced axon guidance on laminin.
(A and E) Time-lapse phase-contrast/fluorescence images of hippocampal neurons expressing EGFP (control) (A) and EGFP-shootin1a (1-125) (E) on a laminin surface under gradients of netrin-1 and Alexa Fluor 594-BSA (red). White and blue arrowheads indicate growth cones at the first and last time-points, respectively. The right panels depict trajectories of individual growth cone migrations. The initial growth cone positions are normalized at (x = 0 μm, y = 0 μm). Bars: 50 μm. (B) Axon outgrowth velocity obtained from the analyses in (A and E) (n = 21 growth cones). (C) Turning angle of axon toward the netrin-1 source was obtained from the analyses in (A and E), by calculating the difference between the angles of the axonal tip at the first and last time-points of the observations (θf - θl). The graph shows quantified data (n = 21 growth cones). (D) Fluorescent feature images of mRFP-actin at axonal growth cones overexpressing myc-GST (control) or myc-shootin1a (1-125) on a laminin surface. Kymographs of the fluorescent features of mRFP-actin in filopodia at 5 s intervals are shown (F-actin flows are indicated by dashed yellow lines). F-actin retrograde flow rate measured from the kymograph analysis; 50 fluorescent features (10 growth cones) were analyzed. Data represent means ± SEM; ***p<0.01; *p<0.05 (unpaired Student’s t-test). Bar: 5 μm (in the kymographs, 2 μm).
-
Figure 7—figure supplement 4—source data 1
Quantitative data for axon outgrowth velocity related to Figure 7―figure supplement 4B.
- https://doi.org/10.7554/eLife.34593.045
-
Figure 7—figure supplement 4—source data 2
Quantitative data for turning angle of axon toward the netrin-1 source related to Figure 7—figure supplement 4C.
- https://doi.org/10.7554/eLife.34593.046
-
Figure 7—figure supplement 4—source data 3
Quantitative data for F-actin retrograde flow speed related to Figure 7—figure supplement 4D.
- https://doi.org/10.7554/eLife.34593.047
Figure 8

Asymmetric shootin1a phosphorylation within growth cones is required for netrin-1–induced axon guidance.
(A and B) Time-lapse phase-contrast/fluorescence images of hippocampal neurons expressing shootin1a miRNA + RNAi refractory shootin1a-WT (A), and shootin1a miRNA + RNAi refractory shootin1a-DD (B) under gradients of netrin-1 and Alexa Fluor 594-BSA (red). White and blue arrowheads indicate growth cones at the first and last time-points, respectively. See Videos 10 and 11. The right panels depict trajectories of individual growth cone migrations. The initial growth cone positions are normalized at (x = 0 μm, y = 0 μm). (C) Axon outgrowth velocity obtained from the analyses in Figure 7A and B, Figure 8A and B (n = 47 growth cones). (D) Turning angle of axon toward the netrin-1 source was obtained from the analyses in Figure 7A and B, Figure 8A and B (n = 47 growth cones), by calculating the difference between the angles of the axonal tip at the first and last time-points of the observations (θf - θl). (E) A model for gradient-reading and mechanoresponse processes of netrin1–induced axon guidance. A very small difference (250:251; 0.4%) in netrin-1 concentration can induce highly polarized phosphorylation of shootin1a within growth cones (pink), as a readout of highly sensitive gradient-reading processes. A netrin-1 gradient on the substrate would also contribute to polarized shootin1 phosphorylation (yellow). This process is achieved through a signaling pathway including DCC, Rac1/CDC42, Pak1 and shootin1a. The polarized phosphorylation of shootin1a within a growth cone locally promotes shootin1a–L1-CAM and shootin1a–cortactin interactions. These interactions in turn enhance asymmetrically the coupling between F-actin retrograde flow and the adhesive substrate and increase traction force (blue arrows) on the side of the netrin-1 source, thereby leading to a decision for the migratory direction (white arrow). Data represent means ± SEM; ***p<0.01; ns, not significant (one-way ANOVA with Schaffer’s post hoc test). Bars: 50 μm.
-
Figure 8—source data 1
Quantitative data for axon outgrowth velocity related to Figure 8C.
- https://doi.org/10.7554/eLife.34593.055
-
Figure 8—source data 2
Quantitative data for turning angle of axon toward the netrin-1 source related to Figure 8D.
- https://doi.org/10.7554/eLife.34593.056
Author response image 1

Shootin1a signals obtained under identical conditions.
https://doi.org/10.7554/eLife.34593.061Videos
Video 1
A time-lapse fluorescence movie of Alexa Fluor 488-BSA in the cell culture area of the device in (Figure 2A, red rectangle).
See the legend for Figure 2B.
Video 2
Movement of fluorescent features of mRFP-actin in a growth cone of a neuron overexpressing myc-GST.
See the legend for Figure 6A.
Video 3
Netrin-1-induced promotion of traction forces at an axonal growth cone.
Left and right panels show bead displacement before and 60 min after netrin-1 stimulation, respectively. See the legend for Figure 6C.
Video 4
A time-lapse movie of a hippocampal neuron under a gradient of netrin-1 without heparin.
See the legend for Figure 7—figure supplement 1A. The gradient of Alexa Fluor 594-BSA in Figure 7—figure supplement 1A is not shown.
Video 5
A time-lapse movie of a hippocampal neuron under a gradient of netrin-1 with 2 μg/ml heparin.
See the legend for Figure 7—figure supplement 1D. The gradient of Alexa Fluor 594-BSA in Figure 7—figure supplement 1D is not shown.
Video 6
A time-lapse movie of a hippocampal neuron expressing control miRNA, under a gradient of netrin-1.
https://doi.org/10.7554/eLife.34593.050
Video 7
A time-lapse movie of a hippocampal neuron expressing shootin1a miRNA, under a gradient of netrin-1.
https://doi.org/10.7554/eLife.34593.051
Video 8
A time-lapse movie of a hippocampal neuron expressing EGFP, under a gradient of netrin-1.
https://doi.org/10.7554/eLife.34593.052
Video 9
A time-lapse movie of a hippocampal neuron expressing EGFP-shootin1a (1-125), under a gradient of netrin-1.
https://doi.org/10.7554/eLife.34593.053
Video 10
A time-lapse movie of a hippocampal neuron expressing shootin1a miRNA + RNAi refractory shootin1a-WT, under a gradient of netrin-1.
https://doi.org/10.7554/eLife.34593.057
Video 11
A time-lapse movie of a hippocampal neuron expressing shootin1a miRNA + RNAi refractory shootin1a-DD, under a gradient of netrin-1.
https://doi.org/10.7554/eLife.34593.058Tables
Key resources table
| Reagent type (species) or resource | Designation | Source or reference | Identifiers | Additional information |
|---|---|---|---|---|
| Gene (Rattus norvegicus) | Wistar | SLC | RRID:RGD_2314928 | |
| Gene (Rattus norvegicus) | Wistar | CLEA Japan | RRID:RGD_12879431 | |
| Gene (Mus musculus) | C57BL/6 | SLC | RRID:MGI:5658686; RRID:MGI:5295404 | |
| Gene (Mus musculus) | C57BL/6 | CLEA Japan | RRID:MGI:5658686; RRID:MGI:2160139 | |
| Genetic reagent (Mus musculus) | Shootin1 gene knockout | This paper | Please see 'Generation of Shootin1 knockout mice' in Materials and methods section | |
| Cell line (Homo sapiens) | HEK293T cell | ATCC | Cat# CRL_3216; RRID:CVCL_0063 | |
| Antibody | anti-shootin1a peptide sequence (rabbit polyclonal) | This paper | Rabbit polyclonal; against aa 450–456; Immunohistochemistry: (1:5000) Immunoblot: (1:5000) | |
| Antibody | anti-shootin1 antibody (rabbit polyclonal) | PMID: 17030985 (Toriyama et al., 2006); PMID: 23453953 (Toriyama et al., 2013) | Immunoblot: (1:1000) | |
| Antibody | anti-pSer101-shootin1 antibody (rabbit polyclonal) | PMID: 23453953 (Toriyama et al., 2013) | Immunoblot: (1:1000) | |
| Antibody | anti-pSer249-shootin1 antibody (rabbit polyclonal) | PMID: 23453953 (Toriyama et al., 2013) | Immunoblot: (1:5000); Immunofluorescence(1:1000) | |
| Antibody | anti-NCAM-L1 (C-20) antibody (goat polyclonal) | Santa Cruz Biotechnology | Cat# sc-1508; RRID:AB_631086 | Immunoblot: (1:2000); Immunofluorescence: (1:1000); Immunohistochemistry: (1:1000) |
| Antibody | anti-Neurofilament antibody 2H3 (mouse monoclonal) | DSHB | Cat# 2H3; RRID:AB_531793 | Immunohistochemistry: (1:2000) |
| Antibody | anti-TAG-1 antibody 4D7 (mouse monoclonal) | DSHB | Cat# 4D7/TAG1; RRID:AB_531775 | Immunohistochemistry: (1:100) |
| Antibody | anti-FLAG(DDDDK) tag antibody (rabbit polyclonal) | MBL | Cat# PM020; RRID:AB_591224 | Immunoblot: (1:1000) |
| Antibody | anti-Myc tag antibody (rabbit polyclonal) | MBL | Cat# 562–5; RRID:AB_591116 | Immunoblot: (1:2000) |
| Antibody | anti-GST tag antibody (goat polyclonal) | GE Healthcare | Cat# 27-4577-01; RRID:AB_771432 | Immunoblot: (1:3000) |
| Antibody | anti-His tag antibody (goat polyclonal) | Wako | Cat# 014–23221 | Immunofluorescence (1:500) |
| Antibody | anti-rabbit IgG secondary antibody, Alexa Fluor 594 (from donkey) | Jackson immune research | Cat# 711-585-152; RRID:AB_2340621 | Immunofluorescence: (1:1000); Immunohistochemistry: (1:1000) |
| Antibody | anti-goat IgG secondary antibody, Alexa Fluor 488 (from donkey) | Invitrogen, Thermo Fisher Scientific | Cat# A-11055; RRID:AB_2534102 | Immunofluorescence: (1:1000); Immunohistochemistry: (1:1000) |
| Antibody | anti-mouse IgG secondary antibody, Alexa Fluor 488 (from goat) | Invitrogen, Thermo Fisher Scientific | Cat# A-11029; RRID:AB_2534088 | Immunofluorescence: (1:1000) |
| Antibody | anti-rabbit IgG, Whole Ab ECL antibody, HRP Conjugated (from donkey) | GE Healthcare | Cat# NA934; RRID:AB_772206 | Immunoblot: (1:2000) |
| Antibody | anti-goat IgG, HRP conjugate, Species Adsorbed: H, M, R, Ch, Gp, Eq, Ht, Rb antibody (from donkey) | Millipore | Cat# AP180P; RRID:AB_92573 | Immunoblot: (1:2000) |
| Recombinant DNA reagent | pCMV-myc vector | Stratagene, Agilent | Cat# 211173 | |
| Recombinant DNA reagent | pCMV-Flag vector | Strategene, Agilent | Cat# 211172 | |
| Recombinant DNA reagent | pCAGGS vector | PMID: 1660837 (Niwa et al., 1991) Strategene, Addgene | Collection number LMBP2453 | This vector was provided by J. Miyazaki, Osaka University, Osaka, Japan; Niwa et al. (1991) (PMID: 1660837) |
| Recombinant DNA reagent | pGEX-6P-1 | GE Healthcare | Cat# 28954648 | |
| Recombinant DNA reagent | pCMV-mRFP-actin vector | PMID: 29483251 (Abe et al., 2018) | ||
| Recombinant DNA reagent | pCMV-myc-shootin1a vector | PMID: 17030985 (Toriyama et al., 2006) | ||
| Recombinant DNA reagent | pCMV-Flag-L1-CAM-ICD (intracellular domain) vector | This paper | ||
| Recombinant DNA reagent | pCMV-dominant negative myc-Pak1vector | PMID: 26261183 (Kubo et al., 2015) | ||
| Recombinant DNA reagent | pCMV-constitutively active myc-Pak1 vector | PMID: 26261183 (Kubo et al., 2015) | ||
| Recombinant DNA reagent | pCAGGS-myc | PMID: 17030985 (Toriyama et al., 2006) | ||
| Recombinant DNA reagent | pCAGGS-myc-GST vector | PMID: 17030985 (Toriyama et al., 2006) | ||
| Recombinant DNA reagent | pCAGGS-myc- shootin1a (1-125) vector | This paper | ||
| Recombinant DNA reagent | pCAGGS-EGFP | This paper | ||
| Recombinant DNA reagent | pCAGGS-EGFP- shootin1a(1-125) | This paper | ||
| Recombinant DNA reagent | pGEX-shootin1a-WT vector | PMID: 26261183 (Kubo et al., 2015) | ||
| Recombinant DNA reagent | pGEX-shootin1a-DD (phopho-mimic shootin1a) vector | PMID: 26261183 (Kubo et al., 2015) | ||
| Recombinant DNA reagent | pGEX-myc-shootin1a-DD (phopho-mimic shootin1a) vector | PMID: 26261183 (Kubo et al., 2015) | ||
| Recombinant DNA reagent | pGEX-myc-shootin1a- (1-125) vector | PMID: 26261183 (Kubo et al., 2015) | ||
| Recombinant DNA reagent | pGEX-myc-shootin1a- (125-260) vector | PMID: 26261183 (Kubo et al., 2015) | ||
| Recombinant DNA reagent | pGEX-myc-shootin1a- (217-456) vector | PMID: 26261183 (Kubo et al., 2015) | ||
| Recombinant DNA reagent | pGEX-myc-shootin1a- (261-377) vector | PMID: 26261183 (Kubo et al., 2015) | ||
| Recombinant DNA reagent | pGEX-L1-CAM-ICD (intracellulardomain) vector | This paper | ||
| Recombinant DNA reagent | RNAi shootin1a vector (miRNA) | PMID: 17030985 (Toriyama et al., 2006); PMID: 23453953 (Toriyama et al., 2013) | ||
| Recombinant DNA reagent | RNAi-refractory shootin1a-WT vector | PMID: 23453953 (Toriyama et al., 2013) | ||
| Recombinant DNA reagent | RNAi-refractory shootin1a-DD (phopho- mimic shootin1a) vector | PMID: 23453953 (Toriyama et al., 2013) | ||
| Peptide, recombinant protein | recombinant Netrin-1 protein (from mouse) | R and D systems | Cat# 1109-N1-025 | No CF (No carrier protein free) |
| Peptide, recombinant protein | FLAG peptide | Sigma-Aldrich | Cat# F3290 | |
| Peptide, recombinant protein | Laminin Solution, from Mouse EHS Tumor | Wako | Cat# 120–05751 | |
| Peptide, recombinant protein | L1-CAM-Fc | PMID: 18519736 (Shimada et al., 2008) | N/A | |
| Peptide, recombinant protein | Prescission protease | GE Healthcare | Cat# 27084301 | |
| Peptide, recombinant protein | Recombinant Pak1 | Life technologies, Thermo Fisher Scientific | Cat# PV3820 | |
| Commercial assay or kit | Rat Neuron Nucleofector kits (25 RCT) | Lonza | Cat# VPG-1003 | |
| Chemical compound, drug | anti-FLAG M2 antibody affinity gel (mouse monoclonal) | Sigma-Aldrich | Cat# A2220; RRID:AB_10063035 | |
| Chemical compound, drug | 7-amino-4- chloromethylcoumarin (CMAC) | Invitrogen, Thermo Fisher Scientific | Cat# C2110 | |
| Chemical compound, drug | 4,6-diamidino-2- phenylindole(DAPI) | Roche | Cat# 10236276001 Roche | DAPI stain (1:1000) |
| Chemical compound, drug | 1,1'-dioctadecyl- 3,3,3',3'-tetramethyl- indocarbocyanine dye (DiI) | Invitrogen, Thermo Fisher Scientific | Cat# D3911 | |
| Chemical compound, drug | Glutathione sepharose 4B | GE Healthcare | Cat# 17-0756-01 | |
| Chemical compound, drug | Protein G-sepharose 4B | GE Healthcare | Cat# 6511–5 | |
| Chemical compound, drug | Polydimethylsiloxane (PDMS) | Dow Corning Toray, Japan | Cat# 3255981 | |
| Chemical compound, drug | Silicone oil (Barrier coat No.6) | ShinEtsu, Japan | Cat# 06003 | |
| Chemical compound, drug | PhosSTOP | Roche | Cat# 4906845001 | |
| Software, algorithm | Image J | https://imagej.nih.gov/ij/ | RRID:SCR_003070 | |
| Software, algorithm | Fiji | http://fiji.sc | RRID:SCR_002285 | |
| Software, algorithm | Graphpad prism 7 | Graphpad software | RRID:SCR_002798 | |
| Software, algorithm | R Project for Statistical Computing | http://www.r-project.org/ | RRID:SCR_001905 | |
| Software, algorithm | Matlab | http://www.mathworks.com/products/matlab/ | RRID:SCR_001622 | |
| Software, algorithm | Microsoft Excel 2016 | Microsoft https://www.microsoft.com | ||
| Other | Amicon ultra-4 centrifugal filter devices | Millipore | Cat# UFC800324 |
Additional files
-
Transparent reporting form
- https://doi.org/10.7554/eLife.34593.059
Download links
A two-part list of links to download the article, or parts of the article, in various formats.
Downloads (link to download the article as PDF)
Open citations (links to open the citations from this article in various online reference manager services)
Cite this article (links to download the citations from this article in formats compatible with various reference manager tools)
Gradient-reading and mechano-effector machinery for netrin-1-induced axon guidance
eLife 7:e34593.
https://doi.org/10.7554/eLife.34593


