Distinct chromatin functional states correlate with HIV latency reactivation in infected primary CD4+ T cells
- Mohamed Abdel-Mohsen

- J Peter Svensson
- Israel Tojal Da Silva
- Lillian B Cohn
- Andrea Gramatica
- Steven Deeks
- Warner C Greene
- Satish K Pillai
- Eric Verdin
- Gladstone Institutes, United States
- University of California San Francisco, United States
- Buck Institute for Research on Aging, United States
- Blood Systems Research Institute, United States
- The Wistar Institute, United States
- Karolinska Institutet, Sweden
- The Rockefeller University, United States
- International Research Center, Brazil
Figures
Figure 1 with 1 supplement
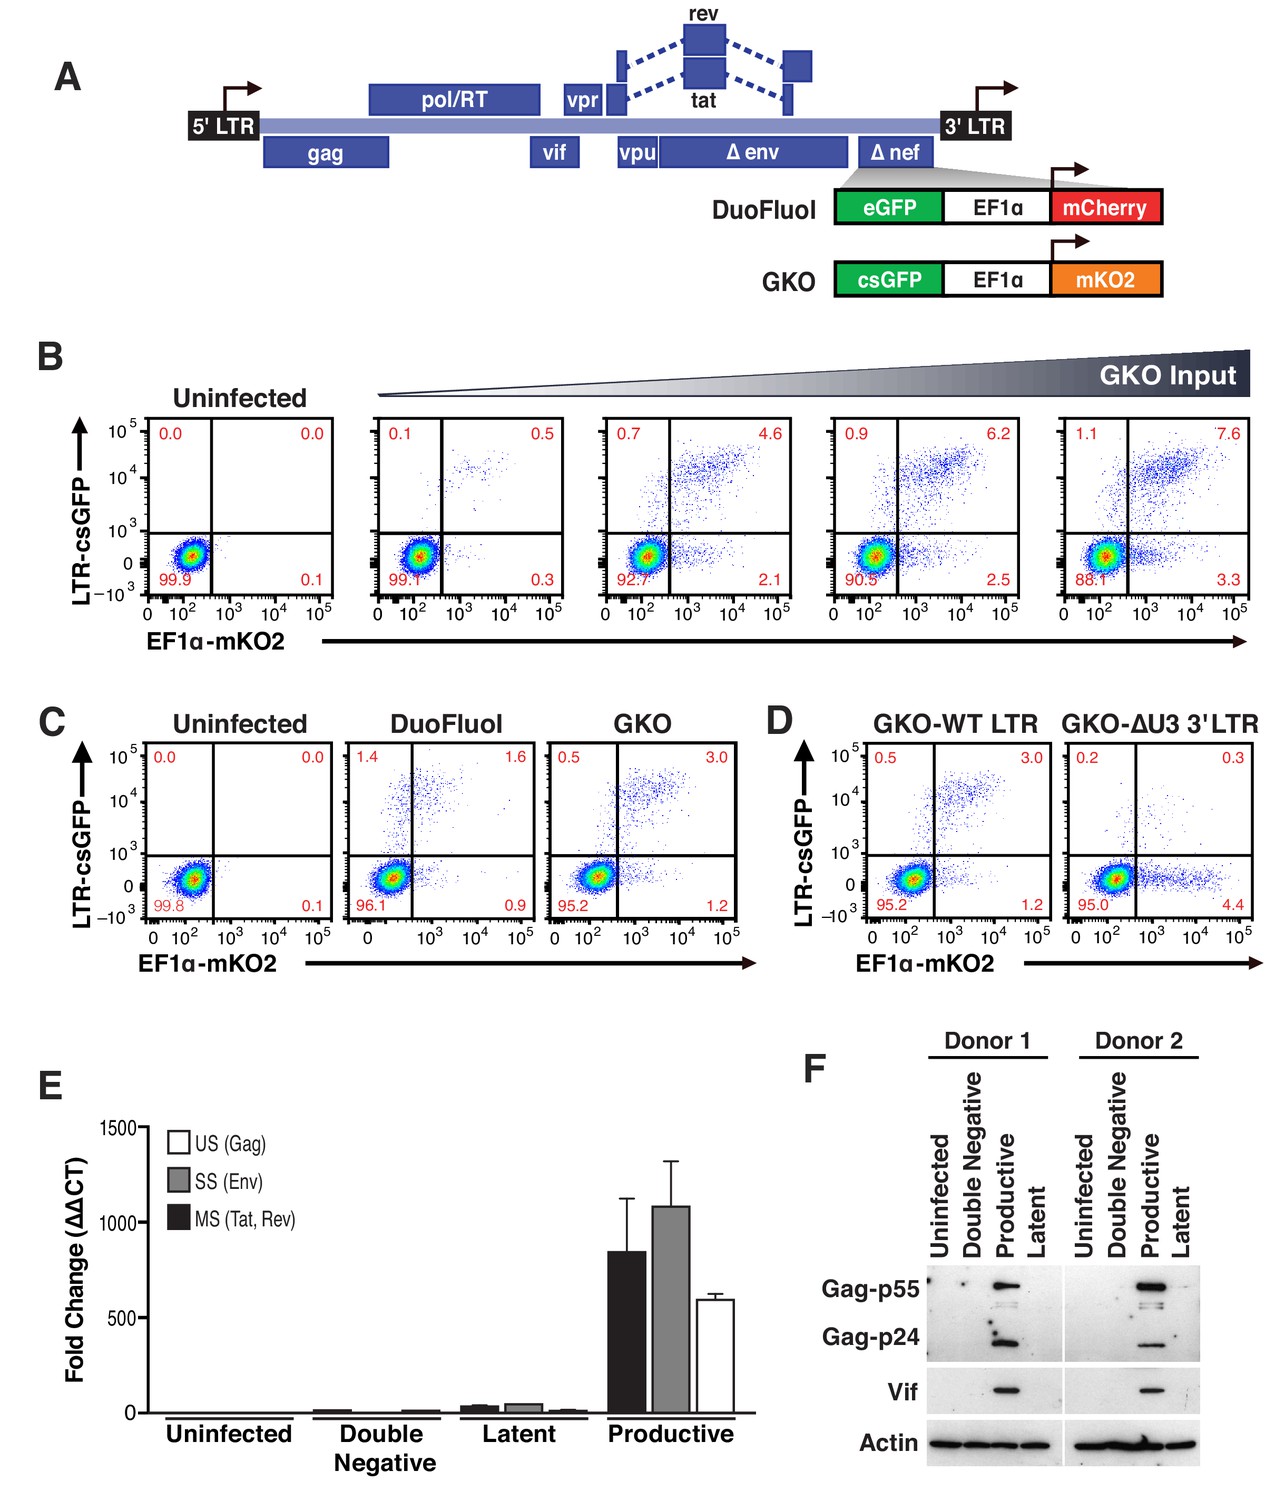
Second generation of dual-fluorescence HIV-1 reporter, HIVGKO to quantify stable latency.
(A) Schematic representation of first (top: HIVDuoFluoI) and second generation (bottom: HIVGKO) of dual-labeled HIV-1 reporters. (B) Representative experiment of HIVGKO virus titration in activated primary CD4+ T cells (4 days post-infection). Primary CD4+ T cells were activated with αCD3/CD28 beads + 20 U/mL IL-2 for 3 days before infection with different amounts of HIVGKO (input, ng/p24) and analyzed by flow cytometry 4 days post-infection. (C) Comparison of HIVDuoFluoI and HIVGKO infection profiles by flow cytometry in activated primary CD4+ T-cells (4 days post-infection). Cells were treated as in (B). (D) Comparison of GKO-WT-LTR and GKO-ΔU3 3'LTR infection profiles by flow cytometry in cells treated as in (B). (E, F) Primary CD4+ T cells were treated as in (B). At 4 days post-infection, double-negative, productively infected, and latently infected cells were sorted out, and (E) the total RNA isolated from each population was subjected to Taqman RT-qPCR analysis (Source Data - Figure 1). Unspliced (US), singly spliced (SS), and multiply spliced (MS) HIV-1 mRNAs were quantified relative to cellular GAPDH. (F) Western blot analysis of each population.
-
Figure 1—source data 1
Taqman RT-qPCR analysis of unspliced (US), singly spliced (SS), and multiply spliced (MS) HIV-1 mRNAs in the uninfected, double negative, latent and productive populations.
The experiment is detailed in the main text and Figure 1 legend.
- https://doi.org/10.7554/eLife.34655.004
Figure 1—figure supplement 1
Comparison of HIVGKO and HIVDuoFluoI.
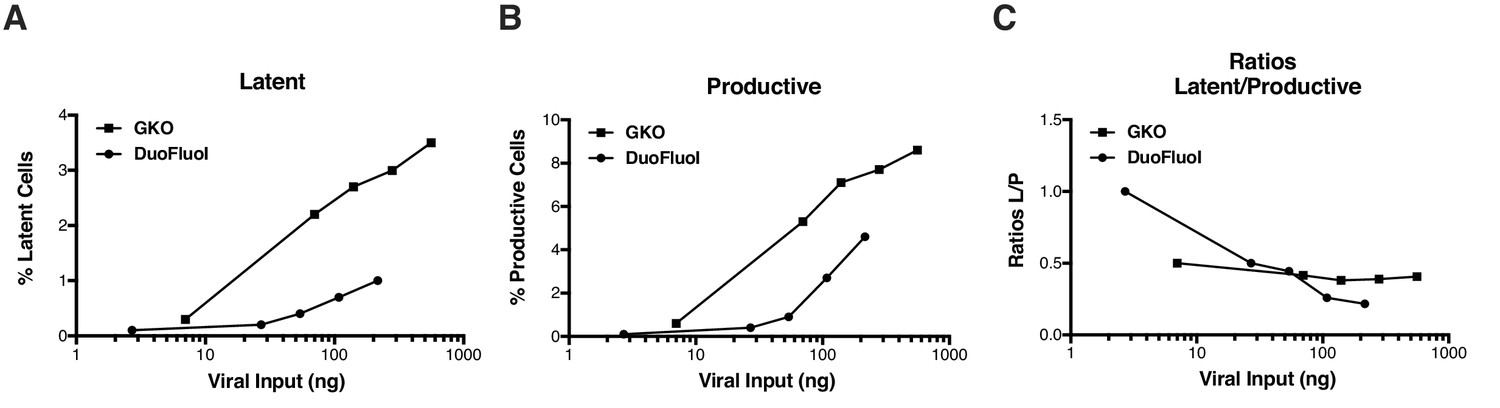
Titration of HIVGKO input revealed that latently and productively infected cells increased proportionately as viral input increased (Figure 1—figure supplement 1A and B), as reflected by steady ratios of latent/productive (Figure 1—figure supplement 1C). On the contrary, increasing HIVDuoFluoI input does not lead to a proportional increase of latent and productive populations (Figure 1—figure supplement 1A and B), as reflected on the ratios latent/productive (Figure 1—figure supplement 1C). Briefly, CD4+ T-cells were purified from blood of one representative healthy donor and activated for 72 hr with αCD3/CD28 beads and 100 U/ml IL-2 before infection with serial dilutions of either HIVGKO or HIVDuoFluoI. Four days post-infection, the percentage of latent cells (csGFP- mKO2+, Figure 1—figure supplement 1A) and productive cells (csGFP+, Figure 1—figure supplement 1AB) were quantified by FACS for both dual-fluorescence viruses, and ratios of latent versus productive populations were calculated (Figure 1—figure supplement 1C).
Figure 2
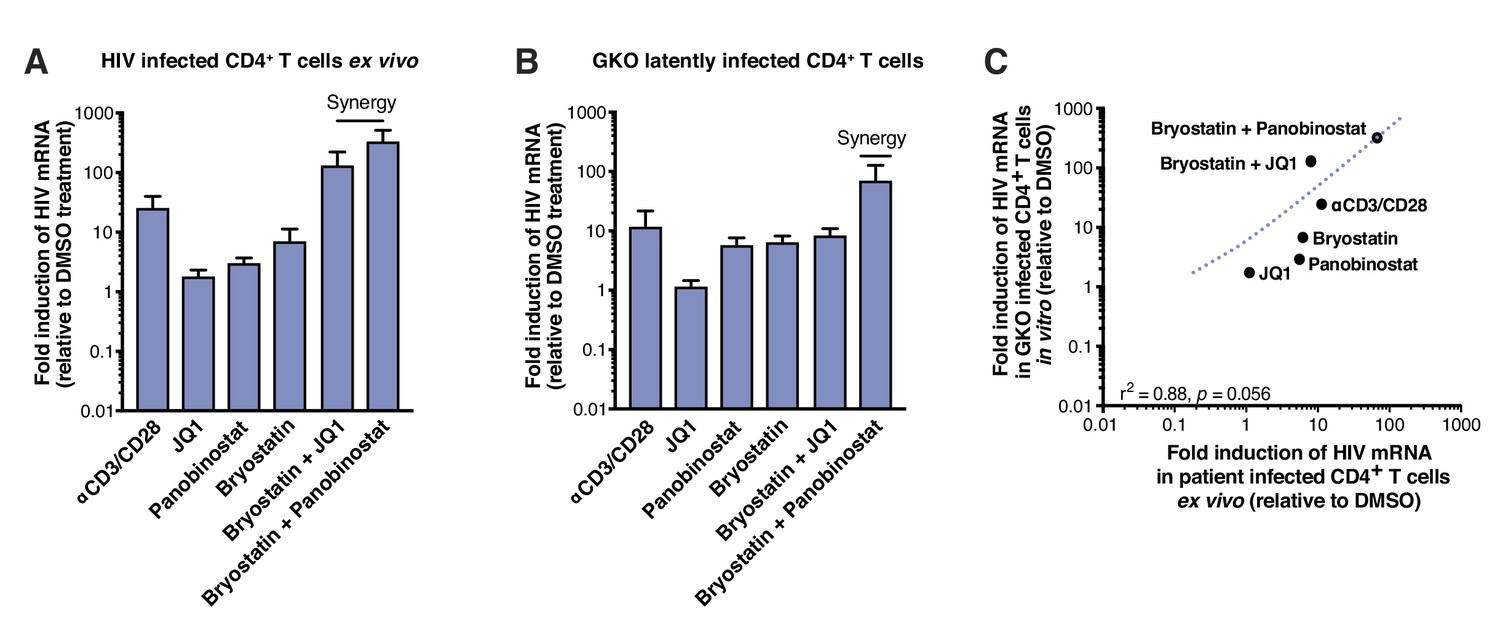
LRAs efficacy in patient samples is predicted by activity in HIVGKO latently infected cells.
(A) Intracellular HIV-1 mRNA levels in rCD4s, obtained from infected individuals and treated ex vivo with a single LRA or a combination of two LRAs for 24 hr in presence of raltegravir, presented as fold induction relative to DMSO control. (n = 4, mean +SEM) (Figure 2—source data 1). (B) Intracellular HIV-1 mRNA levels in HIVGKO latently infected CD4+ T-cells, and treated with a single LRA or a combination of two LRAs for 6 hr in presence of raltegravir, presented as fold induction relative to DMSO control. (n = 3 (different donors), mean +SEM, paired t-test) (Figure 2—source data 1). (C) Correlation between intracellular HIV-1 mRNA levels quantified in either 6 hr stimulated HIVGKO latently infected CD4+ T-cells from different donors, or 24 hr stimulated rCD4s from HIV infected patients, with a single LRA or a combination of two LRAs in presence of raltegravir.
-
Figure 2—source data 1
Intracellular HIV-1 mRNA levels in rCD4s, obtained from infected individuals, or in HIVGKO latently infected CD4+ T-cells.
The experiment is detailed in the main text and Figure 2 legend.
- https://doi.org/10.7554/eLife.34655.006
Figure 3

Few HIVGKO latently infected primary CD4+ T cells are reactivated.
(A) Schematic of experimental procedure with primary CD4+ T cells. Briefly, CD4+ T cells were purified from blood of healthy donors and activated for 72 hr with αCD3/CD28 beads and 100 U/ml IL-2 before infection with HIVGKO. Five days post-infection, latently infected cells (csGFP- mKO2+) cells were sorted, put back in culture overnight and stimulated with different LRAs in presence of raltegravir for 24 hr before performing FACS analysis. (B) Percentage of GFP+ cells is shown after stimulation of latently infected CD4+ T-cells with LRAs (n = 4 (different donors), mean +SEM, paired t-test) (Figure 3—source data 1). (C) Histogram plot of percent live cells for each drug treatment (n = 3 (different donors), mean + SEM, paired t-test) (Figure 3—source data 1). p-value: *p<0.05, **p<0.01 relative to DMSO.
-
Figure 3—source data 1
Percentage of GFP+ cells is shown after stimulation of latently infected CD4+ T-cells with LRAs as well as percent live cells for each drug treatment.
The experiment is detailed in the main text and Figure 3 legend.
- https://doi.org/10.7554/eLife.34655.008
Figure 4 with 1 supplement
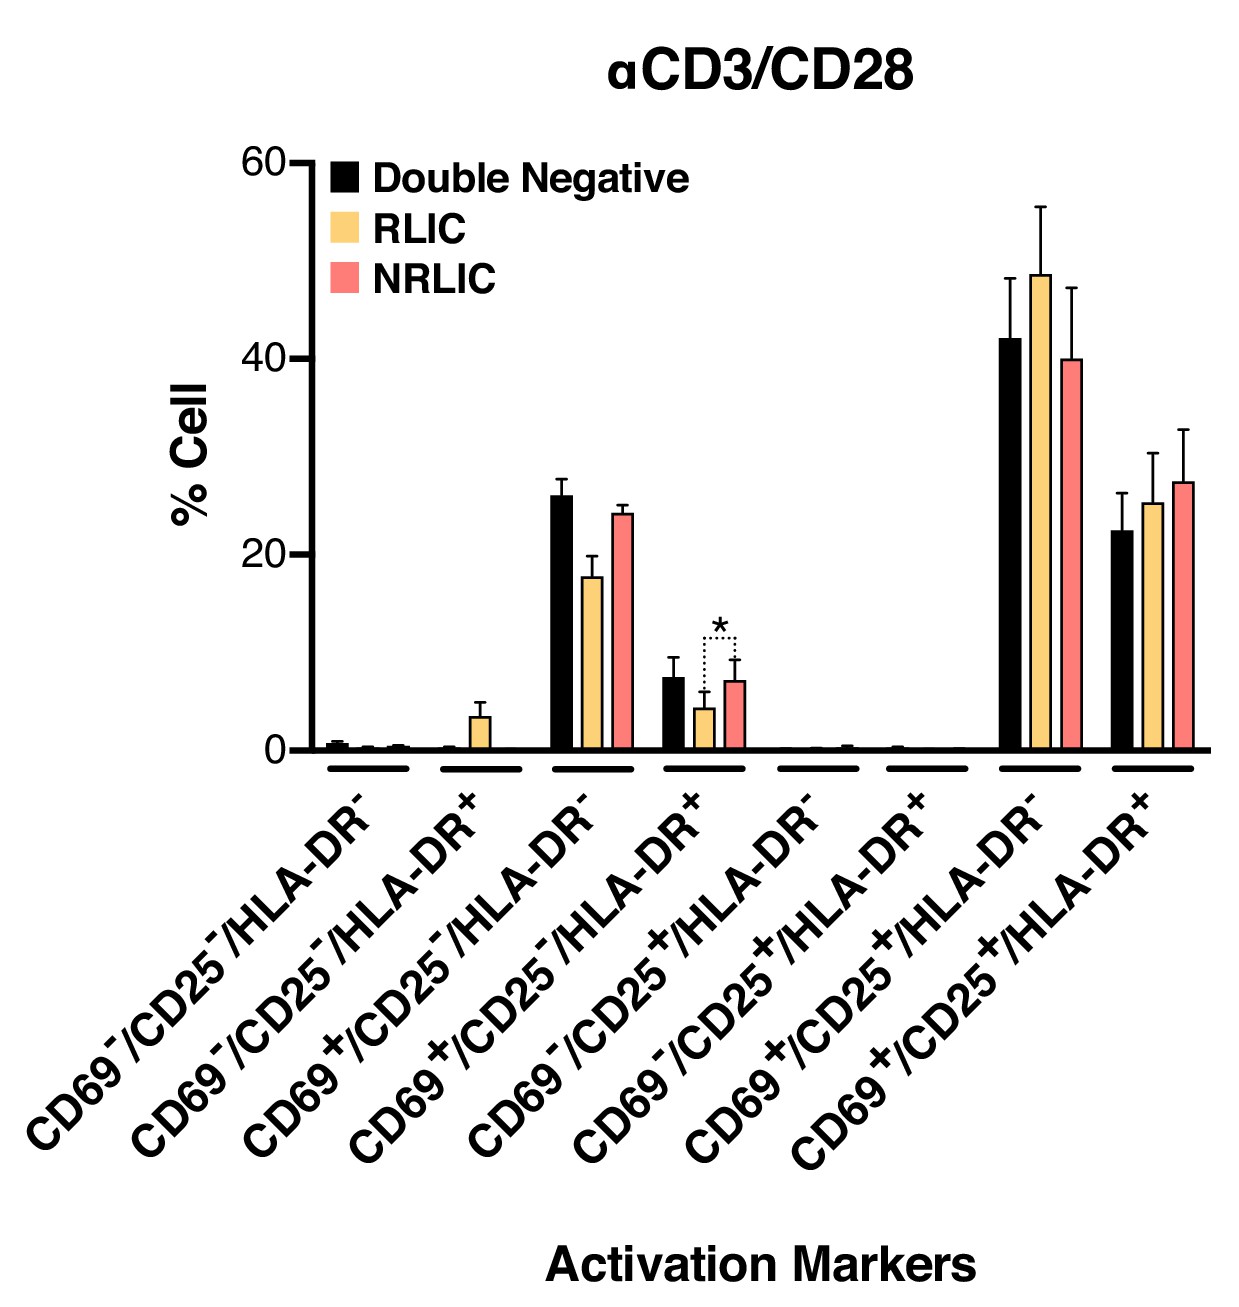
Low-level latency reactivation is not explained by low cellular responses to activation signals.
T-cell activation patterns between double negative, reactivated (RLIC) and non-reactivated (NRLIC) latently infected cells. Briefly, CD4+ T-cells were purified from blood of four healthy donors and activated for 72 hr with αCD3/CD28 beads and 20 U/ml IL-2 before infection with HIVGKO. At 4 days post-infection, csGFP- were sorted, cultured overnight and stimulated with αCD3/CD28 in presence of raltegravir. At 24 hr post-treatment, cells were stained for CD25, CD69, and HLA-DR activation markers before performing FACS analysis. (n = 4, mean +SEM, paired t-test; *p<0.05; **p<0.01) (Figure 4—source data 1).
-
Figure 4—source data 1
CD25, CD69, and HLA-DR activation markers patterns between double negative, reactivated (RLIC) and non-reactivated (NRLIC) latently infected cells.
The experiment is detailed in the main text and Figure 4 legend.
- https://doi.org/10.7554/eLife.34655.012
Figure 4—figure supplement 1
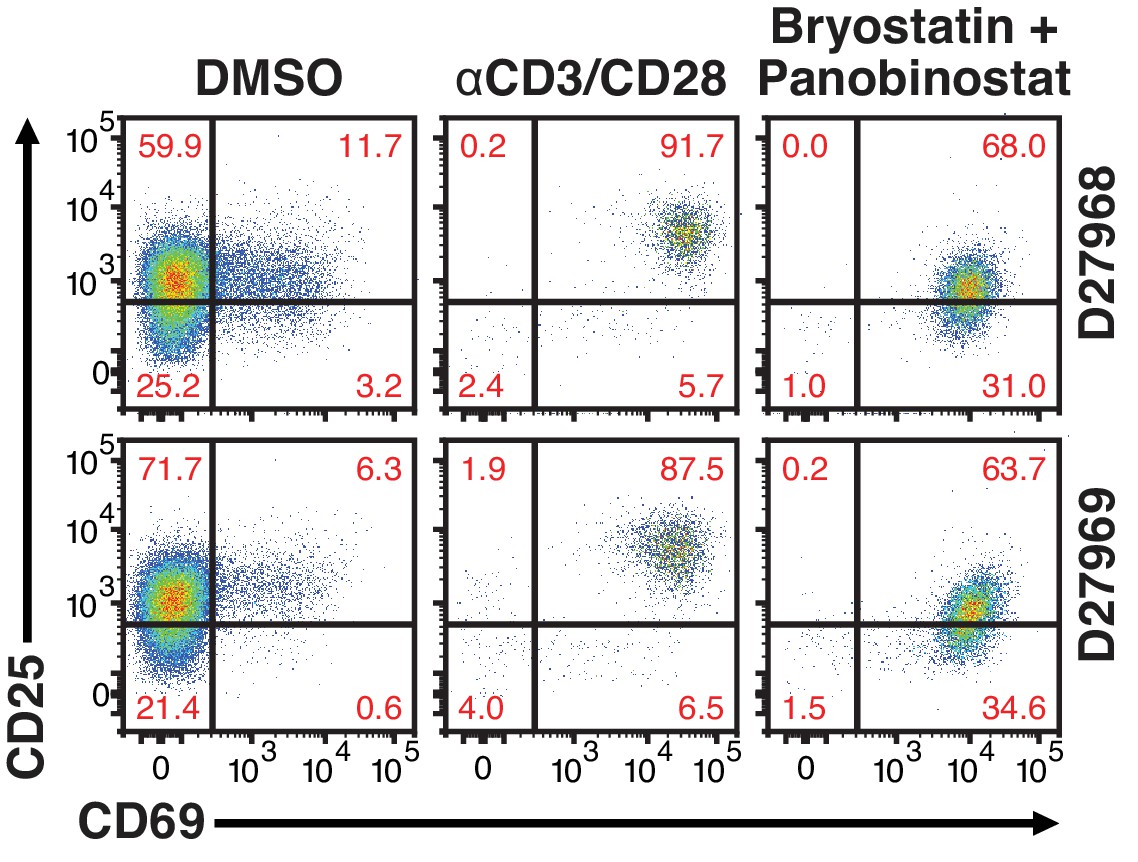
24 hr treatment effectively activate primary CD4+ T cells.
Quantification of T-cell activation-associated surface markers after 24 hr stimulation. Briefly, CD4+ T-cells were purified from blood of two healthy donors and activated for 72 hr with αCD3/CD28 beads and 100 U/ml IL-2 before infection with HIVGKO. Five-days post-infection, latently infected cells (csGFP- mKO2+) were sorted, cultured overnight and stimulated with either αCD3/CD28 or bryostatin + panobinostat in presence of raltegravir. 24 hr post-treatment, cells were stained for CD25 and CD69 activation markers before performing FACS analysis.
Figure 5
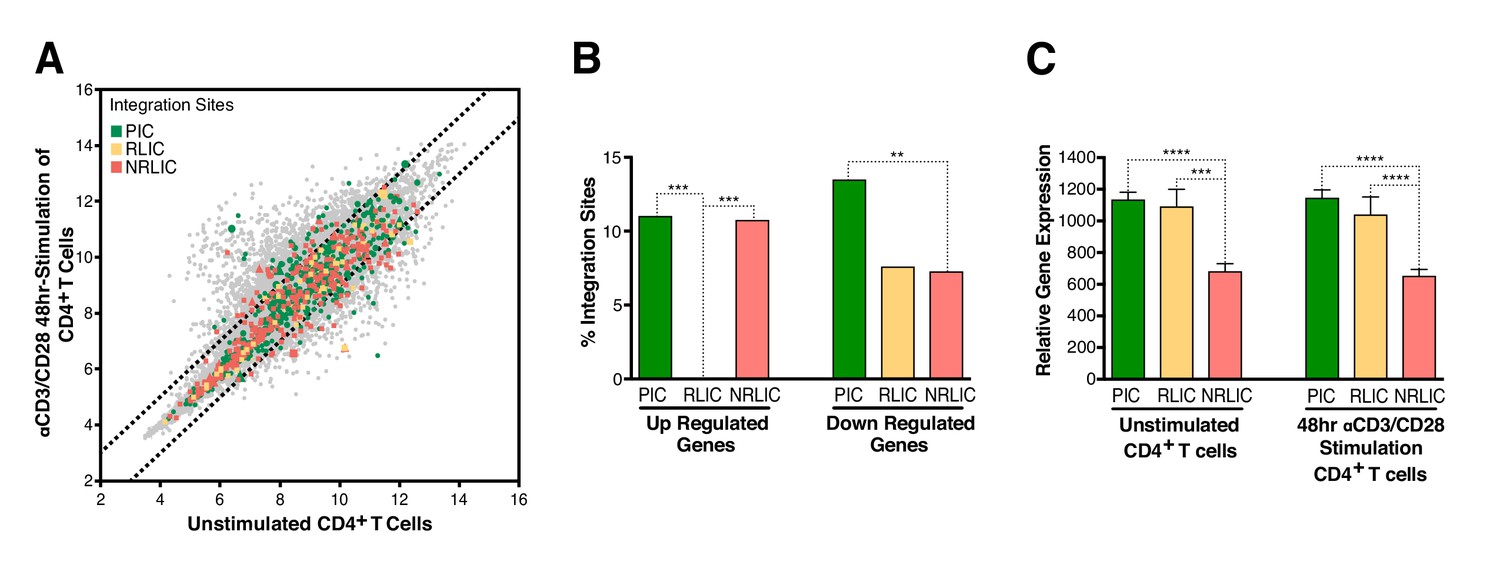
Relative expression of HIV-1 integration targeted genes for each population, before or after TCR activation.
(A) Scatter chart showing primary CD4+ T-cell gene expression changes after 48 hr of stimulation with αCD3/CD28 beads. Integration sites displayed outside of the two solid gray lines were targeted genes whose expression is at least ± twofold differentially expressed after 48 hr stimulation. Plot points size can be different, the bigger the plot point is, the more integration events happened within the same gene. (B) Fraction of integration sites from the different populations PIC, RLIC or NRLIC, integrated within genes whose expression is at least ± twofold differentially expressed after 48 hr of αCD3/CD28 stimulation (**p<0.01; ***p<0.001; two-proportion z test) (Figure 5—source data 1). (C) Relative expression of genes targeted by HIV-1 integration in PIC, RLIC or NRLIC before TCR stimulation and after αCD3/CD28 stimulation (n = 3, mean +SEM, paired t-test). ***p<0.001; ****p<0.0001. (Figure 5—source data 2).
-
Figure 5—source data 1
Fraction of integration sites from the different populations PIC, RLIC or NRLIC, integrated within genes whose expression is at least ± twofold differentially expressed after 48 hr of αCD3/CD28 stimulation.
The experiment is detailed in the main text and Figure 5 legend.
- https://doi.org/10.7554/eLife.34655.014
-
Figure 5—source data 2
Relative expression of genes targeted by HIV-1 integration in PIC, RLIC or NRLIC before TCR stimulation and after 48 hr αCD3/CD28 stimulation.
The experiment is detailed in the main text and Figure 6 legend.
- https://doi.org/10.7554/eLife.34655.015
Figure 6
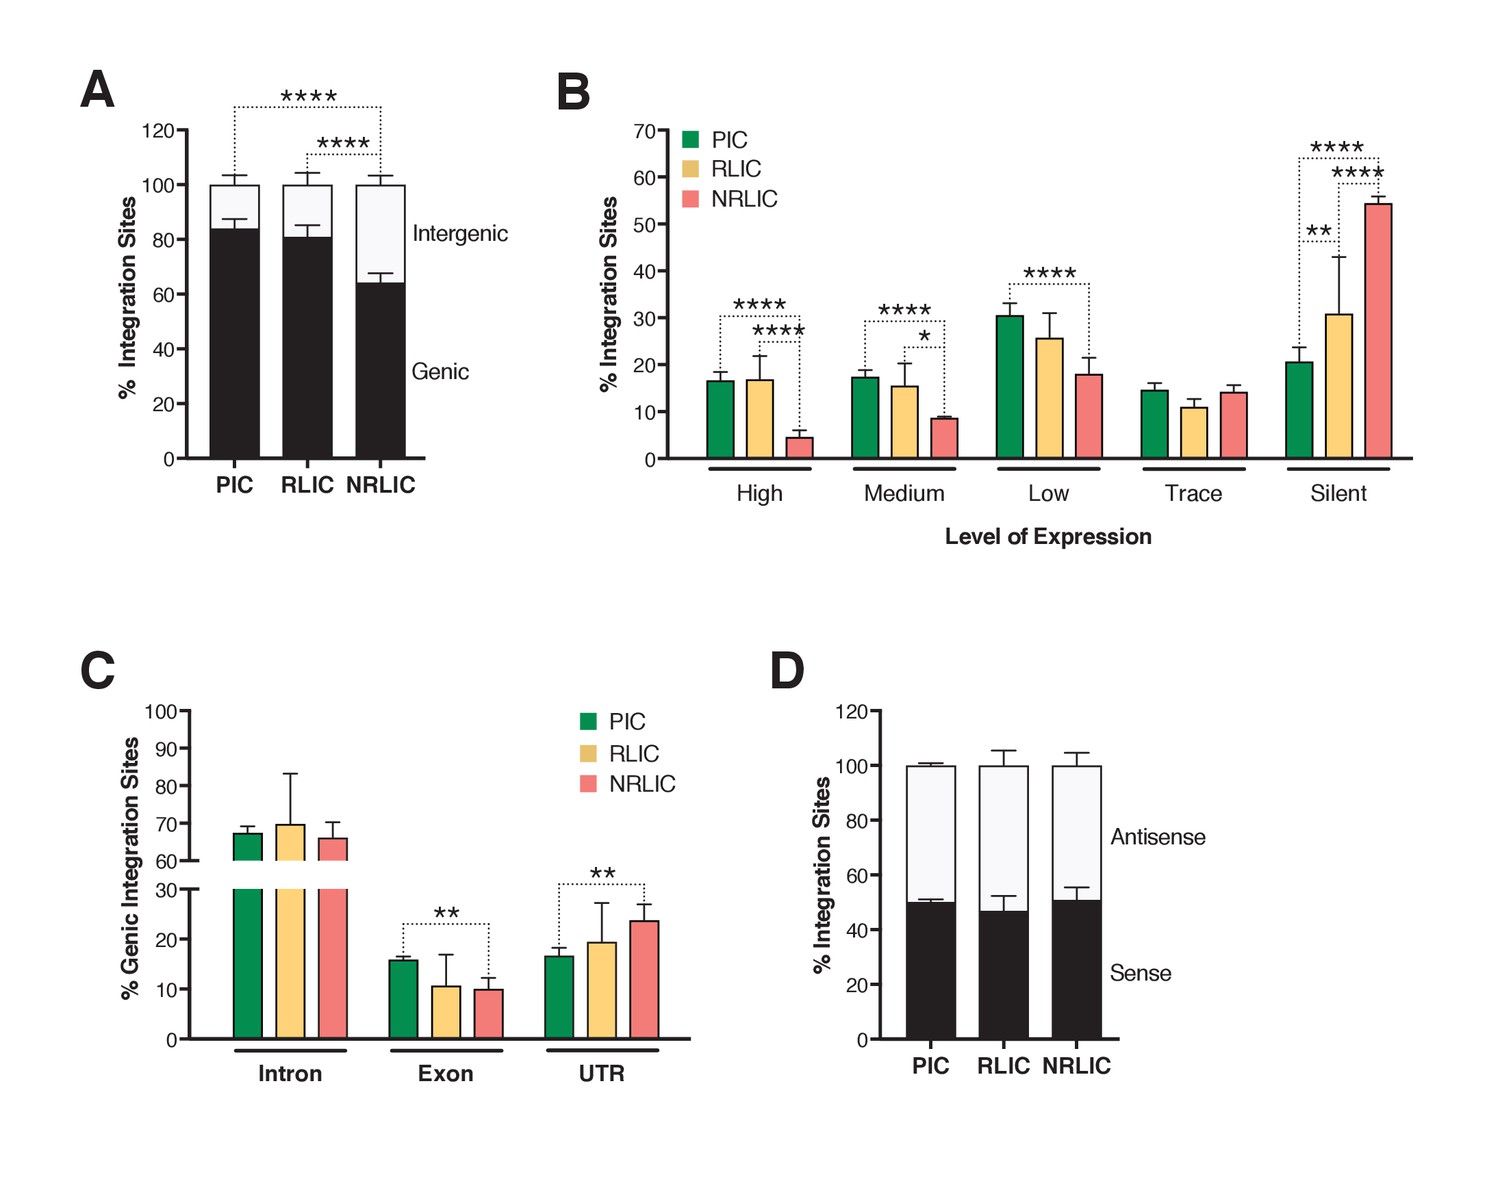
Insertion landscapes of HIV-1.
(A) Proportion of mapped insertions that are in genic or intergenic regions. (Figure 6—source data 1). (B) Proportion of integration sites in transcribed regions with high (top 1/8), medium (top 1/4–1/8), low expression (top 1/2–1/4), trace (bottom 1/2) or silent (0) expression. (Figure 6—source data 1). (C) Proportion of unique genic integration sites located in introns, exons, UTR or promoters. (Figure 6—source data 1). (D) Transcriptional orientation of integrated HIV-1 relative to host gene. (Figure 6—source data 1). p-value: *p<0.05; **p<0.01; ***p<0.001; ****p<0.0001 using two-proportion z test.
-
Figure 6—source data 1
Proportion of mapped insertions that are in genic or intergenic regions; of integration sites in transcribed regions with high, medium, low expression, trace or silent expression; of unique genic integration sites located in introns, exons, UTR or promoters; and transcriptional orientation of integrated HIV-1 relative to host gene.
The experiment is detailed in the main text and Figure 6 legend.
- https://doi.org/10.7554/eLife.34655.017
Figure 7
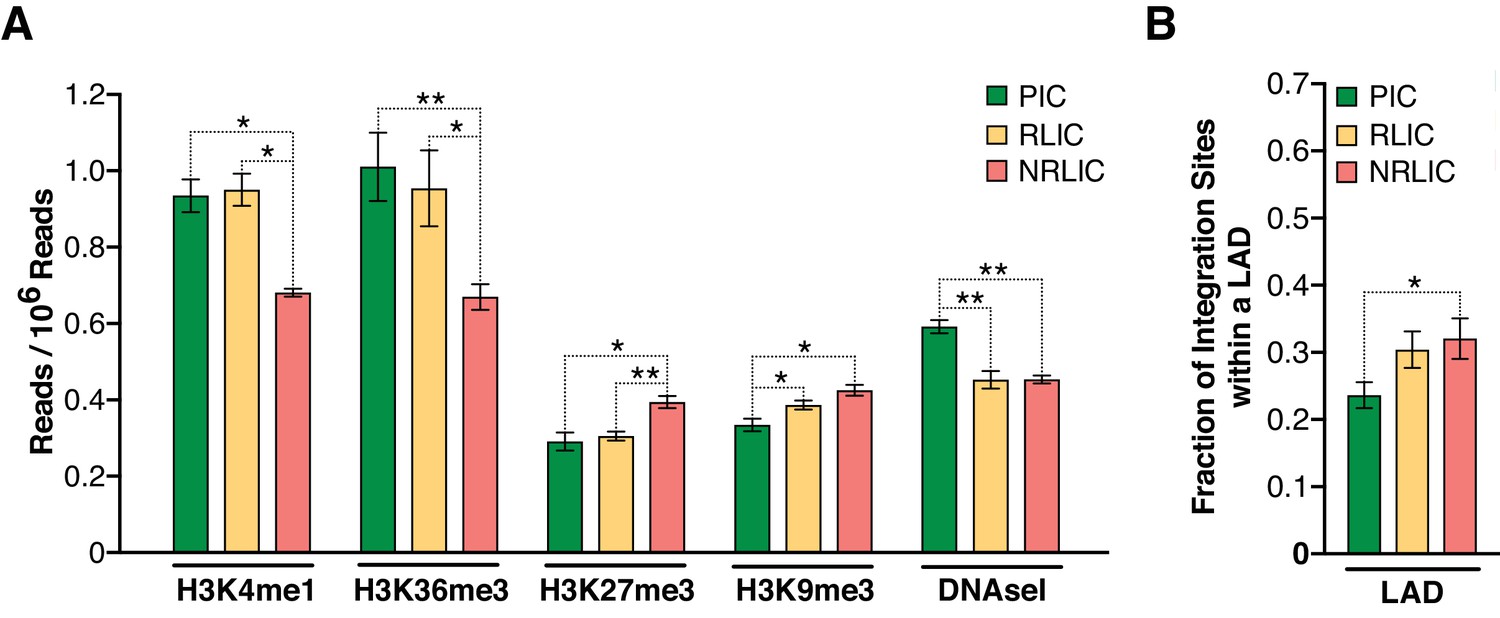
Epigenetics marks and nuclear localization of HIV-1 integration sites.
(A) 500 bp centered on HIV-1 integration sites for each population were analyzed for the presence of H3K4me1 (active enhancers), H3K36m3 (active transcribed regions), H3K9m3 and H3K27m3 (repressive marks of transcription), and DNA accessibility (DNAseI). (Figure 7—source data 1). (B) Nuclear localization of HIV-1 integration sites. Quantification was based on inside a LAD (=1) or outside (=0), which means the Y axis represents the fraction of integrations within a LAD. (Figure 7—source data 1). (n = 3–4 ENCODE donors, mean +SEM, paired t-test). *p<0.05; **p<0.01; ***p<0.001).
-
Figure 7—source data 1
HIV-1 integration sites for each population were analyzed for the presence of H3K4me1, H3K36m3, H3K9m3, H3K27m3, DNA accessibility, as well as their nuclear localization.
The experiment is detailed in the main text and Figure 7 legend.
- https://doi.org/10.7554/eLife.34655.019
Author response image 1
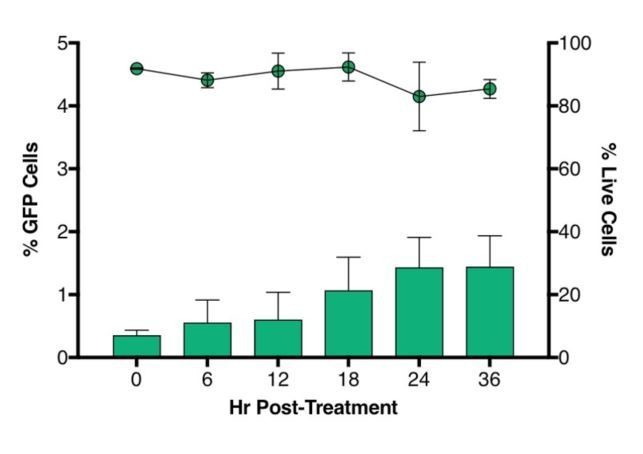
Time-course plot of percent of GFP+ cells (bars) and live cells (lines) after sort of latently infected CD4+ T-cells (n = 2, mean + SEM).
https://doi.org/10.7554/eLife.34655.023
Author response image 2
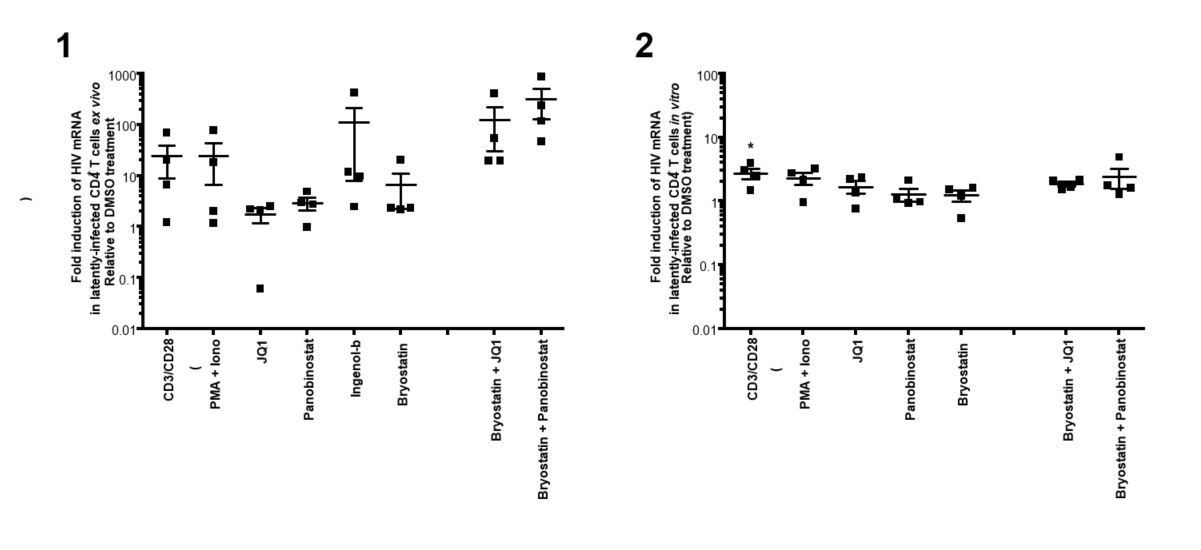
(1)Intracellular HIV-1 mRNA levels in rCD4s, obtained from infected individuals and treated ex vivo with a single LRA or a combination of two LRAs for 24 hours, presented as fold induction relative to DMSO control.
(n = 4, mean + SEM).
Author response image 3
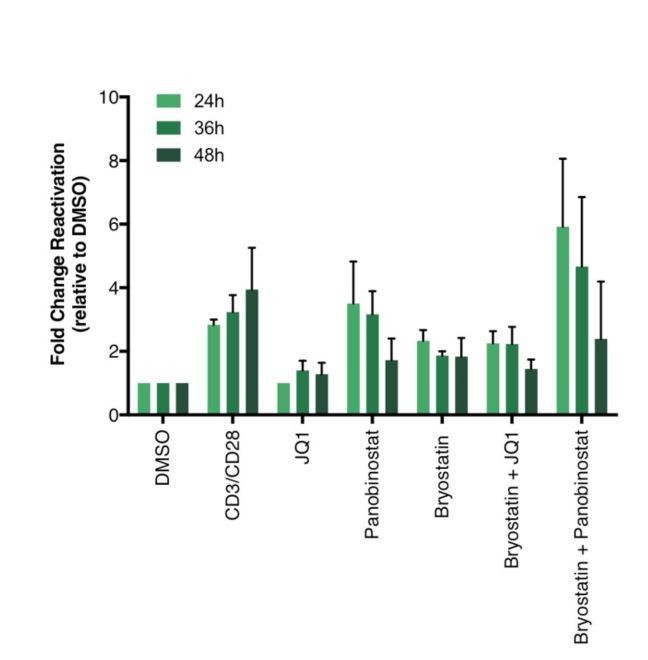
Percentage of GFP+ cells are shown after stimulation of latently infected CD4+ T-cells with LRAs for 24-, 36- or 48 hours (n = 2 (different donors), mean + SEM, paired t-test).
https://doi.org/10.7554/eLife.34655.025
Author response image 4
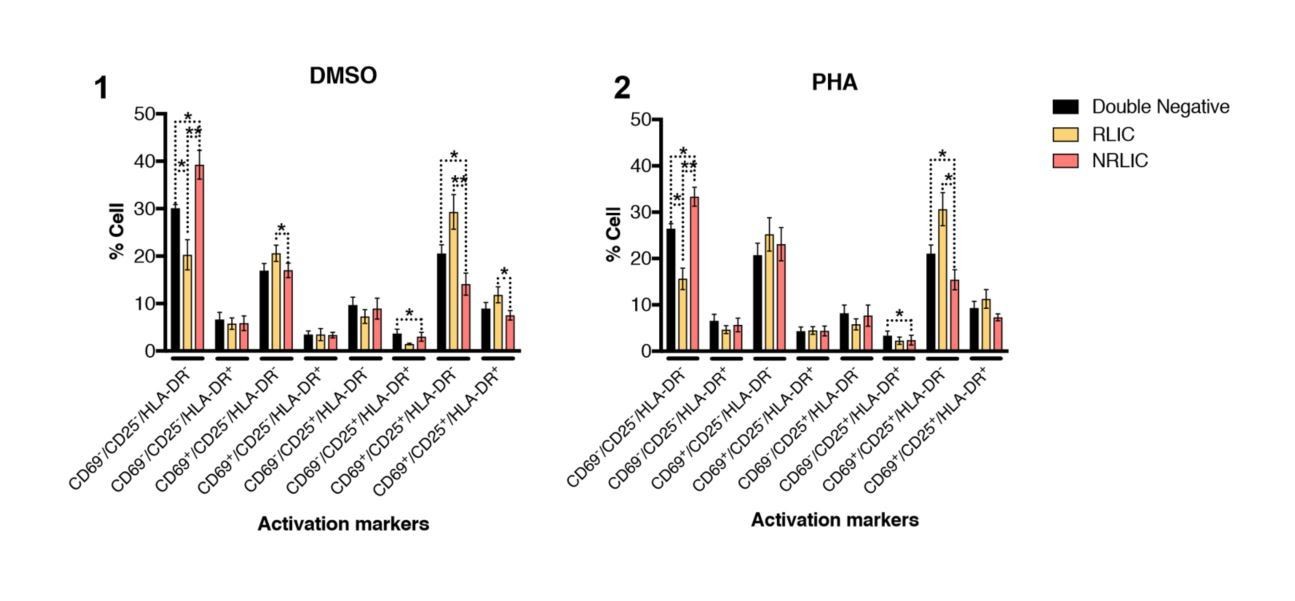
T-cell activation patterns between double negative, reactivated (RLIC) and non-reactivated (NRLIC) latently infected cells.
Briefly, CD4+ T-cells were purified from blood of four healthy donors and activated for 72 hours with αCD3/CD28 beads and 20 U/ml IL-2 before infection with HIVGKO. At 4 days post-infection, csGFP- were sorted, cultured overnight and stimulated with DMSO (1) or PHA (2). At 24 hours post-treatment, cells were stained for CD25, CD69, and HLA-DR activation markers before performing FACS analysis. (n=4, mean + SEM, paired t-test; *p<0.05; **p<0.01).
Tables
Table 1
Characteristics of HIV-1-infected study participants
ABC, abacavir; DRV, darunavir; FTC, emtricitabine; RPV, rilpivirine; RTV, ritonavir; TCV, tivicay; TDF, tenofovir; 3TC, lamivudine; VL, viral load.
| Scope ID | Age | Sex | Ethnicity | CD4 Count | Duration of infection (years) | ART regimen | Duration of ART (years) | Peak reporter VL (copies/ml−1) |
|---|---|---|---|---|---|---|---|---|
| 1597 | 56 | M | Mixed | 469 | 19 | RPV/TDF/FTC | 5 | 45734 |
| 2147 | 59 | M | Asian | 597 | 28 | RPV/TDF/FTC | 23 | 374000 |
| 2461 | 62 | M | White | 664 | 32 | RPV/TCV | 19 | 20000 |
| 3162 | 54 | M | White | 734 | 29 | RTV, DRV, ABC/TCV/3TC | 20 | 171000 |
Additional files
-
Source data 1
Integration Sites - Source Data: List of integration sites for each donor and each population.
- https://doi.org/10.7554/eLife.34655.020
-
Transparent reporting form
- https://doi.org/10.7554/eLife.34655.021
Download links
A two-part list of links to download the article, or parts of the article, in various formats.
Downloads (link to download the article as PDF)
Open citations (links to open the citations from this article in various online reference manager services)
Cite this article (links to download the citations from this article in formats compatible with various reference manager tools)
Distinct chromatin functional states correlate with HIV latency reactivation in infected primary CD4+ T cells
eLife 7:e34655.
https://doi.org/10.7554/eLife.34655


