Active avoidance requires inhibitory signaling in the rodent prelimbic prefrontal cortex
- University of Puerto Rico School of Medicine, Puerto Rico
- Massachusetts Institute of Technology, United States
Figures
Figure 1 with 1 supplement
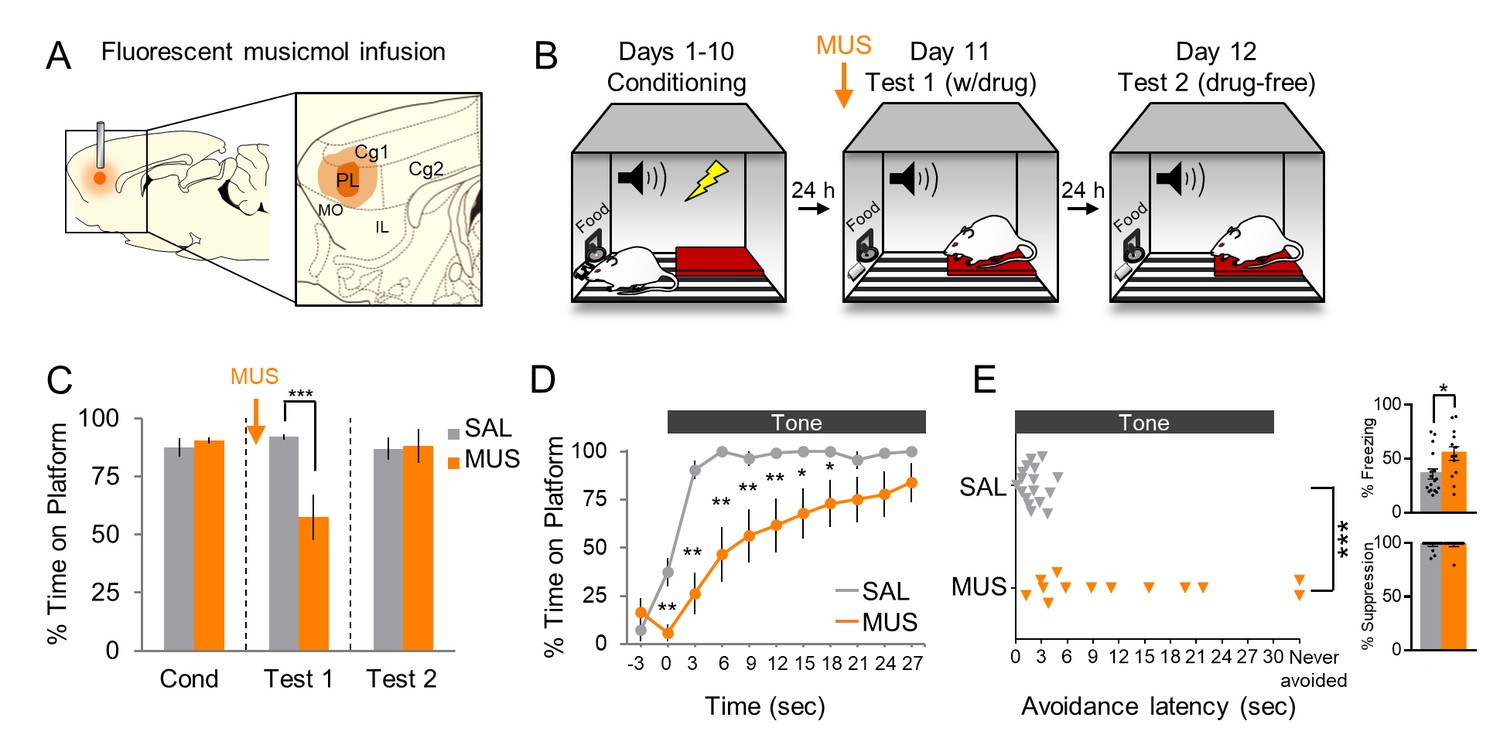
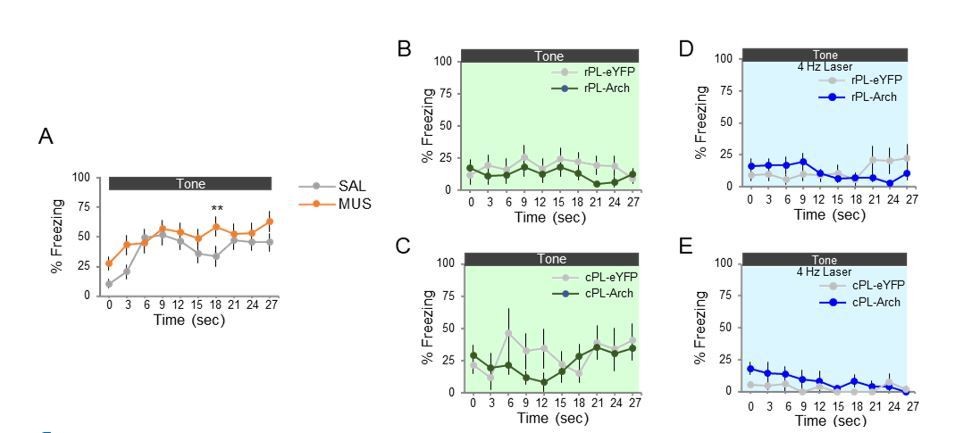
Pharmacological inactivation of prelimbic cortex delays avoidance.
(A). Schematic of MUS infusion showing the minimum (dark orange) and maximum (light orange) extent of infusion into PL. (B). Rats were trained across 10 days to avoid a tone-signaled foot-shock by stepping onto a platform. On Day 11, rats received two tone presentations (without shock) 45 min after MUS infusion. On Day 12, rats received a second 2-tone test drug free. (C). Percent time on platform during Tone 1 on Days 10, 11, and 12 for MUS and saline controls (SAL, n = 17; grey) and MUS rats (n = 13, orange). (D). Time spent on platform in 3 s bins for Test 1 (Tone 1) revealed that MUS rats were significantly delayed in their avoidance compared to SAL controls (repeated measures ANOVA, post hoc Tukey). (E). Latency of avoidance for each rat (Mann Whitney U test, Tone 1, Test 1). Inset: Effect of MUS inactivation (Tone 1, test 1) on freezing (top) and percent suppression of bar pressing (bottom) during the tone (unpaired t-test). Data are shown as mean ± SEM; *p<0.05, **p<0.01, ***p<0.001.
-
Figure 1—source data 1
Open field measures following MUS infusion in PL.
- https://doi.org/10.7554/eLife.34657.004
Figure 1—figure supplement 1
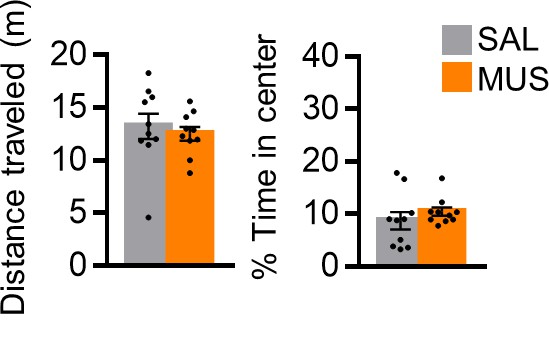
Assessment of locomotion and anxiety following pharmacological inactivation of PL.
Distance traveled (left) and percent time in center (right) in an open field during a 5 min period following MUS or SAL infusion (n = 10 MUS, n = 10 SAL). All data are shown as mean ± SEM, *p<0.05.
Figure 2 with 1 supplement
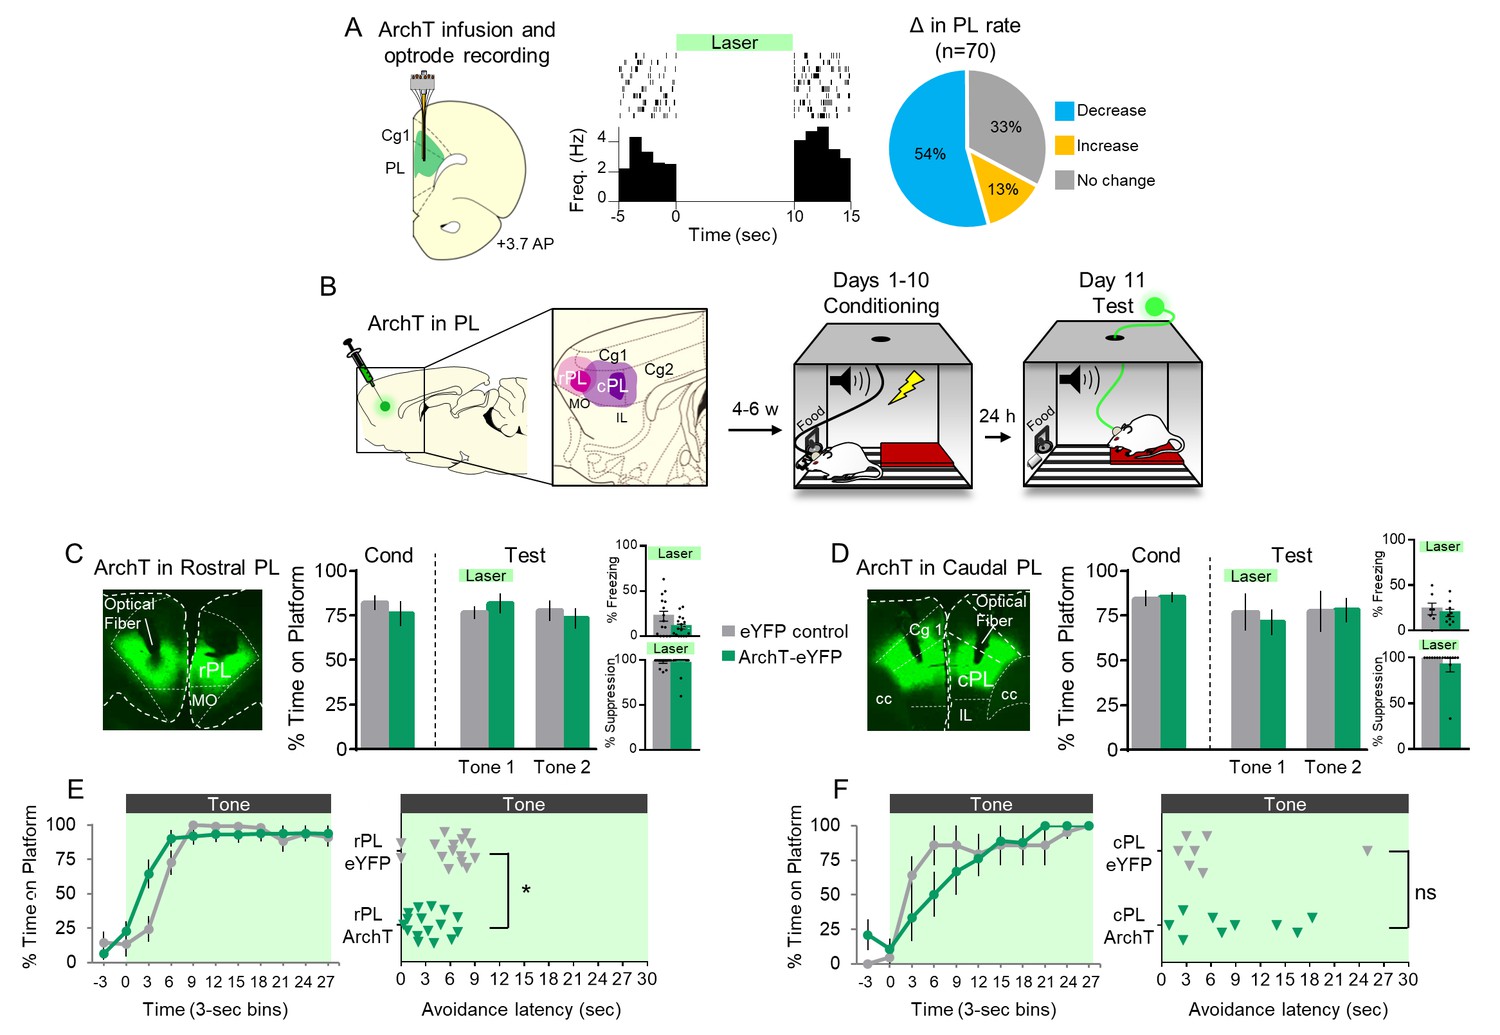
Optogenetic silencing of prelimbic neurons does not delay avoidance.
(A). Left: Schematic of ArchT expression and optrode placement in anesthetized rats (n = 2). Middle: Rasters and peristimulus time histogram of a single PL neuron showing a decrease in firing rate during laser illumination (8–10 mW, 532 nm, 10 s ON, 10 s OFF, 10 trials). Right: Proportion of PL neurons that exhibited a decrease (blue, n = 38), increase (gold, n = 9), or no change (grey, n = 23) in firing rate. (B). Schematic of virus infusion, location of min/max expression of AAV in rPL (pink) and cPL (purple), followed by avoidance training and test. At Test, 532 nm light was delivered to rPL or cPL during the entire 30 s tone presentation (Tone 1). (C). Left: Micrograph of ArchT expression and optical fiber placement in rPL. Right: Percent time on platform at Cond (Day 10, Tone 1) and Test (Day 11, Tone 1 with laser ON and Tone 2 with laser OFF) for rPL-eYFP control (n = 15, grey) and rPL-ArchT rats (n = 17, green). Inset: There was no effect of rPL photosilencing (Tone 1 at Test) on freezing (top) and percent suppression of bar pressing (bottom) during the tone (unpaired t-test). (D). Left: Micrograph of ArchT expression and optical fiber placement in cPL. Right: Percent time on platform during Cond and Test for cPL-eYFP control (n = 7, grey) and cPL-ArchT rats (n = 9, green). Inset: There was no effect of cPL photosilencing (Tone 1 at Test) on freezing (top) and percent suppression of bar pressing (bottom) during the tone (unpaired t-test). (E). Left: Time spent on platform in 3 s bins (Tone 1 at Test) revealed no effect of silencing rPL-ArchT neurons compared to eYFP controls (repeated measures ANOVA). Right: Latency of avoidance for each rat (Tone 1 at Test). rPL-ArchT rats showed a decrease in avoidance latency (Mann Whitney U test, p=0.021). (F). Timeline of avoidance (left) and latency (right) for cPL-eYFP control rats and cPL-ArchT rats. All data are shown as mean ± SEM; *p<0.05.
-
Figure 2—source data 1
Freezing levels following ArchT silencing of rPL neurons.
- https://doi.org/10.7554/eLife.34657.007
Figure 2—figure supplement 1
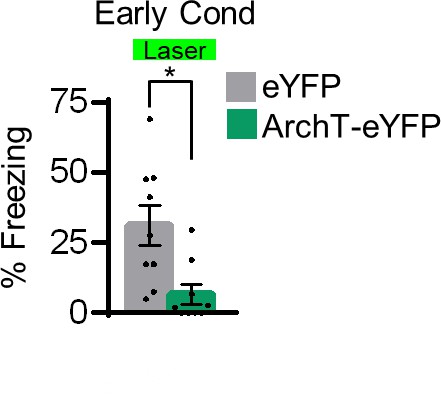
Assessment of fear following ArchT silencing of rPL neurons.
Silencing rPL neurons significantly decreased freezing early in avoidance conditioning (Day 2, Tone 1, n = 8 ARCH-eYFP, n = 9 eYFP). All data are shown as mean ± SEM, *p<0.05.
Figure 3 with 1 supplement
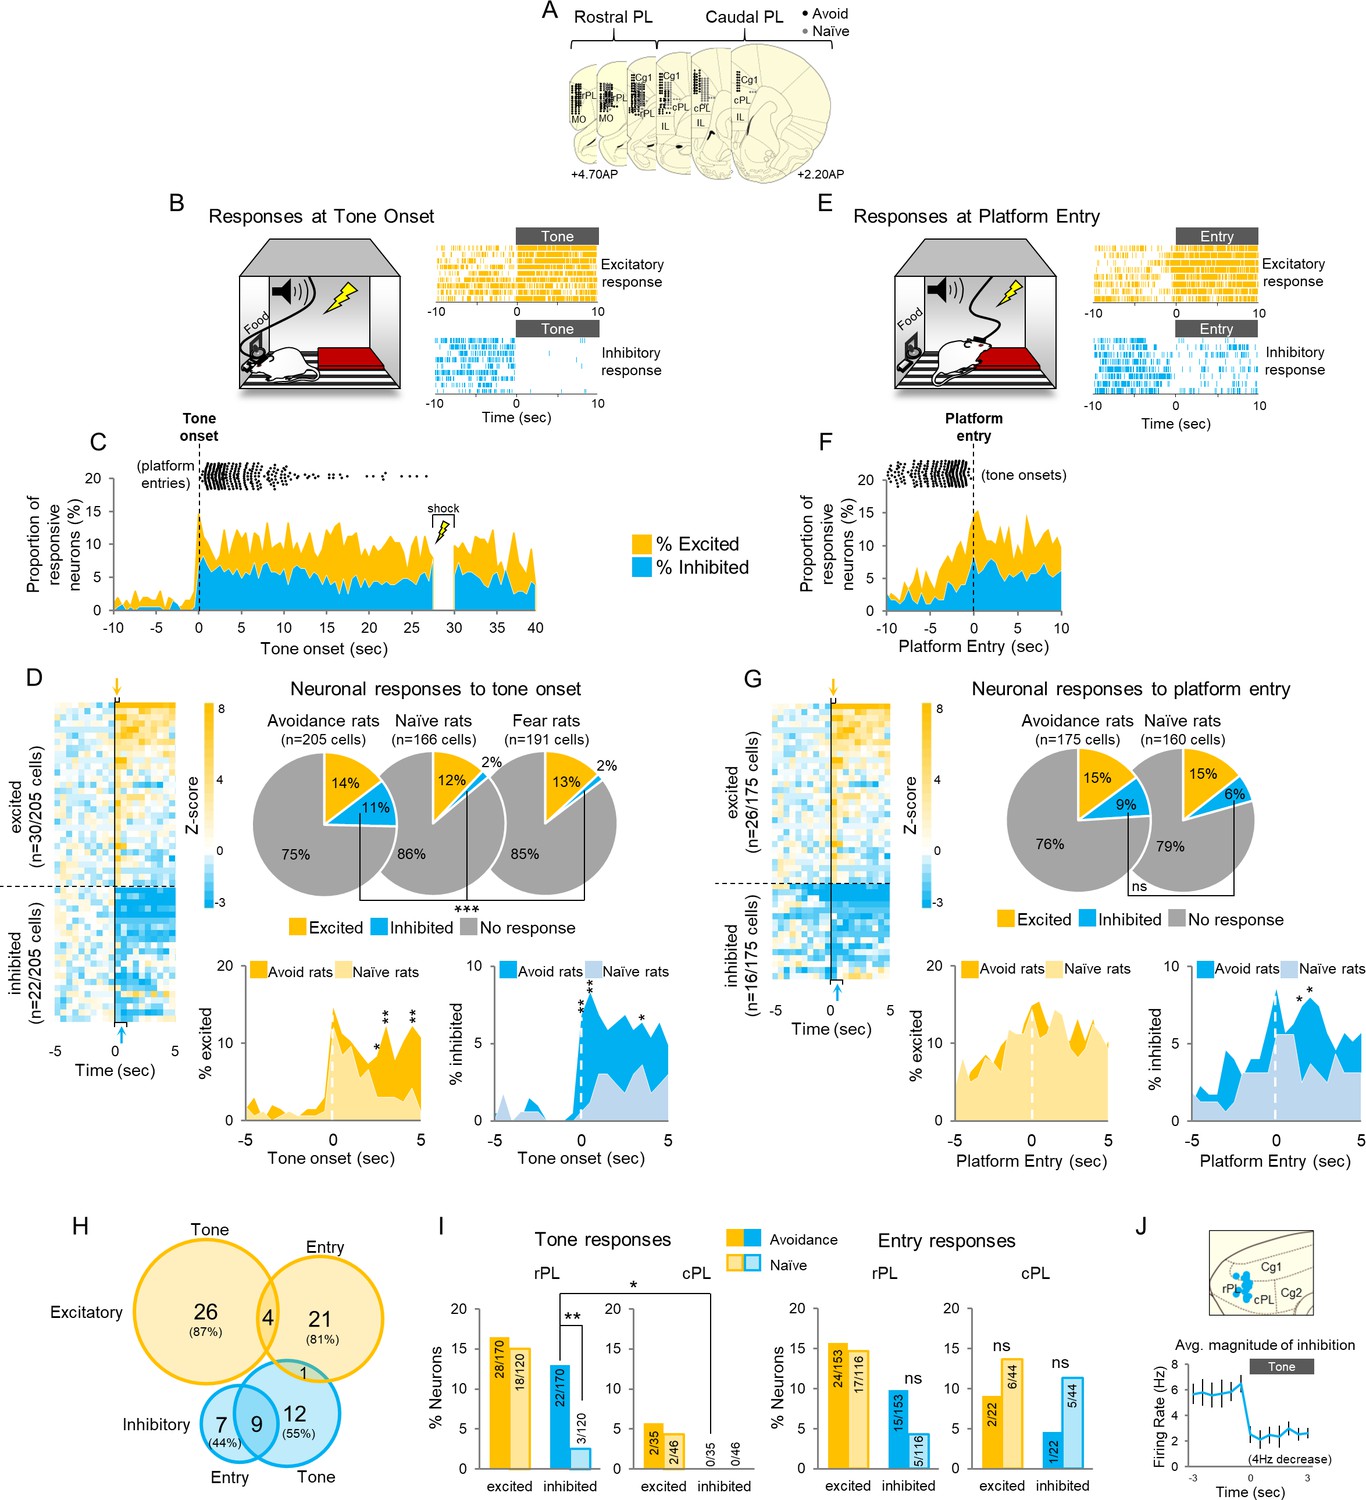
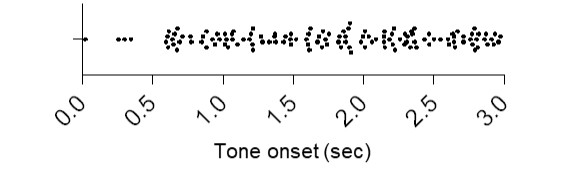
Active avoidance is correlated with inhibition in rostral PL neurons.
(A). Location of recordings across PL (n = 6 avoidance-trained and n = 8 naïve rats). (B). Left: Schematic of rat behavior at tone onset during unit recordings. Right: single unit examples of excitatory (gold rasters) and inhibitory (blue rasters) tone responses. Each row represents a single trial. (C). Proportion of excitatory (gold) or inhibitory (blue) neurons at each 500 ms bin across the tone. Time of platform entry (black dots), for all successful trials (n = 284) in avoidance rats is indicated relative to tone onset. (D). Left: Heat map of normalized (z-score) responses to tone onset (Time = 0 s) of neurons in avoidance rats. Each row represents one neuron, bin = 0.5 s. Arrows indicate bins used to determine excitatory (gold, first 500 ms bin), or inhibitory (blue, first or second 500 ms bin) tone responses. Right: Pie charts showing proportions of excited, inhibited, or non-responsive neurons at tone onset in avoidance (n = 30, 22, 153, respectively), naïve (n = 20, 3, 143, respectively), and fear conditioned (n = 25, 3, 163, respectively) rats. Proportions of inhibitory responses were significantly greater in avoidance rats compared to naïve and fear conditioned rats (Chi Square test). Bottom: Percentage of cells that were excited in avoidance (gold) or naïve (light gold) rats (left) or inhibited in avoidance (blue) or naïve (light blue) rats (right) around tone onset (Fisher exact tests). (E). Left: Schematic of rat entering platform after tone onset during unit recordings. Right: single unit examples of excitatory (gold rasters) and inhibitory (blue rasters) platform entry responses. (F). Proportion of excitatory (gold) or inhibitory (blue) neurons at platform entry. Time of tone onset (black dots), for all successful trials (n = 284) in avoidance rats is indicated relative to platform entry. (G). Left: Heat map of normalized responses to platform entry (Time = 0 s) of neurons in avoidance rats. Right: Pie charts showing proportions that were excited, inhibited, or non-responsive neurons at platform entry in avoidance (n = 26, 16, 133, respectively) and naïve rats (n = 23, 10, 127, respectively). Bottom: Percentage of cells that were excited in avoidance (gold) or naïve (light gold) rats (left) or inhibited in avoidance (blue) or naïve (light blue) rats (right) after platform entry (Fisher exact tests). (H). Venn diagram illustrating the number (and percentage) of excitatory and inhibitory responsive cells responding to tone onset, platform entry, or both. (I). Left: Proportion of neurons responding to tone onset in rostral PL (left) and caudal PL (right) in avoidance (dark bars) and naïve (light bars) groups. There were significantly more inhibitory tones responses in rPL vs cPL (Fisher Exact test). Right: Proportion of neurons responding to platform entry in rostral PL (left) and caudal (right) PL in avoidance and naïve rats. (J). Top: Sagittal view of location of inhibitory tone responsive neurons (blue). Bottom: Average inhibitory response of neurons decreased from a baseline firing rate of 5.8 Hz to 1.98 Hz at tone onset. Data are shown as mean ± SEM; *p<0.05, **p<0.01, ***p<0.001.
-
Figure 3—source data 1
PL unit recording data.
- https://doi.org/10.7554/eLife.34657.010
Figure 3—figure supplement 1
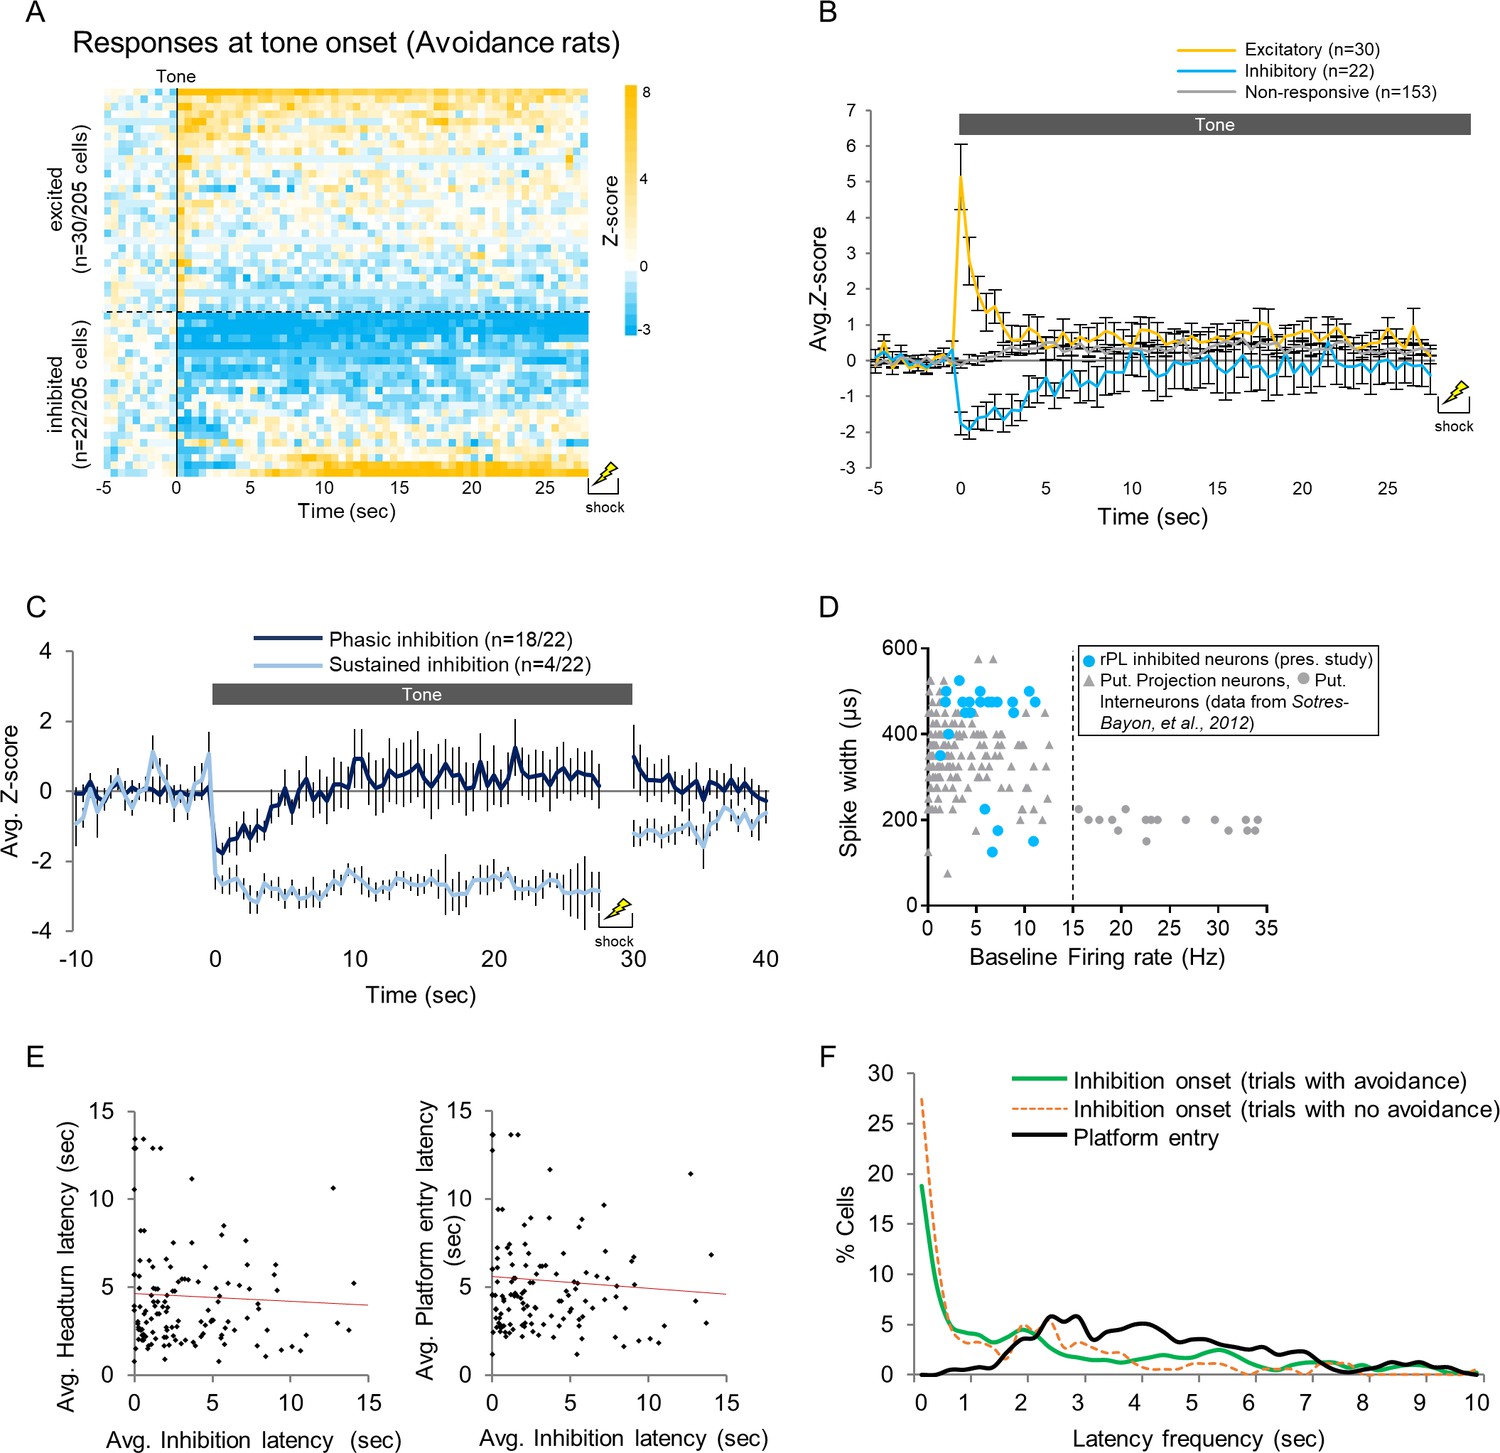
Characterization of PL single unit responses during avoidance.
(A). Heat map of normalized (z-score) responses to tone onset (Time = 0 s) of excitatory (top) and inhibitory (bottom) neurons in avoidance rats. Each row represents one neuron, bin = 0.5 s (this is an extension of Figure 3D). (B). Averaged normalized (z-score) responses to tone onset (0 s) of excitatory (gold), inhibitory (blue), and non-responsive (grey) neurons in avoidance rats. Data are shown as mean ± SEM. (C). Normalized firing rate of 22 cells showing inhibition at tone onset. In one subset, inhibition ended before tone offset (phasic inhibition; dark blue), and in another subset inhibition lasted throughout the tone (sustained inhibition; light blue). Data are shown as mean ± SEM. (D). rPL neurons showing inhibitory responses (blue, n = 22) were classified as putative projection neurons based on data from a previous study from our lab measuring spike width and baseline firing rate in PL neurons (shown in grey; Sotres-Bayon et al., 2012). (E). Dot plot of the average latency of headturn (left) and platform entry (right) and the average latency of inhibition onset for each cell (n = 133). There was no significant correlation for either behavior. (F). Frequency distribution of the average inhibition latency of each cell (n = 133) showing inhibition during the tone in trials with (green) and trials with no avoidance (orange dash) overlaid onto the frequency distribution of the average headturn (dark grey) avoidance latency (black) in those trials.
Figure 4
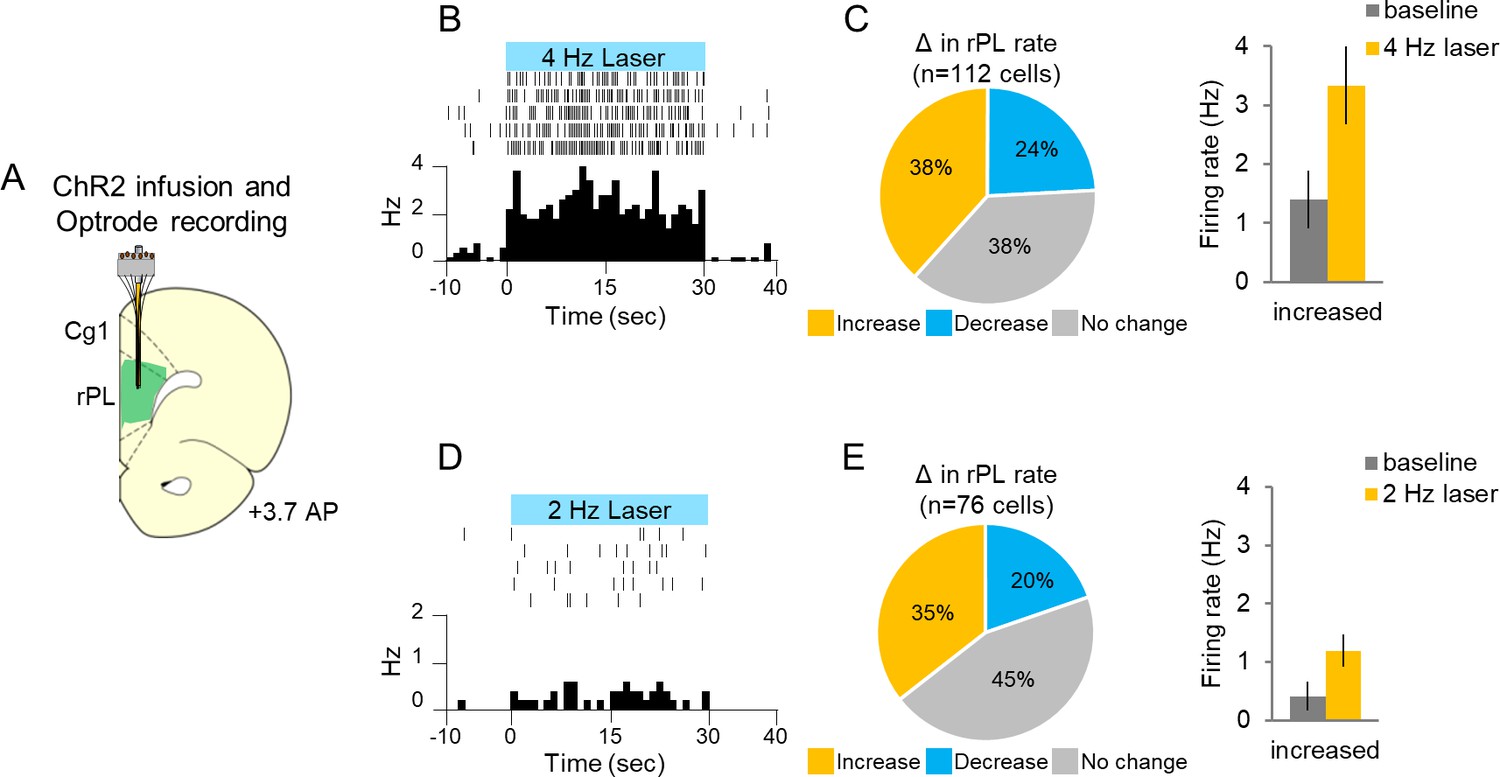
Single-unit recording with photoactivation in rostral PL neurons of anesthetized rats.
(A). Schematic of ChR2 expression and optrode placement (n = 4 rats). (B). Rasters and peristimulus time histograms of a representative single neuron showing increased firing rate during 4 Hz laser illumination (8–10 mW, 473 nm, 30 s ON, 30 s OFF, five trials). (C). Left: Proportion of neurons showing an increase (gold, n = 43), decrease (blue, n = 27), or no change (grey, n = 42) in firing rate with laser ON. Right: Average firing rate at baseline (dark grey) and 4 Hz photoactivation for neurons showing increased (gold) changes in firing rate. (D). Rasters and peristimulus time histograms of a representative single neuron showing increased firing rate during 2 Hz laser illumination (8–10 mW, 473 nm, 30 s ON, 30 s OFF, five trials). (E). Left: Proportion of neurons showing an increase (n = 27), decrease (n = 15), or no change (n = 34) in firing rate with laser ON. Right: Average firing rate at baseline, and 2 Hz photoactivation for neurons showing increased changes in firing rate. Data are shown as mean ± SEM.
-
Figure 4—source data 1
ChR2 anesthetized unit recording data.
- https://doi.org/10.7554/eLife.34657.012
Figure 5 with 1 supplement
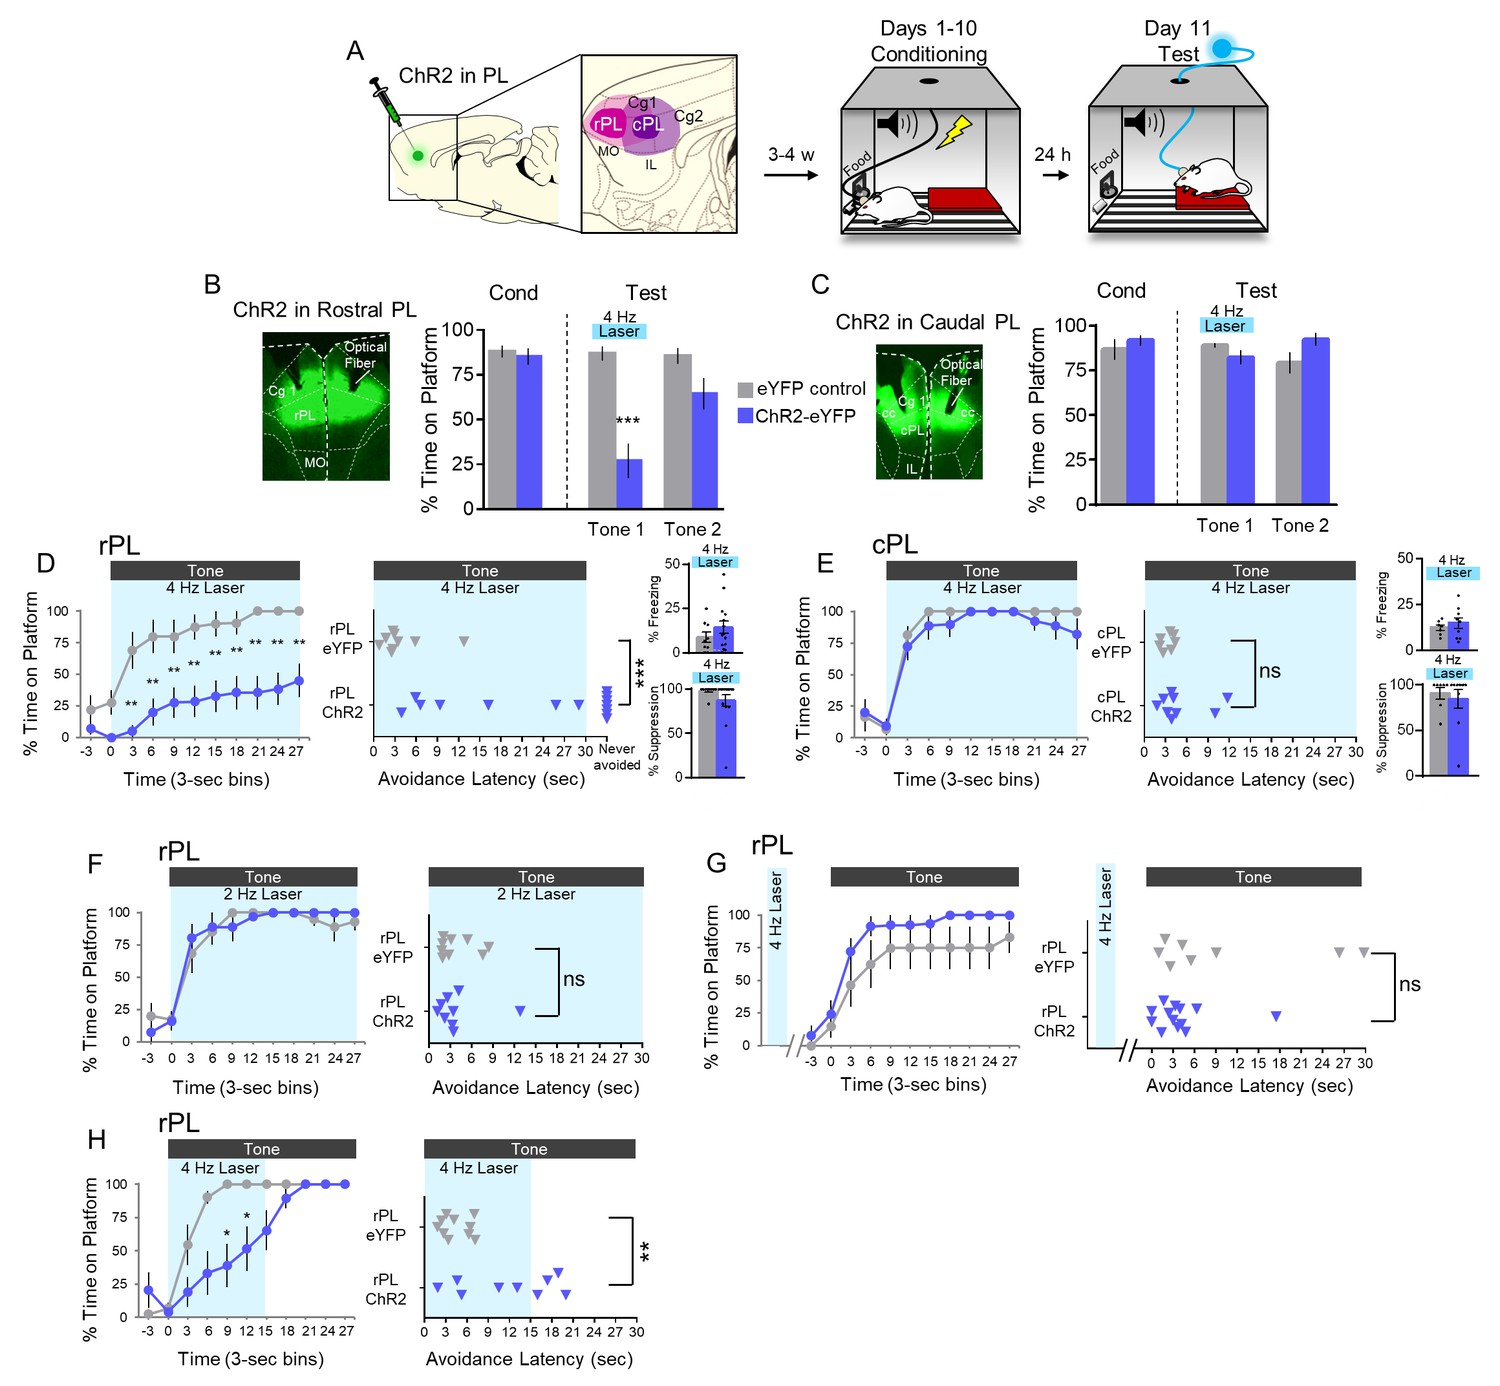
4 Hz photoactivation of neurons in rostral PL delays or prevents avoidance.
(A). Schematic of viral infusion and location of min/max spread of AAV expression in rPL (pink) and cPL (purple), followed by avoidance training. At Test, 473 nm light was delivered to rPL or cPL during the 30 s tone presentation (Tone 1). (B). Left: Micrograph of ChR2 expression and optical fiber placement in rPL. Right: Percent time on platform at Cond (Day 10, Tone 1) and Test (Day 11, Tone 1 with laser ON and Tone 2 with laser OFF) for rPL-eYFP control rats (grey, n = 9) and rPL-ChR2 rats (blue, n = 14). (C). Left: Micrograph of ChR2 expression and optical fiber placement in cPL. Right: Percent time on platform during Cond and Test for cPL-eYFP control rats (grey, n = 7) and cPL-ChR2 rats (blue, n = 9). (D). Left: Time spent on platform in 3 s bins (Tone one at Test) revealed that rPL-ChR2 rats were significantly delayed in their avoidance compared to eYFP controls (repeated measures ANOVA, post hoc tukey). Right: Latency of avoidance for each rat (Mann Whitney U test, Tone 1 at Test). 7/14 rats never avoided. Inset: There was no effect of rPL photoactivation (Tone 1 at Test) on freezing (top) and percent suppression of bar pressing (bottom) during the tone (unpaired t-test). (E). Timeline of avoidance (left) and latency (right) for ChR2-cPL rats and eYFP controls revealed no effect of 4 Hz photoactivation of cPL. Inset: There was no effect of cPL photoactivation (Tone 1 at Test) on freezing (top) and percent suppression of bar pressing (bottom) during the tone (unpaired t-test). (F). Timeline of avoidance (left) and latency (right) for rPL-ChR rats (blue, n = 9) and rPL-eYFP controls (grey, n = 9) revealed no effect of 2 Hz photoactivation. (G). Timeline of avoidance (left) and latency (right) for rPL-ChR2 rats (blue, n = 13) and rPL-eYFP controls (grey, n = 8) revealed no effect of 4 Hz photoactivation (30 s) during the ITI period. (H). Timeline of avoidance (left) and latency (right) for and rPL-ChR2 rats (blue, n = 9) and rPL-eYFP controls (grey, n = 10) revealed a delay in avoidance with 4 Hz photoactivation during the first 15 s of the tone (Mann Whitney U test for time course and avoidance latency). All data are shown as mean ± SEM; *p<0.05; **p<0.01; ***p<0.001.
-
Figure 5—source data 1
Open field measures during blue laser illumination in rPL with ChR2.
- https://doi.org/10.7554/eLife.34657.015
Figure 5—figure supplement 1
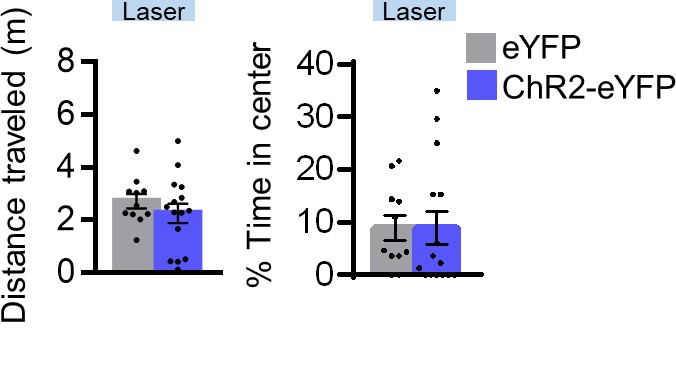
Assessment of locomotion and anxiety following 4 Hz photoactivation of rPL neurons.
Distance traveled (left) and percent time in center (right) in an open field during a 30 s period of 4 Hz photoactivation (n = 11 ChR2-eYFP, n = 15 Chr2-rPL). All data are shown as mean ± SEM, *p<0.05.
Author response image 1
Author response image 2

Author response image 3
Videos
Video 1
4 Hz photoactivation of rostral PL neurons during the tone impairs avoidance.
Video of an individual rat with ChR2 infused into rPL showing avoidance behavior on the last day of avoidance training (Day 10) at Tone 1, followed by the rat’s behavior at Test (Day 11) with the laser on during the tone (4 Hz, 30 s duration, 5 ms pulse width, 8–10 mW light intensity).
Additional files
-
Transparent reporting form
- https://doi.org/10.7554/eLife.34657.017
Download links
A two-part list of links to download the article, or parts of the article, in various formats.
Downloads (link to download the article as PDF)
Open citations (links to open the citations from this article in various online reference manager services)
Cite this article (links to download the citations from this article in formats compatible with various reference manager tools)
Active avoidance requires inhibitory signaling in the rodent prelimbic prefrontal cortex
eLife 7:e34657.
https://doi.org/10.7554/eLife.34657


