A polymorphism in the tumor suppressor p53 affects aging and longevity in mouse models
- Rutgers, the State University of New Jersey, United States
- Zhejiang University, China
Figures
Figure 1 with 1 supplement
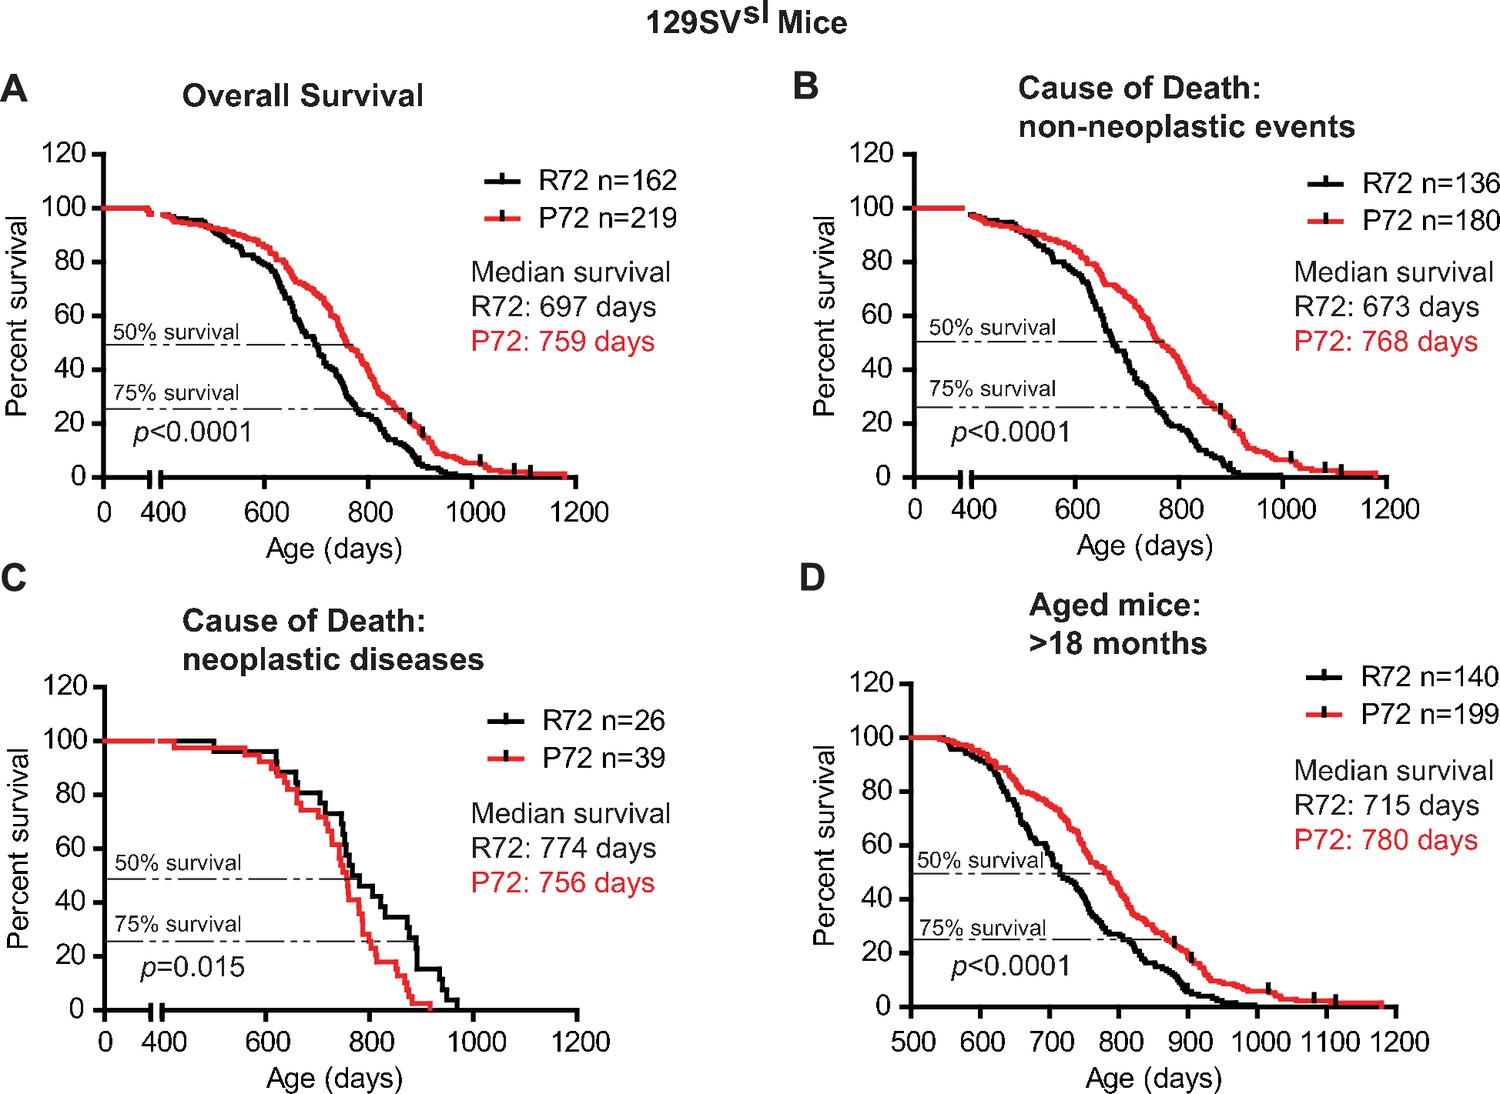
The lifespans of 129SVsl p53 R72 mice and p53 P72 mice.
(A) The overall survival of 129SVsl R72 mice (n = 162) and P72 mice (n = 219). The median survival is 697 days and 759 days for R72 and P72 mice, respectively. p<0.0001. (B) Survival of 129SVsl R72 mice (n = 136) and P72 mice (n = 180) died from non-neoplastic events. The median survival is 673 days and 768 days for R72 and P72 mice, respectively. p<0.0001. (C) Survival of 129SVsl R72 mice (n = 26) and P72 mice (n = 39) died from neoplastic diseases. The median survival is 774 days and 756 days for R72 mice and P72 mice, respectively. p=0.015. (D) Survival of 129SVsl R72 mice (n = 140) and P72 mice (n = 199) older than 18 months. The median survival is 715 days and 780 days for R72 mice and P72 mice, respectively. p<0.0001. Log-rank test was used to analyze the difference in survival.
Figure 1—figure supplement 1
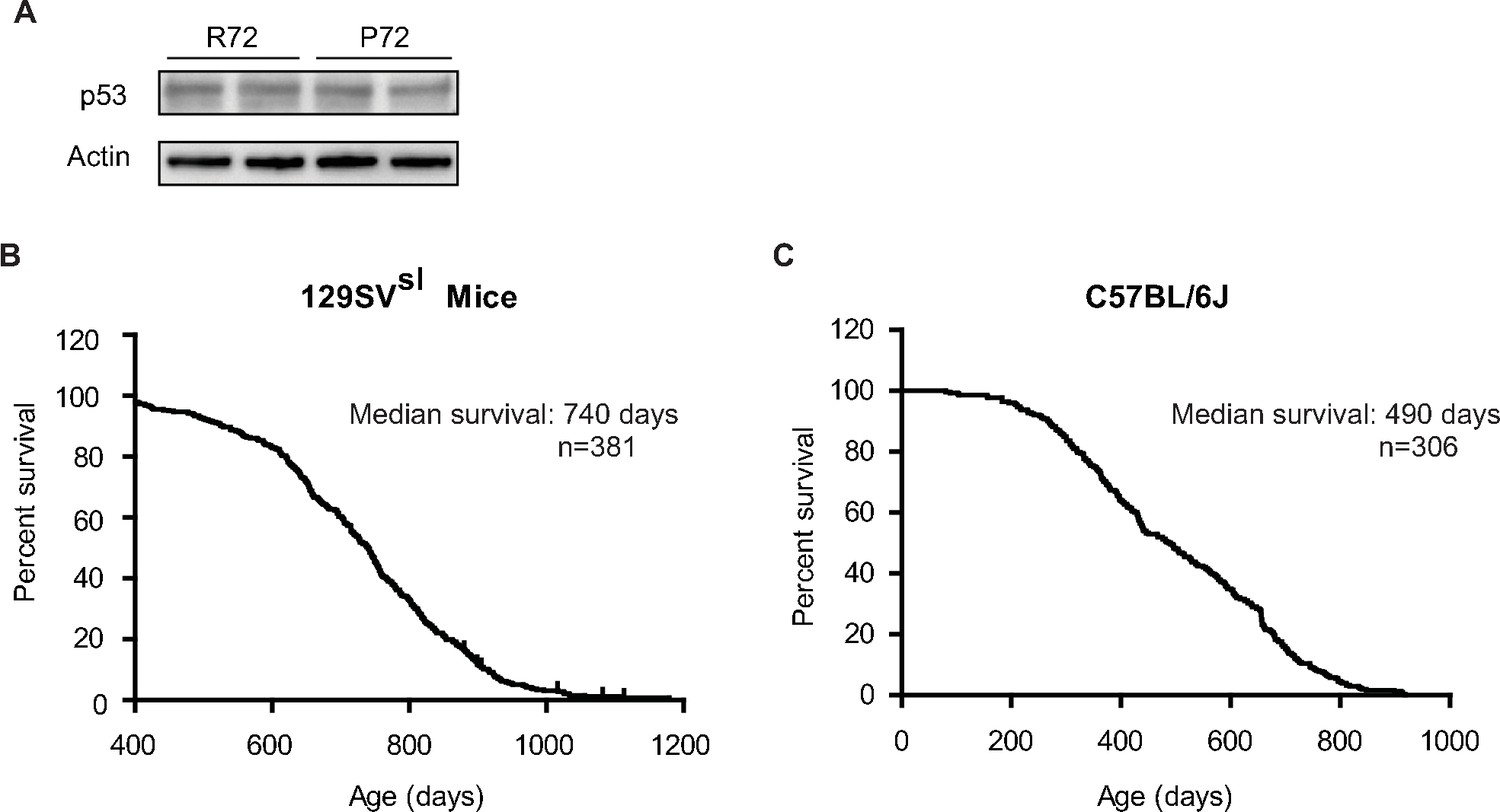
The p53 protein levels in the bone marrow from 129SVsl p53 Hupki mice and the lifespans of 129SVsl and C57BL/6J p53 Hupki mice.
(A) The p53 protein levels in the bone marrow from 129SVsl p53 P72 and R72 mice were determined by the Western-blot assays. (B) The lifespan of 129SVsl p53 Hupki mice, including both p53 P72 and p53 R72 mice (median survival: 740 days; n = 381). (C) The lifespan of C57BL/6J Hupki mice, including both p53 P72 and p53 R72 mice (median survival: 490 days; n = 306).
Figure 2
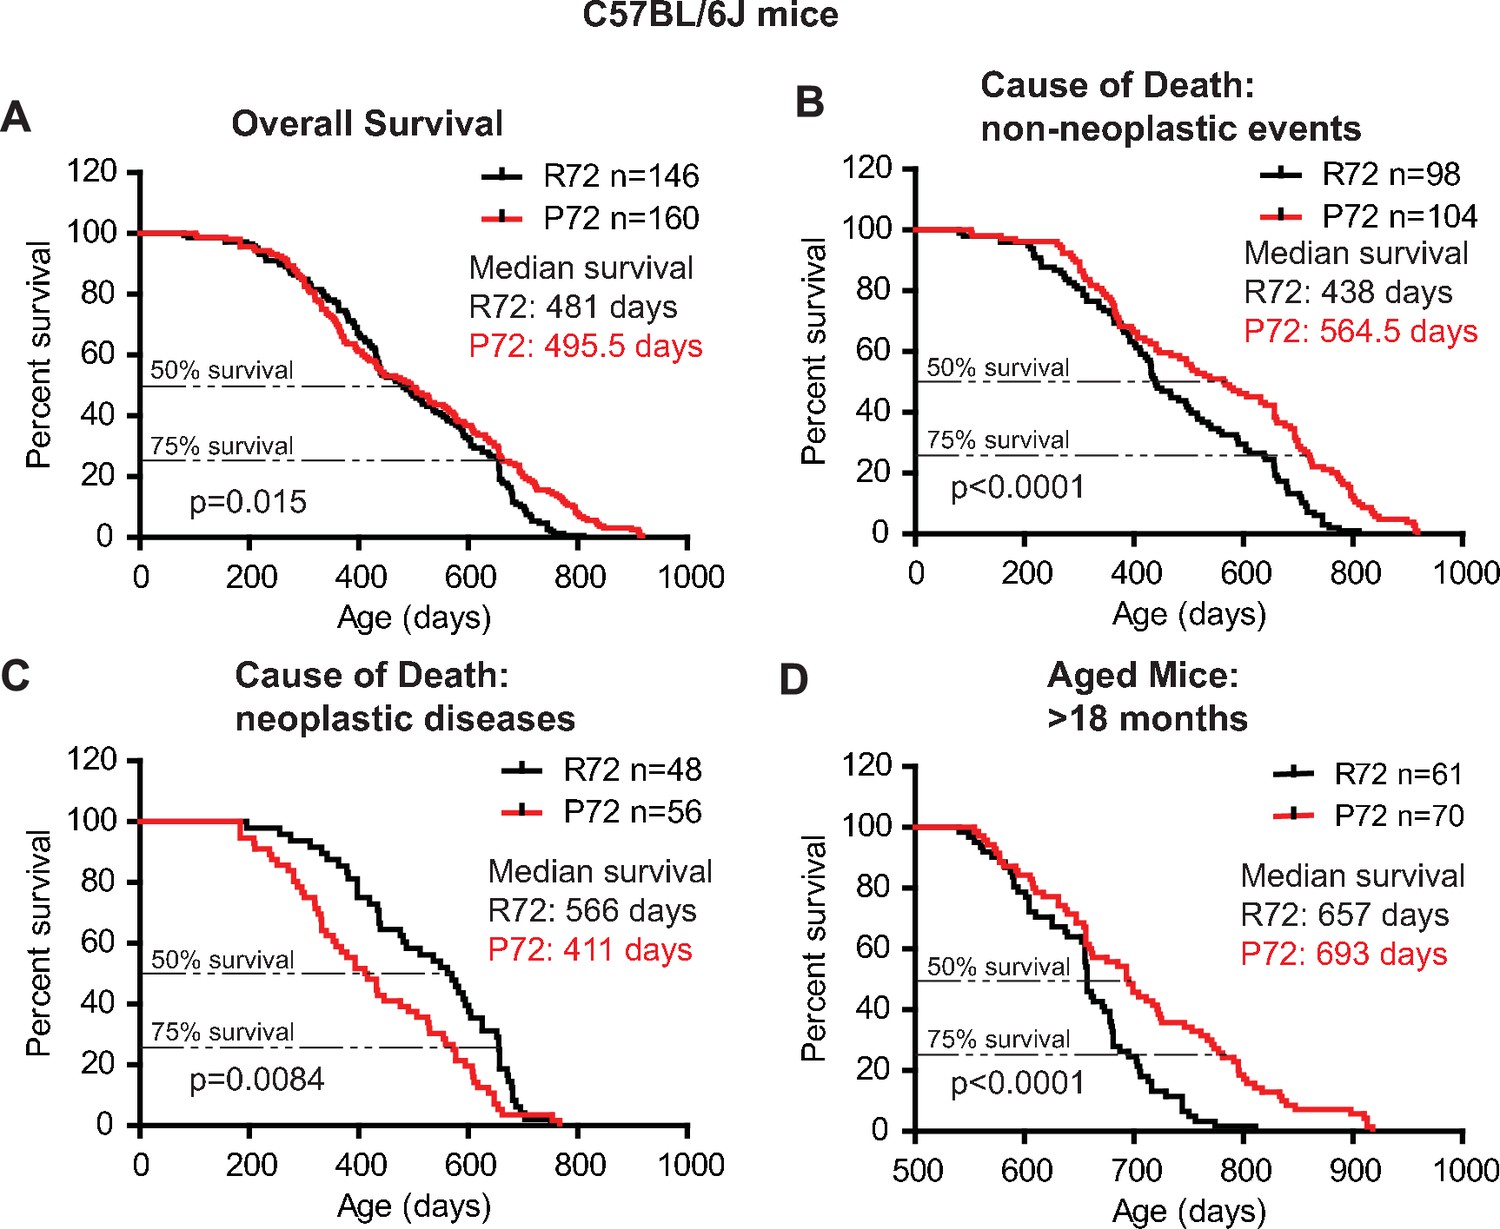
The lifespans of C57BL/6J p53 R72 mice and p53 P72 mice.
(A) The overall survival of C57BL/6J R72 mice (n = 146) and P72 mice (n = 160). The median survival is 481 days and 495.5 days for R72 and P72 mice, respectively. p=0.015. (B) Survival of C57BL/6J R72 mice (n = 98) and P72 mice (n = 104) died from non-neoplastic events. The median survival is 438 days and 564.5 days for R72 and P72 mice, respectively. p<0.0001. (C) Survival of C57BL/6J R72 mice (n = 48) and P72 mice (n = 56) died from neoplastic disease. The median survival is 566 days and 411 days for R72 mice and P72 mice, respectively. p=0.0084. (D) Survival of C57BL/6J R72 mice (n = 61) and P72 mice (n = 70) older than 18 months. The median survival is 657 days and 693 days for R72 mice and P72 mice, respectively. p<0.0001. Log-rank test was used to analyze the difference in survival.
Figure 3
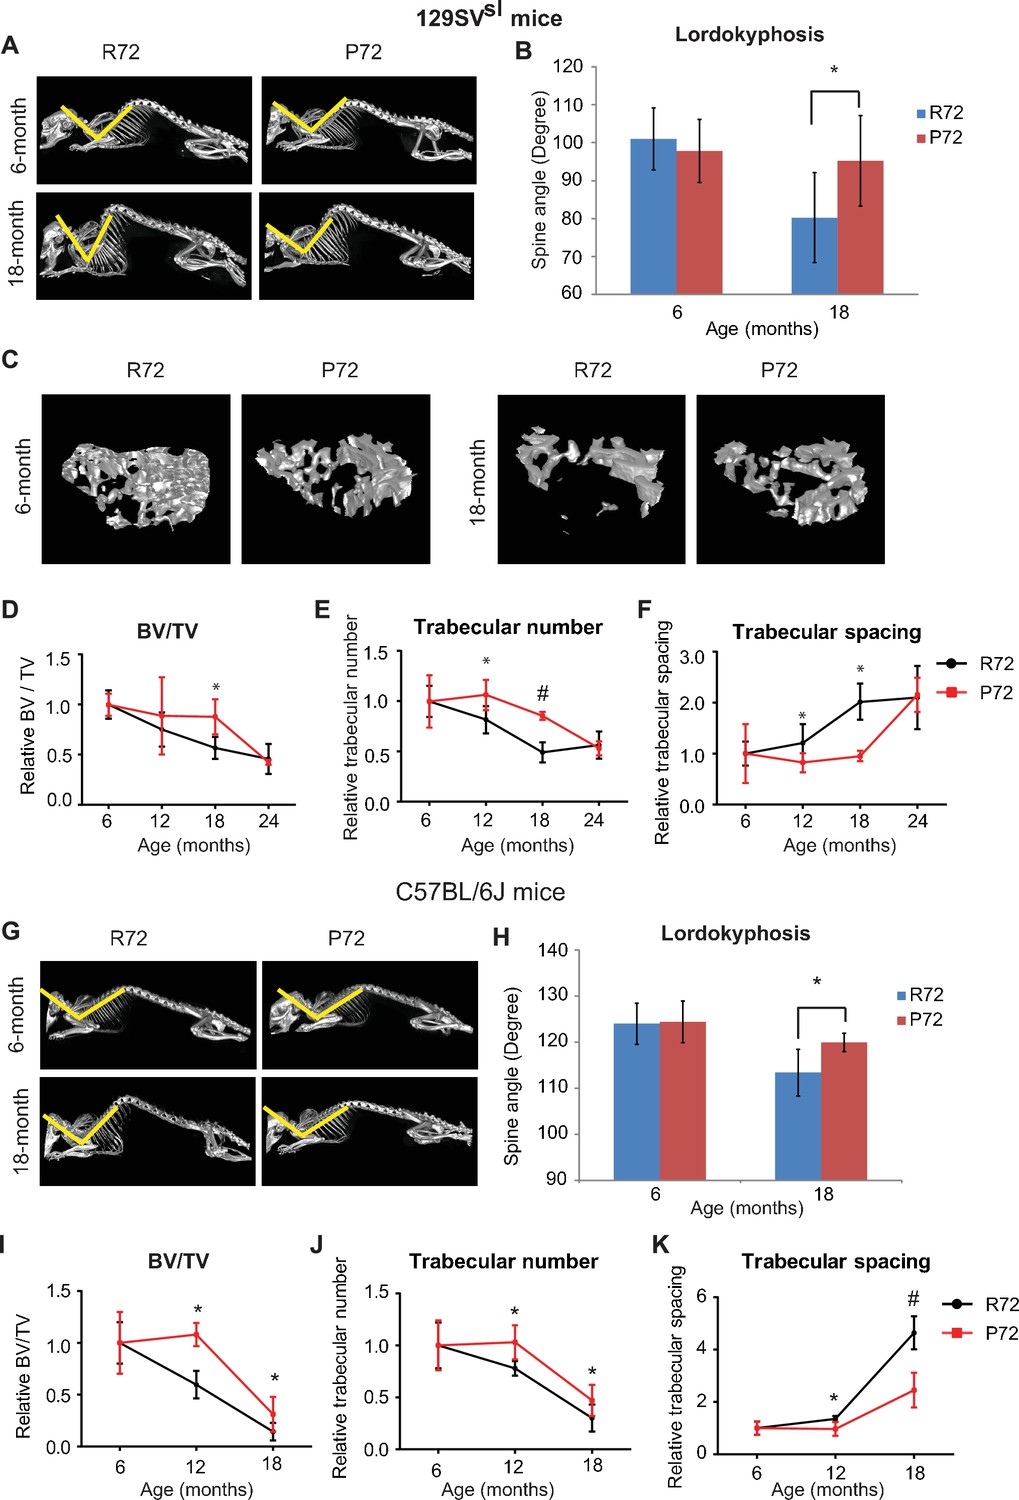
p53 P72 mice have a delay in developing aging-associated bone structure phenotypes compared with p53 R72 mice.
(A) Lordokyphosis in 129SVsl R72 and P72 mice. Shown are representative images taken with the INVEON PET/CT system of mouse whole skeleton at different ages. (B) Average of spine angles from 6-month-old and 18-month-old 129SVsl R72 and P72 mice. A narrowing of the angle indicates an increase in lordokyphosis. n = 5/group, *: p<0.05; Student’s t-test. (C) Representative micro-CT bone structure images taken with the INVEON PET/CT system of tibias from 129SVsl R72 and P72 mice at different ages. (D–F) Quantification of bone volume relative to total volume (D), trabecular number (E) and trabecular spacing (F) from micro-CT scans of tibias from 129SVsl R72 and P72 mice at different ages using INVEON Research Workplace software. Data were presented as mean ± SD. n = 3, *: p<0.05, #: p<0.01; Student’s t-test. (G) Lordokyphosis in C57BL/6J R72 and P72 mice. Shown are representative images of mouse whole skeleton at different ages. (H) Average of spine angles from 6-month-old and 18-month-old C57BL/6J R72 or P72 mice. n = 5, *: p<0.05; Student’s t-test. (I–K) Quantification of bone volume relative to total volume (I), trabecular number (J) and trabecular spacing (K) from micro-CT scans of tibias from C57BL/6J R72 and P72 mice at different ages using INVEON Research Workplace software. Data were presented as mean ± SD. n = 3, *: p<0.05, #: p<0.01; Student’s t-test.
-
Figure 3—source data 1
Average of spine angle from 6-month-old and 18-month-old R72 and P72 mice.
Quantification of bone volume relative to total volume of tibias from micro-CT scans of R72 and P72 mice at different ages. Quantification of trabecular number of tibias from micro-CT scans of R72 and P72 mice at different ages. Quantification of trabecular spacing from micro-CT scans of tibias from R72 and P72 mice at different ages.
- https://doi.org/10.7554/eLife.34701.008
Figure 4
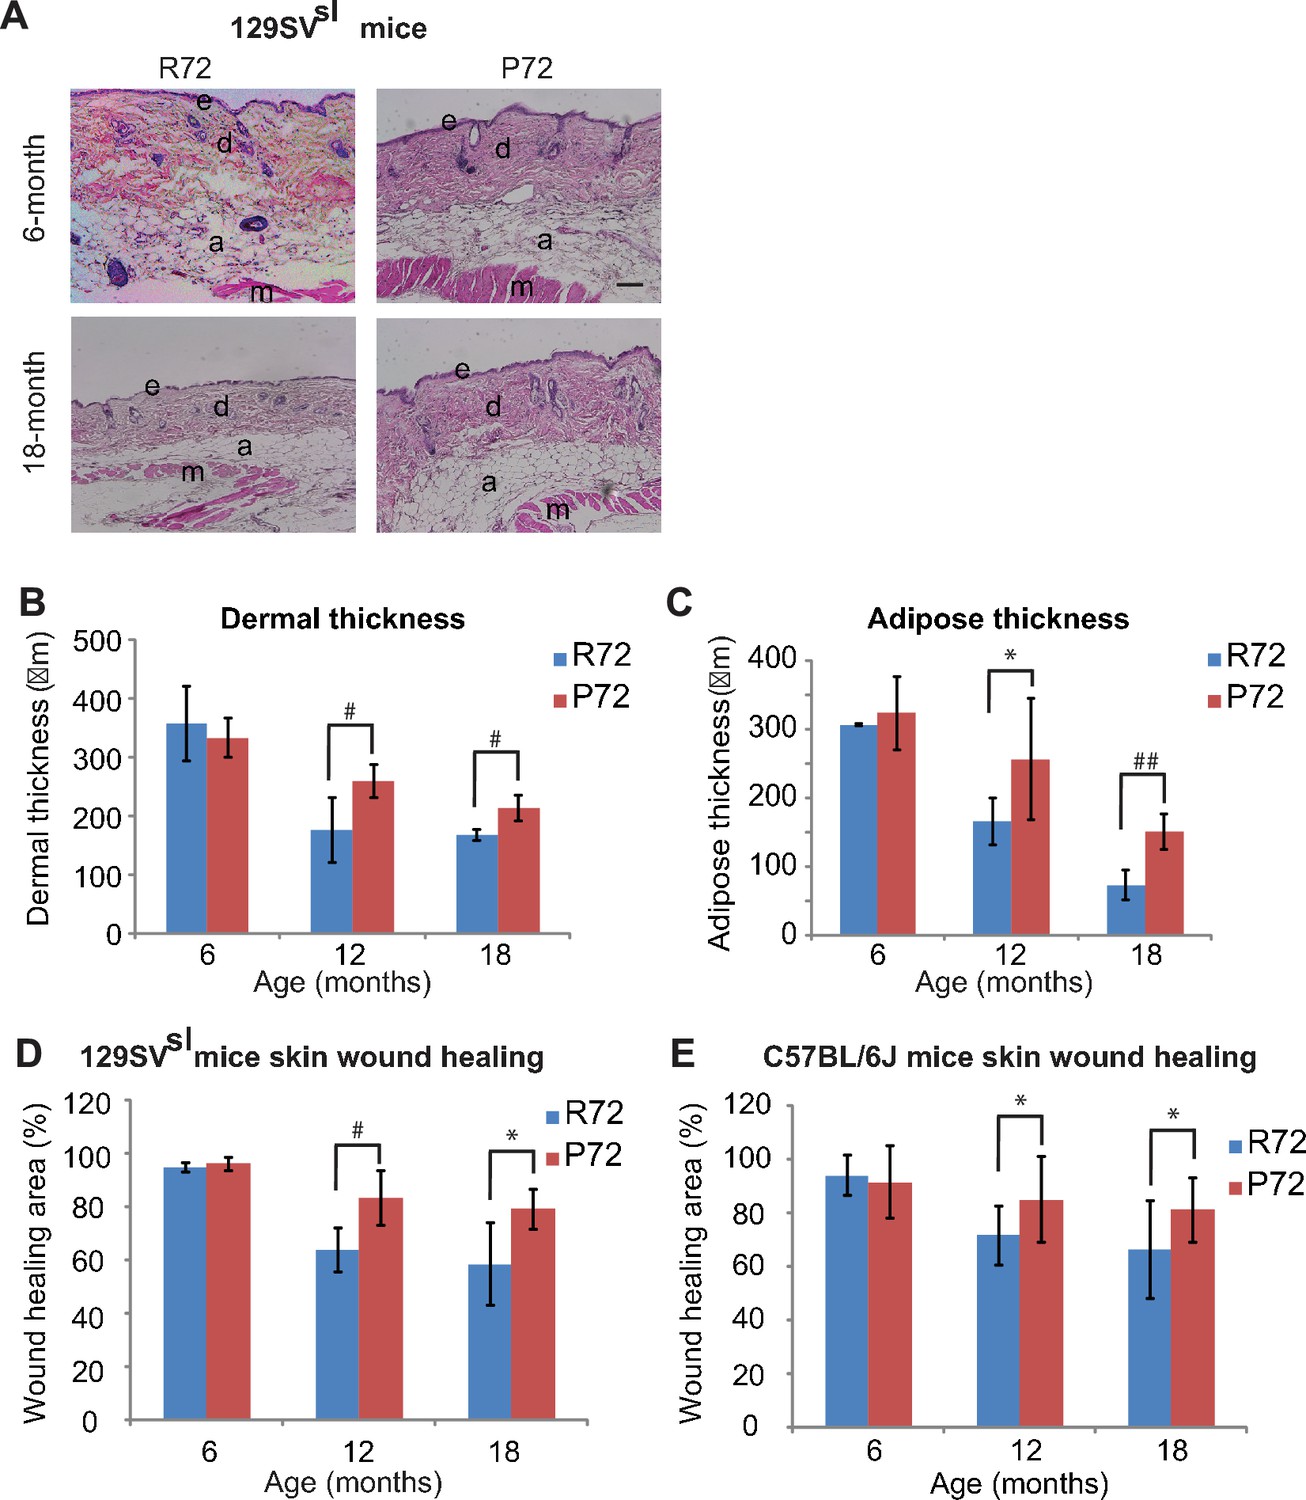
p53 P72 mice have a delay in developing aging-associated skin phenotypes compared with p53 R72 mice.
(A) H and E staining of cross-sections of dorsal skins from 129SVsl R72 mice and P72 mice at different ages. e: epidermis; d: dermis; a: adipose; m: muscle. Scale bar: 100 µm. (B and C) Quantification of dermal thickness (B) and subcutaneous adipose layer thickness (C) of 129SVsl R72 mice and P72 mice at different ages. (D and E) Skin wound healing abilities in 129SVsl (D) and C57BL/6J (E) R72 and P72 mice at different ages. The skin wound area was quantified as 0.25 × π ×width × length. For (B–E), data were presented as mean ± SD, n ≥ 5/group, *: p<0.05, #:p<0.01, ##: p<0.001; Student’s t-test.
-
Figure 4—source data 1
Quantification of dermal thickness of 129SV R72 and P72 mice at different ages.
Quantification of subcutaneous adipose layer thickness of 129SVslsl R72 and P72 mice at different ages. Quantification of wound healing areas in 129SVsl R72 and P72 mice at different ages. Quantification of wound healing areas in C57BL/6J R72 and P72 mice at different ages.
- https://doi.org/10.7554/eLife.34701.010
Figure 5 with 1 supplement
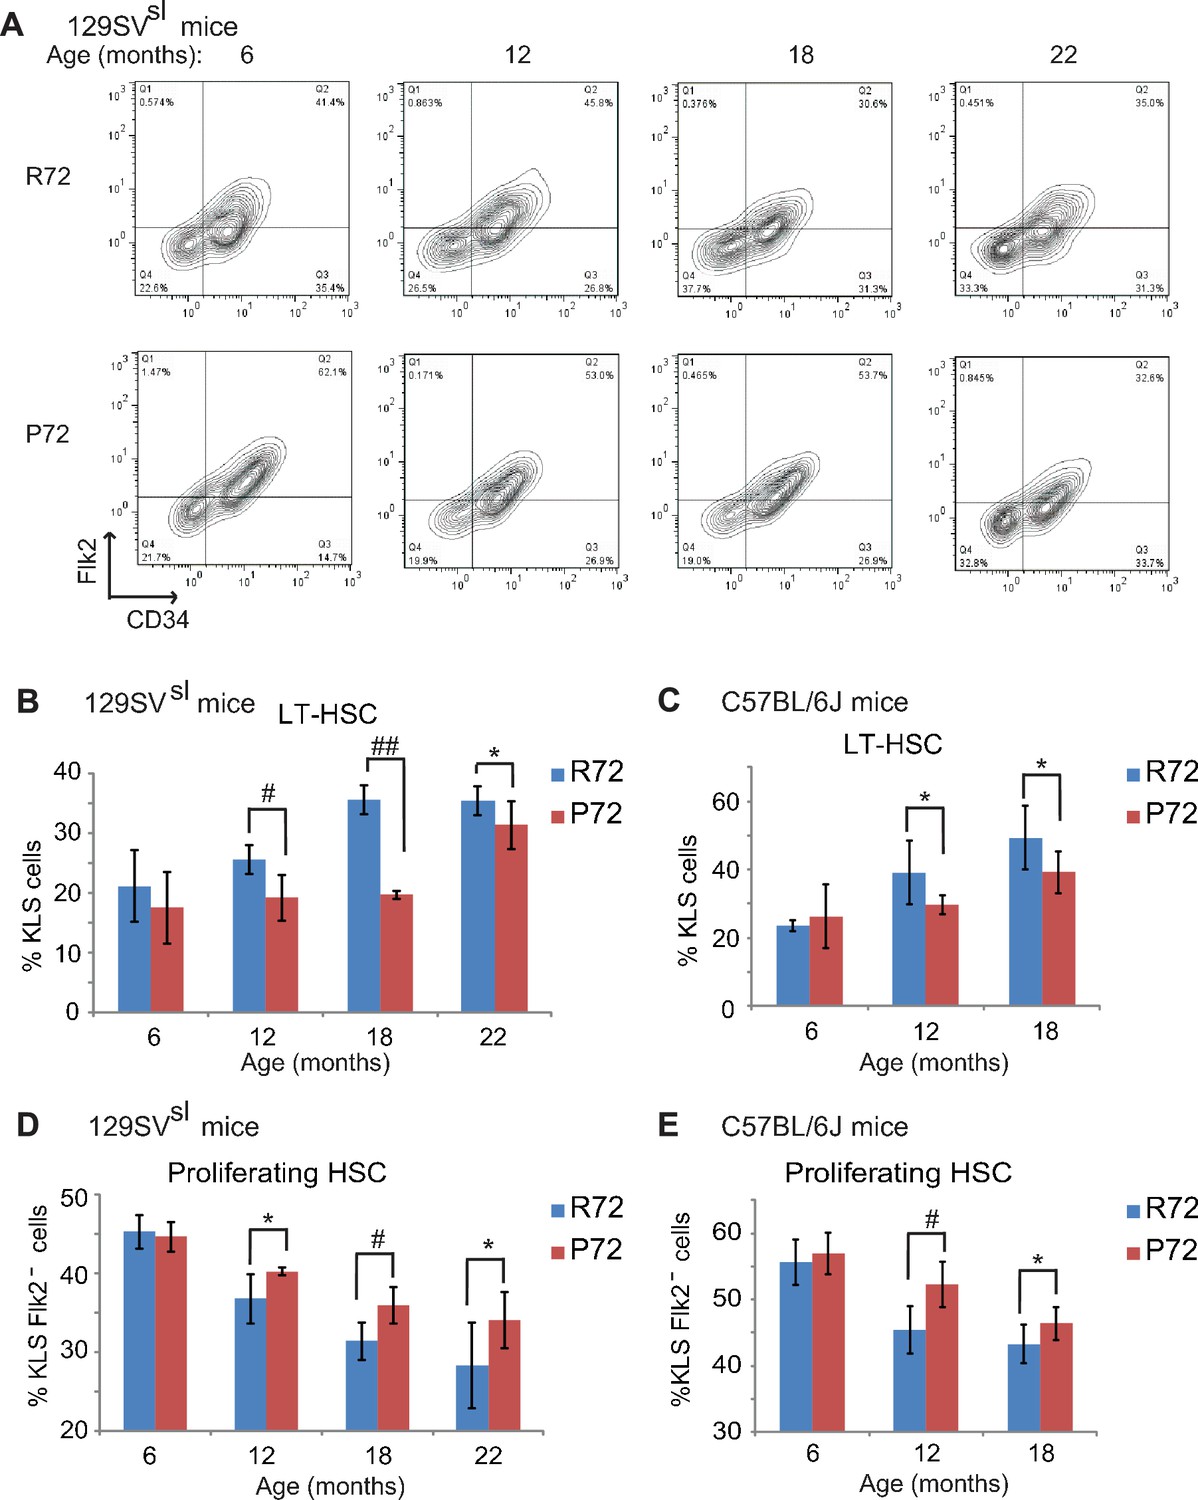
HSCs from p53 P72 mice exhibit a delayed aging phenotype compared with HSCs from p53 R72 mice.
(A) The representative gating of long-term HSCs (LT-HSCs) in 129SVsl R72 mice and P72 mice. LT-HSCs were identified as Lin-/low, Sca1+, c-kit+ and CD34-, Flk2- cells from bone marrow by flow cytometry analysis. (B and C) The bar graph represents the percentage of LT-HSCs in the bone marrow of 129SVsl (B) and C57BL/6J (C) R72 mice and P72 mice at different ages. Data were presented as mean ± SD. n ≥ 5/group, *: p<0.05, #: p<0.01, ##: p<0.001; Student’s t-test. (D and E) The bar graph represents the percentage of proliferating HSCs in the bone marrow of 129SVsl (D) and C57BL/6J (E) R72 mice and P72 mice at different ages. Proliferating HSCs were labeled with BrdU for 16 hr in vivo and then identified as Lin-/low, Sca1+, c-kit+, Flk2 - and BrdU+ by flow cytometry analysis. Data were presented as mean ± SD. n = 5/group, *: p<0.05, #: p<0.01; Student’s t-test.
-
Figure 5—source data 1
The percentage of LT-HSCs in the bone marrow of R72 and P72 mice at different ages.
The percentageof proliferating HSCs in the bone marrow of R72 and P72 mice at different ages.
- https://doi.org/10.7554/eLife.34701.013
Figure 5—figure supplement 1
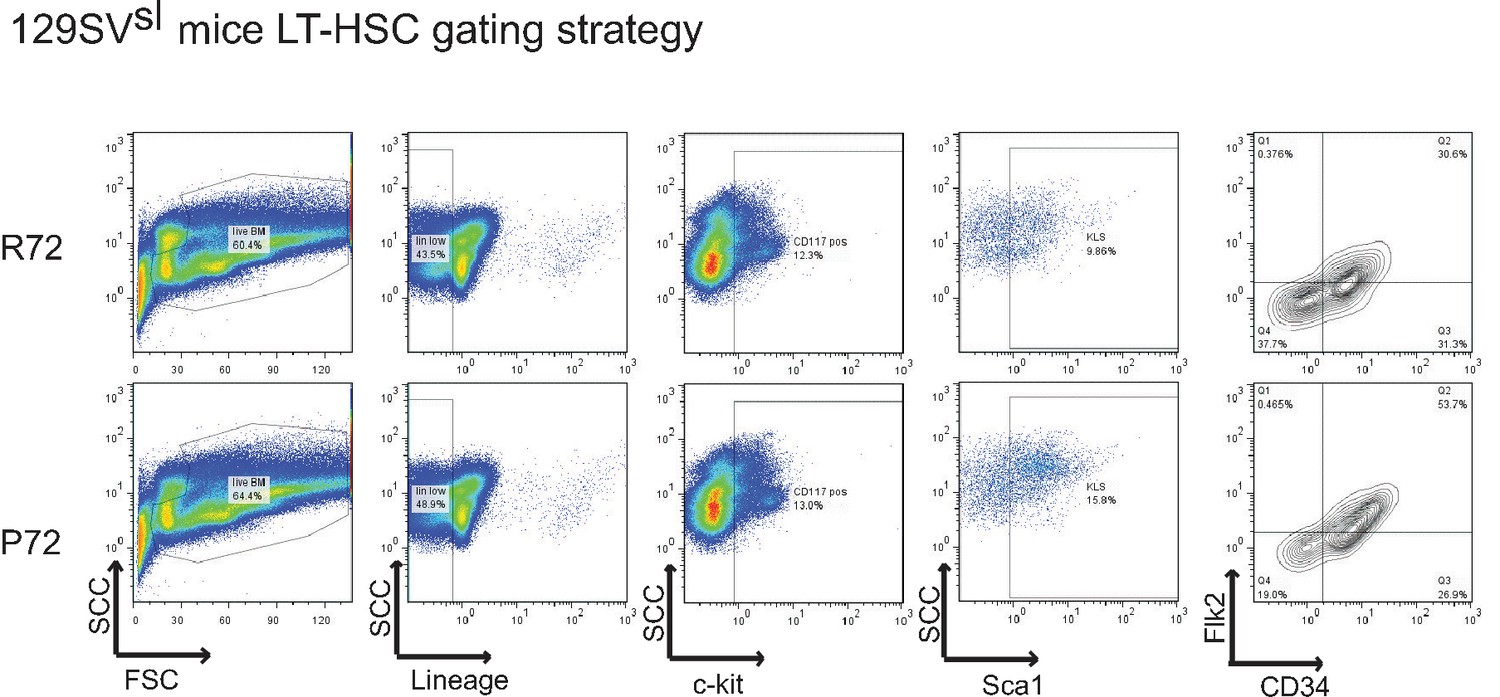
The gating strategy to identify LT-HSCs.
Live bone marrow cells from 18-month-old 129SVsl p53 R72 mice (upper panels) and p53 P72 mice (lower panels) were gated to identify LT-HSCs. LT-HSCs were selected based on low or negative expression of mature lineage markers (Lin-/low), dual positive staining of Sca-1 and c-kit, and double negative expression of Flk2 and CD34.
Figure 6
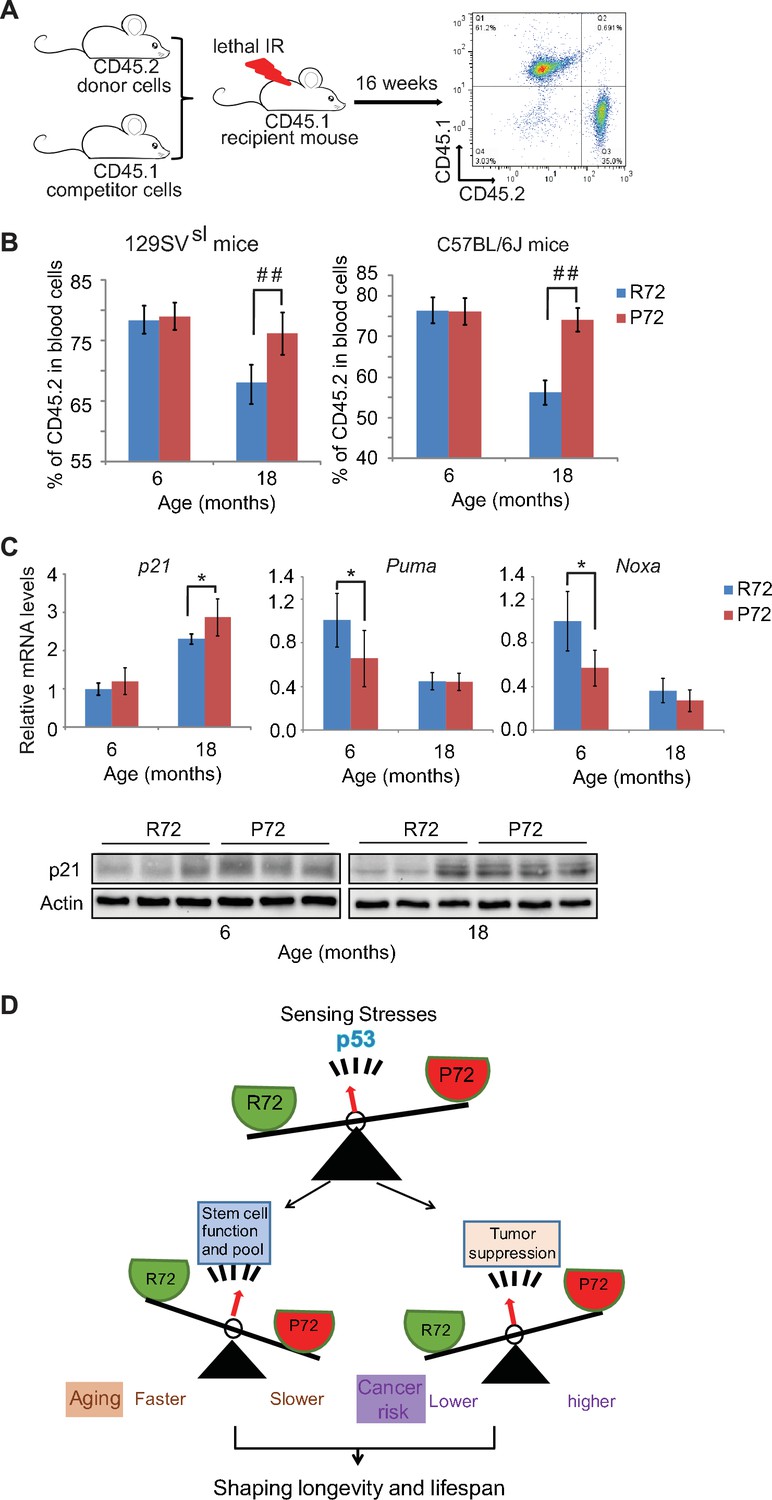
Aged p53 P72 mice exhibit better hematopoietic stem cell self-renewal and repopulation abilities compared with aged p53 R72 mice.
(A) The experimental design for bone marrow transplantation assays to examine engraftment and repopulation abilities of HSCs in mice. (B) Percentage of CD45.2 cells in peripheral blood at 16 weeks after engraftment. In both 129SVsl mice (left) and C57BL/6J mice (right), aged P72 mice showed better stem cell abilities of engraftment and repopulation compared with aged R72 mice. n = 6/group, ##: p<0.001; Student’s t-test. (C) The mRNA expression levels of p21, Puma and Noxa (upper panels) and the protein expression levels of p21 (lower panels) in bone marrow from 129SVsl p53 R72 and P72 mice at different ages as determined by real-time PCR assays and Western-blot assays, respectively. Data were presented as mean ± SD, n = 4/group, *p<0.05; Student’s t-test. (D) A schematic model depicting the dual functions of p53 codon 72 SNP in regulating longevity.
-
Figure 6—source data 1
Percentage of CD45.2 cells in peripheral blood at 16 weeks after engraftment.
The mRNA expression levels of p21, Puma and Noxa in bone marrow from 129SVsl p53 R72 and P72 mice.
- https://doi.org/10.7554/eLife.34701.015
Tables
Table 1
Major contributing causes of death in mice evaluated at end of life.
https://doi.org/10.7554/eLife.34701.005| 129SVsl | C57BL/6J | |||
|---|---|---|---|---|
| R72 | P72 | R72 | P72 | |
| n (%) | n (%) | n (%) | n (%) | |
| Neoplasm | 26 (16.3) | 39 (18.3) | 48 (32.9) | 56 (35) |
| Nonspecific systemic disease | 33 (20.6) | 47 (22.1) | 21 (14.4) | 31 (19.4) |
| Ocular lesion | 38 (23.8) | 53 (24.9) | 7 (4.8) | 5 (3.1) |
| Dermatitis | 5 (3.1) | 4 (1.9) | 34 (23.3) | 43 (26.9) |
| Megaesophagus | 15 (9.4) | 24 (11.3) | ||
| Urinary syndrome/nephropathy | 18 (11.3) | 21 (9.9) | 9 (6.2) | 4 (2.5) |
| Neurologic diseases | 5 (3.1) | 7 (3.3) | 4 (2.7) | 3 (1.9) |
| Others | 9 (5.6) | 8 (3.8) | 10 (6.8) | 8 (5.0) |
| Unknown reason | 11 (6.9) | 10 (4.7) | 13 (8.9) | 10 (6.3) |
-
Note:
Nonspecific systemic disease: age-related or -induced lesions including cardiac and respiratory failure; sepsis and DIC; female reproductive diseases or male urogenital diseases, etc.
-
Ocular lesion: includes corneal ulceration and chronic keratitis
Neurologic diseases: include head tilt, paresis, paralysis and ataxia
-
Others: include rectal prolapse, gastrointestinal bleedings
Additional files
-
Transparent reporting form
- https://doi.org/10.7554/eLife.34701.016
Download links
A two-part list of links to download the article, or parts of the article, in various formats.
Downloads (link to download the article as PDF)
Open citations (links to open the citations from this article in various online reference manager services)
Cite this article (links to download the citations from this article in formats compatible with various reference manager tools)
A polymorphism in the tumor suppressor p53 affects aging and longevity in mouse models
eLife 7:e34701.
https://doi.org/10.7554/eLife.34701


