Synthetic hormone-responsive transcription factors can monitor and re-program plant development
- University of Washington, United States
Figures
Figure 1 with 1 supplement
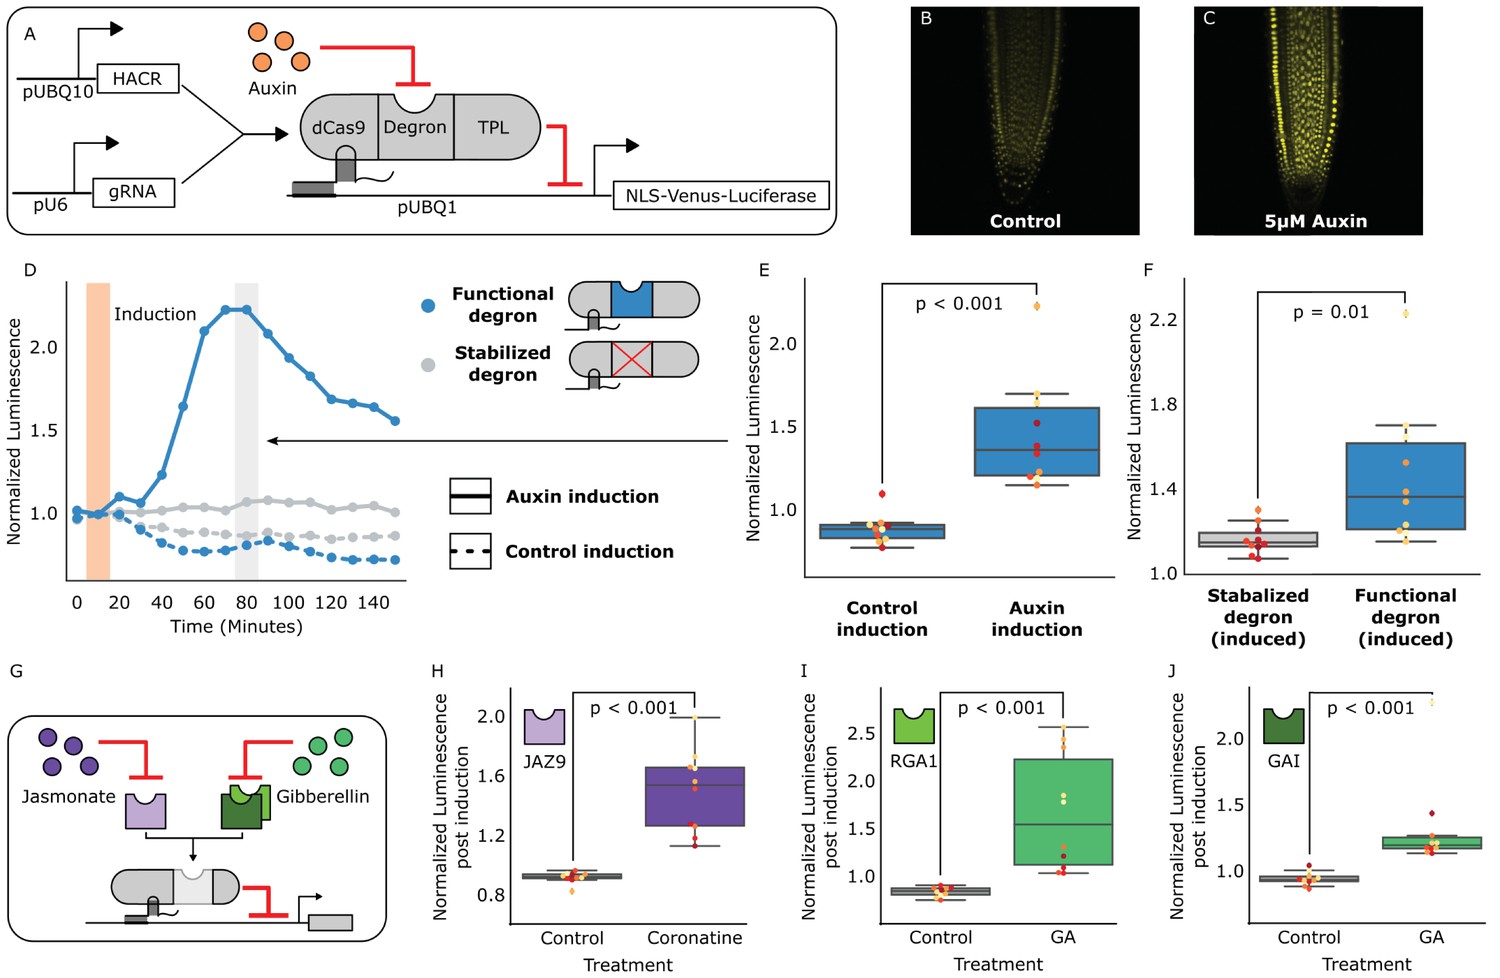
HACRs modulate gene expression upon exogenous hormone treatment.
(A) A general schematic of the constructs transformed into Arabidopsis thaliana to test HACR hormone response. (B,C) Confocal microscopy images of root tips from plant lines with an auxin HACR regulating a Venus reporter 24 hr after treatment with (B) control or (C) 5 µM auxin. (D) An example of a luciferase based time course assay testing whole seedlings of an auxin HACR line treated with auxin (solid blue line) and a control (dashed blue line). The timepoint of auxin induction is highlighted with an orange bar. The time point of maximum auxin response is highlighted by the grey bar. (E) The difference between auxin and control induction at the time of maximum auxin response for the tested seedlings (n = 10) is summarized in the box plot. Every seedling is represented as a different colored dot. (F) A HACR variant line with a stabilized auxin degron was also assayed (D, solid and dashed grey lines) and the response to auxin of these seedlings compared to seedlings of the line with a functional auxin degron at the time of maximum auxin response are summarized in box plot in F. (G) A schematic of how the hormone specificity of HACRs were altered by swapping the hormone degron. (H,I,J) These box plots summarize the response of transgenic seedlings carrying these constructs (n = 10) to treatment with either control or the appropriate hormone. The degron used in the HACR is specified in the top left corner of the plot. Every seedling is represented as a different colored dot. All p-values reported were calculated using a one-way ANOVA.
-
Figure 1—source data 1
Data for auxin HACR box plots in Figure 1.
- https://doi.org/10.7554/eLife.34702.005
-
Figure 1—source data 2
Data for auxin HACR time courses in Figure 1.
- https://doi.org/10.7554/eLife.34702.006
-
Figure 1—source data 3
GA HACR (PHD3) data for Figure 1 and Figure 1—figure supplement 1.
- https://doi.org/10.7554/eLife.34702.007
-
Figure 1—source data 4
GA HACR (PHD6) data for Figure 1 and Figure 1—figure supplement 1.
- https://doi.org/10.7554/eLife.34702.008
-
Figure 1—source data 5
JA HACR data for Figure 1 and Figure 1—figure supplement 1.
- https://doi.org/10.7554/eLife.34702.009
Figure 1—figure supplement 1
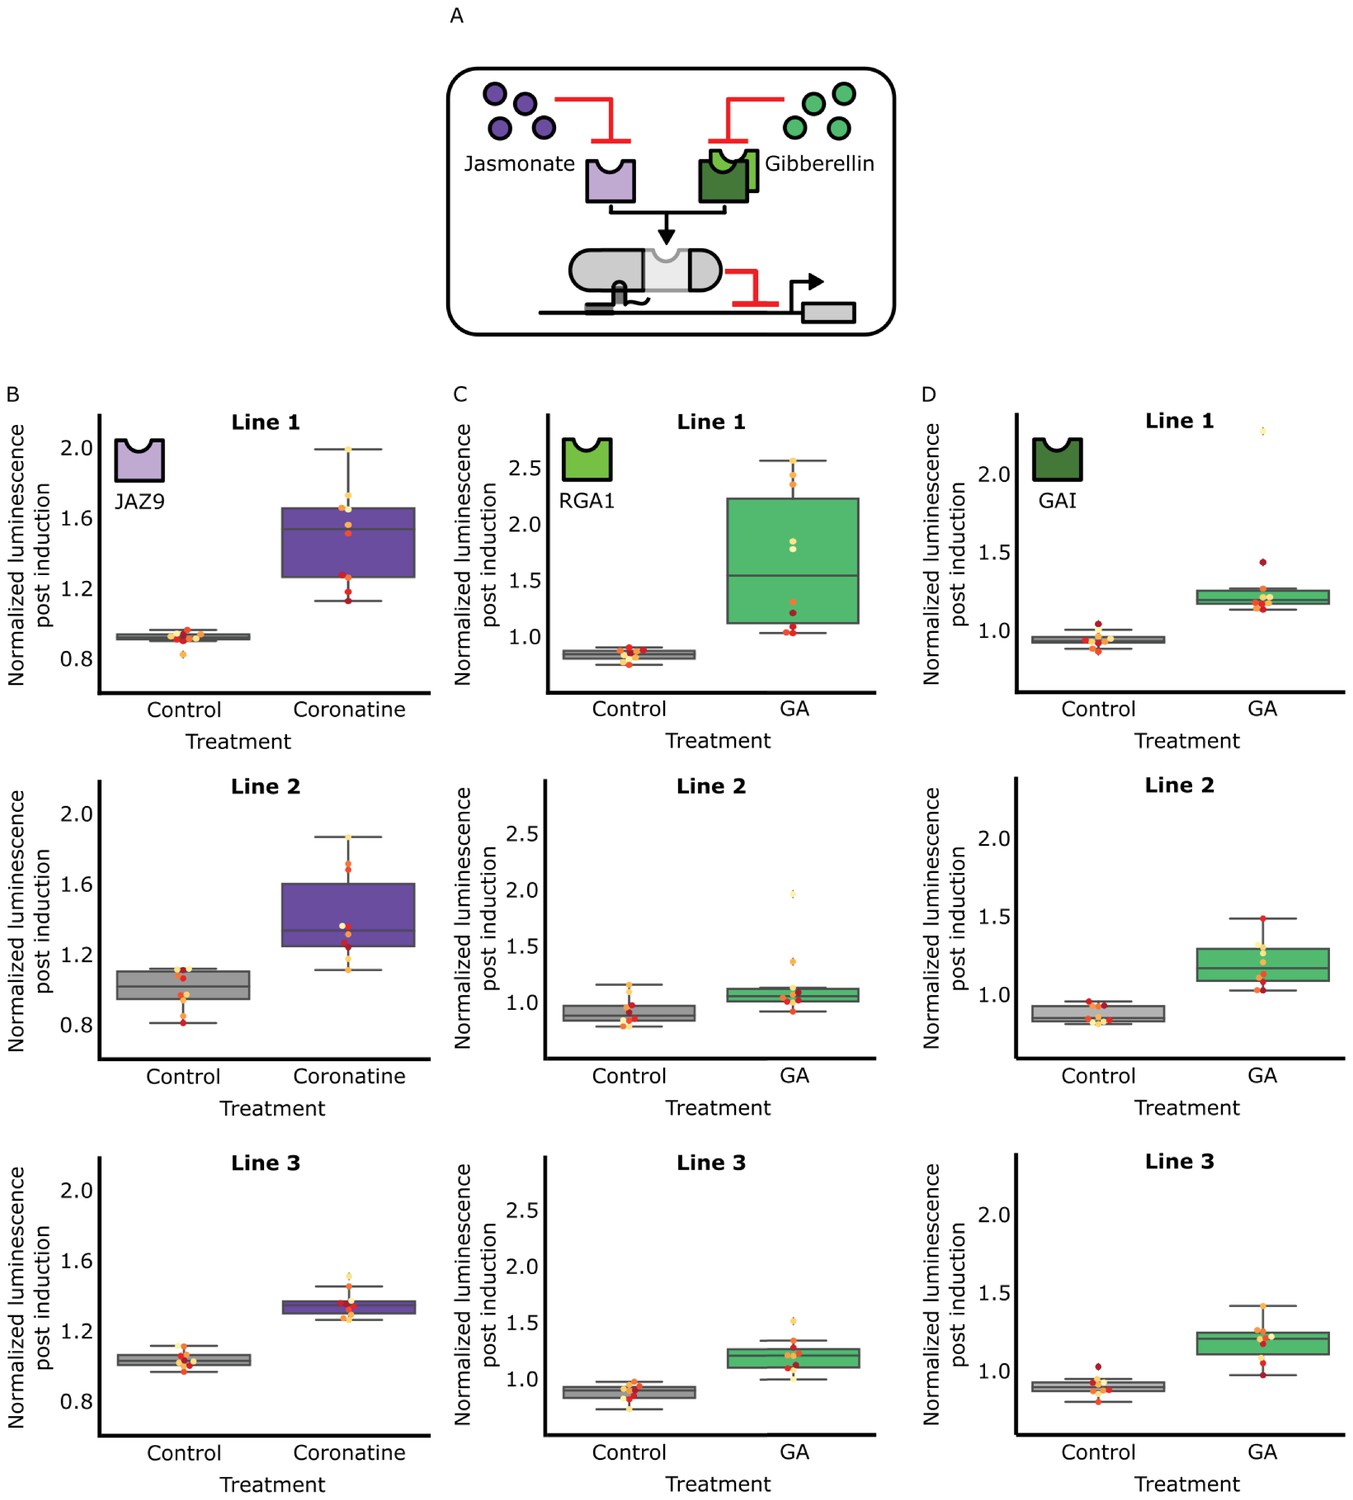
The hormone specificity of HACR response can be predictably altered by including different hormone responsive sequences.
(A) A schematic of how the hormone specificity of HACRs were altered by replacing the hormone degron with the jasmonate responsive degron from JAZ9 (Katsir et al., 2008) or the gibberellin responsive RGA1 or GAI proteins (Murase et al., 2008). (B,C,D) These box plots summarize the response of T2 transgenic seedlings of the indicated genotype (n = 10) to treatment with either control or the appropriate hormone. The degron used in the HACR is specified in the top left corner of every column of plots. Every seedling is represented as a different colored dot. Three different lines representing three different insertion events of the HACR variant are shown in each column.
Figure 2 with 1 supplement
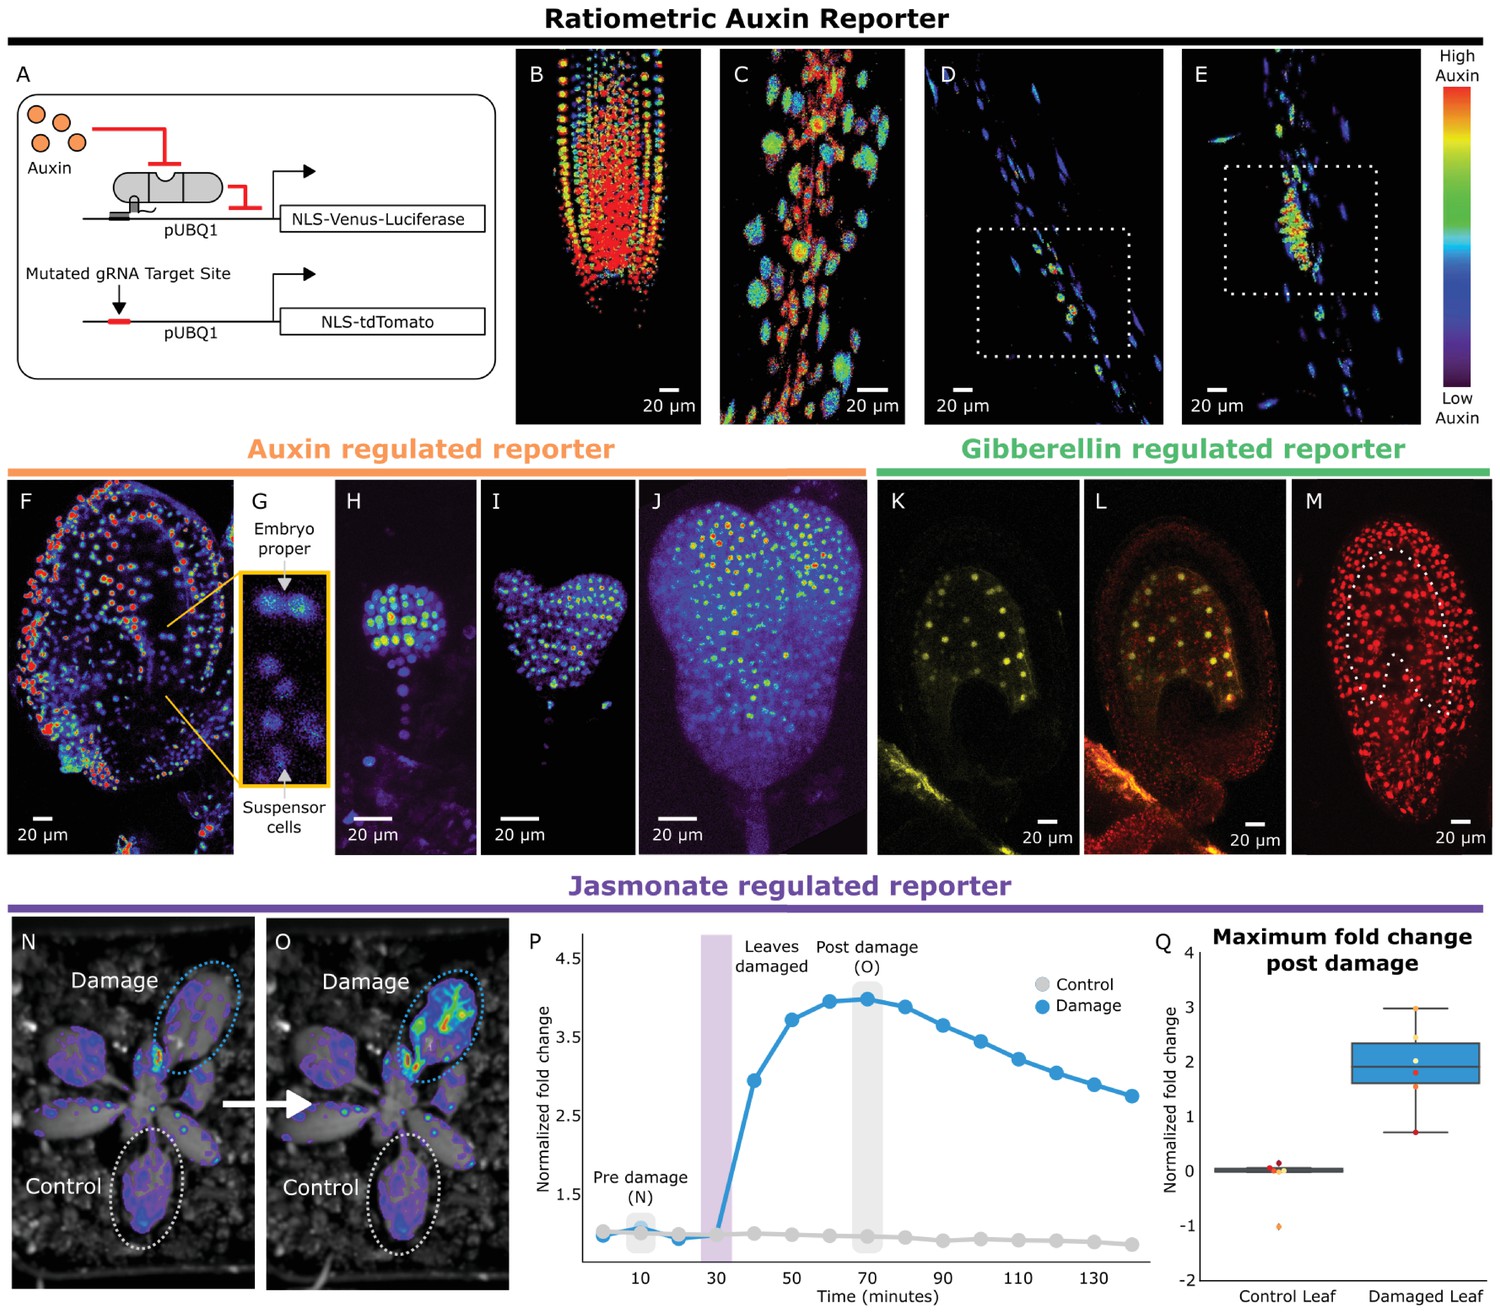
HACRs respond to endogenous hormone signals and can be used to study development.
(A) Schematic of the genetic circuit used to build ratiometric lines of auxin responsive HACRs. In addition to an auxin HACR regulating a nuclear localized Venus-luciferase reporter the lines also have a nuclear localized tdTomato reporter being driven by a version of the UBQ1 promoter with the gRNA target site mutated. (B–E) Confocal microscopy images of roots of seedlings from lines described in A. Reporter signal in images is the background subtracted Venus signal normalized by the background subtracted tdTomato signal. Warmer colors correspond to higher normalized reporter signal. (B) The stereotypical reverse fountain pattern of auxin distribution is observed in the root tip. (C) Higher reporter signal is observed in the vasculature compared to the epidermis of the elongation zone of the root, consistent with auxin being trafficked along the vasculature. The dashed white boxes highlight high reporter signal in (D) the founder cells of lateral roots and in (E) a developing lateral root primordium. (F–J) Confocal microscopy images visualizing reporter signal of a non-ratiometric auxin HACR regulated reporter (F) in the ovule 48 hr post pollination, (G) in the two-cells embryo, (H) in the globular embryo, (I) in the heart stage embryo and (J) in the early torpedo stage embryo. Warmer colors correspond to higher reporter signal. (K–M) Confocal microscopy images visualizing reporter signal of a GA HACR regulated reporter (K) in the ovule 48 hr post pollination, (L) reporter signal merged with red auto-fluorescence to highlight the endosperm region and (M) an unregulated tdTomato reporter, with the endosperm highlighted with a dashed white line, for comparison. (N–Q) Visualization of JA HACR regulated reporter expression in leaves in response to mechanical damage using a luciferase-based assay. Images of leaves overlaid with the luciferase signal before (N) and after damage (O) are shown to the left of a representative plot of the normalized reporter signal over time (P). (Q) Box plot summarizing the maximum fold change at 70 min for control and damaged leaves. Points of the same color represent leaves from the same plant.
-
Figure 2—source data 1
Time course Damage assay data Figure 2.
- https://doi.org/10.7554/eLife.34702.012
-
Figure 2—source data 2
Boxplot Damage assay data Figure 2.
- https://doi.org/10.7554/eLife.34702.013
Figure 2—figure supplement 1
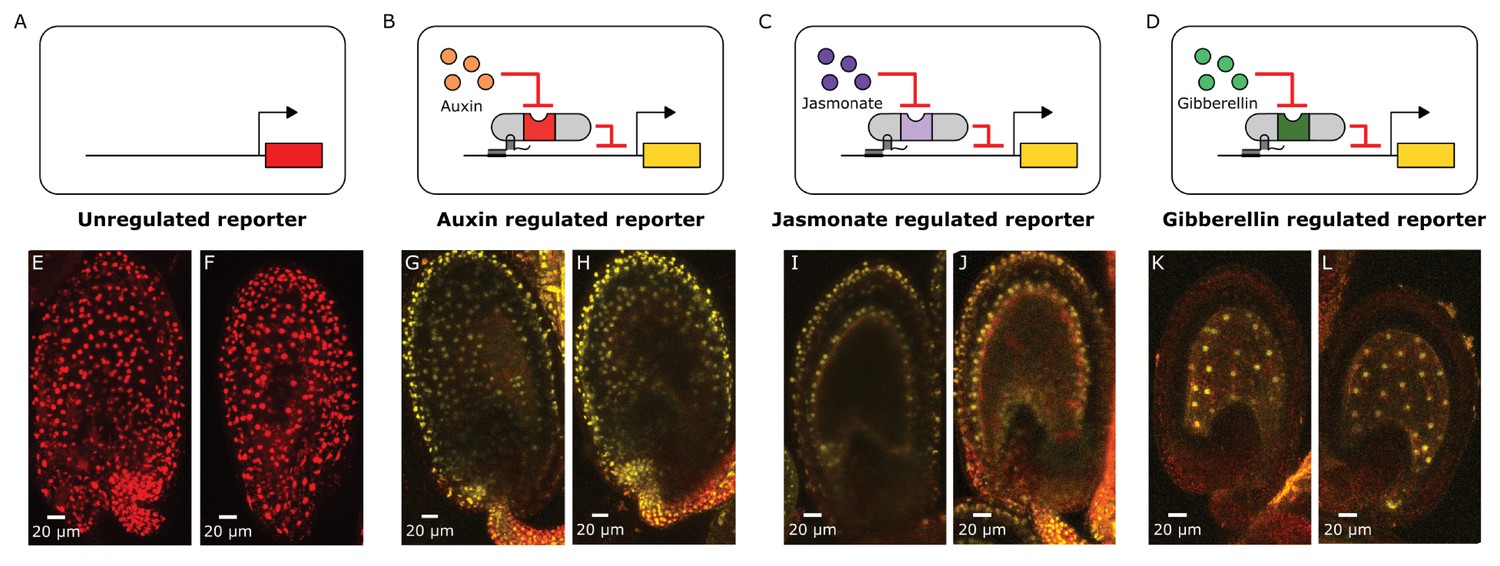
Distributions of auxin, gibberellin and jasmonate during early embryo development can be mapped out using HACRs.
(A–D) These schematics depict the HACR circuits in the plant lines whose ovules have been imaged using confocal microscopy directly below them. (E–L) Confocal microscopy images of ovules from these reporter lines 48 hr post pollination visualizing either the tdTomato (in the case of the unregulated reporter) reporter signal or the Venus (in the case of the HACR lines) reporter signal. We observe ubiquitous reporter signal in the unregulated reporter (E,F) confirming that the UBQ1 promoter does not have differential expression across the ovule that could confound the observations from the HACR reporters. The auxin HACR reporter signal is present in the developing embryo, as reported previously. The JA HACR reporter signal is potentially localized to specific cell files (inner- and outer-layers) in the integument of the ovule (I,J). The GA HACR reporter signal is specifically localized to the endosperm, as we would expect based on the expression of GA biosynthesis genes (K,L).
Figure 3 with 5 supplements
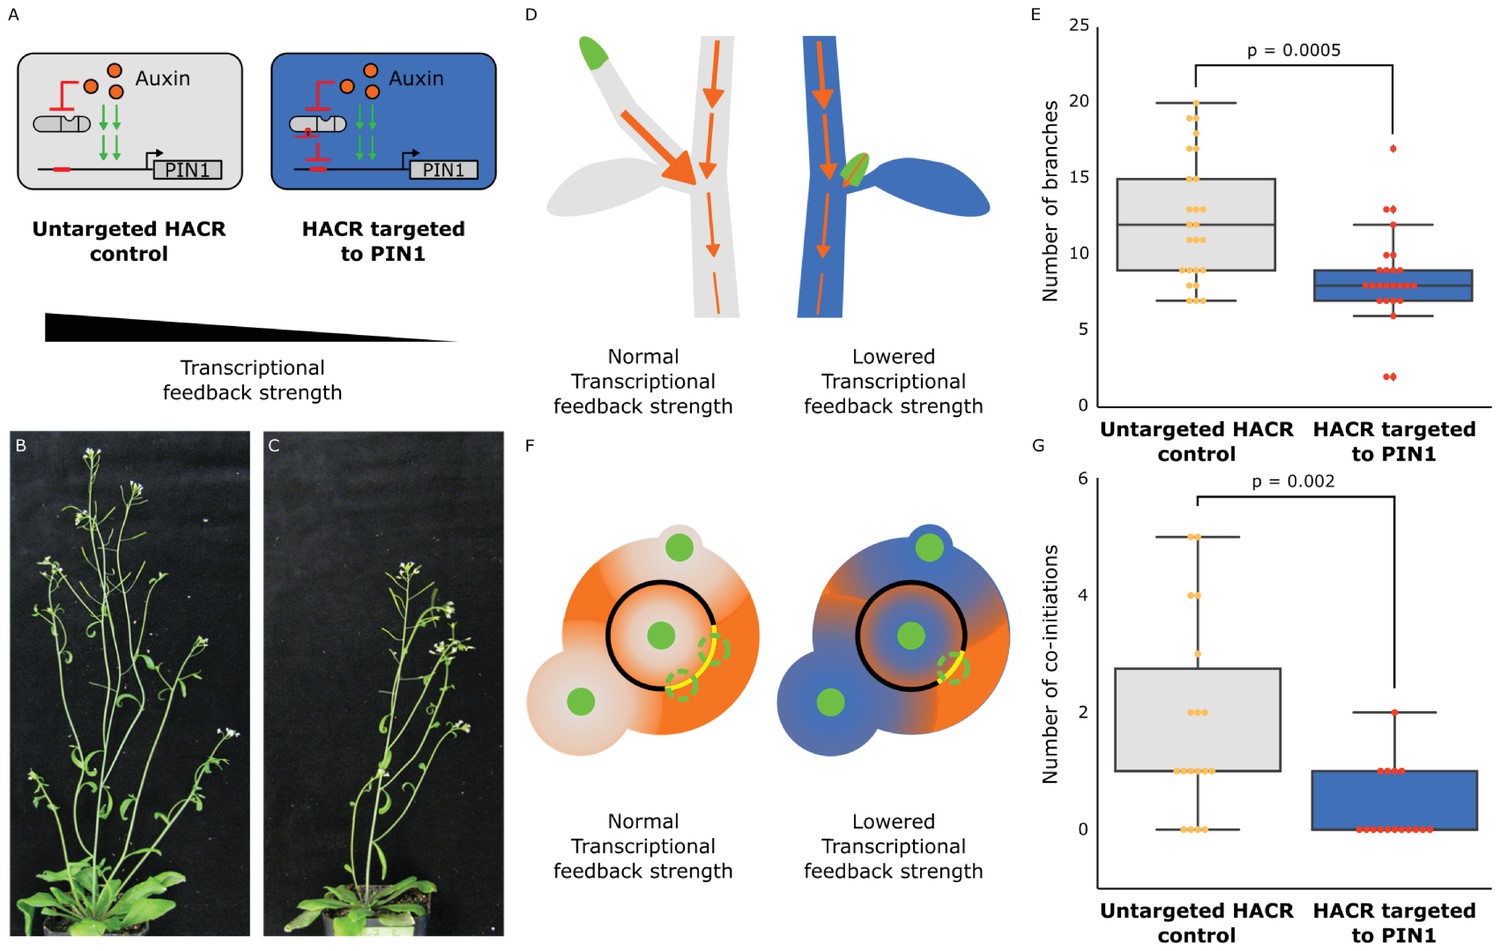
The developmental circuit regulating branching can be rewired using auxin HACRs.
(A) Schematics of auxin driven PIN1 expression, which is one of the drivers of transcriptional feedback. In the box on the right we show how we decreased PIN1 transcriptional feedback strength by targeting an auxin HACR to regulate PIN1. (B,C) Representative pictures of T3 plants of the same age without (B) and with (C) a gRNA targeting an auxin HACR to regulate PIN1. (D) Schematic of the mechanism behind the predicted decrease in branching from decreasing transcriptional feedback strength. In plants without a HACR targeted to PIN1 (grey), the stronger transcriptional feedback allows the lateral bud (green) to drain auxin (orange arrows) into the central vasculature. In plants with a HACR targeted to PIN1 leading to reduced transcriptional feedback (blue), the bud is not able to drain its auxin, preventing branch formation. (E) Box plots summarizing the number of branches of adult T3 plant lines (n = 25) with a HACR targeted to regulate PIN1 expression (blue boxes), compared to control lines that did not have a gRNA targeting PIN1 (grey boxes). Every dot represents an individual plant. (F) Schematic depicting the role of transcriptional feedback in the pattern of formation of new primordia (green circles) around the shoot apical meristem. We hypothesize that in the shoot apex of lines without a HACR targeting PIN1 (grey) the stronger transcriptional feedback leads to smaller zones of auxin depletion around primordia compared to lines that have a HACR targeting PIN1 (blue). This leads to a broader zone where auxin can accumulate (orange) and create new primordia (dashed green circles) which increases chances of phyllotactic defects. (G) Box plots summarizing the number of co-initiations in T3 plant lines (n = 25) with a HACR targeted to regulate PIN1 expression (blue boxes), compared to parental control lines that did not have a gRNA targeting PIN1 (grey boxes). Every dot represents an individual plant. All p-values reported were calculated using a one-way ANOVA.
-
Figure 3—source data 1
Branching data for Figure 3.
- https://doi.org/10.7554/eLife.34702.020
-
Figure 3—source data 2
Co-initiations data for Figure 3.
- https://doi.org/10.7554/eLife.34702.021
-
Figure 3—source data 3
qPCR data Figure 3—figure supplement 1.
- https://doi.org/10.7554/eLife.34702.022
-
Figure 3—source data 4
Auxin HACR Background 1 T2 branching data Figure 3—figure supplement 2.
- https://doi.org/10.7554/eLife.34702.023
-
Figure 3—source data 5
Auxin HACR Background 2 T2 branching data Figure 3—figure supplement 2.
- https://doi.org/10.7554/eLife.34702.024
-
Figure 3—source data 6
Co-initiation data for Figure 3—figure supplement 4.
- https://doi.org/10.7554/eLife.34702.025
-
Figure 3—source data 7
Data for auxin HACR background 2 Figure 3—figure supplement 5.
- https://doi.org/10.7554/eLife.34702.026
-
Figure 3—source data 8
Data for auxin HACR background 3 Figure 3—figure supplement 5.
- https://doi.org/10.7554/eLife.34702.027
Figure 3—figure supplement 1
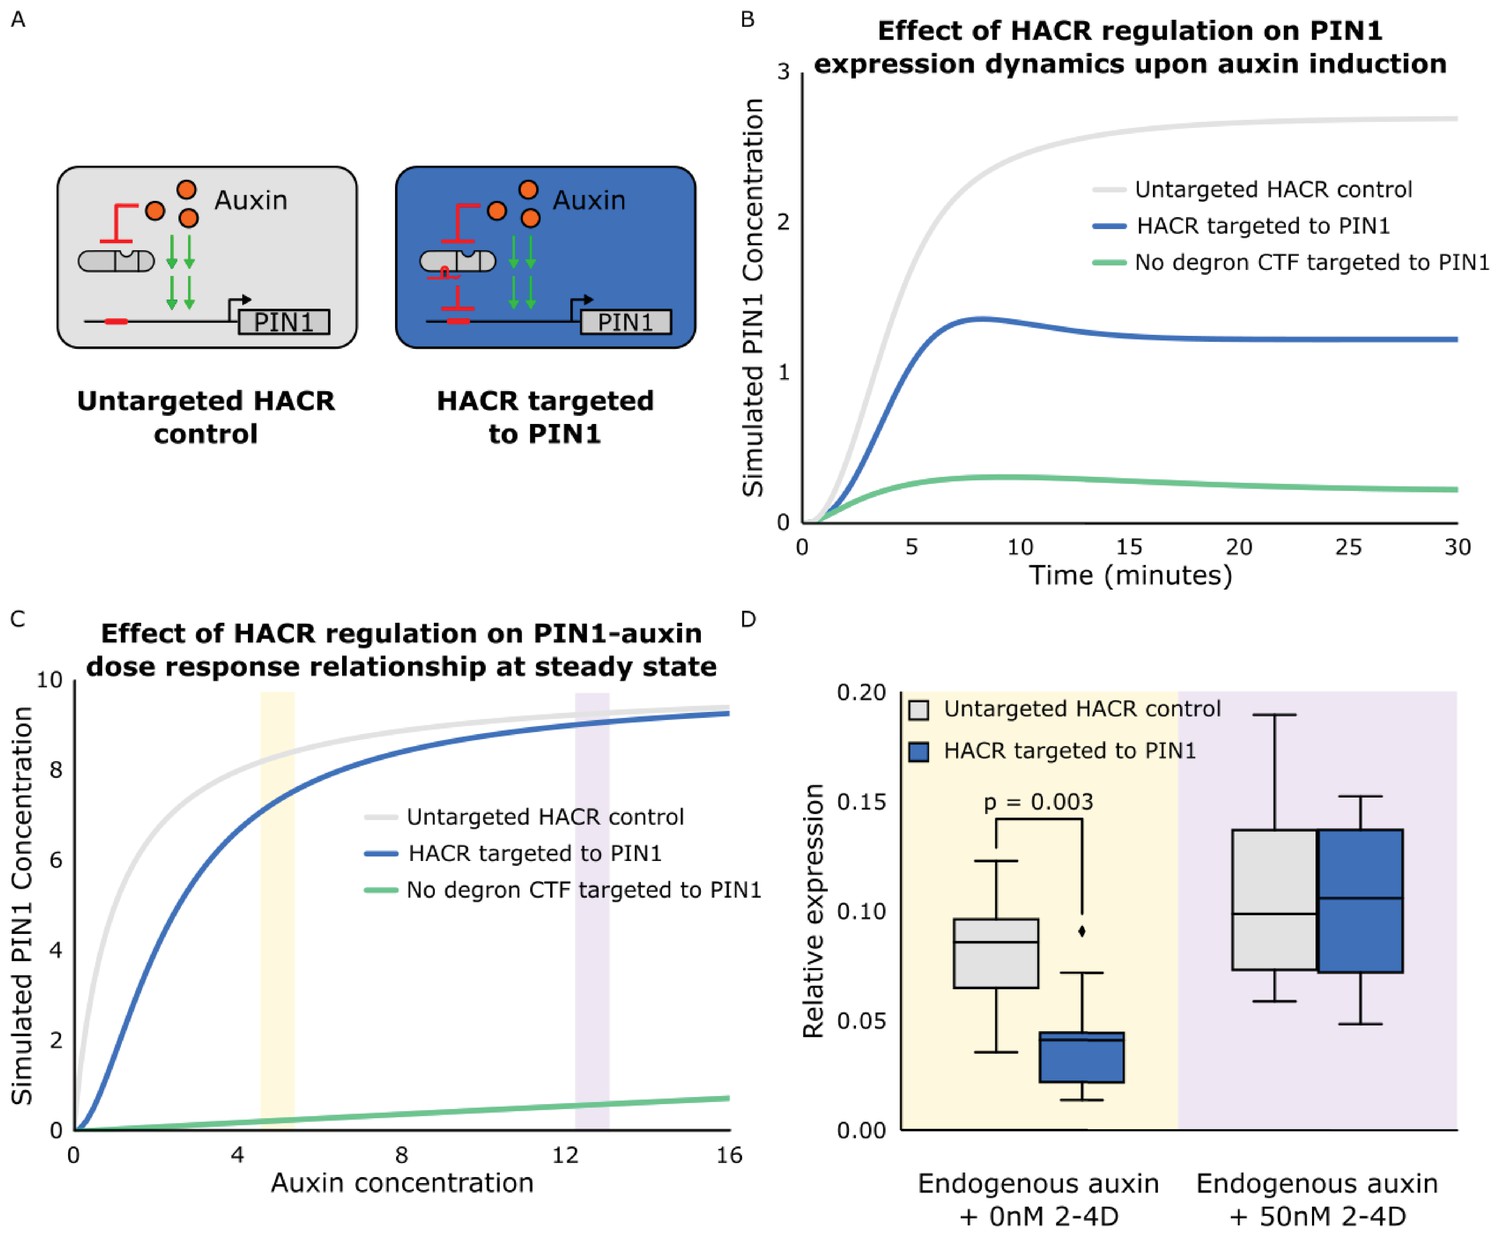
The effect of targeting a HACR to regulate PIN1 can be predicted using ordinary differential equations and qualitatively validated using qPCR.
(A) Schematics of auxin driven PIN1 expression with and without a HACR targeted to regulate PIN1 expression. (B) Simulations of the expression of PIN1 in response to auxin induction at time 0. The grey line depicts the auxin activation of PIN1 in a cell with an untargeted HACR, while the blue line depicts the damped activation when a HACR is regulating PIN1. The green line depicts PIN1 activation with a repressor that has no auxin degron targeting PIN1. It demonstrates how not having an auxin degron present leads to qualitatively different activation dynamics as compared to a HACR. (C) A plot depicting the dose response relationship between auxin and PIN1. As in panel B the grey line depicts the wild type, the blue line depicts the case where a HACR is regulating PIN1 and the green line depicts the case where a repressor without a degron is regulating PIN1. The model predicts a damped dose response relationship when a HACR is regulating PIN1, with larger damping at lower auxin concentrations and little to no damping at higher auxin concentrations. (D) Plot depicting the relative expression levels of PIN1 measured by qPCR, normalized to the constitutively expressed gene PP2A, for seedlings of lines that either had a gRNA targeting a HACR to PIN1 (Blue box plots) or did not (Grey box plots), with either mock or 50 nM 2-4D (synthetic auxin) treatment for three hours. The yellow and purple bars in C correspond to approximately where in the dose response relationship we hypothesize these treatment conditions to be. We observe that the seedlings with a HACR targeted to PIN1 have significantly lower PIN1 expression compared to the untargeted control (p=0.003, n = 9). We observe no significant difference between the two genotypes under 50 nM 2-4D induction (n = 4).
Figure 3—figure supplement 2
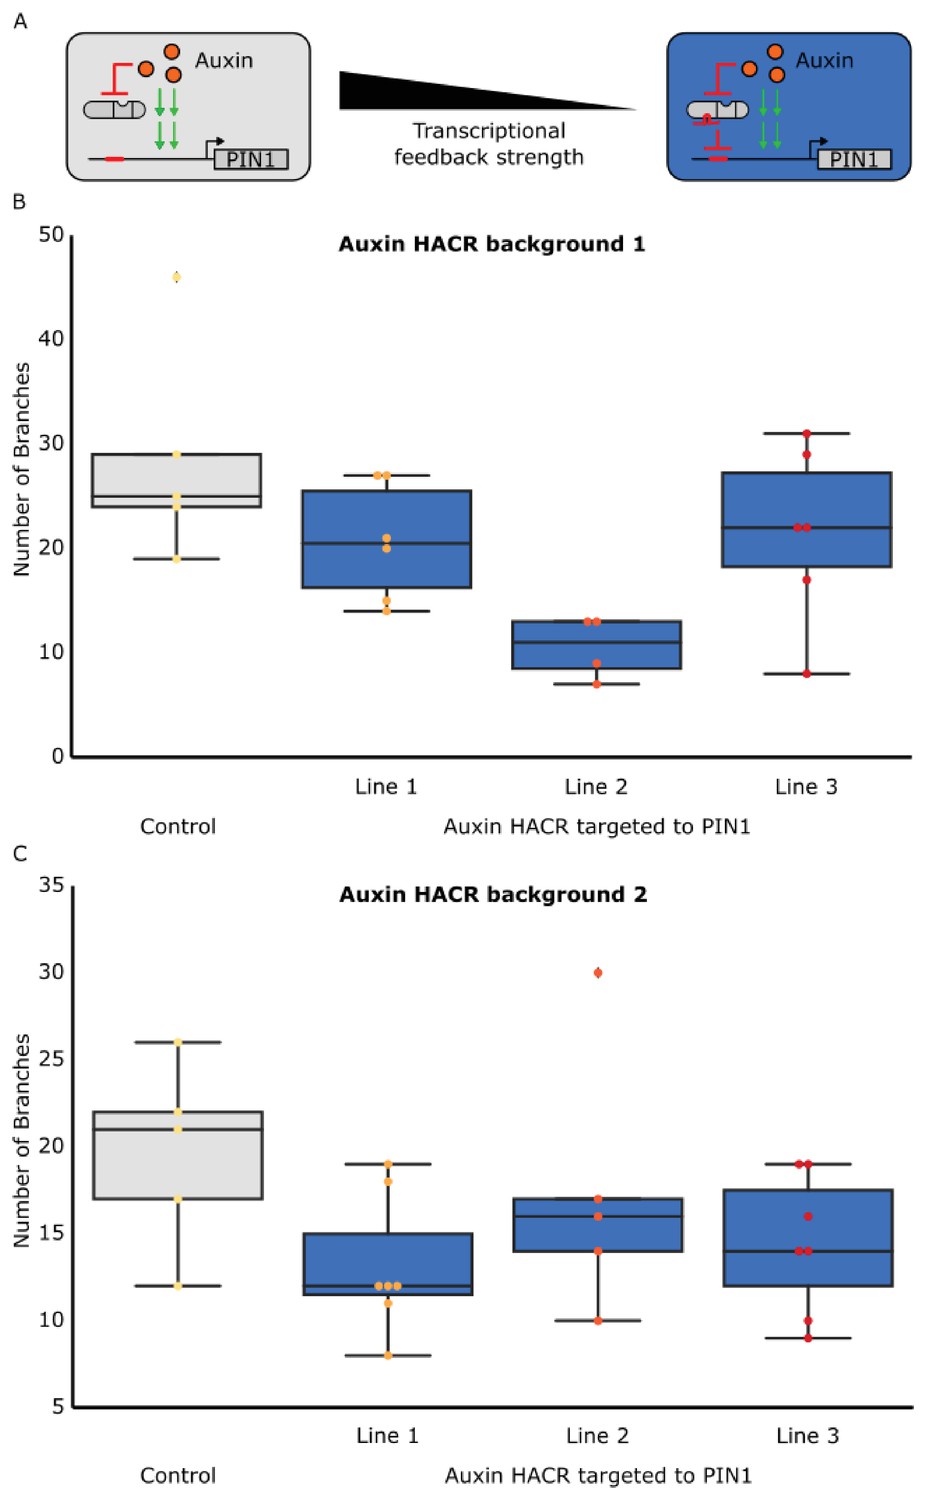
The developmental circuit regulating branching can be predictably rewired using auxin HACRs.
(A) A schematic that illustrates how transcriptional feedback strength was decreased by targeting an auxin responsive HACR to regulate PIN1. (B,C) Box plots characterizing the number of branches of adult T2 plant lines with the HACR targeted to regulate PIN1 expression (blue boxes), compared to a parental control line that did not have a gRNA targeting PIN1 (grey boxes). HACR backgrounds (B and C) indicate lines generated from independent insertion events of the same HACR constructs and every dot represents an individual T2 transgenic plant. Each auxin HACR targeted to PIN1 line is a different PIN1 targeting gRNA insertion event into the same HACR background (Control). All data was collected from plants that were grown in parallel.
Figure 3—figure supplement 3

A HACR variant with a stabilized auxin degron does not produce a reduced branching phenotype when targeted to PIN1.
The box plots summarize the number of branches on plant lines with the genetic circuit shown in the corresponding schematic above them. The light grey box plot depicts data for a line with a HACR that has a stabilized auxin degron (Moss et al., 2015) but no gRNA targeting PIN1, where each dot is an individual T2 transgenic plant. The dark grey box plot depicts data for first-generation transgenic plants where each dot represents a different insertion of the PIN1 gRNA into the previously described HACR background. All data was collected from adult plants that were grown in parallel. We observe no change in the median number of branches when the HCAR with the stabilized degron is targeted to PIN1. This is consistent with the hypothesis that it is a change in the auxin-activated expression of PIN1 (canalization) that is causing the branching phenotype and not simply the repression of PIN1.
Figure 3—figure supplement 4
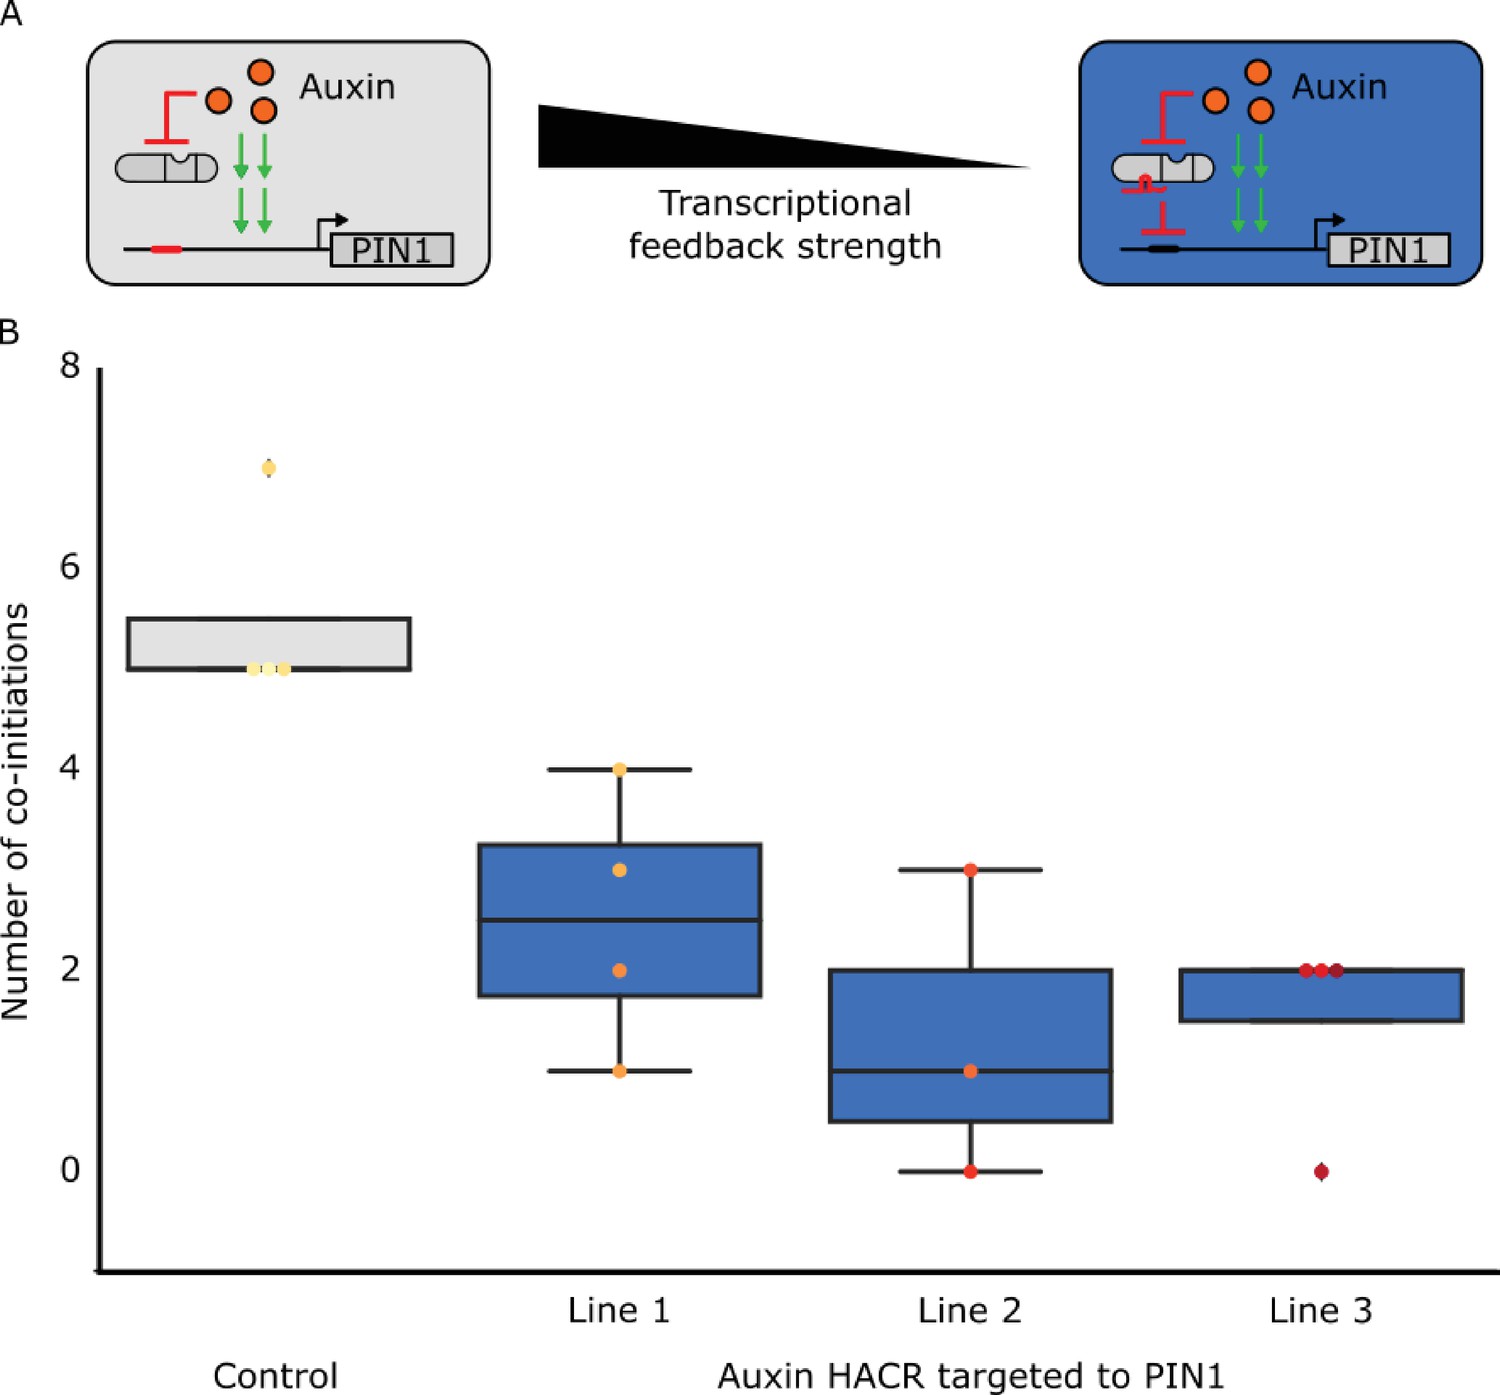
The developmental circuit regulating phyllotaxy can be predictably rewired using HACRs.
(A) A schematic that illustrates how we decreased transcriptional feedback strength by targeting an auxin responsive HACR to regulate PIN1. (B) Box plots summarizing the number of co-initiations of lateral organs. Data was collected from adult T2 transgenic plants carrying a HACR targeted to regulate PIN1 expression (blue boxes), compared to parental control lines that lacked the PIN1 gRNA (grey boxes). All data was collected from plants that were grown in parallel. The number of co-initiations is an established metric of phyllotactic noise and we expect decreasing transcriptional feedback strength would decrease the noise. Every dot represents an individual plant and each line is a different PIN1-targeting gRNA insertion event into the parental control background.
Figure 3—figure supplement 5
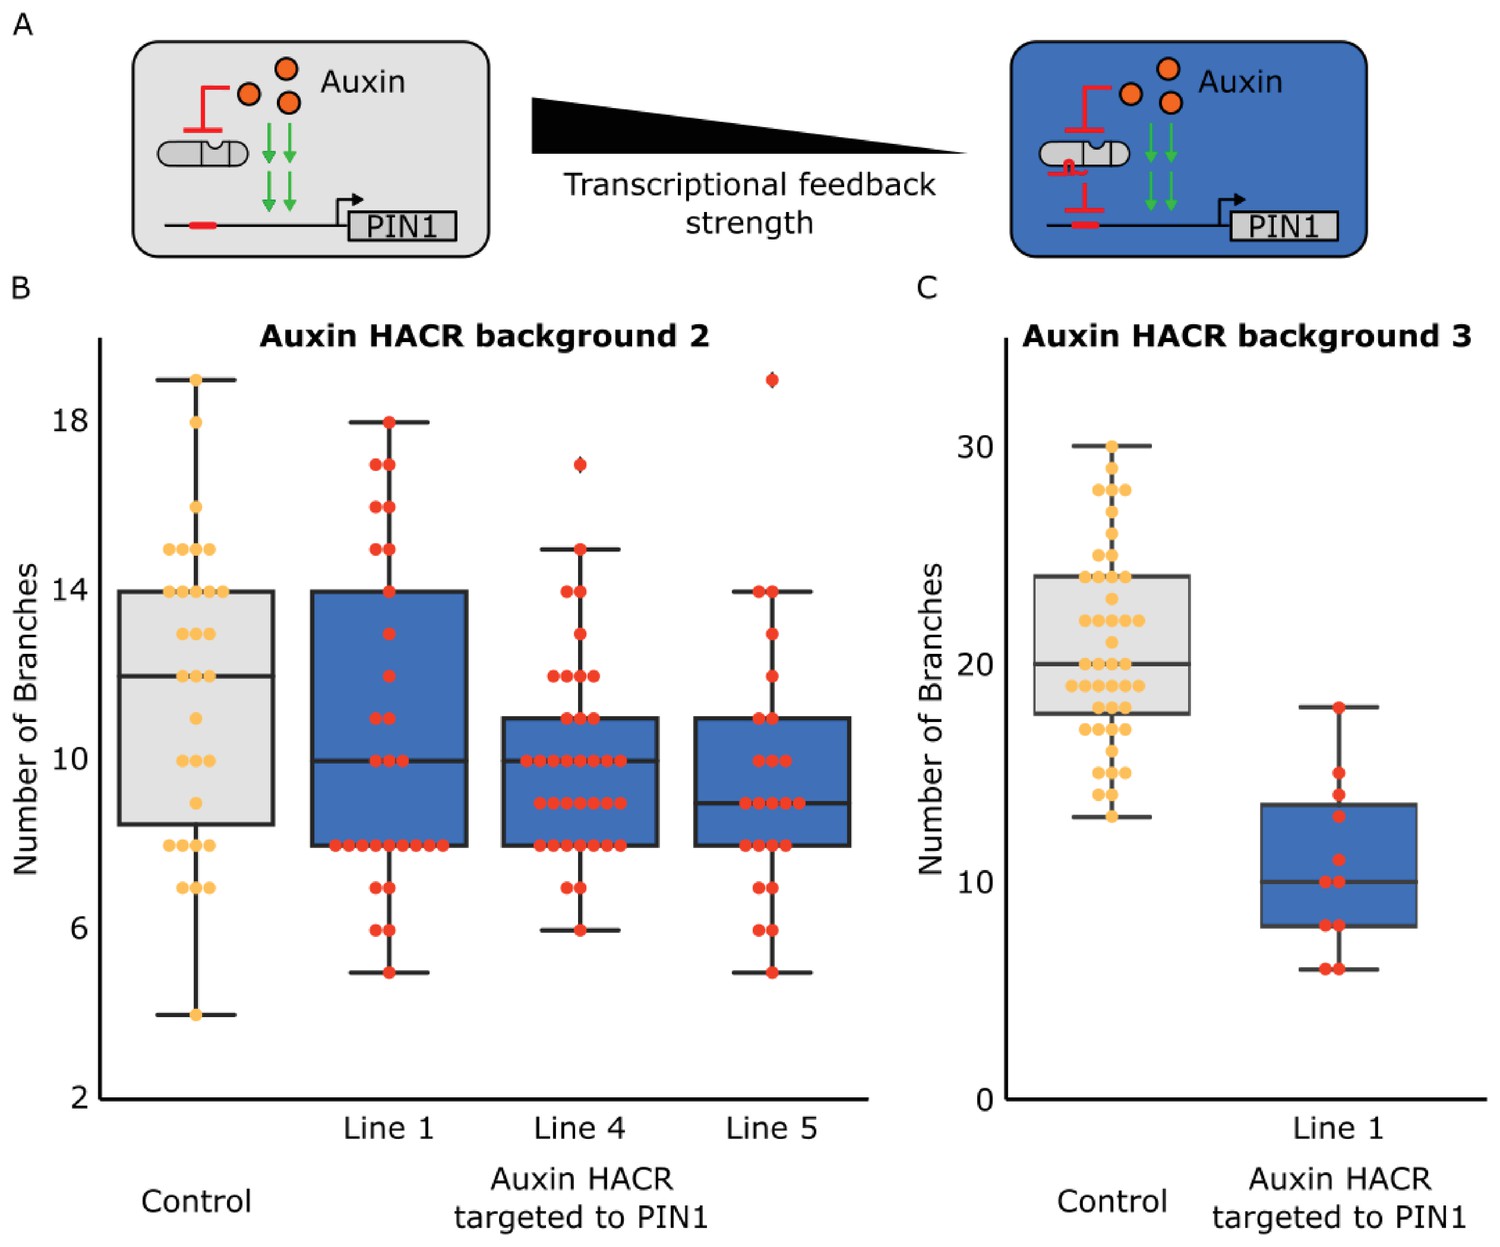
The shoot architecture phenotypes generated by targeting a HACR to regulate PIN1 are not due to antibiotic selection and can be observed in multiple different lines and Auxin HACR backgrounds.
(A) Schematic of how we reduced the transcriptional feedback strength by using a HACR to regulate PIN1. (B) Box plot summarizing data collected from T3 plants of lines that have either just a HACR (grey box plot) or T3 plants of that same HACR background transformed with a gRNA targeting PIN1. These plants were not selected using antibiotic, but rather genotyped for the presence of the HACR and the gRNA by PCR after they were phenotyped. All data reported here is from plants that passed genotyping. We observe the same trends as before with a lower number of branches in lines with the PIN1 gRNA as compared to the control. There was a significant decrease for lines 4 and 5 (p<0.05). (C) Box plots summarizing the number of branches observed on T2 plants from lines in a third auxin HACR background. These plants were also selected with genotyping post phenotyping rather than with antibiotics. We observe a significant decrease in the number of branches in the line that has the gRNA (blue box plot), as compared to the control (grey box plot) (p<0.05).
Additional files
-
Transparent reporting form
- https://doi.org/10.7554/eLife.34702.029
Download links
A two-part list of links to download the article, or parts of the article, in various formats.
Downloads (link to download the article as PDF)
Open citations (links to open the citations from this article in various online reference manager services)
Cite this article (links to download the citations from this article in formats compatible with various reference manager tools)
Synthetic hormone-responsive transcription factors can monitor and re-program plant development
eLife 7:e34702.
https://doi.org/10.7554/eLife.34702


