An NMDAR positive and negative allosteric modulator series share a binding site and are interconverted by methyl groups
- Emory University, United States
Figures
Figure 1
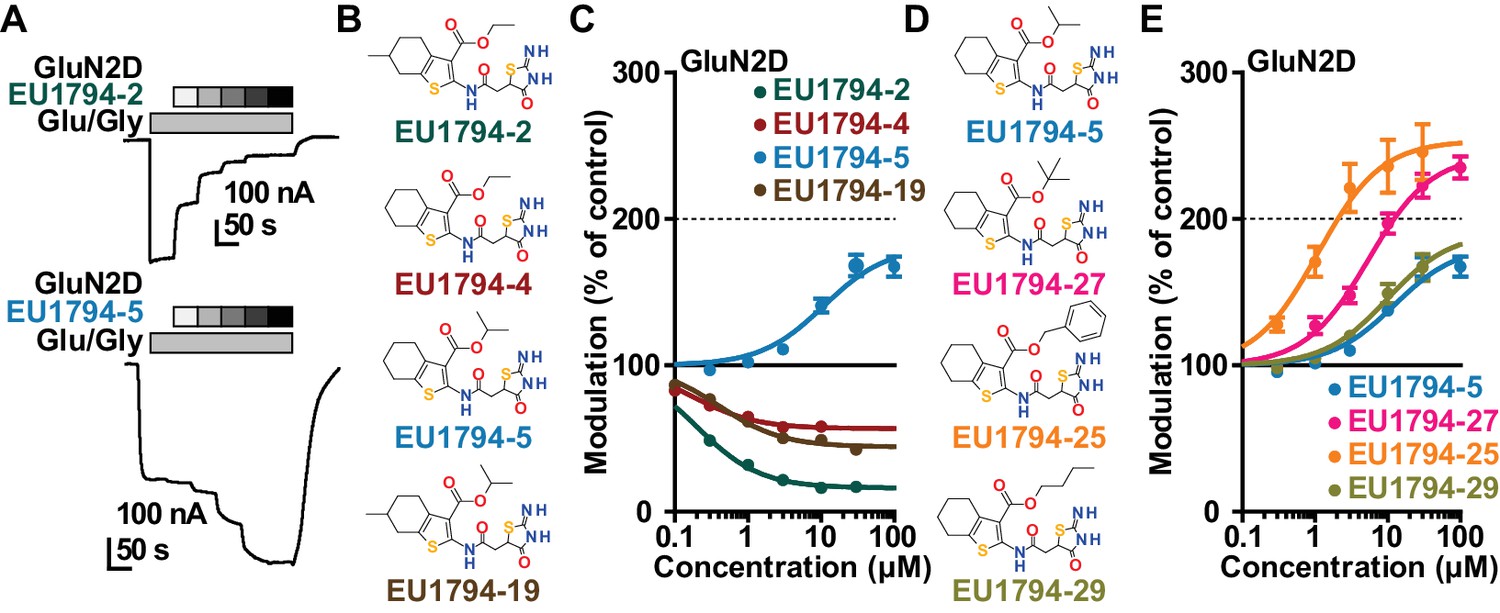
The EU1794 series of NMDAR NAMs can be converted to PAMs with subtle structural modifications.
(A) Representative concentration-response experiments for a negative (EU1794-2, above) and positive (EU1794-5, below) allosteric modulator using two-electrode voltage-clamp recordings of GluN1/GluN2D NMDARs activated by saturating concentrations of agonist. 100/30 µM glutamate/glycine application is represented by the grey bar and increasing concentrations of modulator are shown by grey scale boxes (0.3, 1, 3, 10, 30 µM for EU1794-2 and 1, 3, 10, 30, 100 µM for EU1794-5). (B) Chemical structures of the NAMs EU1794-2, EU1794-4, EU1794-19 and PAM EU1794-5 are given, which show all permutations of two methyl substitutions. This series illustrates how subtle changes in chemical structure interconvert modulator activity. (C) The concentration-response curves for the compounds shown in (B) acting on GluN1/GluN2D NMDARs activated by maximally effective concentrations of co-agonists and fitted by the Hill equation. (D) Chemical structures of EU1794 PAMs. (E) Concentration-response curves for EU1794 PAMs on the responses of GluN1/GluN2D NMDARs to maximally effective concentrations of co-agonists. See Table 1 for fitted EC50 values at all diheteromeric NMDARs. Data represent 4–18 oocytes recorded in at least two independent experiments.
Figure 2 with 1 supplement

Modulation of both EU1794 PAMs and NAMs is dependent on agonist concentration.
(A) The concentration-response relationship for EU1794-27 at diheteromeric NMDARs activated by 100/30 µM glutamate/glycine (data for GluN1/GluN2D shown in Figure 1E is included here for clarity). GluN1/GluN2C and GluN1/GluN2D (which are superimposed) are potentiated to a greater extent than GluN1/GluN2B; there appears to be slight inhibition of GluN1/GluN2A. (B) A representative concentration-response recording of EU1794-27 at GluN1/GluN2B activated by sub-saturating concentrations of agonist. The initial response was activated using saturating 100/30 µM glutamate/glycine (black box) followed by 1/0.3 µM glutamate/glycine (grey box, roughly resulting in an activity state that was 20% of the maximal response) administered in the absence and presence of increasing concentrations of EU1794-27 (0.3, 1, 3, 10, 30 µM). (C) Concentration-response relationship for EU1794-27 at diheteromeric NMDARs activated by sub-saturating concentration of agonist (glutamate/glycine concentrations used for GluN1/GluN2A were 2/0.6 µM, GluN1/GluN2B and GluN1/GluN2C were 1/0.3 µM, and GluN1/GluN2D were 0.6/0.2 µM). Note potentiation of all subunits. (D–F) Similar experiments as in A-C, but using the NAM EU1794-4 at saturating (D) or sub-saturating (E,F) concentrations of agonist (glutamate/glycine concentrations used for GluN1/GluN2A, GluN1/GluN2B and GluN1/GluN2C were 1/0.3 µM, and GluN1/GluN2D were 0.3/0.09 µM); data for GluN1/GluN2D presented in Figure 1C are included here for comparison. Note the inhibition by the NAM at saturating agonist concentration (D) compared to potentiation in submaximal concentrations of agonist in (E,F). Data represent 4–13 oocytes recorded in two independent experiments.
Figure 2—figure supplement 1
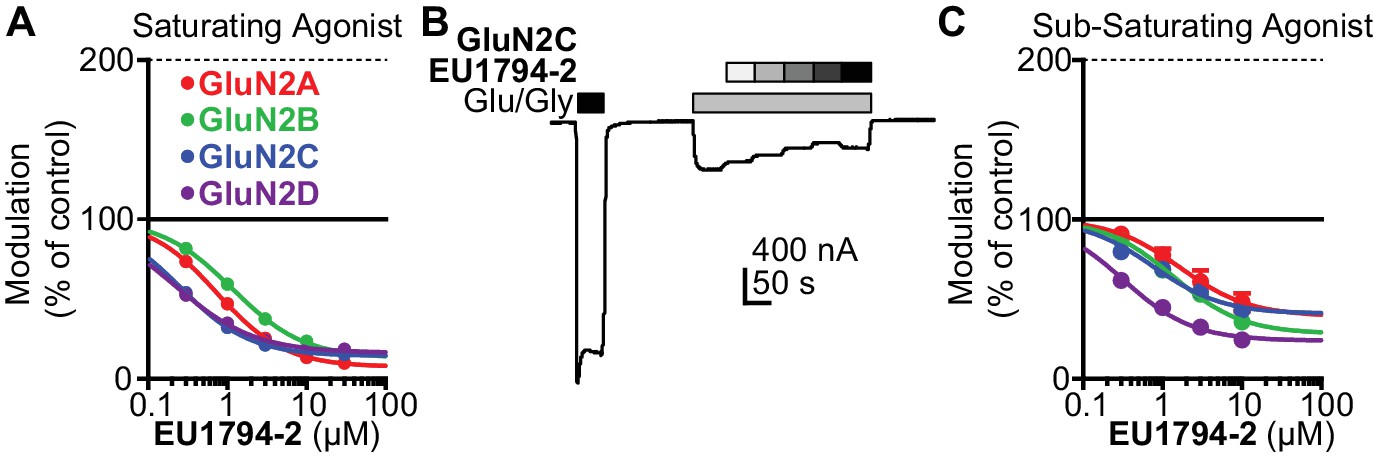
EU1794-2 actions possess modest agonist concentration-dependence.
(A) Concentration-response relationship for EU1794-2 at each diheteromeric NMDAR activated by saturating concentration of agonist (100/30 µM glutamate/glycine; data for GluN1/GluN2D are reproduced from Figure 1C). (B) A representative recording of the response to EU1794-2 at GluN1/GluN2C NMDARs activated by sub-saturating concentrations of agonist. The initial response was activated using saturating concentrations (100/30 µM glutamate/glycine, black box) of agonist followed by sub-saturating concentrations of agonist (0.6/0.2 µM glutamate/glycine, grey box) co-applied with increasing concentrations of EU1794-2 (0, 0.3, 1, 3, 10, 30 µM). (C) Concentration-response relationship for EU1794-2 at each diheteromeric NMDAR activated by sub-saturating concentration of agonist (as noted in B). Saturating data are from 4 to 18 oocytes from at least two independent experiments and sub-saturating data are from six oocytes.
Figure 3 with 1 supplement

EU1794 PAMs and NAMs enhance glutamate and glycine potency.
(A) Representative glutamate (left) and glycine (right) concentration-response curves of oocytes expressing GluN1/GluN2C with and without EU1794-27 (10 µM, grey box). The glutamate concentration-response curve (0.1, 0.3, 1, 3, 10, 30 µM) was generated with 30 µM glycine and the glycine concentration-response curve (0.03, 0.1, 0.3, 1, 3, 10 µM) was recorded in 100 µM glutamate. (B) Mean concentration-response data for glutamate (left) and glycine (right) at GluN1/GluN2C (see Figure 2—figure supplement 1 for other subunits). Each curve was normalized to the maximal response in the absence of EU1794-27 to illustrate the actions of EU1794-27 on agonist EC50. (C,D) A similar set of experiments as in (A,B), but with EU1794-4 are shown (10 µM, grey box). Note the variation of the order of EU1794-4 application in experimental traces, which was selected randomly. The glutamate concentration-response curve (glutamate concentration are 0.03, 0.1, 0.3, 1, 3, and 100 µM and glycine concentrations are 10 and 30 µM) and the glycine concentration-response curve (glycine concentrations are 0.01, 0.03, 0.1, 0.3, 1, 30 µM, and glutamate concentration are 30 and 100 µM). Each curve was normalized to the maximal response from each oocyte in the absence of EU1794-4. Data are from 4 to 12 paired oocytes recordings from at least two independent experiments.
Figure 3—figure supplement 1

The effects of EU1794-27 and EU1794-4 on agonist potency for all diheteromeric NMDARs.
(A) Mean concentration response data for glutamate (top) and glycine (bottom) at each diheteromeric NMDAR with and without 10 µM of the PAM EU1794-27. Each curve was normalized to the maximal response (either in the absence or presence of EU1794-27) to better illustrate the shift in agonist EC50. (B) A similar set of plots as in (A) but with 10 µM of the NAM EU1794-4. Each set of curves was normalized to the maximal response from each cell in the absence of EU1794-4. Data are from 4 to 12 paired oocytes recordings from at least two independent experiments.
Figure 4 with 1 supplement

The association and dissociation time course of EU1794-2, EU1794-4 and EU1794-27 differ at GluN1/GluN2A and GluN1/GluN2D.
(A) Representative whole-cell current recordings of GluN1/GluN2D NMDARs exemplifying the modulation time course of EU1794-2, EU1794-4 and EU1794-27 (1, 3, 10 µM). Responses were evoked by 100/30 µM glutamate/glycine and were normalized for display. Insets show the steady state modulation extent from the HEK cell experiments fit by the Hill equation (Hill slope fixed to 1). (B) Analysis of the time course for the onset of PAM and NAM action as a function of concentrations for EU1794-2 (left), EU1794-4 (left) and EU1794-27 (right) used to determine the association rate kON (black circles) and dissociation rate kOFF (grey squares), from which we can calculate Kd for each modulator. Data are from at least 3 cells for each concentration of modulator. For EU1794-27 the association and dissociation rate linear component was also found to be concentration dependent (mon = −0.98 pA/(ms*µM), moff = 0.62 pA/(ms*µM)). (C,D) Similar set of panels as A,B but examining EU1794-2, EU1794-4 and EU1794-27 modulation of GluN1/GluN2A. In example recordings, all modulator concentrations are 10 µM. Data are from at least 3 cells for each concentration of modulator. For EU1794-27 time-course was fitted with the sum of an exponential and linear function, and both the time constant and slope were concentration dependent (mon = −0.33 pA/(s*µM), moff = 0.16 pA/(s*µM)).
Figure 4—figure supplement 1
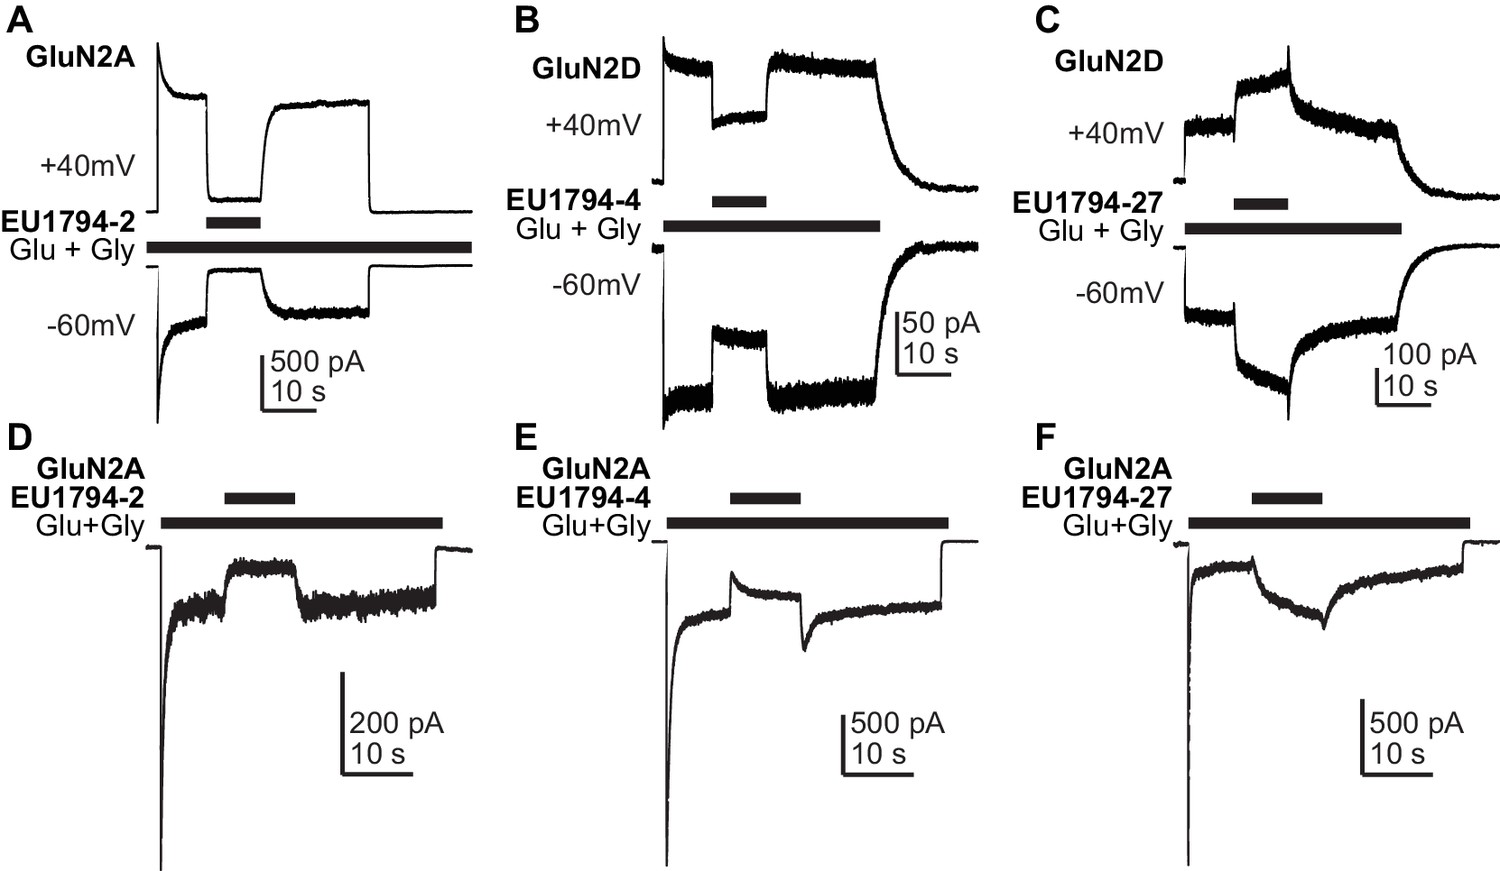
The actions of EU1794 modulators are voltage-independent and are influenced by the desensitization level.
(A–C) A representative current response of EU1794-2 (A, the ratio of the % modulation by EU1794-2 at +40 mV and −60 mV was 1.1 ± 0.27, n = 3), EU1794-4 (B, the ratio of modulation at +40 mV and −60 mV was 0.88 ± 0.06, n = 6) and EU1794-27 (C, the ratio of modulation at +40 mV and −60 mV was 0.99 ± 0.15, n = 3) modulation with the Vm held at +40 mV and −60 mV; all responses shown were using 10 µM of test compound. (D–F) Representative whole-cell current recordings exemplifying the modulation time course of 10 µM EU1794-2 (D), EU1794-4 (E), and EU1794-27 (F) on GluN1/GluN2A NMDAR responses with a high degree of desensitization. Responses were evoked by 100/30 µM glutamate/glycine and were normalized for display. EU1794-2 modulated low desensitized steady state responses to 13% (drug/control) and high desensitized steady state responses to 32% of control (n = 3, 1). EU1794-4 modulated low desensitized steady state responses to 47% and high desensitized steady state responses to 79% of control (n = 2, 1). EU1794-27 modulated low desensitized steady state responses to 107 ± 16% and high desensitized steady state responses to 247 ± 31% of control (n = 2, 4; p=0.028 unpaired t-test).
Figure 5 with 1 supplement
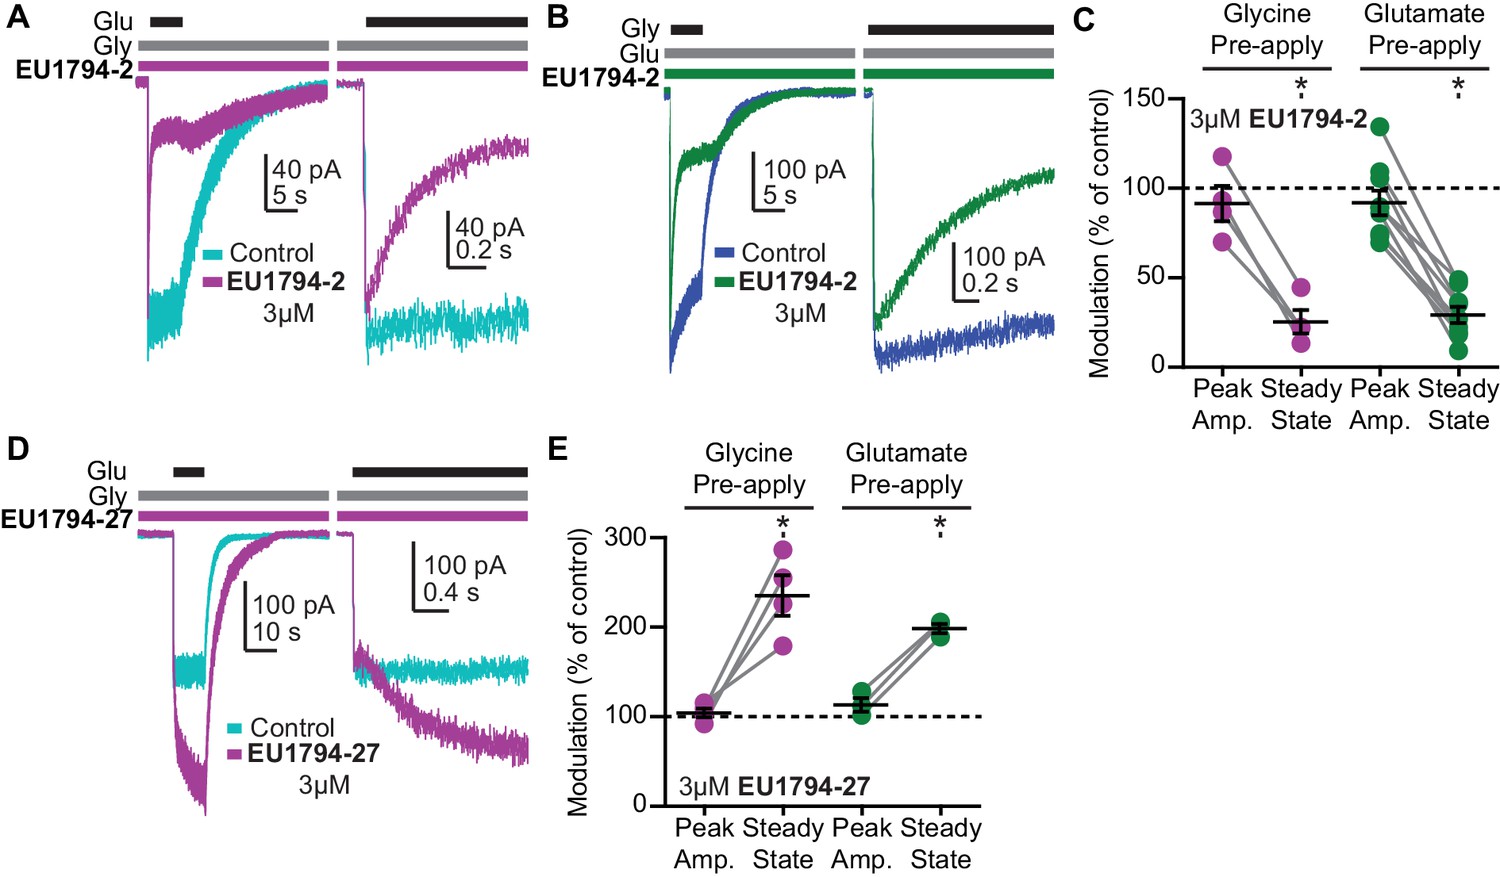
The EU1794 series has agonist-dependence that alters the response time-course.
(A) Representative whole-cell recordings of GluN1/GluN2D NMDARs exemplifying the EU1794-2 dependence on glutamate binding. The cell was exposed continuously to 30 µM glycine with/without 3 µM EU1794-2, and then was rapidly stepped into a solution additionally containing 100 µM glutamate. The right panel shows an expanded view of the rise of the receptor response and the rapid time course of EU1794-2 action. (B) Representative whole-cell current recordings of GluN1/GluN2D NMDARs exemplifying the EU1794-2 dependence on glycine binding. The cell was exposed continuously to 100 µM glutamate with/without 3 µM EU1794-2, and then was rapidly stepped into a solution additionally containing 30 µM glycine. The right panel shows an expanded view of the rise of the receptor response and the rapid time course of EU1794-2 action. (C) Quantification of the modulation of the immediate peak response and steady state data (shown as a percentage EU1794-2/control for each phase) from agonist-dependence experiments for EU1794-2 (3 µM, Figure 5A,B and S4B). * signifies p<0.05 as determined by a Bonferroni's multiple comparison test where only EU1794-2 vs control was compared for both peak and steady state conditions after a significant repeat measures ANOVA (F(3,3) = 7.66 for pre-applied glycine and F(3,7) = 12.4 for pre-applied glutamate). (D) Representative whole-cell current recordings of GluN1/GluN2D NMDARs exemplifying the EU1794-27 dependence on glutamate binding. The cell was exposed continuously to 30 µM glycine with/without 3 µM EU1794-27, and the solution was rapidly changed to one additionally containing 100 µM glutamate. The right panel is an expanded view of the activation kinetics of the responses and the onset of modulation. (E) Quantification of the modulation of the immediate peak and steady state response (shown as a percentage EU1794-27/control for each phase) from agonist-dependence experiments for EU1794-27 (3 µM, Figure 5D and S4A). * signifies p<0.05 from the post hoc Bonferroni's multiple comparison test (F(3,3) = 17.8 for pre-applied glycine and F(3,2) = 13.5 for pre-applied glutamate).
Figure 5—figure supplement 1
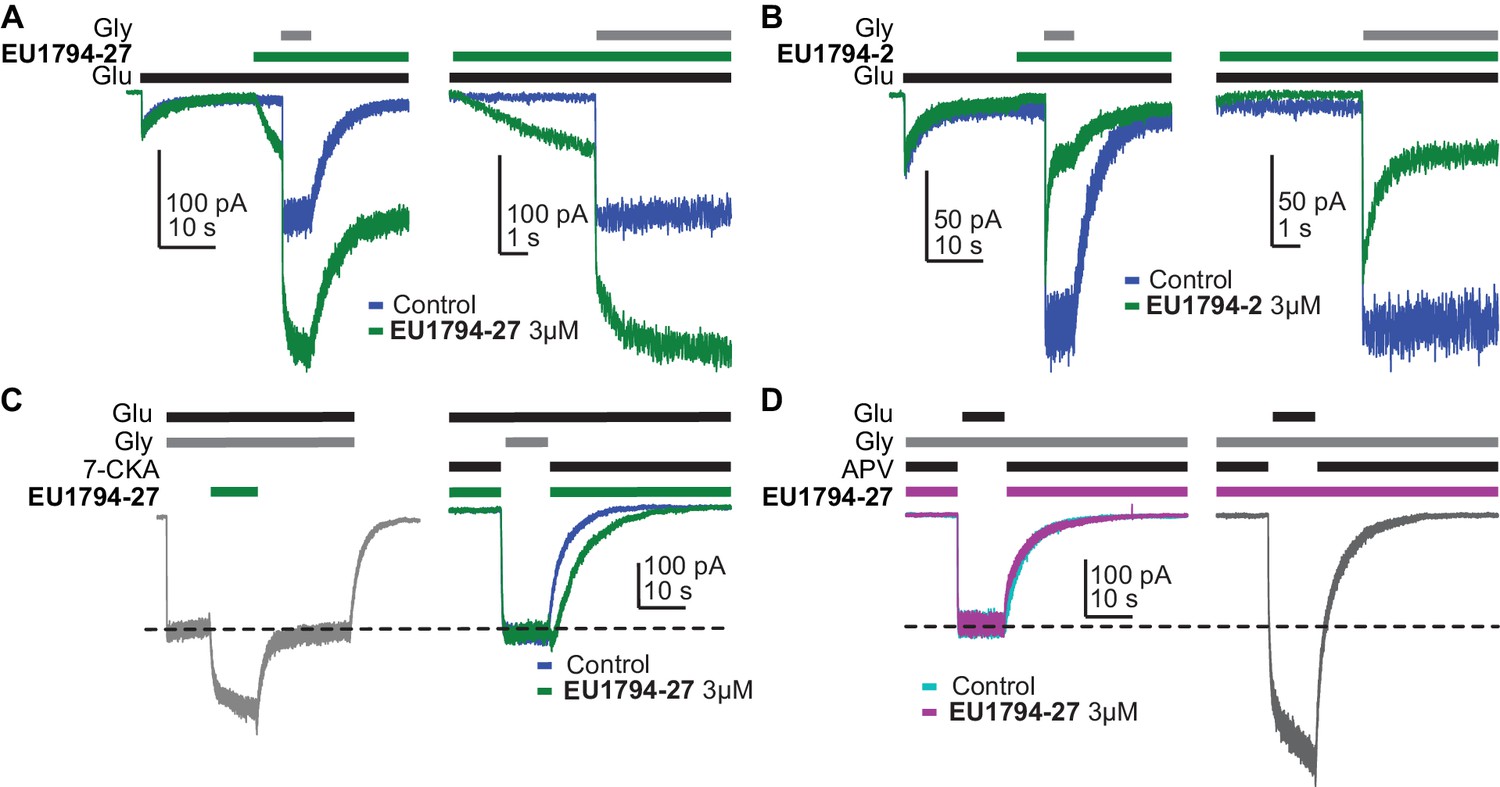
EU1794 modulators are dependent on co-agonist binding.
(A) Representative whole-cell current recordings of GluN1/GluN2D NMDARs exemplifying the EU1794-27 modulation in the presence of contaminant levels of glycine. The left panel shows the response to glutamate in the absence of 3 µM EU1794-27 but with a low, unknown level of glycine. Note the initial response to just glutamate, which fades with time to a small constitutive current. When 3 µM EU1794-27 is applied in the presence of only glutamate, there is a slowly rising response as EU1794-27 binds and increases glycine potency, allowing the receptor to re-equilibrate with the contaminant level of glycine. The cell was then rapidly stepped to a solution containing 30 µM glycine (in addition to the previous ligands). The right panel shows an expanded view (grey box in the left panel) of the rise of the receptor activation and the rapid kinetics of EU1794-27 action once the receptor is fully activated. Note the difference in modulation time course prior to full activation and during full activation. (B) Representative whole-cell current recordings of GluN1/GluN2D NMDARs exemplifying EU1794-2 modulation that is similar to the trace shown in Figure 5B. (C) Representative whole-cell current recordings of GluN1/GluN2D NMDARs exemplifying the EU1794-27 modulation dependence on the closed GluN1 ABD. The left current response shows the steady state response to 3 µM EU1794-27. The right current response is shown for the same cell to 100 µM glutamate plus 100 µM 7-CKA either with or without 3 µM EU1794-27 followed by a rapid change to a solution lacking 7-CKA and EU1794-27 with 30 µM glycine. Similar results were observed in 3 cells. (D) Representative whole-cell current recordings of GluN1/GluN2D NMDARs exemplifying the EU1794-27 modulation dependence on the closed GluN2 ABD. The left trace shows the exposure of GluN1/GluN2D to 100 µM glutamate, 100 µM APV, and either with or without 3 µM EU1794-27 followed by a rapid change to a solution lacking APV and EU1794-27 but containing 30 µM glycine. The right trace generated from the same cell shows the response if both solutions contained EU1794-27. Similar results were observed in 2 cells.
Figure 6 with 4 supplements
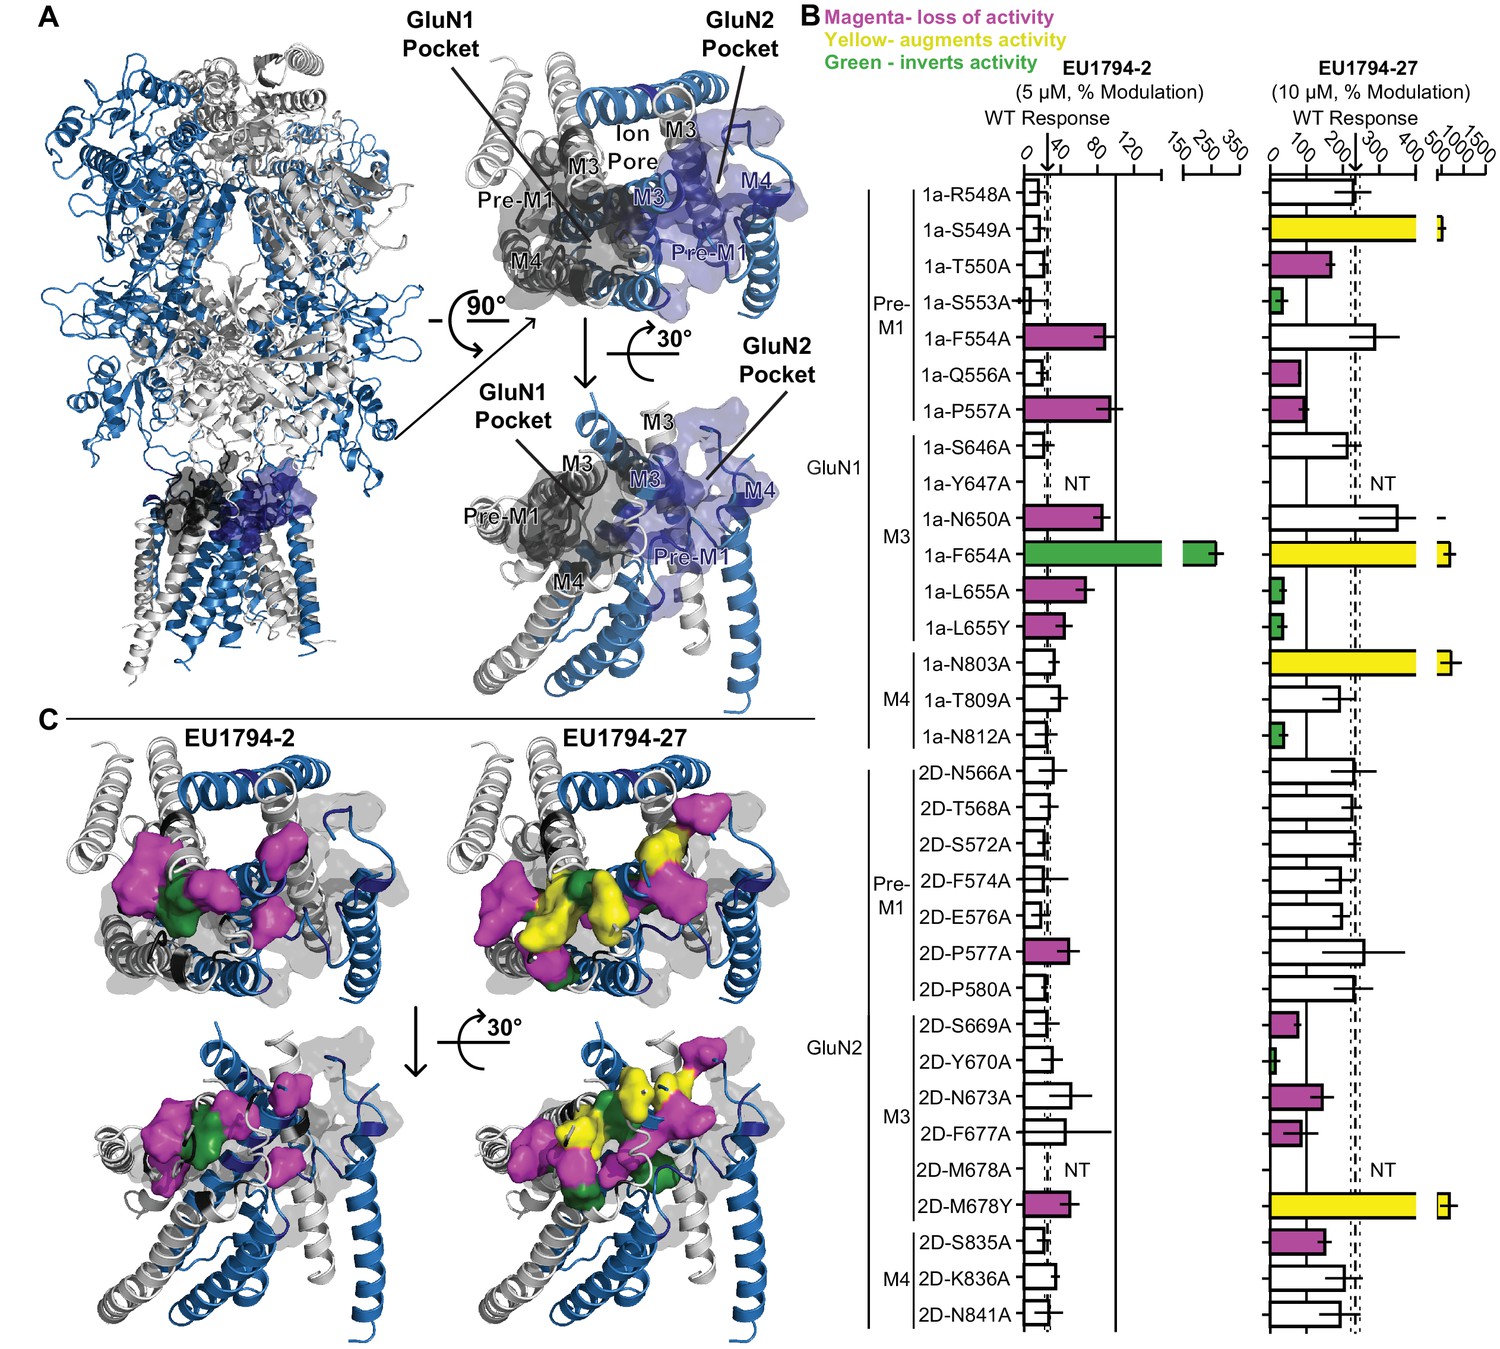
Distinct and overlapping pattern of residues contribute to the actions of EU1794 modulators with opposing effects.
(A) Ribbon representation (left) of a GluN1/GluN2D model based on published crystal structures of GluN1/GluN2B and GluA2 (Karakas and Furukawa, 2014; Lee et al., 2014; Yelshanskaya et al., 2016). The GluN1 subunits are grey and the GluN2D are purple; surface shell indicate residues of interest in GluN1 and GluN2D, including residues that are homologous to those identified in recent studies investigating transmembrane domain interacting modulators of NMDAR and AMPAR (Yelshanskaya et al., 2016; Wang et al., 2017). These GluN1 and GluN2D residues were changed to alanine (or tyrosine in two cases, as previously reported) and tested for effects on the NMDAR sensitivity to EU1794-2 and EU1794-27. Top down (right top) and side (right bottom) view of the model TMD and linker segments highlight two potential pockets with GluN1 and GluN2 M3 helices in the background. One pocket is primarily associated with GluN1 and the other GluN2. (B) The responses (mean ±99% CI) in EU1794-2 (5 µM, left) and EU1794-27 (10 µM, right) are shown as a % of the mutant receptor response to 100 µM glutamate and 30 µM glycine in the absence of the test compound. The wild type mean response is shown by the dashed line, surrounding dotted lines, which indicate the 99% confidence interval. Residues with non-overlapping confidence intervals with the wild type are colored with magenta indicating apparent loss of activity, yellow indicating augmented activity, and green indicating robust inverted modulation. Data for the mutations shown represent 4–18 oocytes from at least two independent experiments and the wild type response shown represent 83 oocytes for EU1794-2 and 76 oocytes for EU1794-27, recorded each experimental day to ensure consistency. We were not able to test all mutant receptors due to low expression for some (NT, not tested). (C) The residues (shown by the space-filling shell) identified in (B) that altered the effects of EU1794-2 (left) and/or EU1794-27 (right) were mapped onto the model with colors as described in (B). Views are the same as (A), with the all residues probed shown as grey transparent shell representation.
Figure 6—figure supplement 1
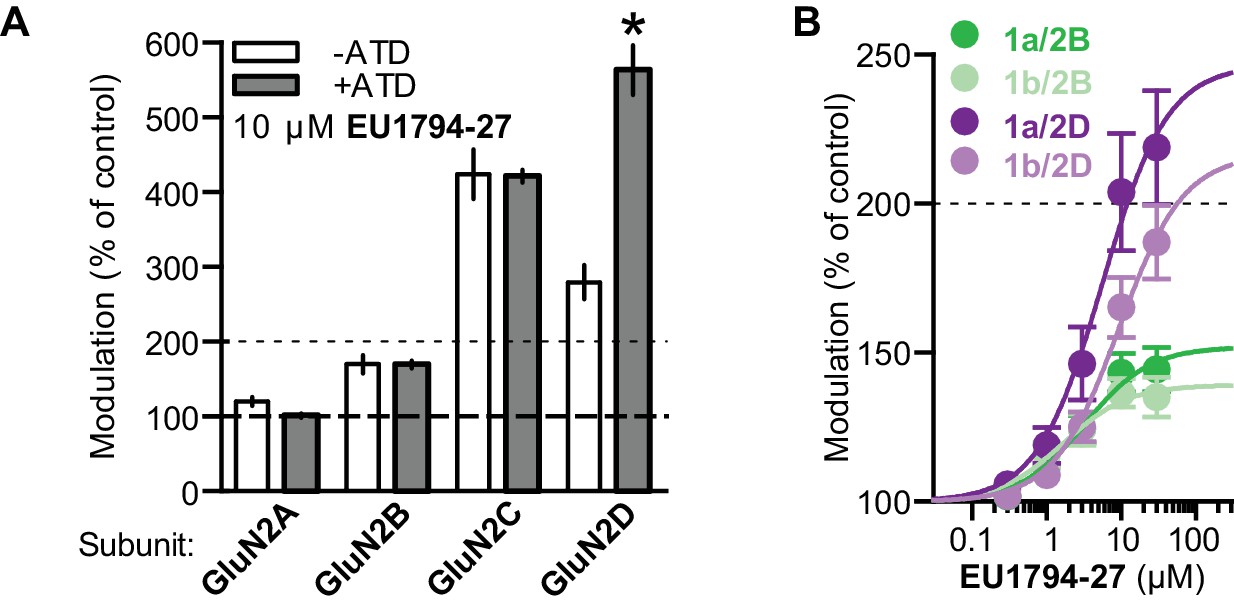
EU1794 series effects are not altered by ATD perturbations.
(A) 10 µM EU1794-27 potentiates GluN2-ΔATD NMDARs (n = 4–12). (B) Concentration-response curves for EU1794-27 potentiation of GluN2B and GluN2D with GluN1-1a and GluN1-1b (with and without exon5, respectively, n = 6–10). * signifies p<0.05 as determined by an unpaired t-test.
Figure 6—figure supplement 2
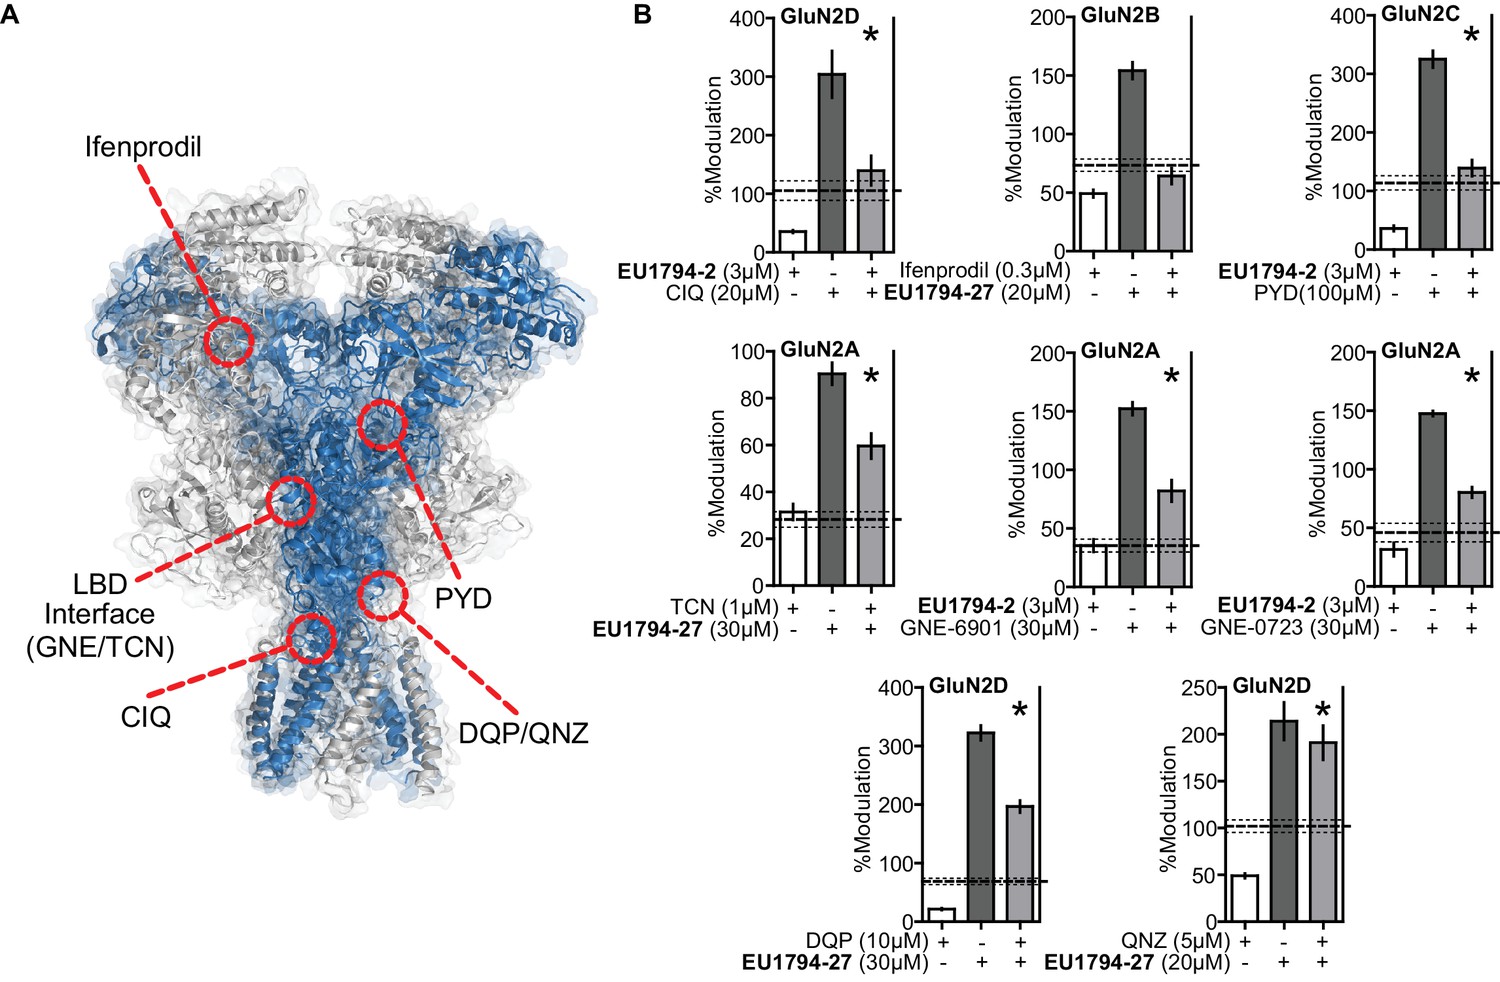
Compound competition screen of the EU1794 series with NMDAR modulators highlights potential interactions with the ABD and the TMD.
(A) Overlaid surface and ribbon representations of the GluN1/GluN2D model (see Figure 6) highlighting proposed ligand binding sites for ifenprodil (Karakas et al., 2011), PYD-106 (Khatri et al., 2014), CIQ (Ogden and Traynelis, 2013), GNE-6901 (Hackos et al., 2016), TCN-201 (Yi et al., 2016), DQP-1105 (Acker et al., 2011), and QNZ-46 (Hansen and Traynelis, 2011). (B) Single concentration competition experiments are summarized for ifenprodil (0.3 µM, on GluN1/GluN2B, n = 10), CIQ (20 µM, GluN1/GluN2D, n = 15), PYD-106 (100 µM, GluN1/GluN2C, n = 14), TCN-201 (1 µM, 1 µM glycine, GluN1/GluN2A, n = 11), GNE-6901 (30 µM, GluN1/GluN2A, n = 6), GNE-0723 (30 µM, GluN1/GluN2A, n = 6), DQP-1105 (10 µM, GluN1/GluN2D, n = 10), and QNZ-46 (5 µM, GluN1/GluN2D, n = 8) co-administered with maximally effective glutamate and glycine plus either EU1794-2 (3 µM) or EU1794-27 (20 µM). The individual average effects of the pairs of modulators along with the co-applied effect are plotted, and the predicted mean net effect of the modulators is displayed as a dashed line (SEM, dotted lines). * signifies p<0.05 as determined by a paired t-test comparing co-applied modulators and predicted net effect of modulator actions. All pairs were tested during two independent experiments sessions. The predicted net effect was calculated by EffectPredicted-Net = (ResponseDRUG,A / ResponseCONTROL,A) * (ResponseDRUG,B / ResponseCONTROL,B) and displayed as %.
Figure 6—figure supplement 3
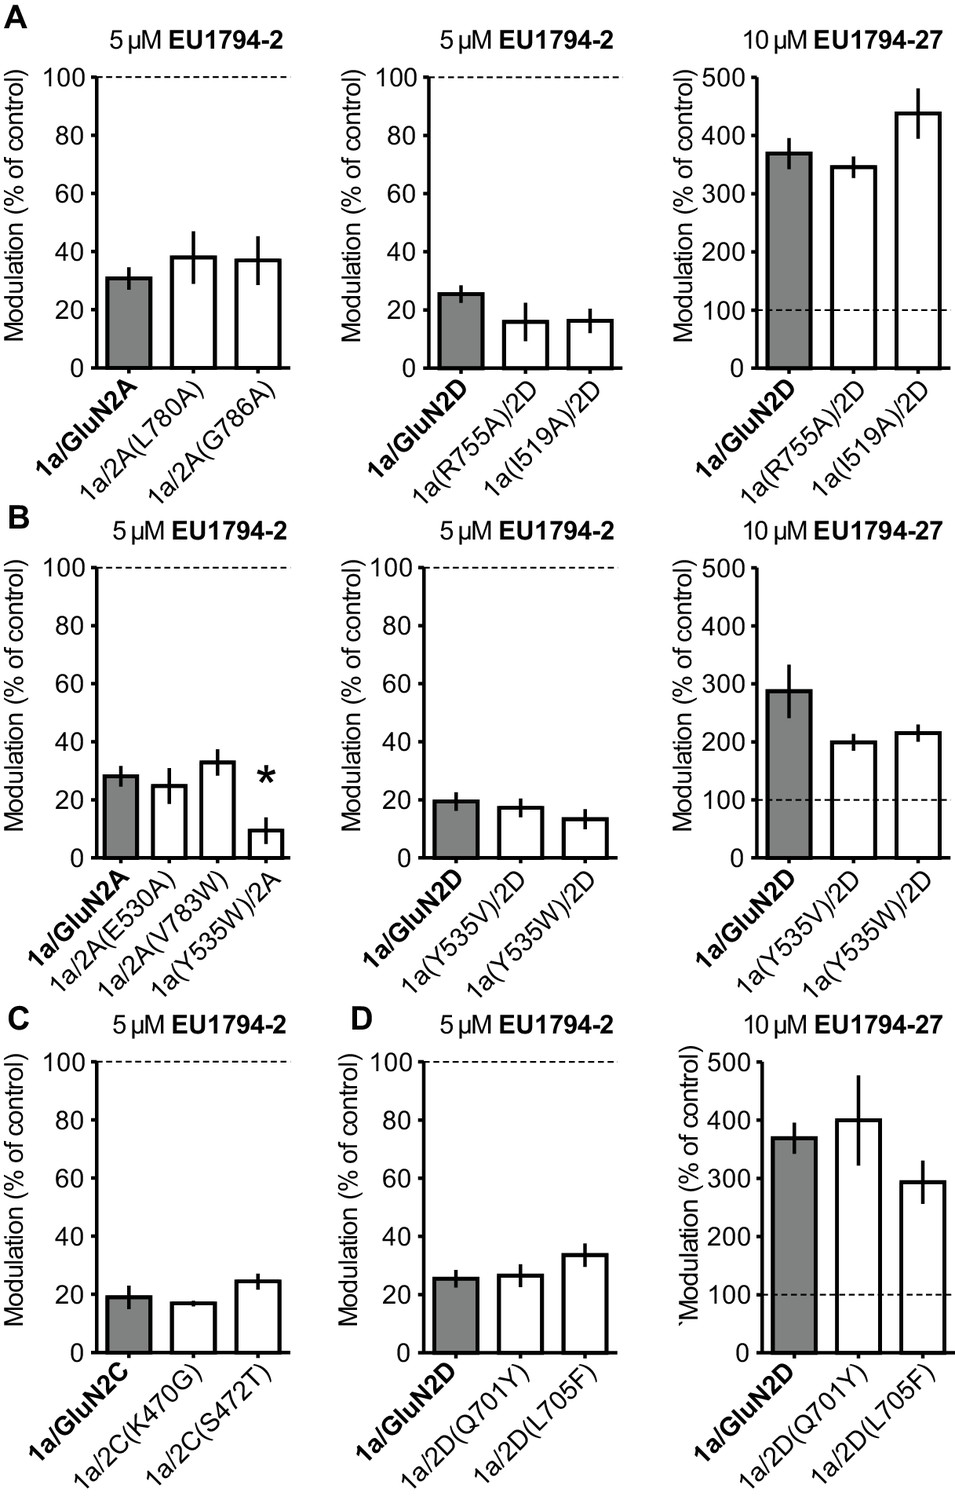
Residues in known modulator binding sites do not perturb actions of the EU1794 series.
(A) Inhibition by 5 µM EU1794-2 (left and middle) and potentiation by 10 µM EU1794-27 (right) on NMDARs possessing mutations known to alter the activity of TCN-201 as compared to wild type GluN1/GluN2A (left) and GluN1/GluN2D (middle and right) (Hansen et al., 2012; Yi et al., 2016). (B) Inhibition by 5 µM EU1794-2 (left and middle) and potentiation by 10 µM EU1794-27 (right) on NMDARs possessing mutations that alter the activity of GNE-6901 and GNE-0723 as compared to wild type GluN1/GluN2A (left) and GluN1/GluN2D (middle and right) (Hackos et al., 2016). (C) Inhibition by 5 µM EU1794-2 on NMDARs possessing mutations that alter the activity of PYD-106 as compared to wild type GluN1/GluN2C (Khatri et al., 2014). (D) Inhibition by 5 µM EU1794-2 (left) and potentiation by 10 µM EU1794-27 (right) on NMDARs possessing mutations that alter the activity of DQP-1105 and QNZ-46 as compared to wild type GluN1/GluN2D (Acker et al., 2011; Hansen and Traynelis, 2011). Wild type GluN1/GluN2D data are same as in (A). Data represent recordings from 3 to 9 oocytes. * denotes significance as determined by a one-way ANOVA with Dunnett’s multiple comparison test (compared to control).
Figure 6—figure supplement 4
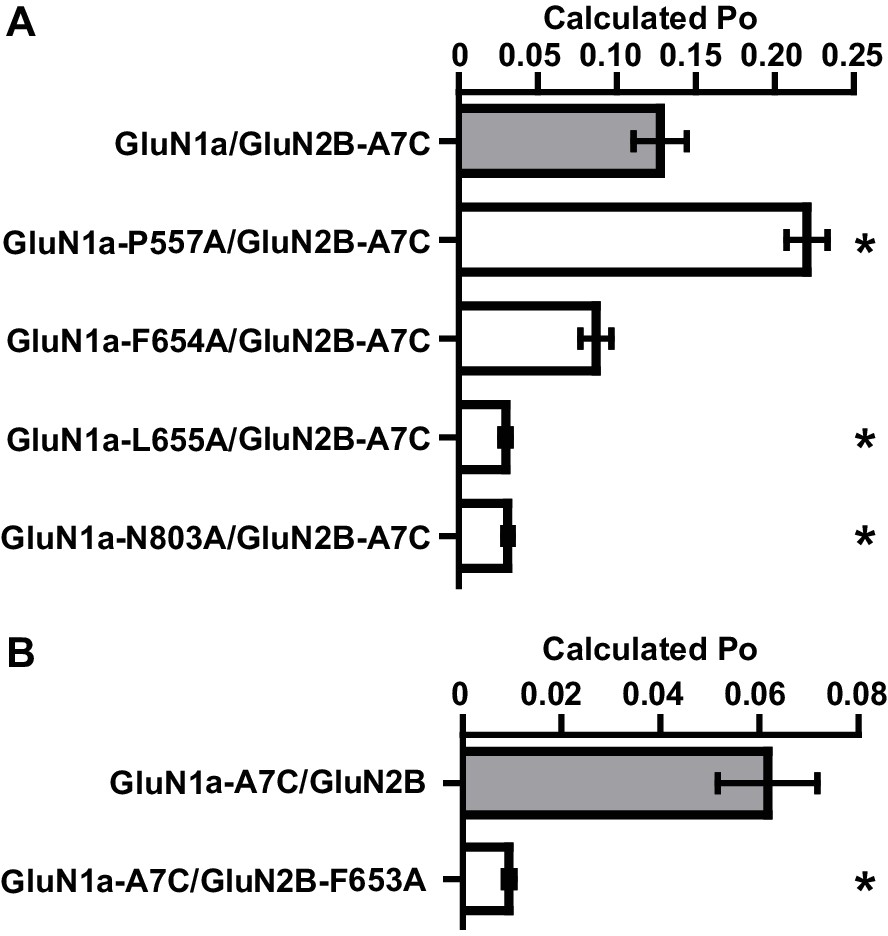
Mutated residues that impact EU1794 actions have lower open probability.
(A–B) Calculated open probability (Po) of mutations at residues that were important determinants of EU1794-2 and EU1794-27 action was measured by MTSEA modification of either GluN2-A651C (A7C, (A) or GluN1-A652C (A7C, (B). MTSEA (0.2 mM) effect on steady state responses to saturating concentration of glutamate and glycine was determined after 3 min of application, and a correction factor was used to account for changes in channel conductance (Yuan et al., 2005).
Figure 7 with 1 supplement
EU1794 PAMs and NAMs act in a competitive manner that matches receptor models with mutually exclusive modulator binding.
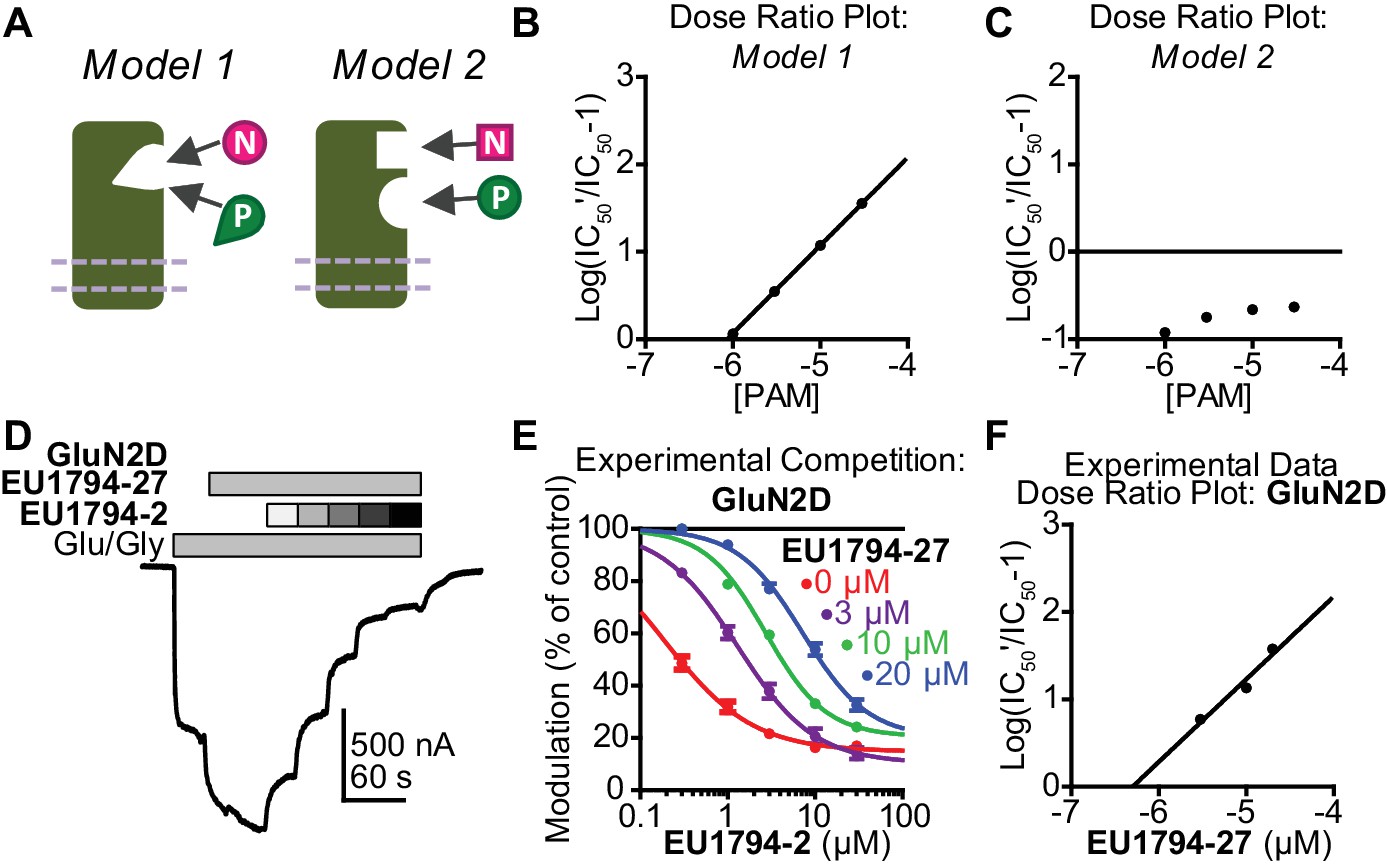
(A) Cartoon models show two potential modulator binding schemes. Model 1 possesses mutually exclusive modulator binding whereas Model 2 can bind either or both modulators. Ligands are denoted by [N] (NAM) and [P] (PAM). (B,C) Dose-ratio plots are shown for simulated concentration-response curves of the NAM in various concentration of the PAM for Model 1 (B) and Model 2 (C). IC50’ is the observed NAM IC50 in the presence of a fixed concentration PAM. (D) A representative TEVC recording (fixed 3 µM EU1794-27 and 0.3, 1, 3, 10, 30 µM EU1794-2) is shown for GluN1/GluN2D NMDARs (top). (E) The mean steady state responses in (D) were fitted with the Hill equation. Concentration-response data in the absence of EU1794-27 are included for comparison from Figure 1C. (F) Dose-ratio analysis of experimental data illustrates the shift in the IC50 of the NAM as a function of PAM concentration. Data are from at least six oocytes evaluated from two independent experiments.
Figure 7—figure supplement 1
EU1794 PAMs and NAMs act in a competitive manner that suggests mutually exclusive modulator binding.
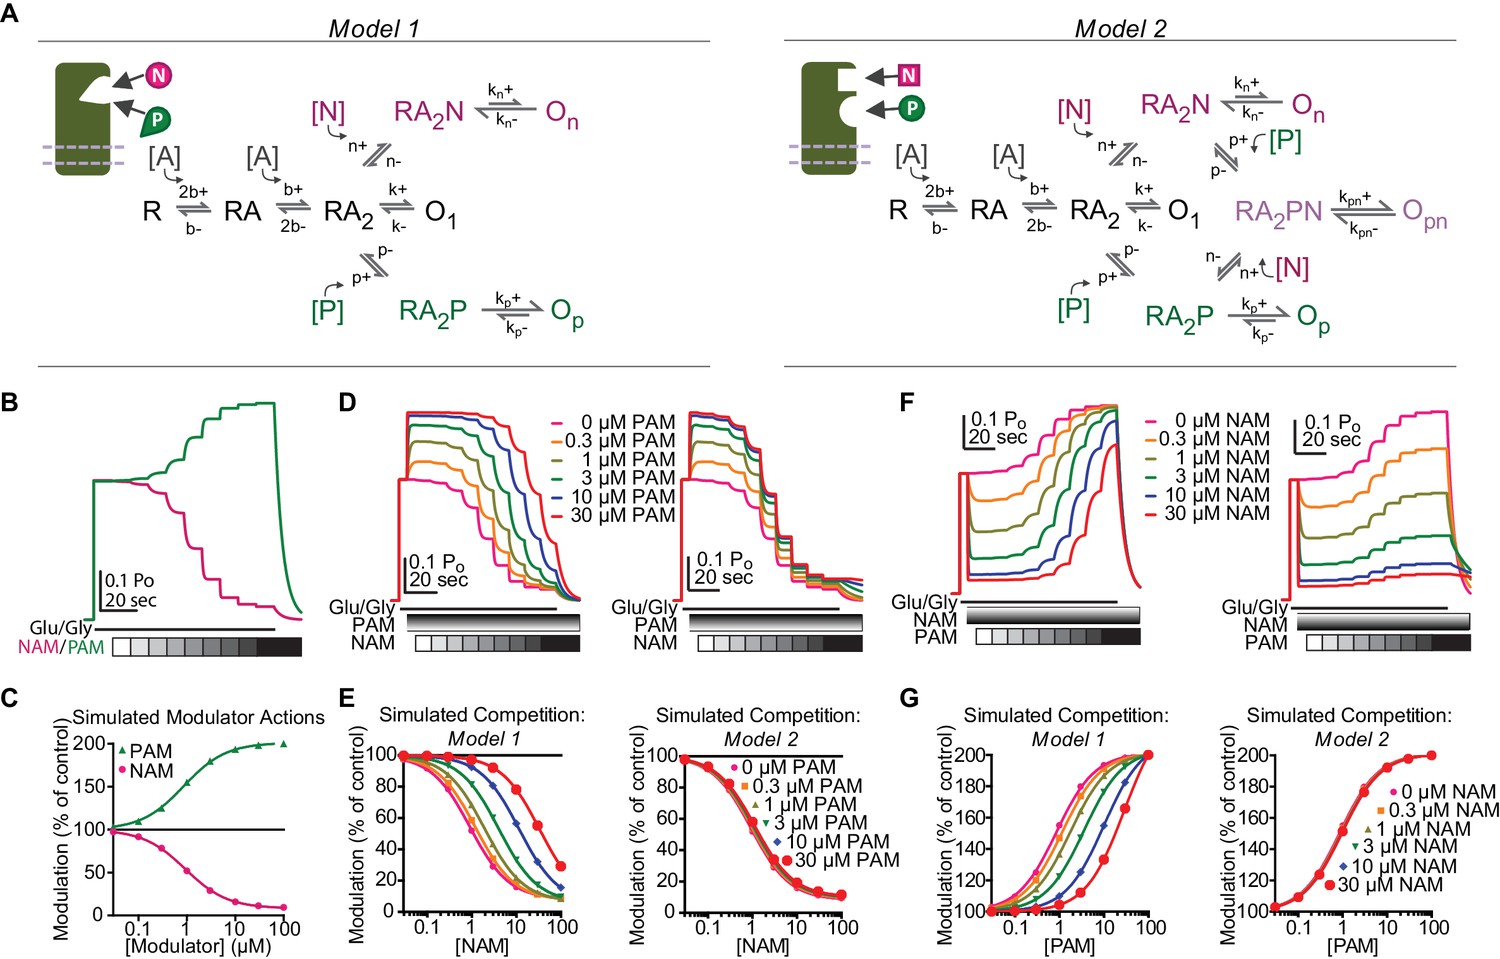
(A) Cartoon and Markov models of potential modulator binding schemes. Model 1 possesses mutually exclusive modulator binding whereas Model 2 can bind either or both modulators. Ligand-dependent transitions are denoted by [A] (agonist), [N] (NAM), [P] (PAM). (B) Simulated concentration-response curves of hypothetical modulator actions on an agonist-saturated response of Model 1 and 2 (NAM EC500.89 µM, PAM EC500.85 µM). (C) Simulation of co-administered hypothetical modulators for Model 1 (left) and Model 2 (right) to an agonist-saturated response. Responses to NAM concentrations (0.03, 0.1, 0.3, 1, 3, 10, 30, 100 µM) were simulated in the presence of fixed concentrations of PAM (0, 0.3, 1, 3, 10, 30 µM). (D) Simulated concentration-response data fit with the Hill equation for Model 1 (left) and Model 2 (right). (F) Simulated responses for co-application of multiple modulators using Model 1 and Model 2 (left and right, respectively). The current response to saturating agonist concentration was simulated in the presence of eight PAM concentration responses (0.03, 0.1, 0.3, 1, 3, 10, 30, 100 µM) and fixed concentrations of NAM (0, 0.3, 1, 3, 10, 30 µM). (G) The steady-state responses from each condition was plotted as a function of concentration and fit with the Hill equation. Rates used are (concentration dependent rates in µM s−1) b+=10.4 [A]*s−1, b-=73 s−1, k+=501.6 s−1, k-=790 s−1, n+=0.786 [N]*s−1, n-=0.393 s−1, p+=0.786 [P]*s−1, p-=0.786 s−1, kn+=25.08 s−1, kn-=790 s−1, kp+=1003.2 s−1, kp-=790 s−1, kpn+=50.16 s−1, kpn-=790 s−1.
Figure 8 with 1 supplement
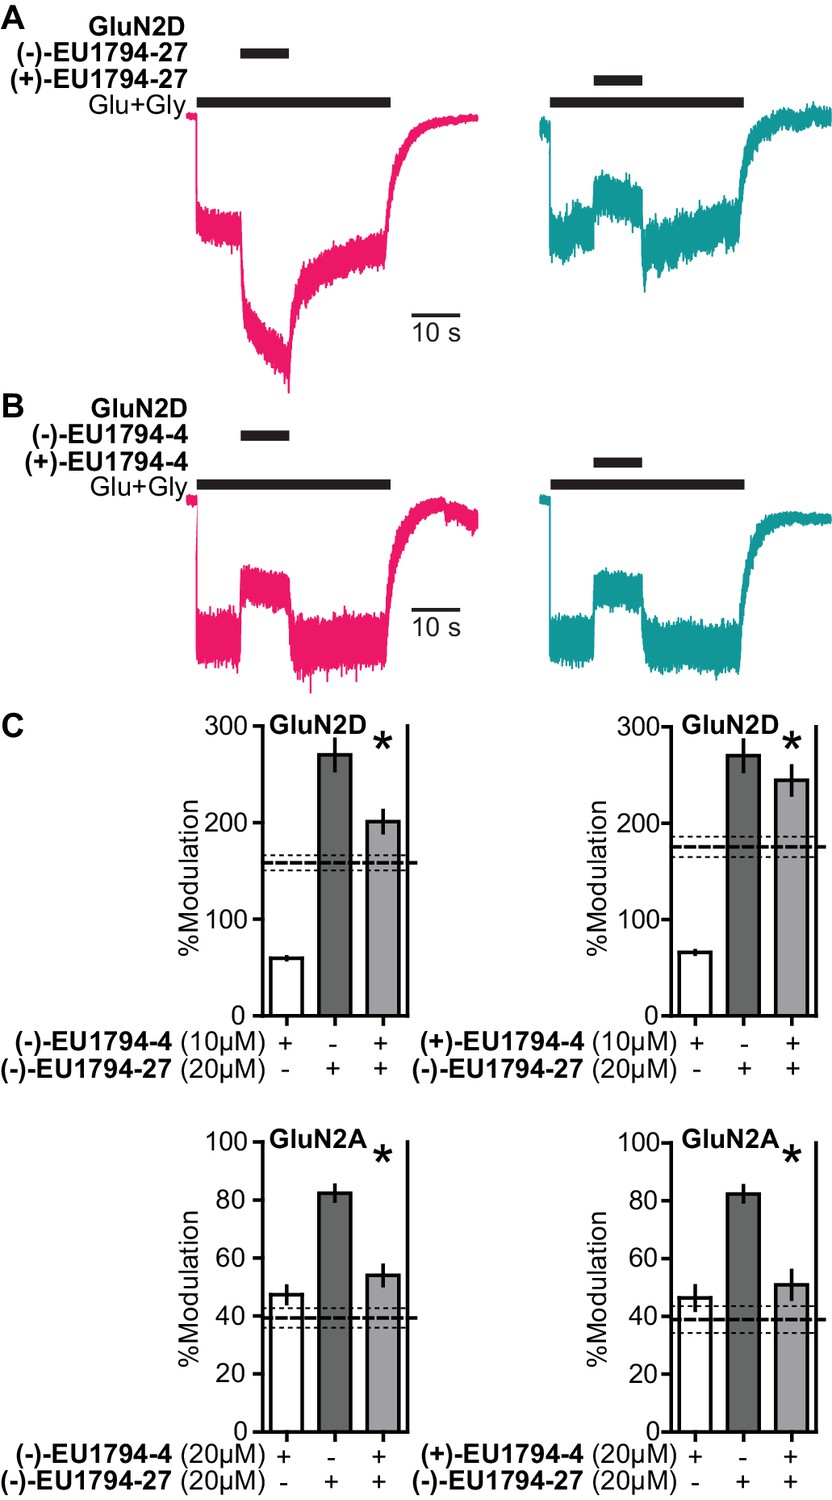
The enantiomers of EU1794-4 and EU1794-27 have different action.
(A) Representative modulation of GluN1/GluN2D responses by the enantiomers of EU1794-27 (both 10 µM, 100/30 µM glutamate/glycine). Similar results were observed in at least 3 cells to fresh modulator solution made less than one hour before experiment conclusion. (B) Representative modulation of GluN1/GluN2D responses by the enantiomers of EU1794-4 (both 10 µM, 100/30 µM glutamate/glycine). Similar results were observed in at least 3 cells to fresh modulator solution made less than one hour before experiment conclusion. (C) Single concentration competition experiments illustrating an interaction between both enantiomers of EU1794-4 (+and -) and the positive modulating enantiomer of EU1794-27 (-) at GluN1/GluN2D. The individual average effects of the pairs of modulators along with the co-applied effect are plotted, and the predicted mean net effect of the modulators is displayed as a dashed line (SEM, dotted lines, n = 10 from two independent experiments). * signifies p<0.05 as determined by a paired t-test comparing co-applied modulators and predicted net effect of modulator actions.
Figure 8—figure supplement 1

The concentration response and stability of the enantiomers of EU1794-27 and EU1794-4.
(A) The concentration-response relationships illustrate the selective action of the enantiomer (-)-EU1794-27. Responses were activated with 100/30 µM glutamate/glycine and modulated with 0.3, 1, 3, 10, and 30 µM of each enantiomer. (B) The time course is shown for EU1794-27 enantiomer racemization in working solutions. Individual paired differences in the % modulation of the enantiomers are plotted versus time. As previously reported (Katzman et al., 2015), this series appears prone to racemization in aqueous solution, which may account for differences in activity due to the time the enantiomers spend in the working solution. The difference in the extent of modulation of the enantiomers of EU1794-27 was reduced slowly over time, producing modest racemization over the time frame of enantiomer experiments. (C) The concentration-response relationships illustrate the selective action of one enantiomer of EU1794-4. Responses were activated with 100/30 µM glutamate/glycine and modulated with 0.1, 0.3, 1, 3, 10, and 30 µM of each enantiomer. Data are from 4 to 7 oocytes from at least two independent experiments. (D) The time course of EU1794-4 enantiomer racemization in working solutions is shown; all data are from one racemization experiment (1–2 recordings at each time point). The difference in the extent of modulation of the enantiomers of EU1794-4 was reduced slowly over time.
Chemical structure 1
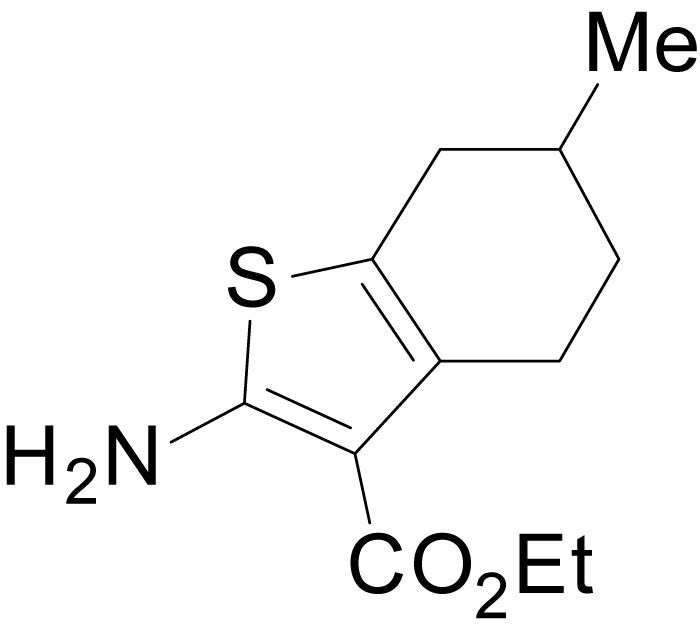
ethyl 2-amino-6-methyl-4,5,6,7-tetrahydrobenzo[b]thiophene-3-carboxylate (11b).
https://doi.org/10.7554/eLife.34711.028
Chemical structure 2
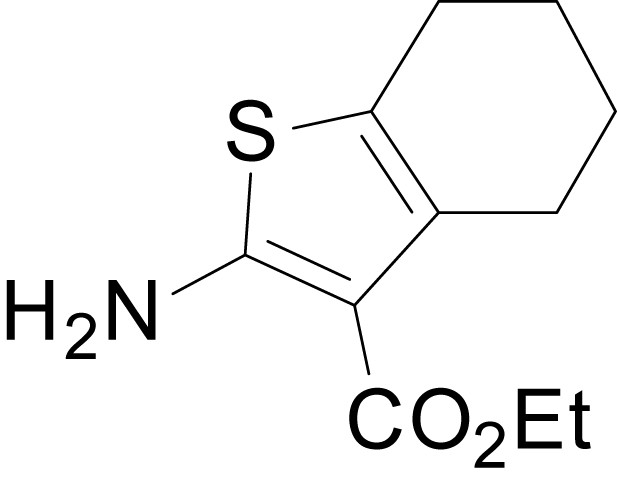
ethyl 2-amino-4,5,6,7-tetrahydrobenzo[b]thiophene-3-carboxylate (11c)
https://doi.org/10.7554/eLife.34711.029
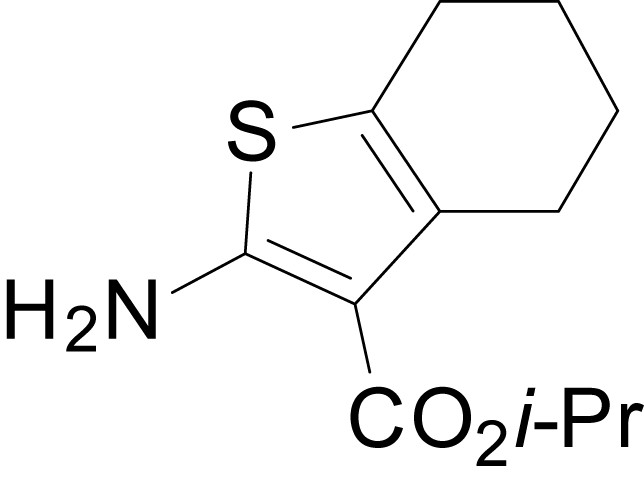
Chemical structure 3
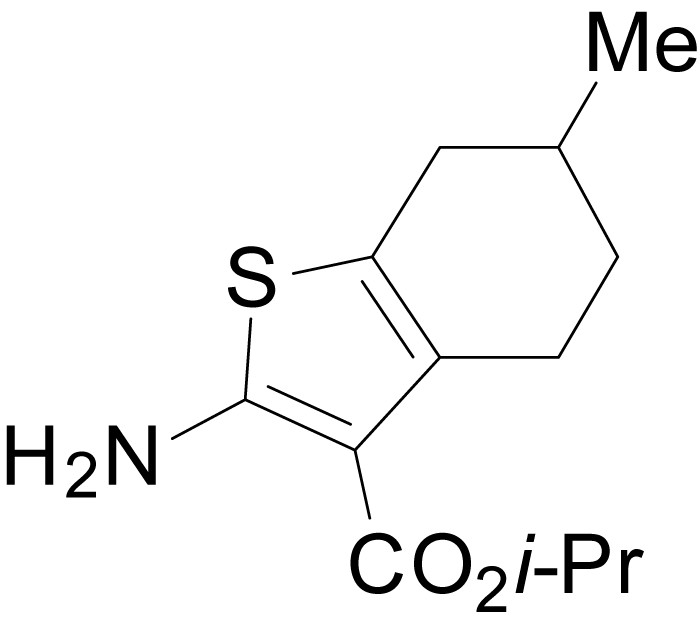
isopropyl 2-amino-6-methyl-4,5,6,7-tetrahydrobenzo[b]thiophene-3-carboxylate (11f)
https://doi.org/10.7554/eLife.34711.030
Chemical structure 4
isopropyl 2-amino-4,5,6,7-tetrahydrobenzo[b]thiophene-3-carboxylate (11h)
https://doi.org/10.7554/eLife.34711.031
Chemical structure 5
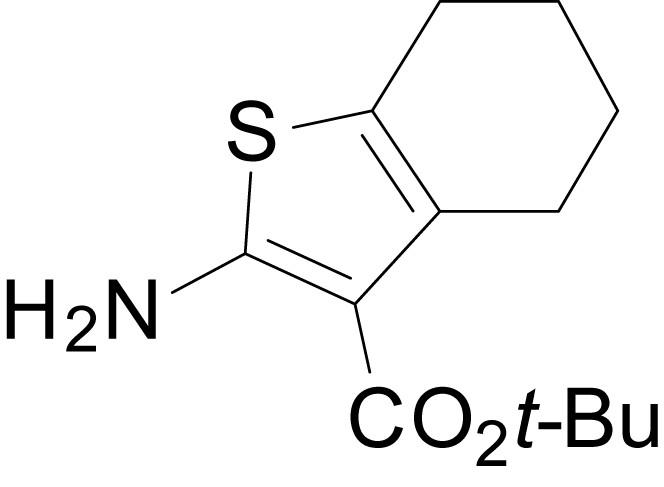
tert-butyl 2-amino-4,5,6,7-tetrahydrobenzo[b]thiophene-3-carboxylate (11k)
https://doi.org/10.7554/eLife.34711.032
Chemical structure 6
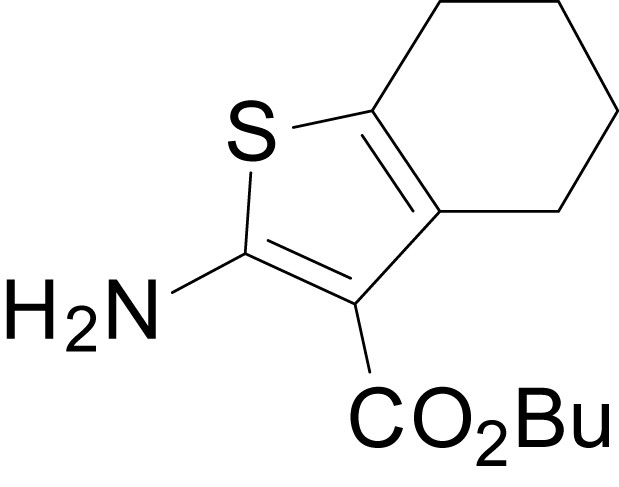
butyl 2-amino-4,5,6,7-tetrahydrobenzo[b]thiophene-3-carboxylate (11l)
https://doi.org/10.7554/eLife.34711.033
Chemical structure 7

benzyl 2-amino-4,5,6,7-tetrahydrobenzo[b]thiophene-3-carboxylate (11m)
https://doi.org/10.7554/eLife.34711.034
Chemical structure 8
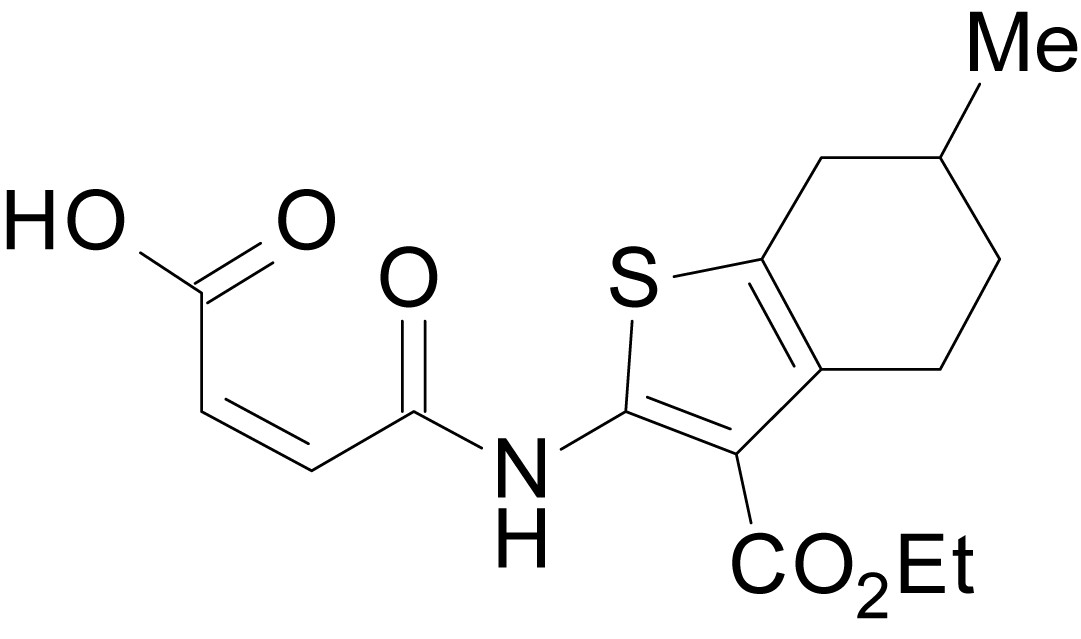
(Z)-4-((3-(ethoxycarbonyl)-6-methyl-4,5,6,7-tetrahydrobenzo[b]thiophen-2-yl)amino)-4-oxobut-2-enoic acid (13b)
https://doi.org/10.7554/eLife.34711.035
Chemical structure 9

(Z)-4-((3-(ethoxycarbonyl)-4,5,6,7-tetrahydrobenzo[b]thiophen-2-yl)amino)-4-oxobut-2-enoic acid (13c)
https://doi.org/10.7554/eLife.34711.036
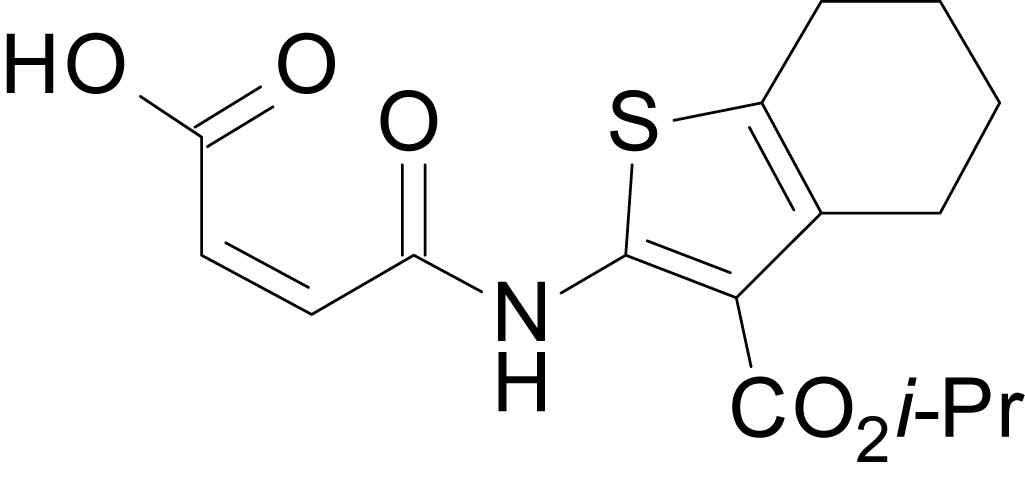
Chemical structure 10

(Z)-4-((3-(isopropoxycarbonyl)-6-methyl-4,5,6,7-tetrahydrobenzo[b]thiophen-2-yl)amino)-4-oxobut-2-enoic acid (13f)
https://doi.org/10.7554/eLife.34711.037
Chemical structure 11
(Z)-4-((3-(isopropoxycarbonyl)-4,5,6,7-tetrahydrobenzo[b]thiophen-2-yl)amino)-4-oxobut-2-enoic acid (13h)
https://doi.org/10.7554/eLife.34711.038
Chemical structure 12
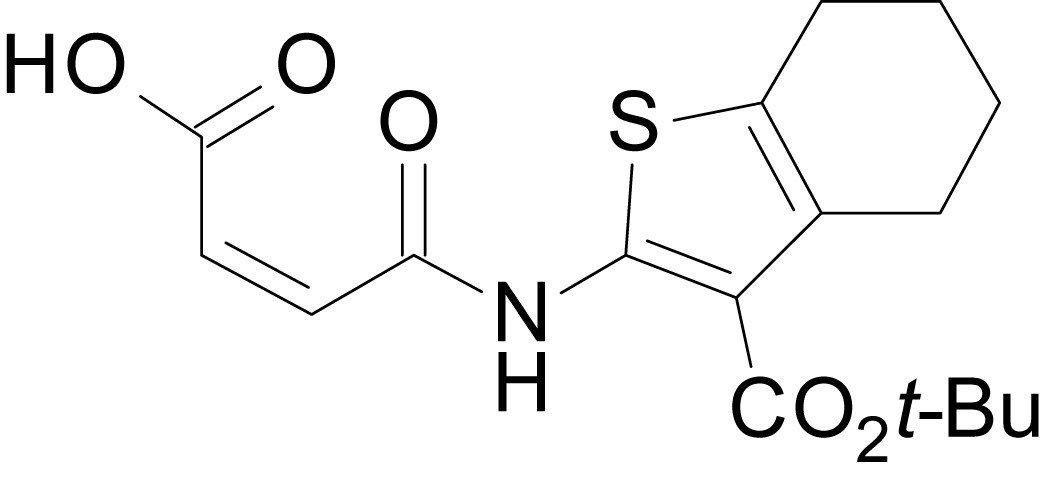
(Z)-4-((3-(tert-butoxycarbonyl)-4,5,6,7-tetrahydrobenzo[b]thiophen-2-yl)amino)-4-oxobut-2-enoic acid (13k)
https://doi.org/10.7554/eLife.34711.039
Chemical structure 13
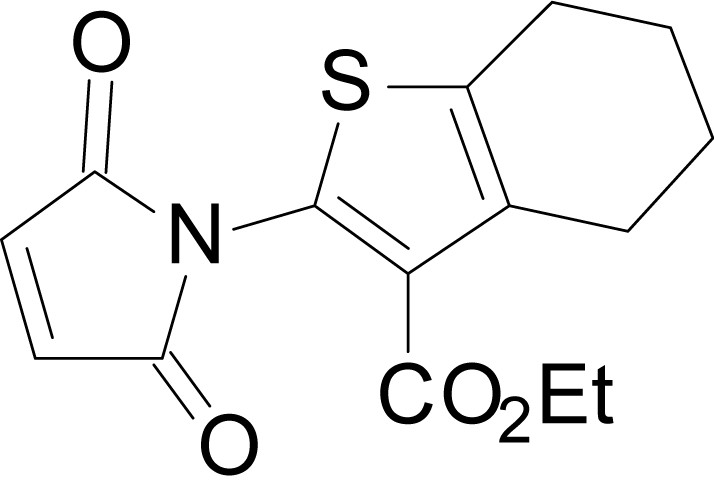
ethyl 2-(2,5-dioxo-2,5-dihydro-1H-pyrrol-1-yl)-6-methyl-4,5,6,7- tetrahydrobenzo[b]thiophene-3-carboxylate (18b)
https://doi.org/10.7554/eLife.34711.040
Chemical structure 14

isopropyl 2-(2,5-dioxo-2,5-dihydro-1H-pyrrol-1-yl)-4,5,6,7-tetrahydrobenzo[b]thiophene-3-carboxylate (18h)
https://doi.org/10.7554/eLife.34711.041
Chemical structure 15
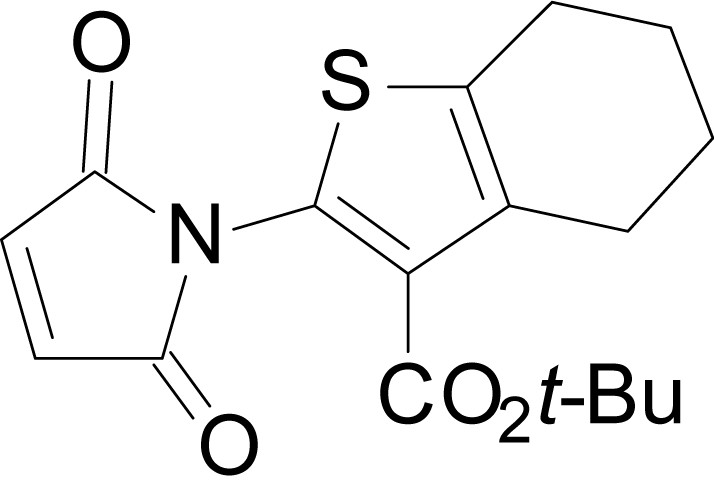
tert-butyl 2-(2,5-dioxo-2,5-dihydro-1H-pyrrol-1-yl)-4,5,6,7-tetrahydrobenzo[b]thiophene-3-carboxylate (18k)
https://doi.org/10.7554/eLife.34711.042
Chemical structure 16

butyl 2-(2,5-dioxo-2,5-dihydro-1H-pyrrol-1-yl)-4,5,6,7-tetrahydrobenzo[b]thiophene-3- carboxylate (18l)
https://doi.org/10.7554/eLife.34711.043
Chemical structure 17
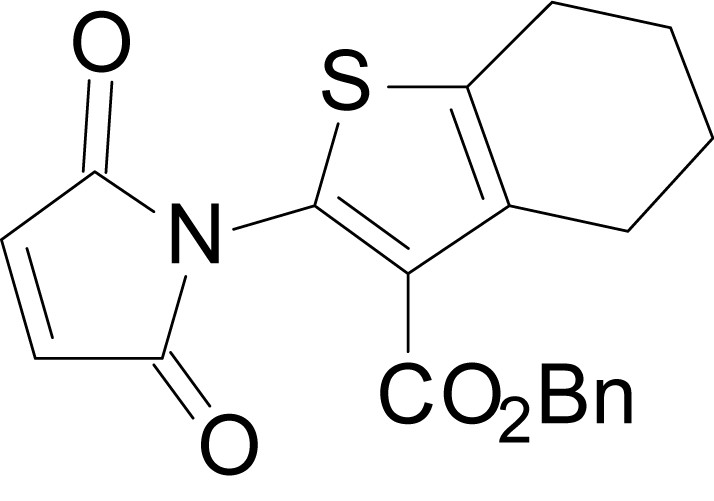
benzyl 2-(2,5-dioxo-2,5-dihydro-1H-pyrrol-1-yl)-4,5,6,7-tetrahydrobenzo[b]thiophene-3- carboxylate (18m)
https://doi.org/10.7554/eLife.34711.044
Chemical structure 18
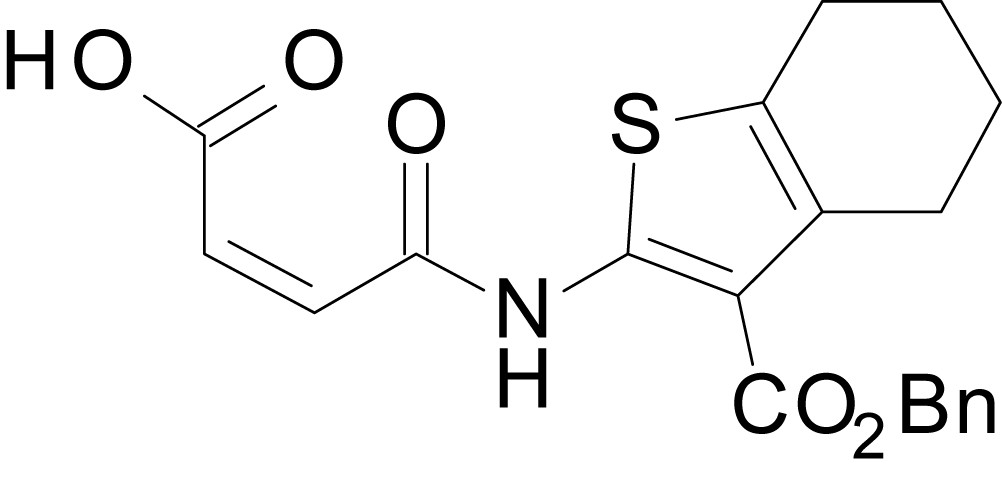
(Z)-4-((3-((benzyloxy)carbonyl)-4,5,6,7-tetrahydrobenzo[b]thiophen-2-yl)amino)-4-oxobut-2-enoic acid (13m)
https://doi.org/10.7554/eLife.34711.045
Chemical structure 19
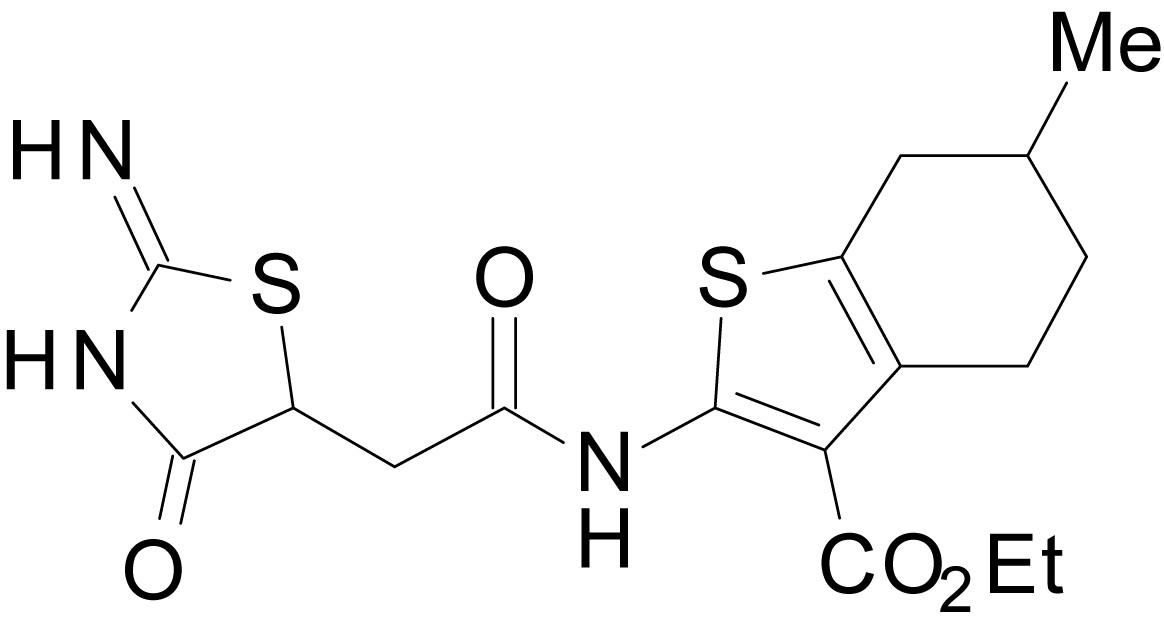
ethyl 2-(2-(2-imino-4-oxothiazolidin-5-yl)acetamido)-6-methyl-4,5,6,7-tetrahydrobenzo[b]thiophene-3-carboxylate (EU1794-2)
https://doi.org/10.7554/eLife.34711.046
Chemical structure 20
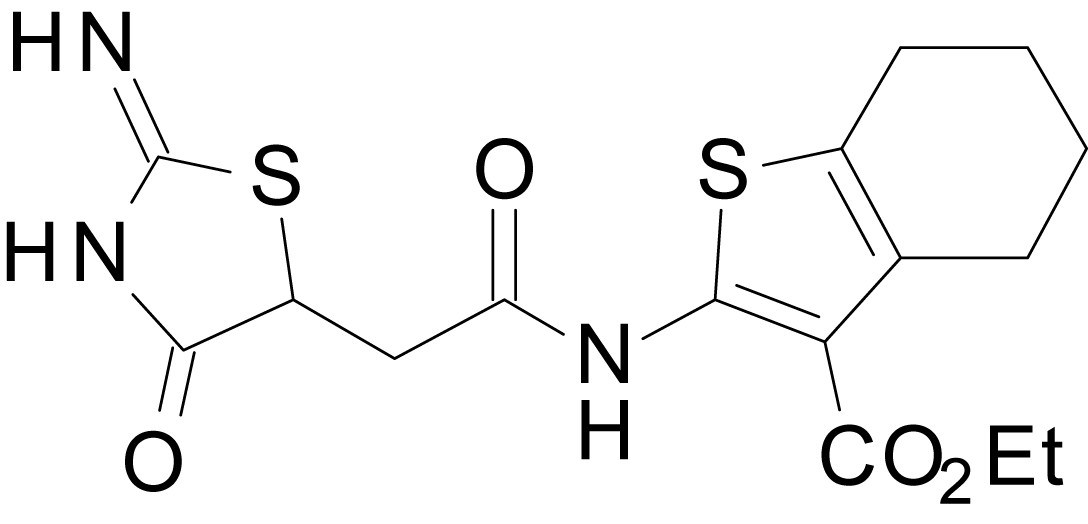
ethyl 2-(2-(2-imino-4-oxothiazolidin-5-yl)acetamido)-4,5,6,7-tetrahydrobenzo[b]thiophene-3-carboxylate (EU1794-4)
https://doi.org/10.7554/eLife.34711.047
Chemical structure 21
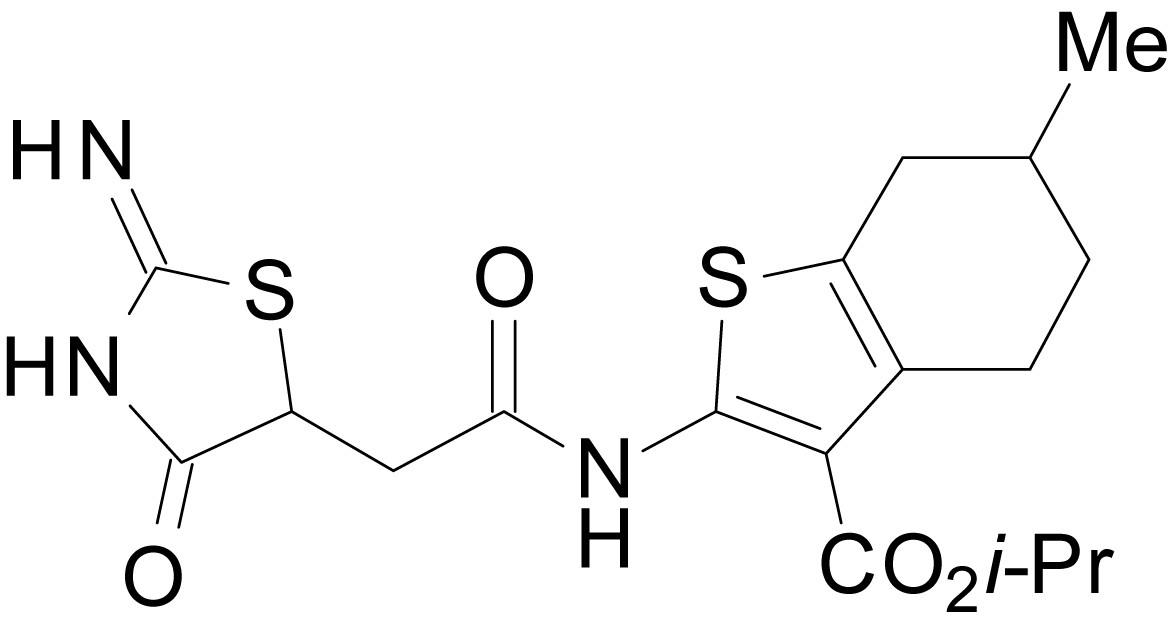
isopropyl 2-(2-(2-imino-4-oxothiazolidin-5-yl)acetamido)-6-methyl-4,5,6,7-tetrahydrobenzo[b]thiophene-3-carboxylate (EU1794-19)
https://doi.org/10.7554/eLife.34711.048
Chemical structure 22
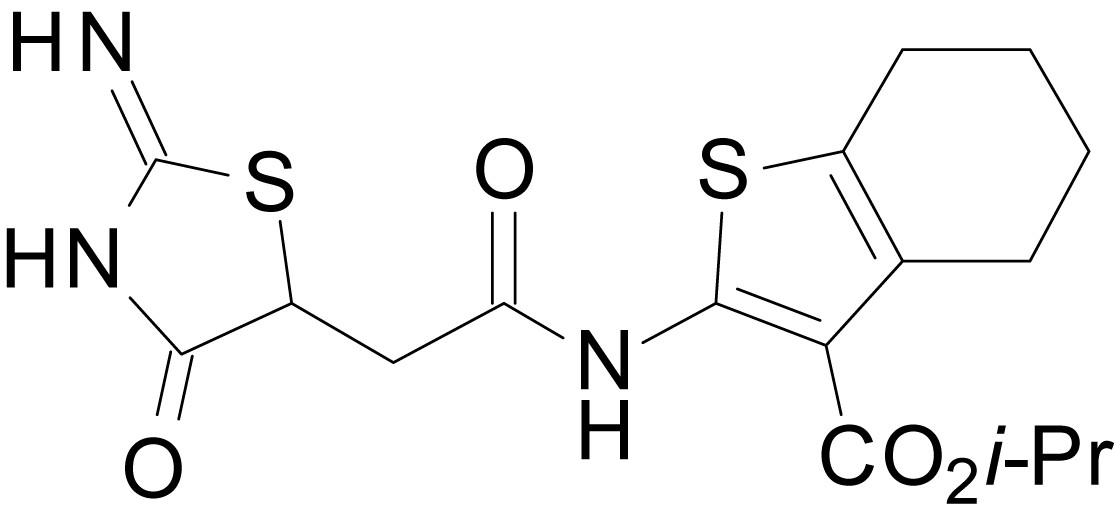
isopropyl 2-(2-(2-imino-4-oxothiazolidin-5-yl)acetamido)-4,5,6,7-tetrahydrobenzo[b]thiophene-3-carboxylate (EU1794-5)
https://doi.org/10.7554/eLife.34711.049
Chemical structure 23
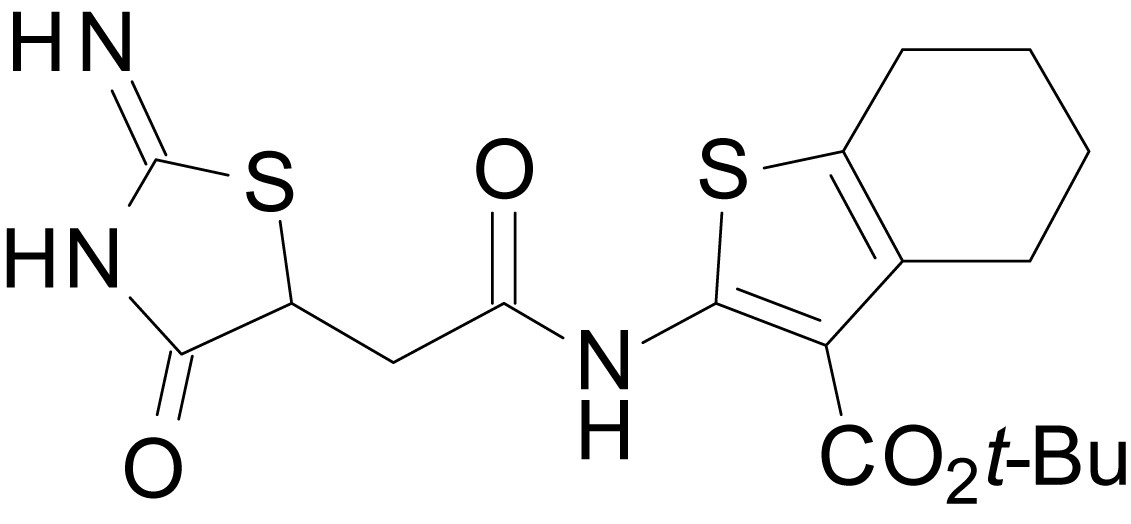
tert-butyl 2-(2-(2-imino-4-oxothiazolidin-5-yl)acetamido)-4,5,6,7-tetrahydrobenzo[b]thiophene-3-carboxylate (EU1794-27)
https://doi.org/10.7554/eLife.34711.050
Chemical structure 24

butyl 2-(2-(2-imino-4-oxothiazolidin-5-yl)acetamido)-4,5,6,7-tetrahydrobenzo[b]thiophene-3-carboxylate (EU1794-29)
https://doi.org/10.7554/eLife.34711.051
Chemical structure 25

benzyl 2-(2-(2-imino-4-oxothiazolidin-5-yl)acetamido)-4,5,6,7-tetrahydrobenzo[b]thiophene-3-carboxylate (EU1794-25)
https://doi.org/10.7554/eLife.34711.052Tables
Table 1
The effect of alkyl ester and tetrahydrobenzothiophene ring substitutions on the potency and efficacy of EU1794 analogues.
https://doi.org/10.7554/eLife.34711.004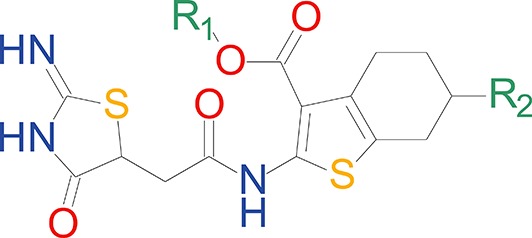 | EC50 (µM) [conf. int.]* Maximal Degree of Modulation (% of control)† | ||||||
|---|---|---|---|---|---|---|---|
| Compound | R1 | R1 volume (Å3) | R2 | GluN2A | GluN2B | GluN2C | GluN2D |
| EU1794-4 | Et | 45.15 | H | 2.2 [1.8, 2.8] 32 ± 3% | 2.6 [1.4, 4.8] 67 ± 4% | 0.42 [0.28, 0.61] 52 ± 2% | 0.36 [0.29, 0.45] 51 ± 3% |
| EU1794-2 | Et | 45.15 | Me | 0.60 [0.44, 0.82] 6 ± 2% | 1.2 [0.8, 1.9] 10 ± 3% | 0.26 [0.21, 0.31] 14 ± 1% | 0.20 [0.17, 0.25] 14 ± 1% |
| EU1794-5 | iPr | 62.16 | H | 18 [9.0, 36] 36 ± 5% | 2.5 [1.4, 4.4] 71 ± 4% | 4.0 [3.5, 4.6] 140 ± 3% | 9.3 [8.1, 11] 169 ± 7% |
| EU1794-19 | iPr | 62.16 | Me | 1.1 [0.5, 2.3] 19 ± 6% | 1.1 [0.9, 1.3] 43 ± 2% | 0.74 [0.57, 0.96] 32 ± 3% | 0.43 [0.32, 0.59] 46 ± 2% |
| EU1794-27 | tBu | 79.23 | H | 7.4 [5.3, 10] 52 ± 7% | 1.4 [1.2, 1.7] 130 ± 3% | 2.8 [2.5, 3.2] 230 ± 10% | 2.4 [1.8, 3.3] 250 ± 8% |
| EU1794-25 | Bn | 98.87 | H | - | 1.0 [0.9, 1.2] 220 ± 13% | 0.77 [0.56, 1.0] 180 ± 12% | 1.0 [0.95, 1.1] 250 ± 19% |
| EU1794-29 | n-Bu | 79.12 | H | 3.7 [1.7, 8.0] 59 ± 5% | 1.4 [1.1, 1.8] 140 ± 3% | 3.8 [2.6, 5.7] 130 ± 7% | 5.7 [5.1, 6.4] 166 ± 8% |
-
*EC50 values for potentiation of responses to saturating glutamate and glycine (100 μM, 30 μM) were obtained by least-squares fitting of data from individual experiments by the Hill equation. EC50 values are given as the mean with the 95% confidence interval determined from log(EC50).
†The maximal degree of modulation is given as mean ±SEM. For all compounds, data are from 4 to 18 oocytes recorded in at least two independent experiments. Data were not fit (shown as -) if the response recorded at 30 µM of test compound did not differ by more than 15% from control.
Table 2
Effect of EU1794-4 and EU1794-27 at sub-saturated NMDAR responses.
https://doi.org/10.7554/eLife.34711.009| EC50 (µM) [conf. int.]* Maximal Degree of Modulation (% of control)† | ||||
|---|---|---|---|---|
| GluN2A | GluN2B | GluN2C | GluN2D | |
| EU1794-4 | 3.9 [0.78, 20] 500 ± 32% | 4.3 [1.3, 14] 210 ± 6.8% | 15 [6.5, 35] 220 ± 20% | 14 [6.5, 29] 540 ± 190% |
| EU1794-27 | 8.1 [5.7, 12] 340 ± 32% | 6.3 [5.0, 8.0] 400 ± 50% | 5.0 [3.7, 6.6] 680 ± 50% | 8.3 [5.3, 13] 580 ± 86% |
-
*EC50 values of modulator action on responses to sub-saturating glutamate/glycine concentrations were obtained by least-squares fitting of data from individual experiments by the Hill equation. For EU1794-4 modulation of GluN1/GluN2A, GluN1/GluN2B and GluN1/GluN2C, glutamate/glycine concentrations were 1/0.3 µM; for GluN1/GluN2D glutamate/glycine were 0.3/0.09 µM. For EU1794-27 potentiation, glutamate/glycine concentrations were 2/0.6 µM (GluN1/GluN2A), 1/0.3 µM (GluN1/GluN2B, GluN1/GluN2C), and 0.6/0.2 µM (GluN1/GluN2D). EC50 for potentiation values are given as the mean with the 95% confidence interval determined from log(EC50).
†The extent of modulation is given as a percent of the control response in the absence of test compound. The maximal degree of modulation is given as mean ±SEM. For all compounds, data are from 4 to 13 oocytes recorded in two independent experiments.
Table 3
EU1794-27 effects on glutamate and glycine EC50 values.
https://doi.org/10.7554/eLife.34711.010| EC50 (µM) [conf. int.]* | ||||||
|---|---|---|---|---|---|---|
| Control Glutamate | EU1794-27 Glutamate | Fold Difference | Control Glycine | EU1794-27 Glycine | Fold Difference | |
| GluN2A | 2.9 [2.2, 4.0] | 1.1 [0.88, 2.1] | 2.3† | 0.57 [0.34, 0.96] | 0.38 [0.23, 0.64] | 1.6 |
| GluN2B | 1.2 [1.1, 1.3] | 0.65 [0.49, 0.85] | 2.0† | 0.28 [0.22, 0.36] | 0.14 [0.08, 0.24] | 2.9† |
| GluN2C | 0.67 [0.61, 0.73] | 0.22 [0.16, 0.31] | 3.3† | 0.23 [0.13, 0.40] | 0.10 [0.07, 0.15] | 2.4 |
| GluN2D | 0.21 [0.17,0.27] | 0.054 [0.028, 0.11] | 5.3† | 0.086 [0.077, 0.095] | 0.020 [0.013, 0.029] | 4.9† |
-
*Glutamate EC50 values (in the presence of 30 µM glycine) and glycine EC50 values (in the presence of 100 µM glutamate) were obtained by least-squares fitting of data from independent oocyte recordings by the Hill equation. EC50 values are given as the mean with the 95% confidence interval determined from log(EC50). Data in the absence and presence of EU1794-27 were obtained from the same oocyte. Data are from 5 to 12 paired oocytes recordings from at least two independent experiments.
†indicates paired measurements with non-overlapping confidence intervals.
Table 4
EU1794-4 effects on glutamate and glycine EC50 values.
https://doi.org/10.7554/eLife.34711.011| EC50 (µM) [conf. int.]* | ||||||
|---|---|---|---|---|---|---|
| Control Glutamate | EU1794-4 Glutamate | Fold Difference | Control Glycine | EU1794-4 Glycine | Fold Difference | |
| GluN2A | 3.6 [3.3, 4.0] | 1.5 [1.2, 2.1] | 2.4† | 0.89 [0.72, 1.1] | 0.35 [0.17, 0.70] | 2.8† |
| GluN2B | 1.5 [1.2, 2.0] | 0.8 [0.48, 1.3] | 2.0† | 0.46 [0.37, 0.56] | 0.14 [0.12, 0.17] | 3.3† |
| GluN2C | 0.84 [0.57, 1.2] | 0.29 [0.15, 0.55] | 3.2† | 0.31 [0.15, 0.62] | 0.08 [0.024, 0.25] | 4.6† |
| GluN2D | 0.63 [0.41, 0.95] | 0.17 [0.065, 0.43] | 3.9† | 0.15 [0.089, 0.24] | 0.016 [0.007, 0.038] | 8.9† |
-
*Glutamate EC50 values (in the presence of 10 μM glycine) and glycine EC50 values (in the presence of 30 μM glutamate) were obtained by least-squares fitting of data by the Hill equation. EC50 values are given as the mean with the 95% confidence interval determined from log(EC50). Data in the absence and presence of EU1794-4 were obtained from the same oocyte. Data are from 4 to 8 paired oocytes recordings from two independent experiments.
†indicates paired measurements with non-overlapping confidence intervals.
Table 5
Comparison of EU1794-27, EU1794-4, and EU1794-2 effects at GluN1/GluN2C NMDAR responses to sub-saturating agonist.
https://doi.org/10.7554/eLife.34711.012| GluN2C | Glu/Gly (µM) | Relative agonist Response* (% of maximal response) | Modulation by 10 µM† (% of control) |
|---|---|---|---|
| EU1794-27 | 100/30 1/0.3 | - 20 ± 1.6 | 190 ± 10% 480 ± 31%‡ |
| EU1794-4 | 100/30 1/0.3 0.3/0.09 | - 27.7 ± 3.3 2.8 ± 0.7 | 54 ± 1.6% 140 ± 12%‡ 660 ± 110%‡ |
| EU1794-2 | 100/30 0.6/0.2 | - 21.5 ± 6.8 | 16 ± 1.0% 43 ± 2.1%‡ |
-
The data presented are mean ±SEM.
*Reported average responses to sub-saturating agonist were normalized to a 100/30 µM glutamate/glycine response.
-
†The degree modulation is reported as a percent of the control response to sub-saturating agonist. Some of these data points correspond to those used to calculated EC50 values for each modulator in Table 1, Table 2 or Supplementary file 1. Data are mean ±SEM.
‡p<0.05 as compared to 100/30 µM glutamate/glycine response, determined by an unpaired t-test, n = 4–10 cells.
Table 6
The response to co-application of EU1794-2 and EU1794-27 suggest a common binding site.
https://doi.org/10.7554/eLife.34711.024| EU1794-2 IC50 (µM) [conf. int.]* | EU1794-27 EC50 (µM) [conf. int.]* | ||||||
|---|---|---|---|---|---|---|---|
| +EU1794-27 0 µM | +EU1794-27 3 µM | +EU1794-27 10 µM | +EU1794-27 20 µM | +EU1794-2 0 µM | +EU1794-2 1 µM | +EU1794-2 3 µM | |
| GluN2A | 0.60† [0.44, 0.82] | 2.5‡ [1.9, 3.1] | 3.6‡ [2.4, 4.8] | 8.0‡ [1.3, 15] | -§ | -§ | -§ |
| GluN2B | 1.2† [0.8, 1.9] | NR | 3.5‡ [2.1, 4.9] | 12 [~, 26] | 1.4† [1.2, 1.7] | 6.0‡ [4.6, 7.4] | 8.4 [~, 18] |
| GluN2C | 0.21† [0.18, 0.25] | 1.2‡ [0.91, 1.4] | 2.4‡ [1.8, 3.0] | 6.0‡ [4.1, 7.8] | 2.8† [2.5, 3.2] | 7.3‡ [5.9, 8.8] | 7.3 [2.1, 11.74] |
| GluN2D | 0.20† [0.17, 0.25] | 1.4‡ [1.2, 1.6] | 2.7‡ [2.3, 3.2] | 7.3‡* [4.6, 9.9] | 2.4† [1.8, 3.3] | 7.5‡ [5.6, 9.3] | 7.8 [1.1, 14] |
-
A five point concentration response curve was obtained for modulator effects on responses to maximally effective concentrations of glutamate and glycine (100/30 µM) for EU1794-2 co-administered with increasing concentrations of EU1794-27, and for EU1794-27 in increasing concentrations of EU1794-2.
*IC50 and EC50 values were obtained by least-squares fitting of data by the Hill equation. IC50 and EC50 values are given as the mean with the 95% confidence interval determined from log(IC50) or log(EC50). Data are from at least six oocytes evaluated from two independent experiments for the EU1794-2 IC50 determinations and from at least three oocytes evaluated from one experiment for the EU1794-27 EC50 determinations.
-
NR, Given the low potency for modulators at GluN2B, the EU1794-2 concentration-response curve with 3 µM EU1794-27 determination was not recorded.
† Data from Table 1 is included here for clarity.
-
‡indicates non-overlapping 95% confidence interval with the EU1794-2 IC50 without EU1794-27 or EU1794-27 EC50 without EU1794-2.
§EU1794-27 does not potentiate GluN2A responses to maximally effective concentrations of glutamate and glycine.
-
~indicates that the confidence interval reached the theoretical limit (EC50 = 0).
Table 7
Enantiomeric preference of EU1794-27.
https://doi.org/10.7554/eLife.34711.027| EC50 (µM) [conf. int.]* Maximal Modulation Extent (% of control) | ||||
|---|---|---|---|---|
| Compound | EU1794-27 | (-)-EU1794-27 | (+)-EU1794-27 | |
| GluN2A | 7.4 [5.3, 10]† 52 ± 7% | 5.6 [2.7, 12] 67 ± 5% | - | ‡ |
| GluN2B | 1.4 [1.2, 1.7]† 130 ± 3% | 2.8 [2.0, 3.8] 170 ± 10% | - | ‡ |
| GluN2C | 2.8 [2.5, 3.2]† 230 ± 10% | 5.1 [4.1, 6.4] 260 ± 24% | 7.1 [3.6, 14] 160 ± 6.2% | ‡ |
| GluN2D | 2.4 [1.8, 3.3]† 250 ± 8% | 8.2 [6.7, 9.9] 340 ± 21% | 7.4 [3.7, 15] 130 ± 4.7% | ‡ |
-
*EC50 values were obtained by least-squares fitting of data from individual experiments by the Hill equation. EC50 values are given as the mean with the 95% confidence interval determined from log(EC50); the maximal degree of modulation is given as mean ±SEM. Data are from 4 to 7 oocytes from at least two independent experiments. Data were not fitted (shown as -) if the response recorded at 30 µM of test compound did not differ by more than 15% from control.
†Data from Table 1 is included here for clarity.
-
‡indicates significant unpaired t-test between the percent modulation between 30 µM (-)-EU1794-27 and (+)-EU1794-27.
Key resources table
| Reagent type (species) or resource | Designation | Source or reference | Identifiers | Additional information |
|---|---|---|---|---|
| gene (Rattus norvegicus) | GluN1-1a | U11418 | ||
| gene (Rattus norvegicus) | GluN1-1b | U08263 | ||
| gene (Rattus norvegicus) | GluN2A | D13211 | ||
| gene (Rattus norvegicus) | GluN2B | U11419 | ||
| gene (Rattus norvegicus) | GluN2C | M91563 | ||
| gene (Rattus norvegicus) | GluN2D | L31611 | ||
| cell line (Xenopus laevis) | stage VI oocytes | Ecocyte Biosciences (Austin, TX); Xenopus 1 (Dexter, MI) | NA; #10004 | |
| cell line (Homo sapiens) | HEK293 | ATCC (Manassas, VA) | CRL-1573 | |
| commercial assay or kit | QuikChange kit | Agilent Technologies (Santa Clara, CA) | 200524 | |
| commercial assay or kit | mMessage mMachine SP6 or t7 | Ambion/ThermoFisher Scientific (Waltham, MA) | AM1340 or AM1344 | |
| chemical compound, drug | EU1794-4 | PMID: 26525866 | SMILES: CCOC(=O)C1 = C(NC(=O) CC2SC(=N)NC2 = O)SC2 = C1CCCC2 | |
| chemical compound, drug | EU1794-2 | PMID: 26525866 | SMILES: CCOC(=O)C1 = C(NC(=O) CC2SC(=N)NC2 = O)SC2 = C1CCC(C)C2 | |
| chemical compound, drug | EU1794-5 | this paper | SMILES: CC(C)OC(=O)C1 = C(NC(=O) CC2SC(=N)NC2 = O)SC2 = C1CCCC2 | See sumplemental information |
| chemical compound, drug | EU1794-19 | this paper | SMILES: CC(C)OC(=O)C1 = C (NC(=O)CC2SC(=N)NC2 = O) SC2 = C1CCC(C)C2 | See sumplemental information |
| chemical compound, drug | EU1794-25 | this paper | SMILES: CC1CCC2 = C(C1)SC(NC(=O) CC1SC(=N)NC1 = O)=C2C(=O) OC1 = CC = CC=C1 | See sumplemental information |
| chemical compound, drug | EU1794-27 | this paper | SMILES: CC(C)(C)OC(=O)C1 = C (NC(=O)CC2SC(=N)NC2 = O) SC2 = C1CCCC2 | See sumplemental information |
| chemical compound, drug | EU1794-29 | this paper | SMILES: CCCCOC(=O)C1 = C(NC(=O) CC2SC(=N)NC2 = O)SC2 = C1CCC(C)C2 | See sumplemental information |
| chemical compound, drug | βCD | Acros Organics or ChemCenter | 2-(hydroxypropyl)-β-cyclodextrin (CAS# 128446-35-5) | |
| chemical compound, drug | APV | Tocris (Minneapolis, MN) | (2)-amino-5-phosphonovaleric acid (CAS# 76326-31-3) | |
| chemical compound, drug | 7-CKA | Tocris (Minneapolis, MN) | 7-chlorokynurenic acid (CAS# 18000-24-3) | |
| chemical compound, drug | MTSEA | TRC Canada (Toronto, ON) | Methanethiosulfonate ethylammonium (CAS# 16599-33-0) | |
| chemical compound, drug | CIQ | Tocris (Minneapolis, MN) | CAS# 486427-17-2 | |
| chemical compound, drug | Ifenprodil | Tocris (Minneapolis, MN) | CAS# 23210-56-2 | |
| chemical compound, drug | PYD-106 | PMID: 25205677 | ||
| chemical compound, drug | TCN-201 | Tocris (Minneapolis, MN) | CAS# 852918-02-6 | |
| chemical compound, drug | GNE-6901 | PMID: 26875626; Genentech (San Francisco, CA) | generously provided by Jesse Hanson and Genentech | |
| chemical compound, drug | GNE-0723 | PMID: 26919761; Genentech (San Francisco, CA) | generously provided by Jesse Hanson and Genentech | |
| chemical compound, drug | DQP-1105 | Tocris (Minneapolis, MN) | CAS# 380560-89-4 | |
| chemical compound, drug | QNZ-46 | Tocris (Minneapolis, MN) | CAS# 1237744-13-6 | |
| software, algorithm | Perszyk2018_ sim_Markov_ Modulator Competition | this paper | Matlab code, see sumplemental information | |
| software, algorithm | Axopatch and Clampfit | Molecular Devices (San Jose, CA) | ||
| software, algorithm | Easy Oocyte | Custom written Software (Emory University, Atlanta, GA) | ||
| software, algorithm | Prism | GraphPad (La Jolla, CA) | ||
| software, algorithm | Matlab | Mathworks (Natick, MA) |
Additional files
-
Supplementary file 1
Saturating and sub-saturating actions of EU1794-2.
- https://doi.org/10.7554/eLife.34711.053
-
Supplementary file 2
Enantiomeric actions of EU1794-4.
- https://doi.org/10.7554/eLife.34711.054
-
Transparent reporting form
- https://doi.org/10.7554/eLife.34711.055
Download links
A two-part list of links to download the article, or parts of the article, in various formats.
Downloads (link to download the article as PDF)
Open citations (links to open the citations from this article in various online reference manager services)
Cite this article (links to download the citations from this article in formats compatible with various reference manager tools)
An NMDAR positive and negative allosteric modulator series share a binding site and are interconverted by methyl groups
eLife 7:e34711.
https://doi.org/10.7554/eLife.34711


