Kinetics of HIV-1 capsid uncoating revealed by single-molecule analysis
- UNSW, Australia
- The Kirby Institute, Australia
- St. Vincent’s Institute of Medical Research, Australia
- Bio21 Molecular Science and Biotechnology Institute, University of Melbourne, Australia
Figures
Figure 1 with 1 supplement
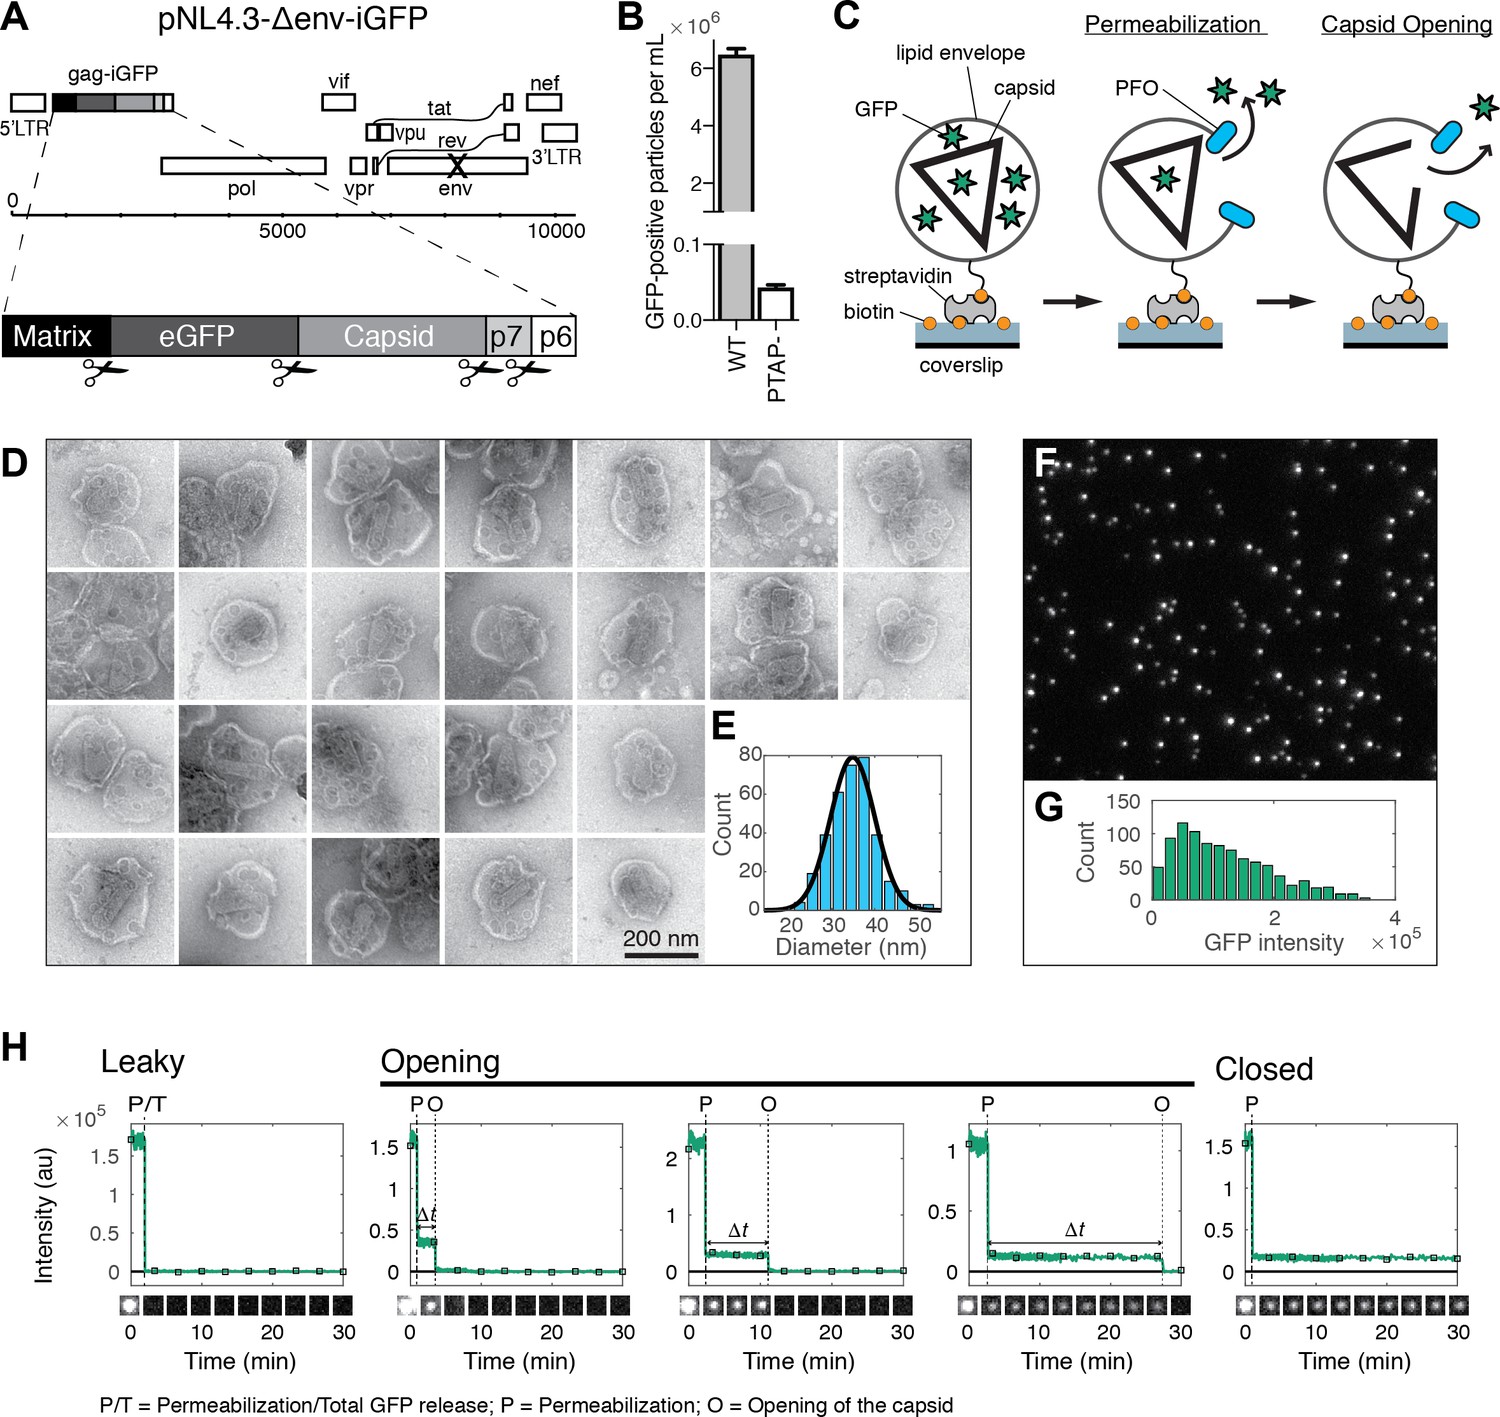
HIV capsid opening assay.
(A) Map of the proviral DNA contained in the vector pNL4.3-iGFP-ΔEnv. Viral particles with Gag-internal GFP (released as a solution phase marker by proteolysis during maturation) were generated by transfection of HEK293T cells with pNL4.3-iGFP-ΔEnv and psPAX2 in a molar ratio of 1.4:1. (B) GFP-positive particles released from HEK293T cells transfected with either wild type or PTAP motif mutants of pNL4.3-iGFP-ΔEnv and psPAX2. (C) Schematic diagram of the TIRF assay to measure capsid opening. (D) Gallery of negative staining TEM images of viral particles incubated with the pore-forming protein PFO. (E) Distribution of PFO pore diameters (34.8 ± 5.2 nm, mean ±standard deviation, N = 347). (F) TIRF image of immobilized viral particles in a 450 × 370 pixel region of the field of view. (G) Distribution of GFP intensity for each particle in the field of view. (H) Fluorescence intensity traces of viral particles with leaky, opening and closed capsids showing the release of GFP contained by the envelope at the point of envelope permeabilization (‘P’) with PFO and release of encapsidated GFP after spontaneous opening (‘O’) of the HIV capsid. The capsid opening time (Δt) is the time from permeabilization to capsid opening. The black squares indicate the frames at which the snapshots shown below each trace were taken. The TIRF movie was recorded with an imaging frequency of 1 frame s−1.
Figure 1—figure supplement 1
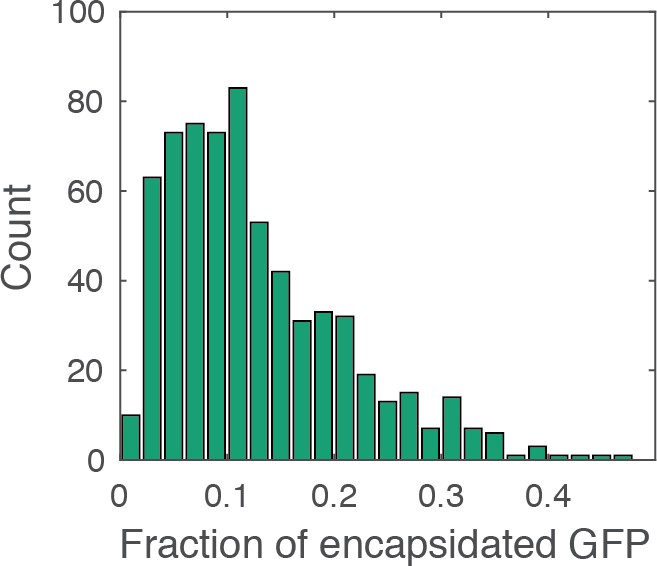
Histogram of the fraction of encapsidated GFP.
The fraction of encapsidated GFP was calculated as the ratio of the GFP intensity associated with the closed capsid (i.e. the mean intensity in the period after membrane permeabilization and before core opening) to the total GFP intensity associated with the viral particle (i.e. the mean intensity before membrane permeabilization). The histogram contains combined data from a total of four repeats using two different viral preparations. The mean fraction of encapsidated GFP is ~13%, similar to the ratio of the volume inside the capsid to the total volume of the viral particle (16%), which was estimated on the basis of the following considerations. Internal volume of the viral particle: The internal virus volume (i.e. excluding the viral membrane and matrix protein layer) has been estimated by cryo-electron tomography (cET) of HIV particles, giving an average value of [from Figure 4, (de Marco et al., 2012)]; this volume corresponds to an internal diameter of 109 nm. Volume of the viral core: The volume of the core was calculated as the volume of an ellipsoid given by , where is the length of the cone, is the diameter of the broad end. We assumed the following dimensions for the capsid including the CA shell: (i.e. the internal diameter of the virion) and (Briggs et al., 2006). The internal volume of the capsid was calculated after subtracting twice the thickness of the CA lattice (2 × 5 nm) from the values for and , giving . The fraction of the internal volume of the capsid relative to the total internal volume of the viral particle is then given by .
Figure 2
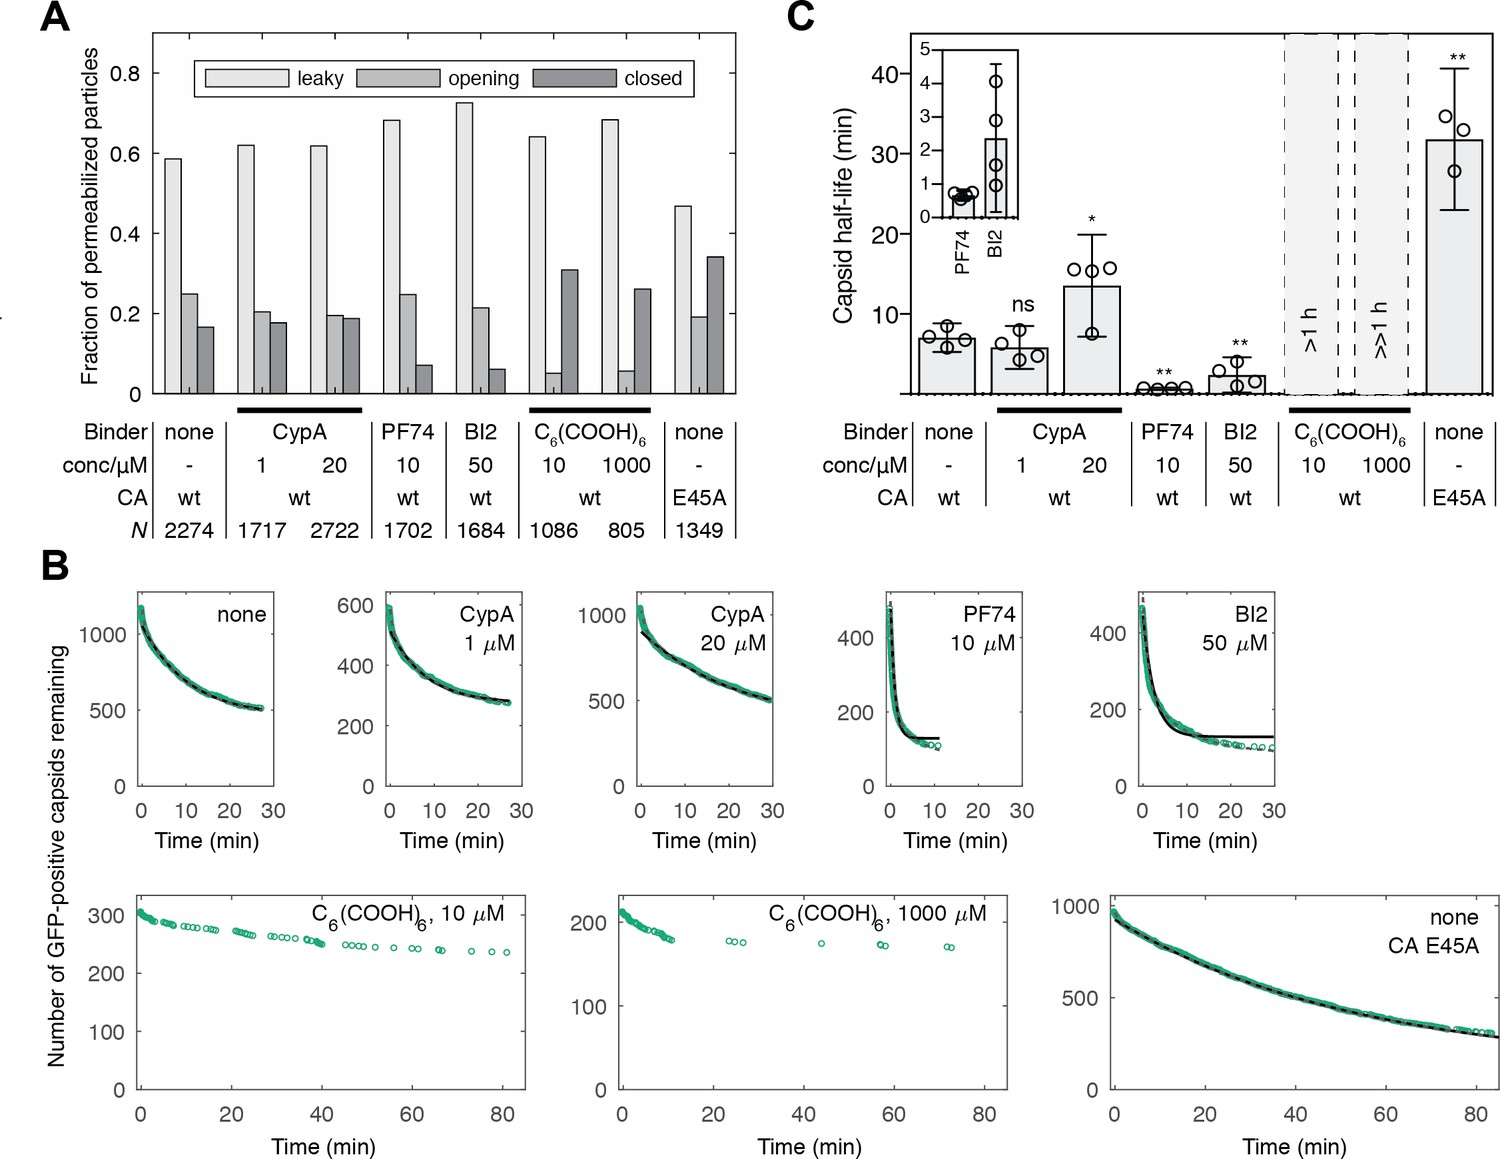
Kinetics of capsid opening.
(A) Bar chart showing the fraction of capsids classified as ‘leaky’, ‘opening’ and ‘closed’ that are present 30 min after addition of PFO to permeabilize the envelope, recorded in the absence and presence of capsid binders. (B) Survival curves of capsids with encapsidated GFP after permeabilization with mono- (black line) and bi-exponential (dotted grey line) fit. The parameter values of the fits are provided in Figure 2—source data 1 and 2. The data in panels A and B was combined from multiple measurements (total number of repeats/number of viral preparations): No binder (3/2); CypA - 1 μM (4/2); CypA - 20 μM (5/2); PF74 - 10 μM (4/2); BI2 - 50 μM (5/3); hexacarboxybenzene - 10 μM (3/2); hexacarboxybenzene - 1000 μM (2/1); CA E45A (5/3). (C) Half-lives of intact capsids determined by fitting survival curves from individual repeats with a mono-exponential decay function. The error bars represent 95% confidence intervals; unpaired t-test with Welch’s correction, p=0.2797 (1 μM CypA), p=0.0403 (20 μM CypA), p=0.0403 (20 μM CypA), p=0.0014 (10 μM PF74), p=0.0022 (50 μM BI2), p=0.0043 (CA E45A). The half-lives of capsids in the presence of hexacarboxybenze (C6(COOH)6) could not be determined with certainty and were estimated to be >1 hr.
-
Figure 2—source data 1
Table of coefficient values from a mono-exponential fit of the survival curves in Figure 2B.
- https://doi.org/10.7554/eLife.34772.006
-
Figure 2—source data 2
Table of coefficient values from a bi-exponential fit of the survival curves in Figure 2B.
- https://doi.org/10.7554/eLife.34772.007
Figure 3 with 3 supplements
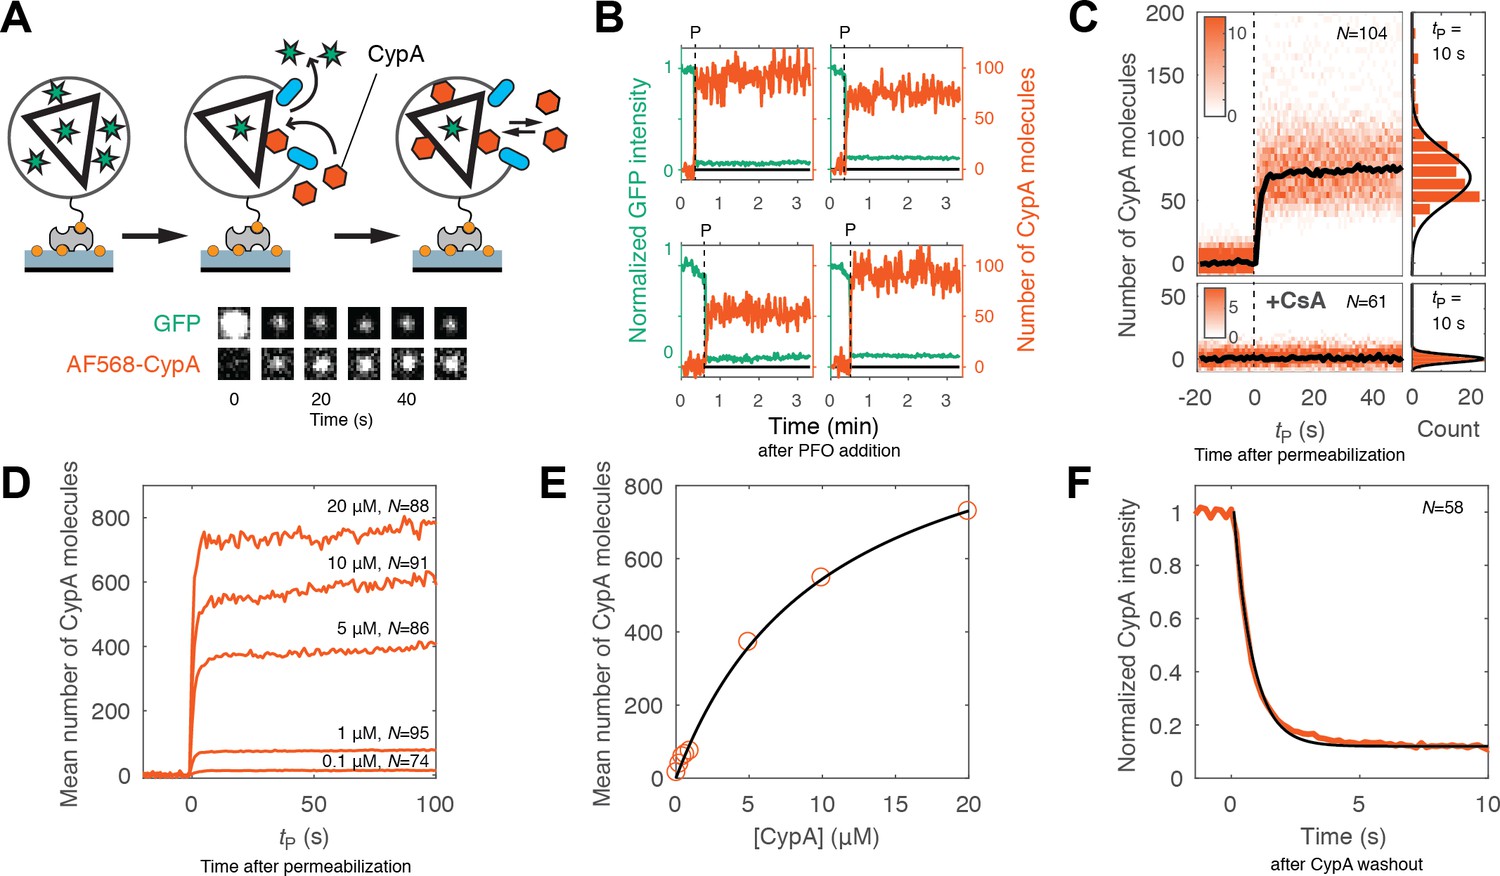
Kinetics of CypA binding to the intact capsid.
(A) Schematic diagram of the TIRF assay for measuring protein binding to the intact capsid and snapshots of the GFP signal and AF568-CypA signal of a selected viral particle at different times. (B) Example traces of CypA binding (vermillion) to individual closed capsids that retain GFP (green) after permeabilization of the viral envelope (note the residual GFP signal after the large drop). The concentration of CypA was 1 μM. (C) CypA binding traces (vermillion) to all closed capsids in the field of view aligned with respect to the time of envelope permeabilization (tP = 0). The bold black line represents the median binding trace. CypA binding was recorded in the absence (top) and presence (bottom) of cyclosporine A (CsA). The histograms at the right show the distribution of intensities after binding equilibrium is reached (at tP = 10 s). Gaussian fitting gave a mean ±standard deviation of 73 ± 20 and 1.6 ± 2.9 in the presence and absence of CsA, respectively. Representative data from four (−CsA) and two (+CsA) independent experiments using different viral preparations. (D) Median CypA binding traces recorded at CypA concentrations ranging from 0.1 to 20 μM as indicated above the corresponding trace. Binding experiments with concentrations above 1 uM were carried out with a mixture of unlabeled and labeled CypA, whereby the concentration of the labeled CypA was kept at 1 μM. (E) Median number of CypA molecules bound at equilibrium as a function of CypA concentration (vermillion circles) and fit of an equilibrium binding model (black line). The fit gave the following estimates for the interaction: KD = 10 μM; number of CypA-binding sites on the intact capsid ~1000. See Figure 3—figure supplement 2 for an independent repeat experiment. (F) Mean CypA intensity measured at closed capsids after wash-out of CypA from the flow channel at t = 0. The black line represents a fit of the data with an exponential decay function.
Figure 3—figure supplement 1
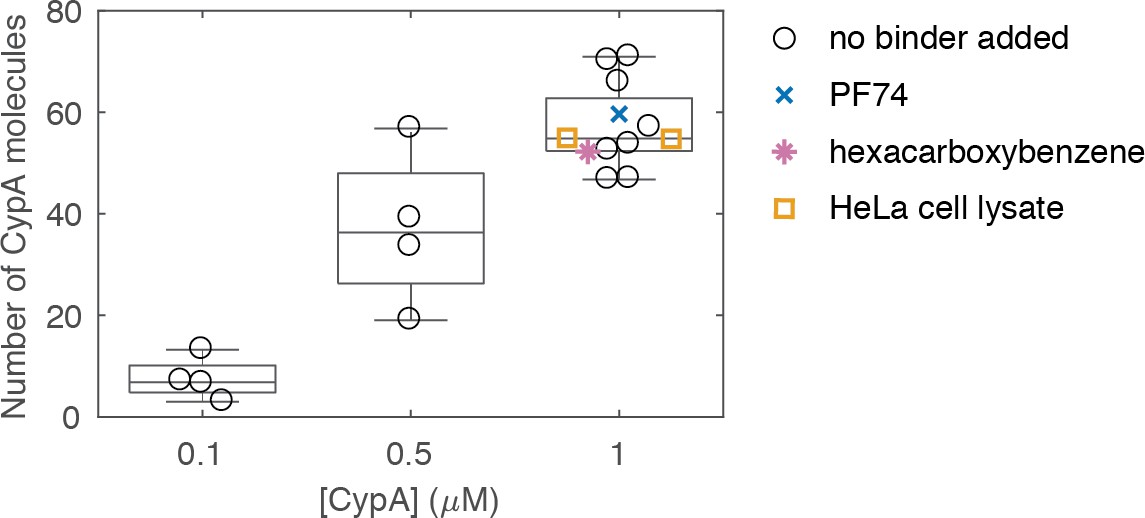
Variation in the median number of molecules bound at equilibrium per closed capsid measured in independent experiments at different CypA concentrations.
Measurements with 1 μM CypA were carried out in the absence and presence of small molecules (PF74 or hexacarboxybenzene) or HeLa cell lysate. Each symbol represents an independent experiment. Experiments were recorded at different times with several different batches of viral particles and on two different TIRF microscopes.
Figure 3—figure supplement 2
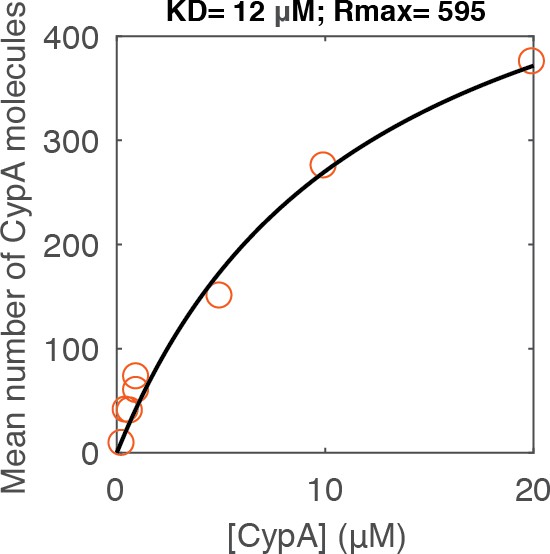
Equilibrium binding analysis of CypA binding to capsid.
Median number of CypA molecules bound to closed capsids at equilibrium as a function of CypA concentration (vermillion circles) and fit of an equilibrium binding model (black line). The fit gave the following estimates for the interaction: KD = 12 μM; number of CypA-binding sites on the intact capsid ~600. These data were recorded in a repeat experiment for the data shown in Figure 3E but with a different batch of viral particles and on a different TIRF microscope.
Figure 3—figure supplement 3
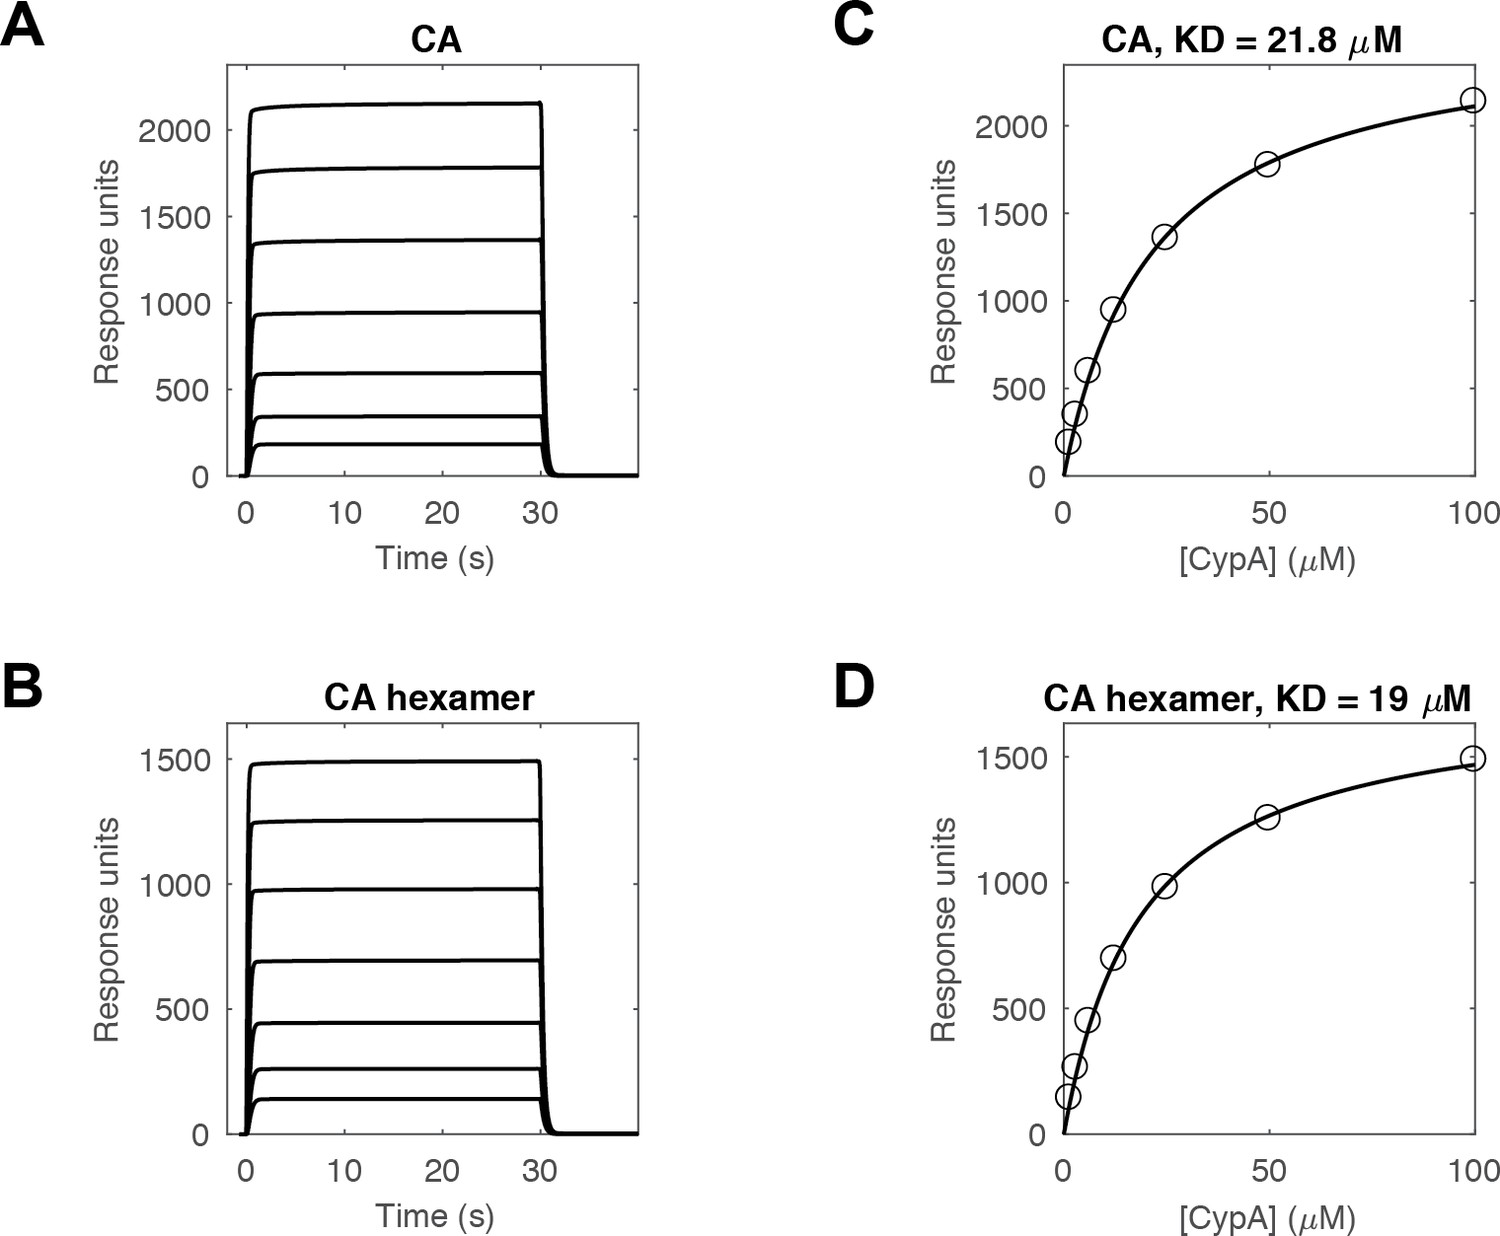
SPR measurements of the CypA-CA interaction.
(A, B) SPR traces of CypA binding and dissociation on surfaces modified with (A) CA K158C (reacted with a maleimide derivative of biotin) or (B) cross-linked CA hexamers (reacted with an NHS ester derivative of biotin) recorded at 1.6, 3.1, 6.3, 12.5, 25, 50 and 100 μM CypA (curves from bottom to top). (C, D) Response at equilibrium as a function of CypA concentration and fit of a binding model to the data (black line) to obtain the dissociation constant of the CypA interaction with monomeric (C, KD = 21.8 μM) and hexameric (D, KD = 19 μM) CA protein.
Figure 4
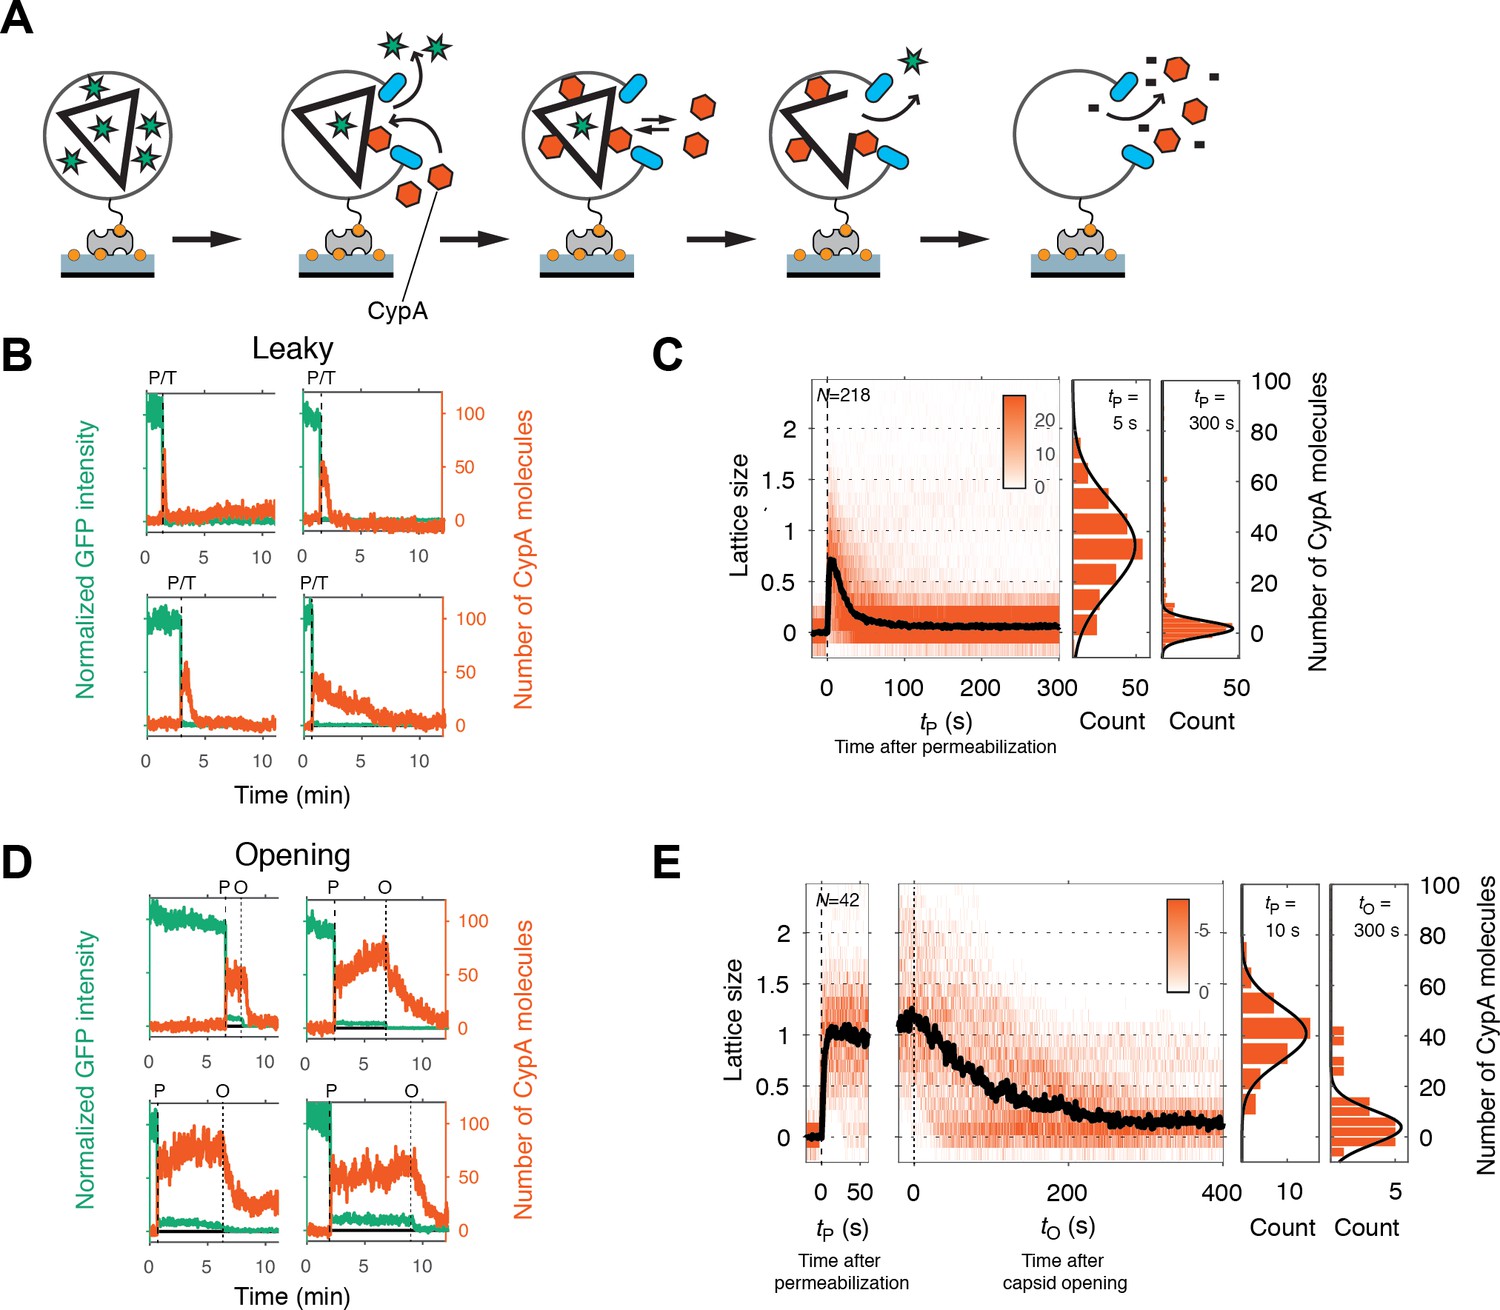
Painting the capsid with CypA to visualize lattice disassembly kinetics.
(A) Schematic diagram of the TIRF CypA paint assay. (B) Example traces of AF568-CypA binding (vermillion) to individual leaky capsids that do not retain GFP (green) after permeabilization of the viral envelope. The concentration of CypA was 0.7 μM. (C) Heatmap of CypA binding traces to all leaky capsids in the field of view aligned with respect to the time of envelope permeabilization (tP = 0). The bold black line represents the median CypA trace. The histograms at the right show the distribution of intensities at tP = 5 s and 300 s. (D) Example traces of AF568-CypA binding (vermillion) to individual capsids that initially retain a fraction of the GFP signal (green) after permeabilization of the viral envelope, and then open to release this residual GFP signal. The concentration of CypA was 0.7 μM. (E) Heatmap of CypA intensity traces of all capsids in the field of view that undergo opening. The traces in the left panel are aligned with respect to the time of envelope permeabilization (tP = 0), while the traces in the right panel are aligned with respect to capsid opening. The bold black line represents the median CypA trace. The histograms at the right show the distribution of intensities after binding equilibrium is reached (at tP = 10 s) and at the end of lattice disassembly. Representative data from three independent experiments using different viral preparations.
Figure 5
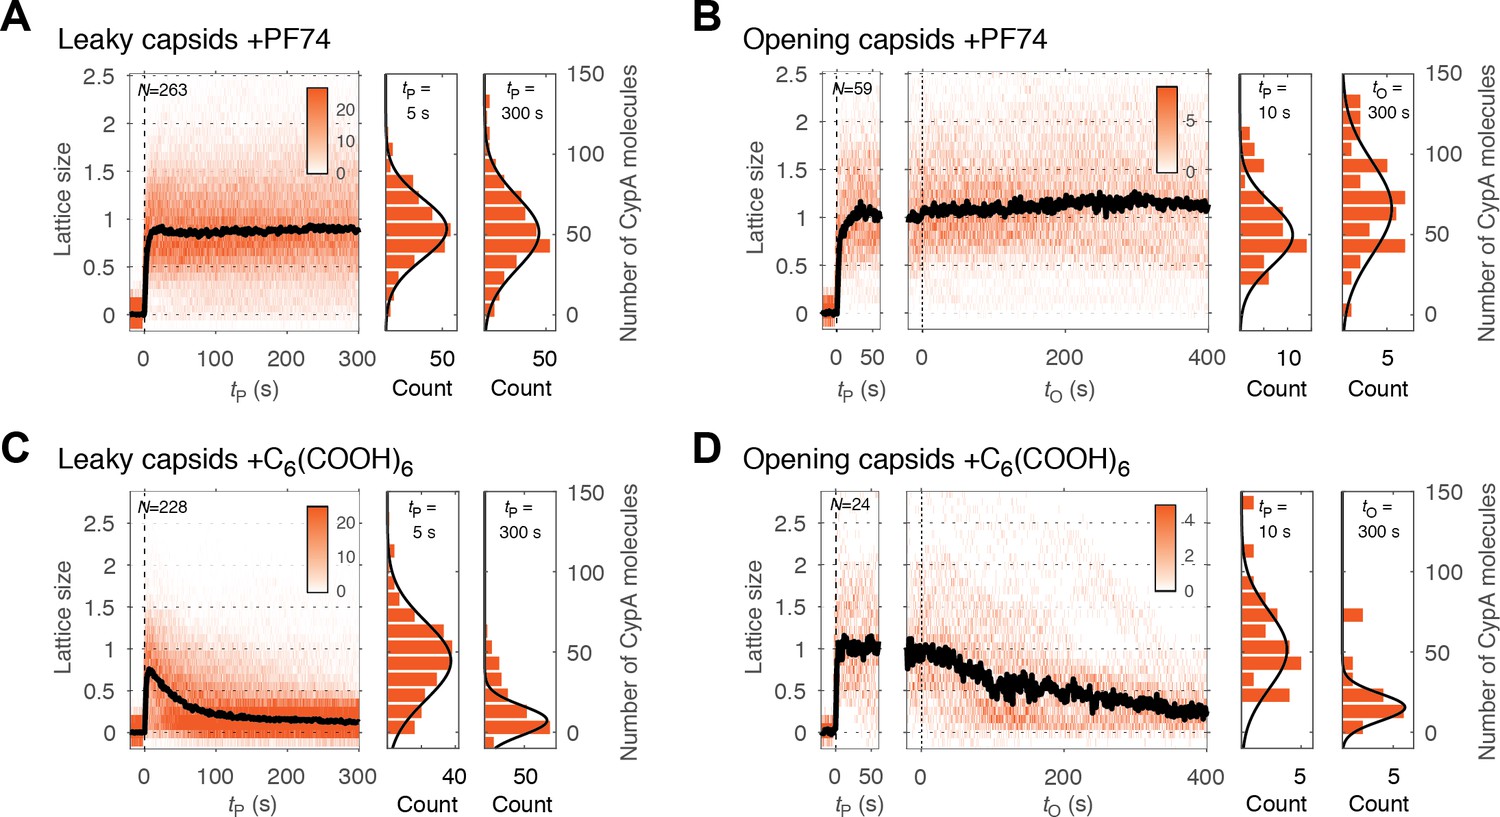
PF74 but not hexacarboxybenzene stabilizes the CA lattice after capsid opening.
(A, C) Heatmaps of CypA binding traces to all leaky capsids in the field of view aligned with respect to the time of envelope permeabilization (tP = 0) in the presence of PF74 (A) or hexacarboxybenzene (C). The bold black line represents the median CypA trace. (B, D) Heatmaps of CypA intensity traces of all capsids in the field of view that undergo opening in the presence of PF74 (B) or hexacarboxybenzene (D). The traces in the left panel are aligned with respect to the time of envelope permeabilization (tP = 0), while the traces in the right panel are aligned with respect to capsid opening (tO = 0). The bold black line represents the median CypA trace. Heatmaps are representative of data acquired in two independent experiments using different viral preparations.
Figure 6

Capsid opening and lattice disassembly measured in the presence of HeLa cell lysate.
(A) Survival curve of GFP-positive capsids in the presence of HeLa cell lysate. The half-life determined from the curve is 48 min. Combined data from a total of five repeats using two different viral preparations. (B) Half-life of intact capsids determined by fitting survival curves from individual repeats with a mono-exponential decay function. The error bars represent 95% confidence intervals; unpaired t-test with Welch’s correction, p=0.0184. (C) Example traces of AF568-CypA binding (vermillion) in the presence of HeLa cell lysate to individual capsids (green) after permeabilization of the viral envelope. The concentration of CypA was 1 μM. (D) Heatmap of CypA binding traces to all leaky capsids in the field of view aligned with respect to the time of envelope permeabilization. The bold black line represents the median CypA trace. (E) Heatmap of CypA intensity traces of all capsids in the field of view that undergo opening. The traces in the left panel are aligned with respect to the time of envelope permeabilization, while the traces in the right panel are aligned with respect to capsid opening. The bold black line represents the median CypA trace.
-
Figure 6—source data 1
Table of coefficient values from a mono-exponential fit of the survival curves in Figure 6A.
- https://doi.org/10.7554/eLife.34772.015
-
Figure 6—source data 2
Table of coefficient values from a bi-exponential fit of the survival curves in Figure 6A.
- https://doi.org/10.7554/eLife.34772.016
Figure 7
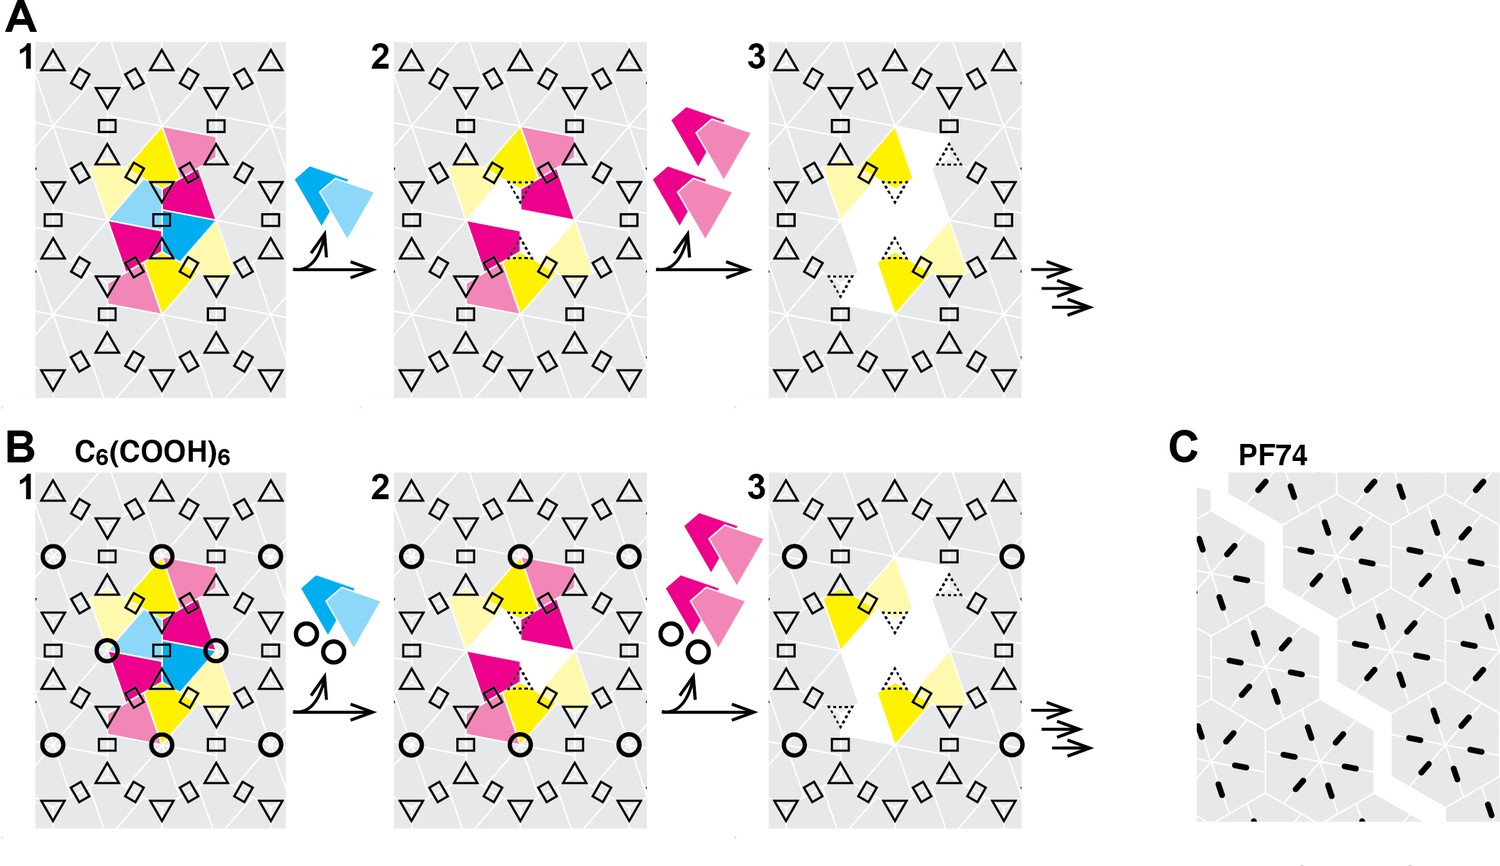
Schematic of the hexameric CA lattice and proposed disassembly pathway.
(A) Intact CA lattice with dimeric and trimeric interfaces between hexamers highlighted as rectangles and triangles, respectively. Removal of a CA subunit (dark cyan) from a hexamer in the lattice leads to destabilization and dissociation of its dimer partner (light cyan) in the neighboring hexamer; GFP release may occur as early as at this stage. The defect propagates by dissociation of subunits (dark magenta) that have now lost contacts within the hexamer and at the trimer interface, followed by (or concomitant with) loss of their corresponding dimer partners (light magenta). Disassembly continues in all directions from the initial defect with increasing rate while the length of the defect edge grows. (B) Binding of hexacarboxybenzene (circles) to the central pore stabilizes the hexamer, reducing the probability of dissociation of the first CA subunit(s). Once the defect is created, the stabilizing effect of hexacarboxybenzene is insufficient to prevent disassembly via the pathway described in A. (C) Binding of PF74 (black lines) may lead to capsid rupture instead of loss of CA subunits, whereby PF74 molecules bound at the interfaces between CA subunit act as a glue to prevent dissociation of CA subunits from hexamers adjacent to the defect.
Tables
Key resources table
| Reagent type (species) or resource | Designation | Source or reference | Identifiers | Additional information |
|---|---|---|---|---|
| Recombinant DNA reagent | pNL4.3-iGFP-ΔEnv | DOI: 10.1371/journal. ppat.1002762 | ||
| Recombinant DNA reagent | pNL4.3-iGFP-CA E45A-ΔEnv | This paper | Proviral construct generated by subcloning a fragment with the CA E45A mutation into pNL4.3-iGFP-ΔEnv using the XbaI-SbfI restriction sites. | |
| Recombinant DNA reagent | psPAX2 | NIH AIDS Reagent Program | #11348 | |
| Cell line (human) | HEK293T | ATCC | ATCC CRL-3216 | |
| Cell line (human) | HeLa | ATCC | ATCC CCL-2 | |
| Chemical compound, drug | PF74 | Sigma Aldrich | SML0835 | |
| Chemical compound, drug | BI2 | Enamine | Z1982491200 |
Additional files
-
Transparent reporting form
- https://doi.org/10.7554/eLife.34772.018
Download links
A two-part list of links to download the article, or parts of the article, in various formats.
Downloads (link to download the article as PDF)
Open citations (links to open the citations from this article in various online reference manager services)
Cite this article (links to download the citations from this article in formats compatible with various reference manager tools)
Kinetics of HIV-1 capsid uncoating revealed by single-molecule analysis
eLife 7:e34772.
https://doi.org/10.7554/eLife.34772


