Introgression of regulatory alleles and a missense coding mutation drive plumage pattern diversity in the rock pigeon
- University of Utah, United States
- University of Texas, United States
- University of Illinois Urbana-Champaign, United States
Figures
Figure 1 with 4 supplements
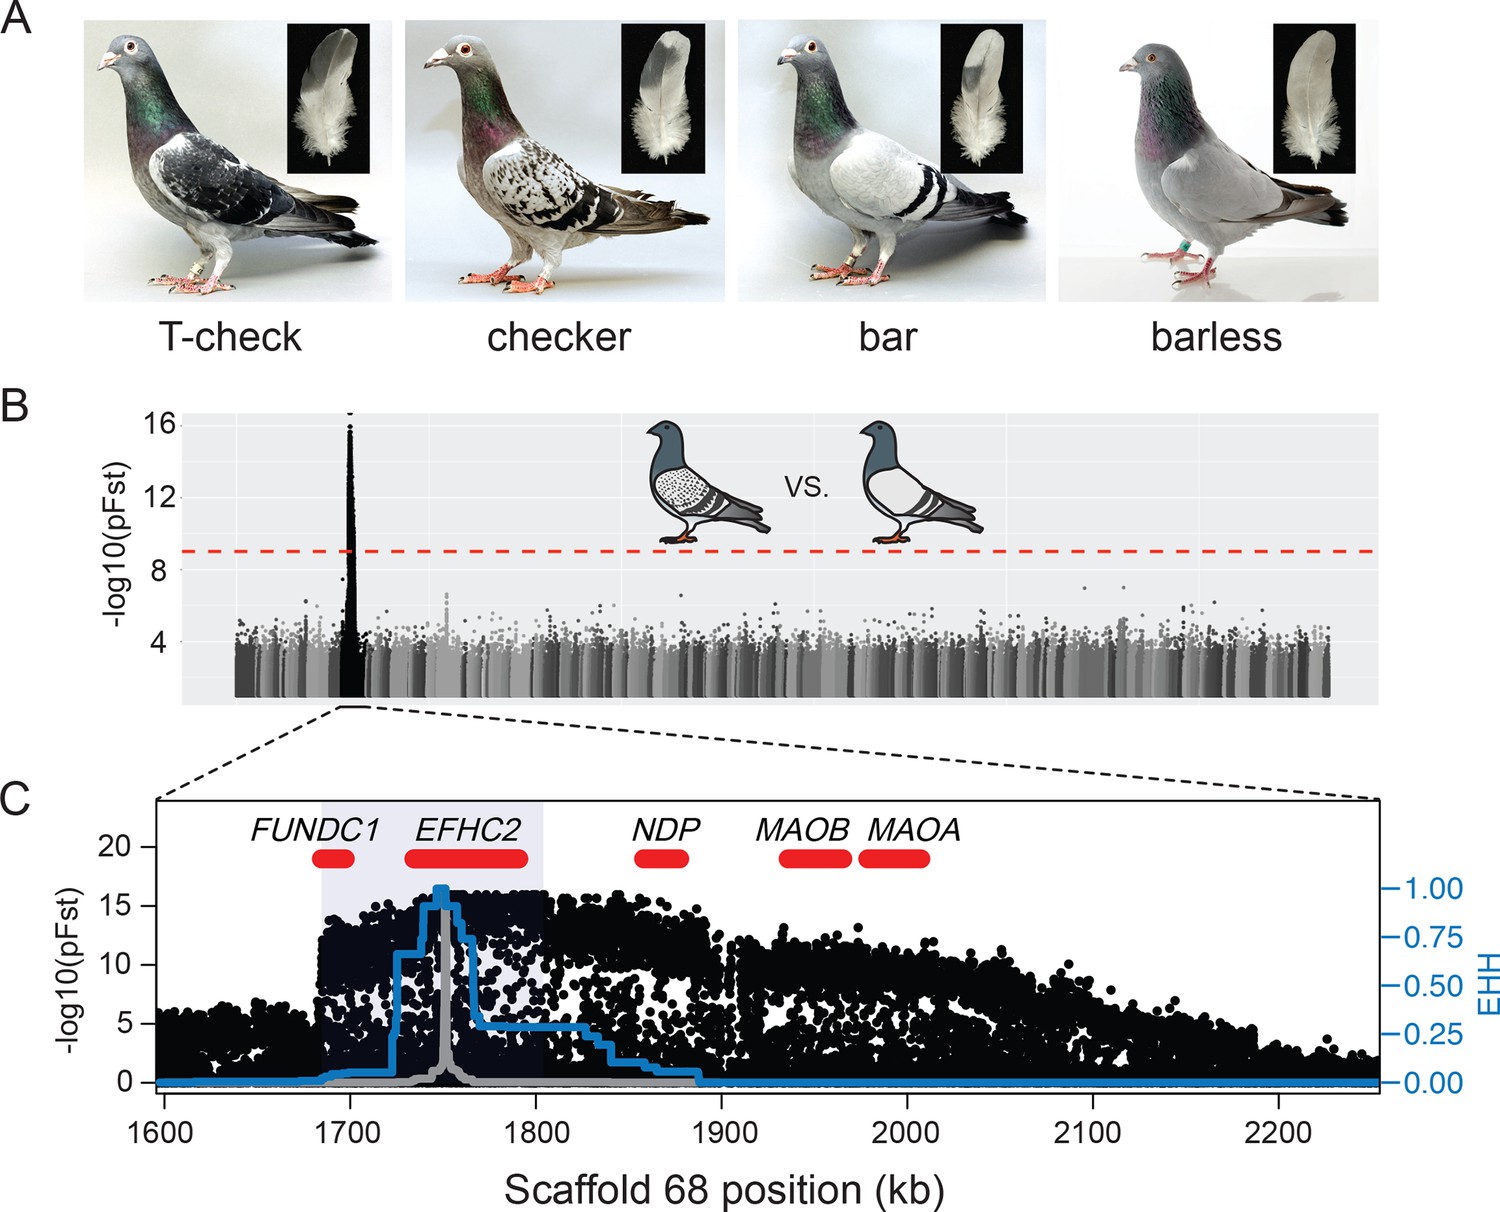
A single genomic region is associated with rock pigeon (C. livia) wing pigmentation pattern.
(A) Four classical wing pattern pigmentation phenotypes, shown in decreasing order of genetic dominance and melanism (left to right): T-check, checker, bar, and barless. Photos courtesy of the Genetics Science Learning Center (http://learn.genetics.utah.edu/content/pigeons). (B) Whole-genome pFst comparisons between the genomes of bar (n = 17) and checker (n = 24) pigeons. Dashed red line marks the genome-wide significance threshold (9.72e-10). (C) Detail of pFst peak shows region of high differentiation on Scaffold 68. Five genes within the region are shown in red. Blue shading marks the location of the smallest shared haplotype common to all checker and T-check birds. Haplotype homozygosity in the candidate region extends further for checker and T-check birds (blue trace) than for bar birds (gray), a signature of positive selection for the derived alleles. Extended haplotype homozygosity (EHH) was measured from focal position 1,751,072 following the method of Sabeti et al. (2007).
Figure 1—figure supplement 1
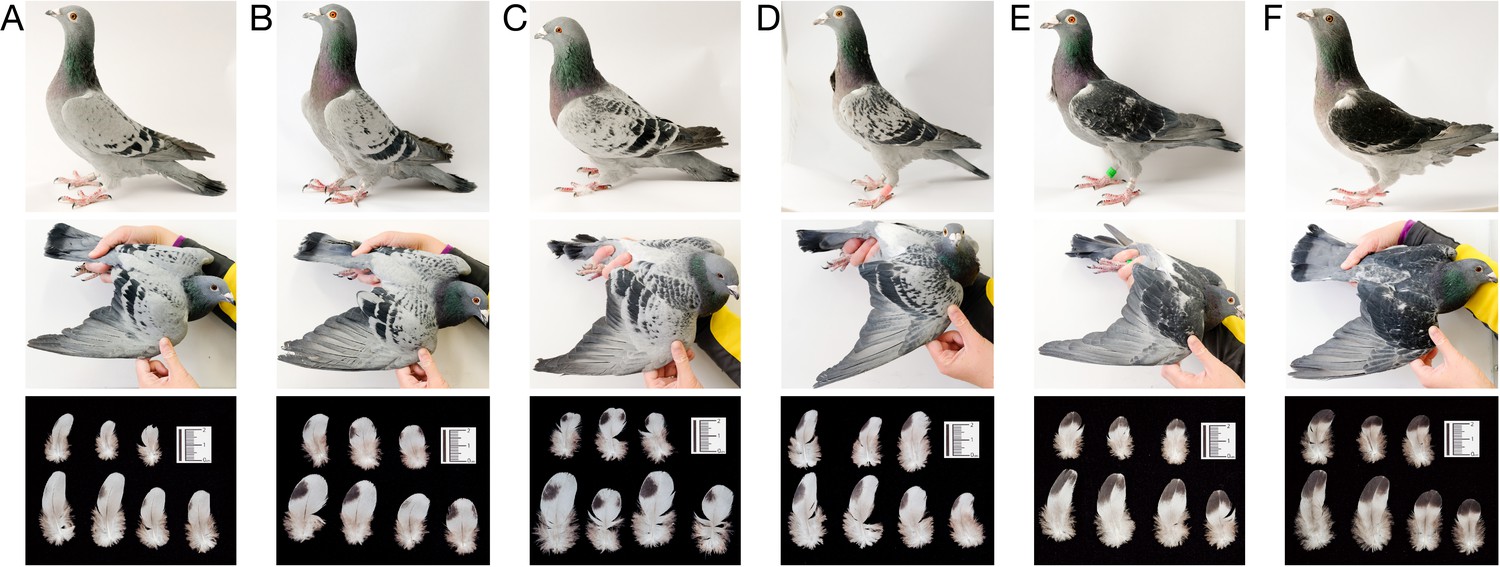
Variation in wing shield color pattern among pigeons with checker alleles in the Scaffold 68 candidate region.
(A–F) Representative birds are displayed in a gradient from least (A) to most (F) pigmented. Top row: birds with wings folded at their sides in left lateral view. Middle row: right wing is extended for more complete view of plumage pigmentation. Bottom row: individual feathers from wing shields. Images were adjusted for exposure, white balance, and clarity using the Adobe Camera Raw plugin for Adobe Photoshop CC 2017 (Adobe Systems, San Jose, CA). Scale bars in bottom row were inserted digitally.
Figure 1—figure supplement 2

Whole genome pFst comparisons to identify a candidate genomic region differentiated between birds with different wing pattern phenotypes.
(A) Whole genome pFst comparing 32 bar and 27 checker and T-check birds. (B) Whole genome pFst comparing 32 bar and nine barless birds.
Figure 1—figure supplement 3
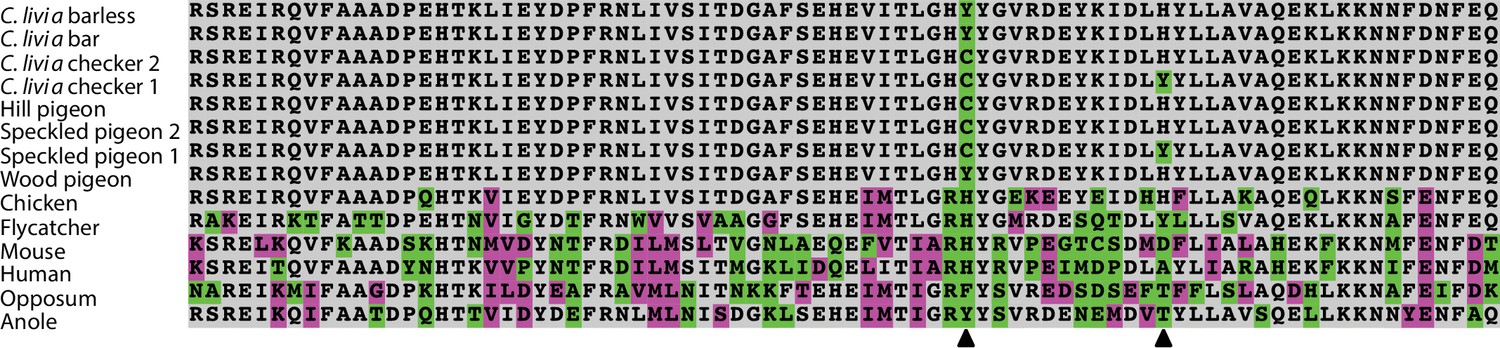
EFHC2 amino acid sequences of pigeons and other amniotes (residues 525–604).
Variable amino acid residues are marked in magenta (similar residues) and green (different residues). Checker C. livia, C. rupestris, and C. guinea share 572C while bar C. livia are fixed for 572Y (left arrowhead). Checker C. livia and C. guinea are polymorphic for 584 hr/Y (right arrowhead).
Figure 1—figure supplement 4
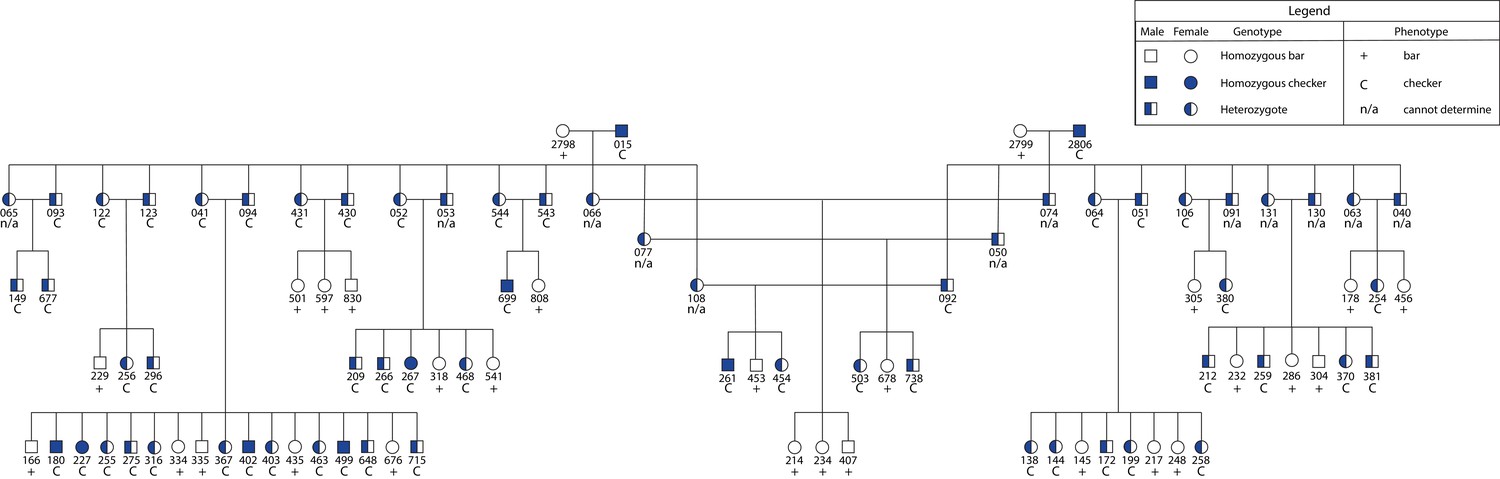
C locus genotypes segregate with phenotype in an F2 intercross.
Pedigree depicts an intercross with four founders that segregates bar and checker in the F2 generation. Squares (male) and circles (female) are color-coded for genotype (see legend). Phenotype is reported underneath the symbol for each individual (see legend). Numbers correspond to individual identifiers for each bird.
Figure 2 with 1 supplement
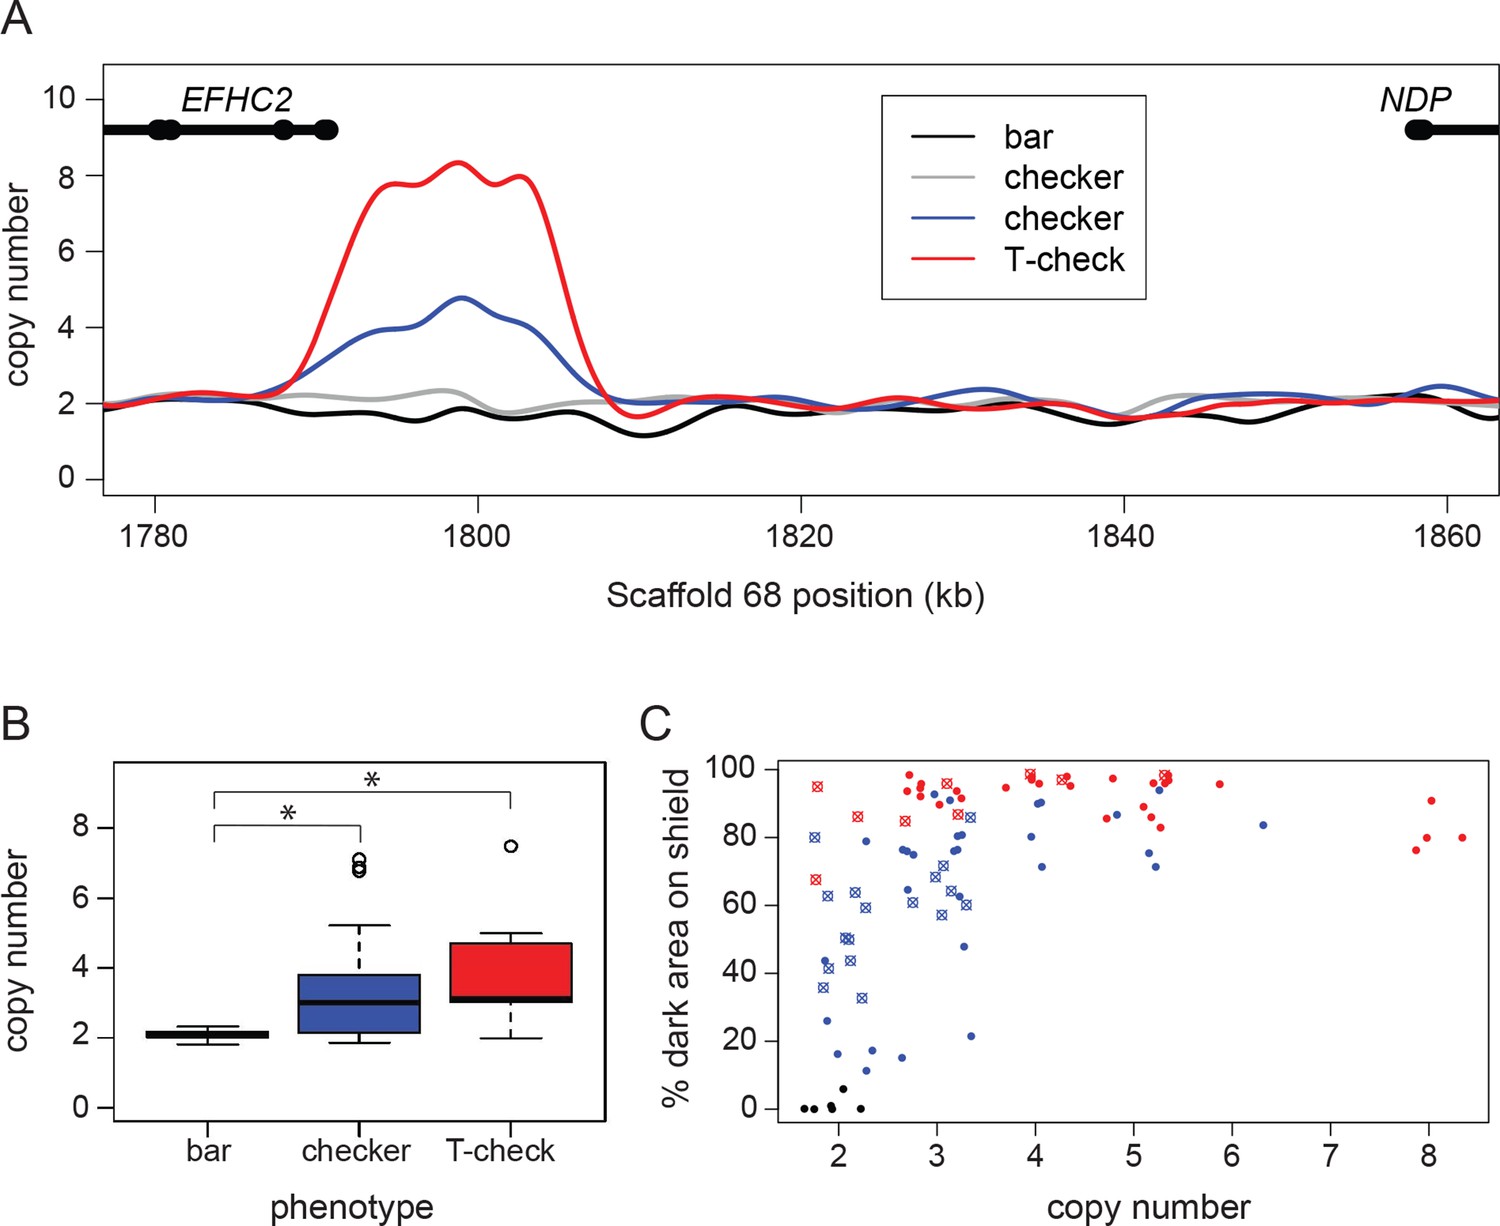
A copy number variant (CNV) in the candidate region is associated with T-check and checker phenotypes.
(A) Normalized read depths from resequenced birds are plotted in the candidate region between EFHC2 and NDP on Scaffold 68. Thickened portions of gene models represent exons and thin portions are introns. Representative individual read depth traces are shown for the following: black for bar C. livia, grey for checker C. livia individuals without additional copies of the CNV, blue for checker C. livia individuals with additional copies of the CNV region, red for T-check C. livia. (B) CNV quantification for 94 birds (20 bar, 56 checker, and 18 T-check). Checker and T-check phenotypes (as reported by breeders) were associated with increased copy numbers (p=2.1e-05). (C) CNV and phenotype quantification for an additional 84 birds, including 26 feral pigeons. Increased copy number was associated with an increase in dark area on the wing shield (r2 = 0.46, linear regression). Points are colored by reported phenotype and origin: bar, black; checker, blue; T-check, red; domestic breeds, filled circle points; ferals, cross points.
-
Figure 2—source data 1
Taqman copy number assay results represented in Figure 2B.
- https://doi.org/10.7554/eLife.34803.010
-
Figure 2—source data 2
Taqman copy number assay and phenotype quantification results represented in Figure 2C.
- https://doi.org/10.7554/eLife.34803.011
Figure 2—figure supplement 1
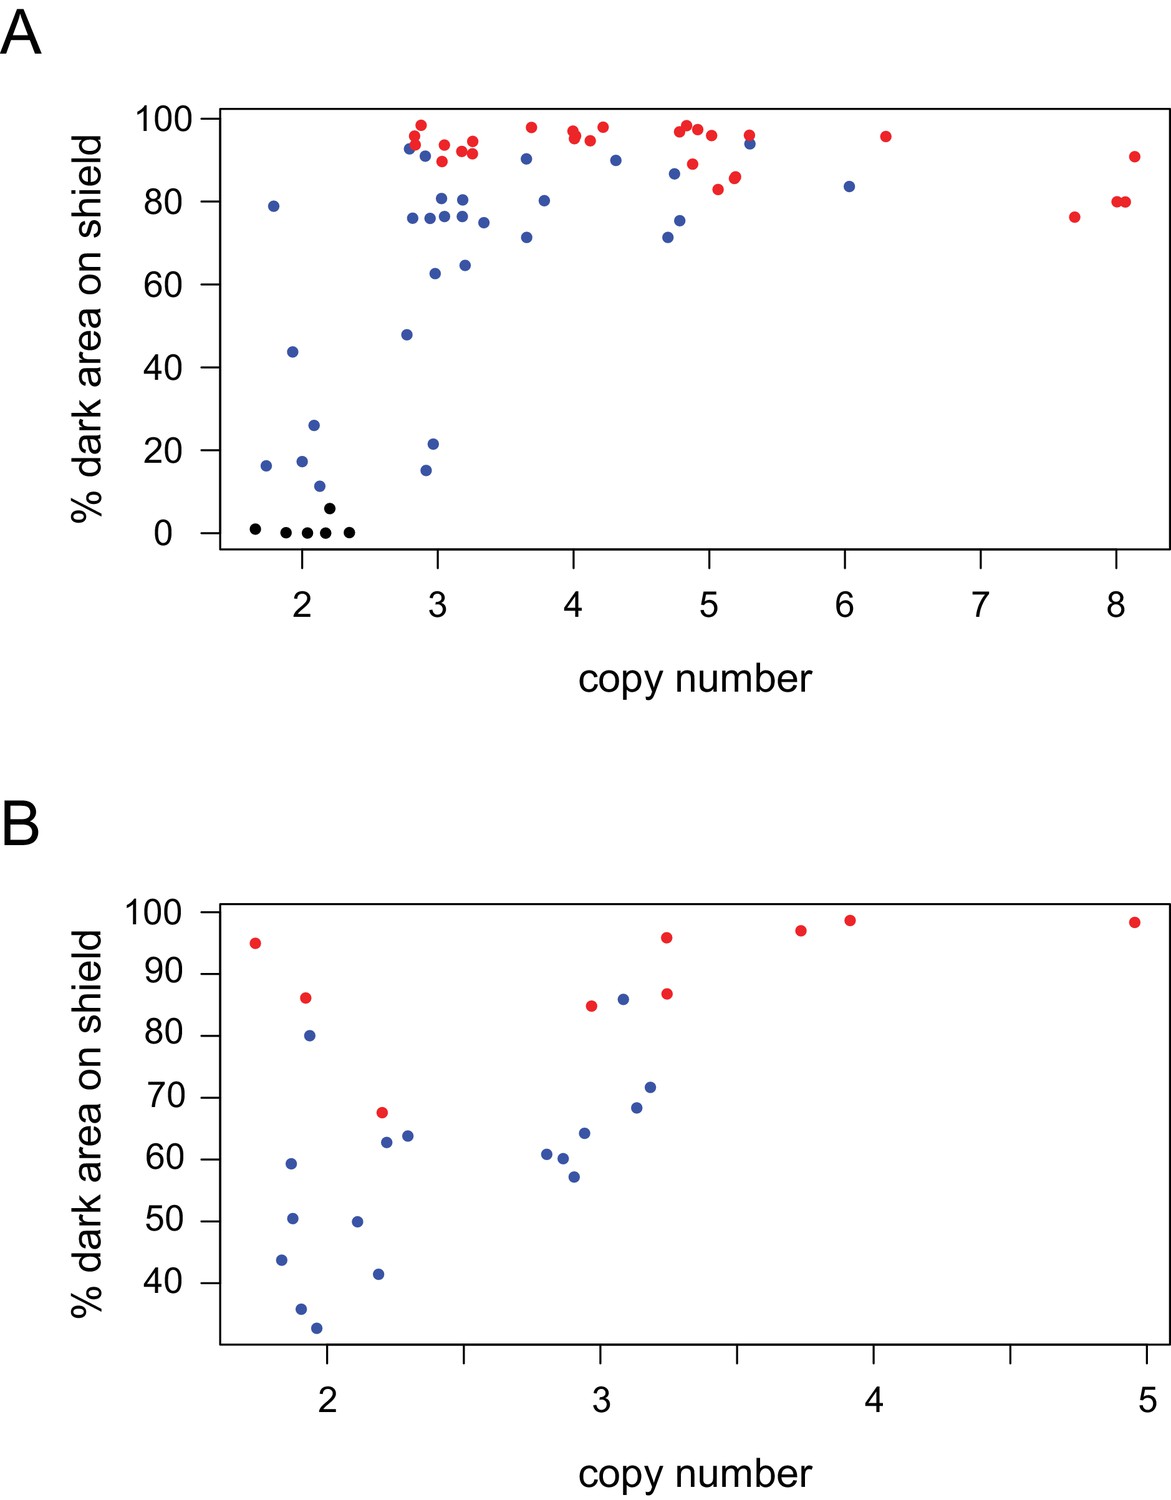
CNV is associated with darker wing shield pigmentation.
CNV and phenotype quantification for (A) domestic breeds (n = 58) and (B) wild-caught ferals (n = 26), parsed from data in Figure 2C. Points are colored by reported phenotype and origin: bar, black; checker, blue; T-check, red; domestic breeds, solid points; ferals, cross points.
Figure 3 with 3 supplements

Expression differences in NDP, but not EFHC2, indicate cis-regulatory differences associated with pigmentation phenotypes.
(A) qRT-PCR assays demonstrate higher expression of NDP in regenerating feathers of checker and T-check birds than in bar birds. Expression levels of EFHC2 are indistinguishable between bar and melanistic phenotypes (p=0.19), although checker and T-check differed from each other (p=0.046). (B) Allele-specific expression assay in regenerating feathers from heterozygous bar/checker birds for NDP and EFHC2. Copies of the CNV region on the checker chromosome were quantified using a custom Taqman assay. Boxes span the first to third quartiles, bars extend to minimum and maximum observed values, black line indicates median. Expression of EFHC2 alleles were not significantly different, and checker alleles of NDP showed higher expression than the bar allele; p=0.0028 for two-sample t-test between 1 vs. 4 copies, p=1.84e-06 for glm regression.
-
Figure 3—source data 1
qRT-PCR source data represented in Figure 3A, and Figure 3—figure supplement 1.
- https://doi.org/10.7554/eLife.34803.016
-
Figure 3—source data 2
Allele-specific expression assays source data represented in Figure 3B and Figure 3—figure supplement 3.
- https://doi.org/10.7554/eLife.34803.017
Figure 3—figure supplement 1
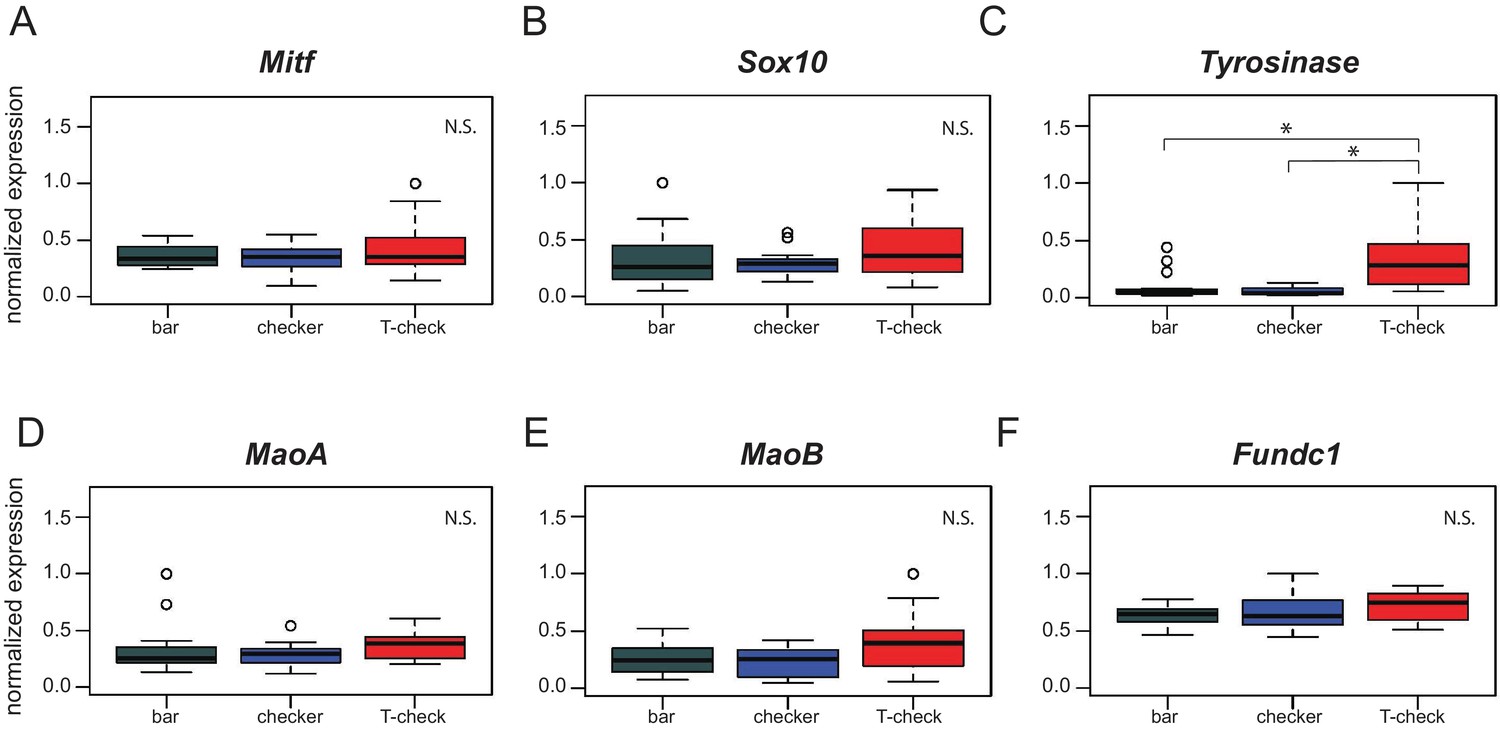
Expression of genes involved in pigmentation and genes in the candidate region.
Expression levels of Mitf (A), Sox10 (B), MaoA (D), MaoB (E), and Fundc1 (F) are indistinguishable across phenotypes. (C) Tyrosinase shows increased expression in T-check birds relative to bar (p=2.4e-04) and checker birds (p=3.8e-05). Boxes span the first to third quartiles, bars extend to minimum and maximum observed values, black line indicates median. Expression values are analyzed by Pairwise Wilcoxon test (p-value adjustment method: fdr).
Figure 3—figure supplement 2
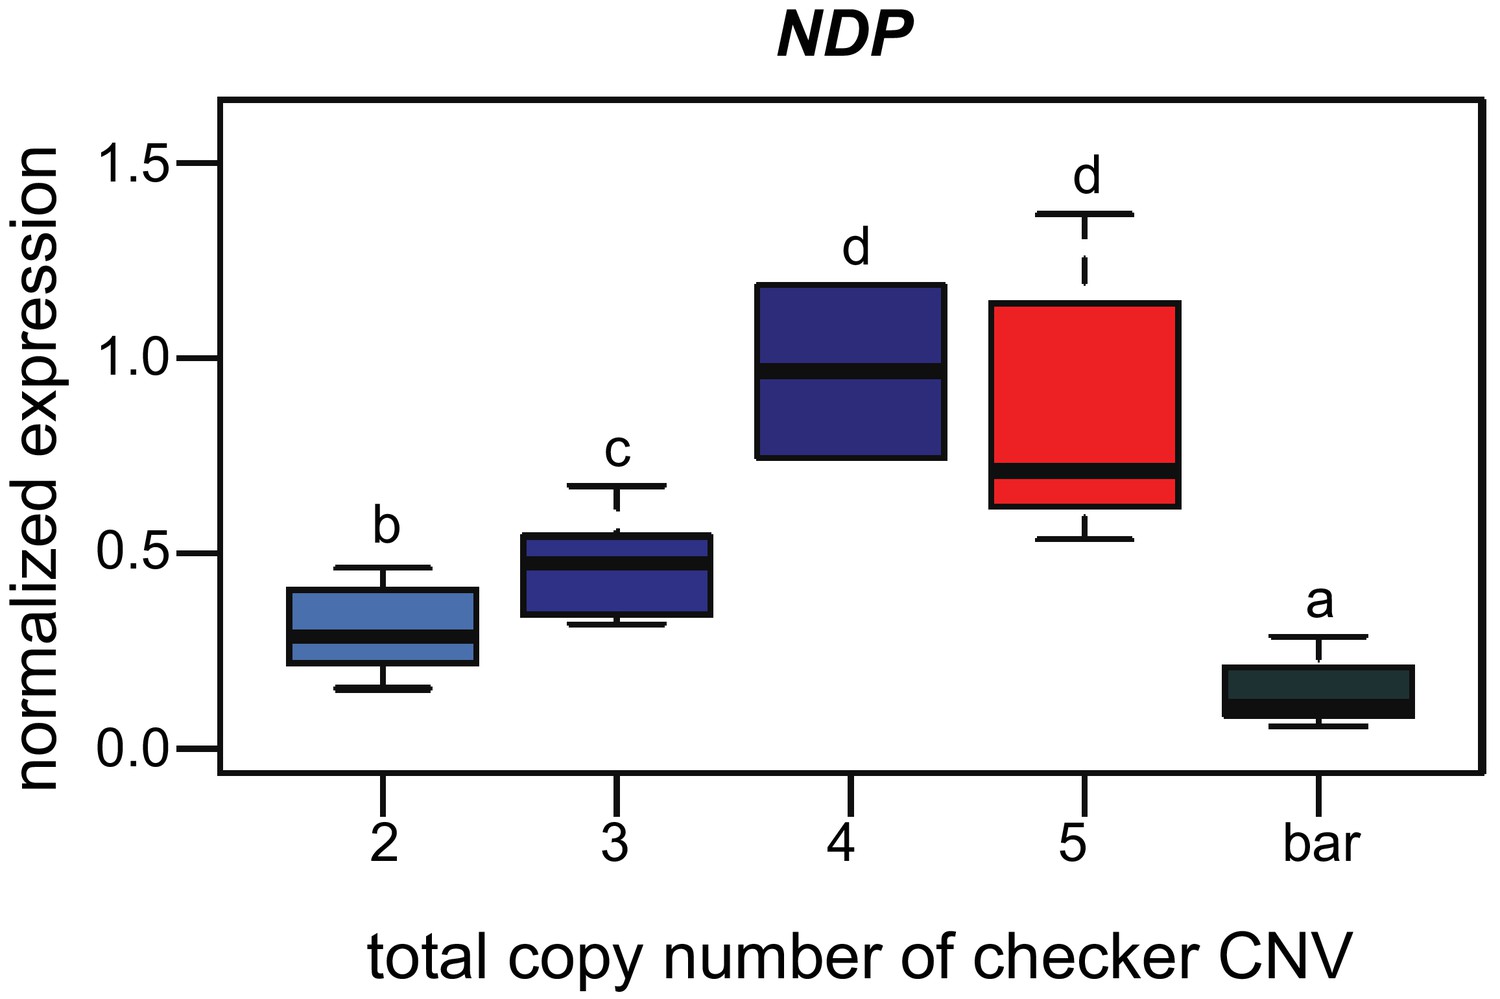
NDP expression varies by copy number and phenotype.
qRT-PCR expression assay for NDP (Figure 3A) is parsed by copy number in the CNV region. All checker (blue) and T-check (red) birds, except for the single individual with four total copies (dark blue), are heterozygous for bar. Increase in NDP expression is correlated with increasing numbers of copies of the CNV region. Boxes span the first to third quartiles, bars extend to minimum and maximum observed values, black line indicates median. Different letters indicate significant pairwise differences. Pairwise Wilcoxon test (p-value adjustment method: fdr) results by copy number: 2–3 copies, p=0.03788; 2–4 copies, p=0.04938; 2–5 copies, p=0.00015; two copies-bar, p=0.00432; 3–4 copies, p=0.03788; 3–5 copies, p=0.00122; three copies-bar, p=1.9e-06; 4–5 copies, p=0.48485; four copies-bar, p=0.02179; five copies-bar, p=1.9e-06.
Figure 3—figure supplement 3
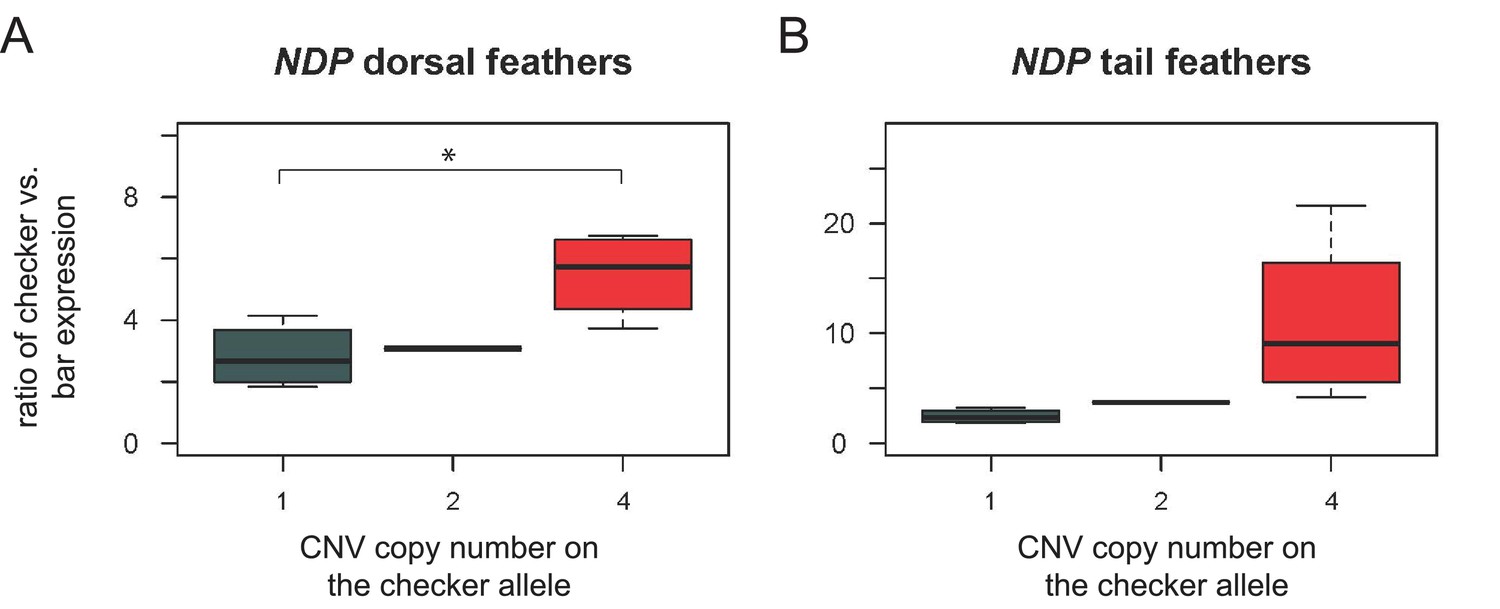
Allele-specific expression assay for NDP in regenerating feathers from dorsal body and tail feathers.
Copies of the CNV region on the checker chromosome were quantified as in Figure 3B. (A) In dorsal body feathers, checker alleles of NDP showed higher expression than the bar allele (p=0.025 for two-sample t-test comparing 1-copy checker:bar ratio to 4-copy checker:bar ratio, p=0.013 for glm regression including 1-, 2-, and 4-copy checker:bar ratios). Expression ratios of 1-copy checker:bar and 4-copy checker:bar alleles were significantly different from the 1:1 value expected for equal checker and bar expression; p<0.05 for each comparison. (B) Ratio of expression in tail feathers was not significantly different between checker alleles with 1 or four copies (p=0.11, t-test; p=0.044 for glm regression including 1-, 2-, and 4-copy checker:bar ratios). Expression ratios of 1-copy checker:bar were significantly different from the 1:1 value expected for equal checker and bar expression; p<0.05. Expression ratios of 4-copy checker:bar alleles were not significantly different from the 1:1 value expected for equal checker and bar expression; p=0.07. Boxes span the first to third quartiles, bars extend to minimum and maximum observed values, black line indicates median.
Figure 4
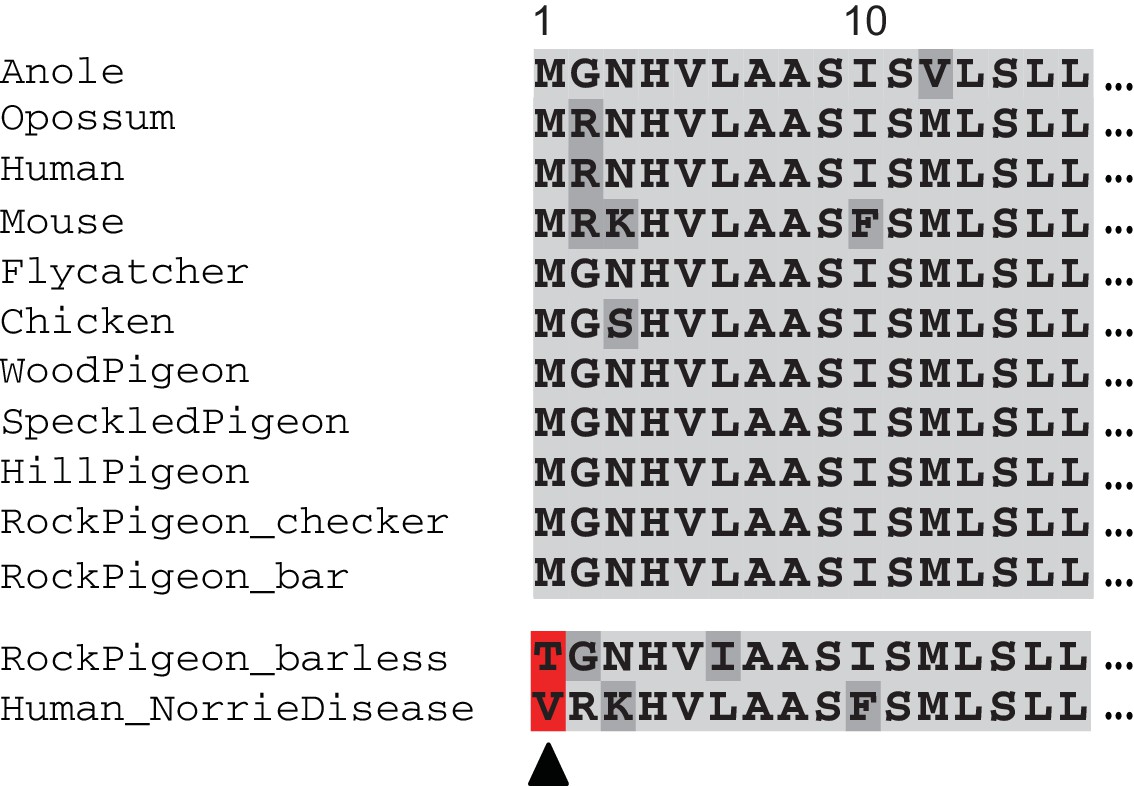
Barless pigeons have a nonsense mutation at the highly-conserved translation start site of NDP.
Barless rock pigeons are homozygous for a nonsense mutation that truncates the amino terminus of NDP by 13 amino acids; the same start-codon position is affected by a mutation in two human families with hereditary blindness (red, bottom of alignments).
Figure 5 with 1 supplement
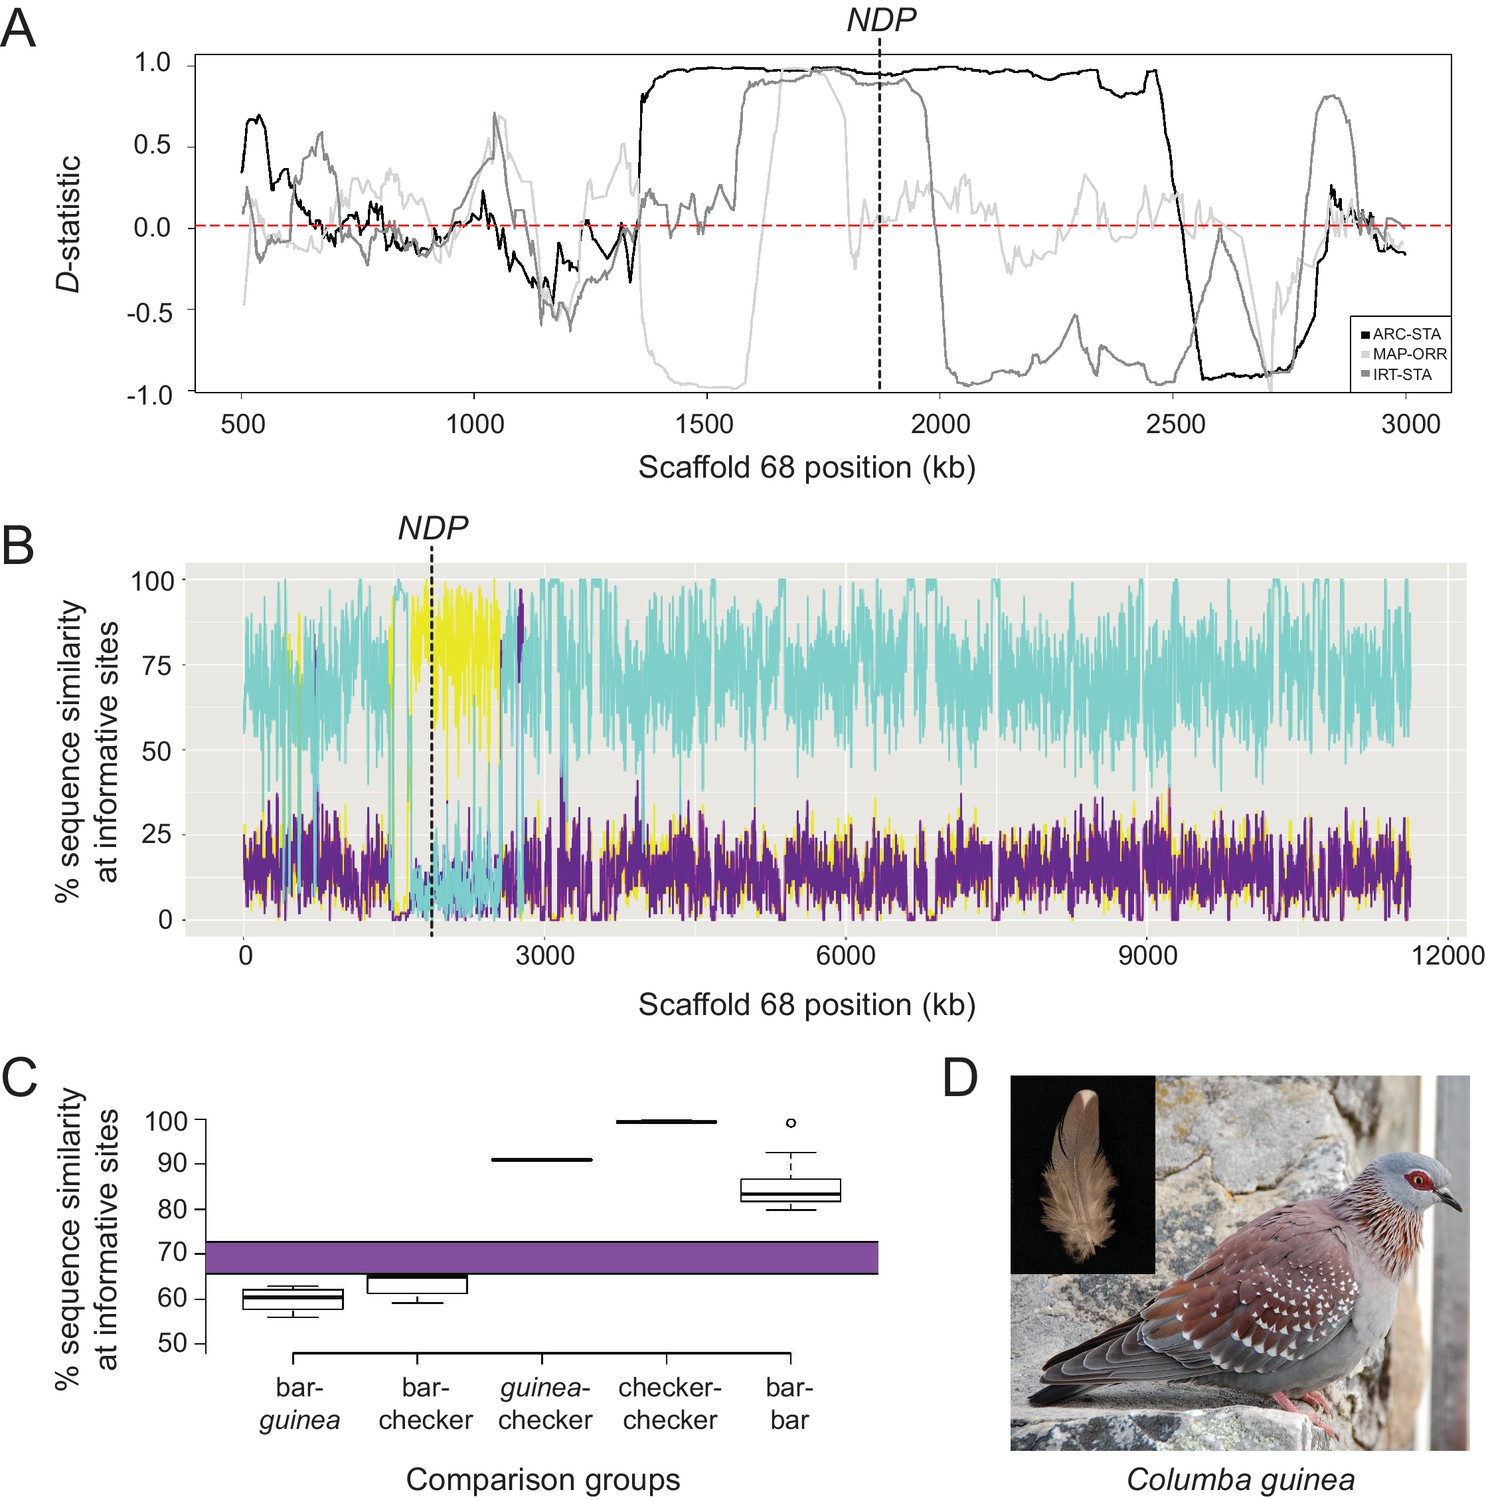
Signatures of introgression of the checker haplotype from C. guinea to C. livia.
(A) ABBA-BABA test with C. livia (bar), C. livia (checker), C. guinea, and C. palumbus shows elevated D-statistic in the Scaffold 68 candidate region. Three representative ABBA-BABA tests are shown and dashed red line marks the genome-wide mean D-statistic for 10 × 10 different combinations of bar and checker birds (ARC-STA, MAP-ORR, IRT-STA are shown, where ARC, MAP, and IRT are checker samples and STA and ORR are bar samples; see Methods). (B) HybridCheck shows pairwise sequence similarity across informative sites of a sequence triplet. A representative triplet of bar (Fer_VA), checker (ARC), and C. guinea comparison is shown. Blue trace shows sequence similarity between bar and checker, purple trace shows similarity between bar and C. guinea, and yellow trace shows sequence similarity between checker and C. guinea. (C) Expected (purple bar) and observed proportion of shared segregating sites out of 4261 total SNPs in the minimal haplotype region for different pairwise comparisons between and among 16 bar, 11 checker, and 1 C. guinea. (D) Speckled pigeon (Columba guinea). Photo courtesy of Kjeuring (CC BY 3.0 license, https://creativecommons.org/licenses/by/3.0/legalcode). Photo cropped from ‘speckled pigeon Columba guinea Table Mountain Cape Town,’ https://en.wikipedia.org/wiki/Speckled_pigeon#/media/File:Speckledpigeon.JPG. Inset feather image by the authors.
-
Figure 5—source data 1
Numbers of SNPs between different pairwise combinations of homozygous bar, checker, and C. guinea represented in Figure 5C.
- https://doi.org/10.7554/eLife.34803.021
Figure 5—figure supplement 1
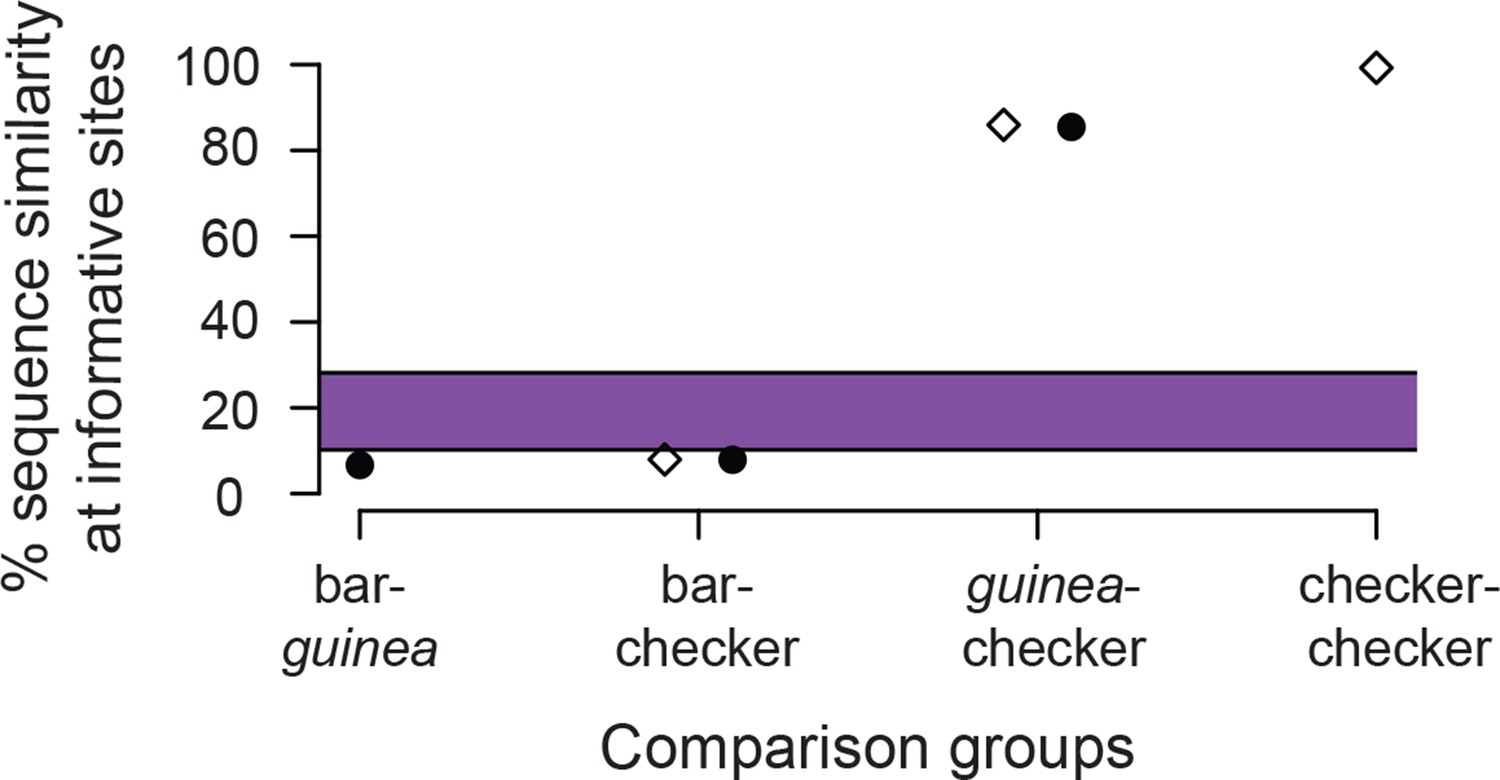
Expected (purple bar) and observed proportion of shared segregating sites out of 1,458 SNPs in the minimal haplotype region for different pairwise comparisons between de novo genome assemblies from short-read resequencing data for bar, checker, and C. guinea.
Filled circles denote sequence similarity in pairwise comparisons of de novo assemblies, and diamonds denote pairwise comparisons between de novo assemblies and the reference assembly, which has the checker haplotype. Percent similarity is much lower in this plot than in Figure 5C because the number of polymorphisms between pairwise comparisons is similar, but the total number of segregating sites is much lower in this small dataset than in the comparison among many resequenced genomes. In the larger dataset depicted in Figure 5C, the higher number of SNPs was driven largely by sequence diversity among the 16 bar birds. We identified 105 SNPs in the de novo assemblies that we not called in the resequencing data. Of these, 31 differ in the pairwise comparison between the checker and C. guinea assemblies, 84 differ between checker and bar, and 98 differ between bar and C. guinea. Total polymorphic sites between de novo assemblies in the 92,199 bp intersection among all three de novo assemblies: bar-checker, 1343; checker-C. guinea, 212; bar-C.guinea, 1361. Total polymorphic sites between de novo assemblies and the reference (checker) genome: bar-reference, 1342; checker-reference, 11; C. guinea-reference, 205.
Additional files
-
Supplementary file 1
Primer sequences used in this study.
- https://doi.org/10.7554/eLife.34803.022
-
Supplementary file 2
VISTA and REPTILE enhancer mapping hits on Scaffold 68.
- https://doi.org/10.7554/eLife.34803.023
-
Supplementary file 3
Combinations of bar and checker bird identifiers used to generate whole-genome D-statistics.
- https://doi.org/10.7554/eLife.34803.024
-
Supplementary file 4
Genotypes in the candidate region of individual birds in an F2 cross of domestic pigeons used to estimate recombination frequency.
- https://doi.org/10.7554/eLife.34803.025
-
Transparent reporting form
- https://doi.org/10.7554/eLife.34803.026
Download links
A two-part list of links to download the article, or parts of the article, in various formats.
Downloads (link to download the article as PDF)
Open citations (links to open the citations from this article in various online reference manager services)
Cite this article (links to download the citations from this article in formats compatible with various reference manager tools)
Introgression of regulatory alleles and a missense coding mutation drive plumage pattern diversity in the rock pigeon
eLife 7:e34803.
https://doi.org/10.7554/eLife.34803


