Asymmetric activation mechanism of a homodimeric red light-regulated photoreceptor
- Institute of Biochemistry, Graz University of Technology, Austria
- Max Planck Institute for Medical Research, Germany
Figures
Figure 1 with 4 supplements
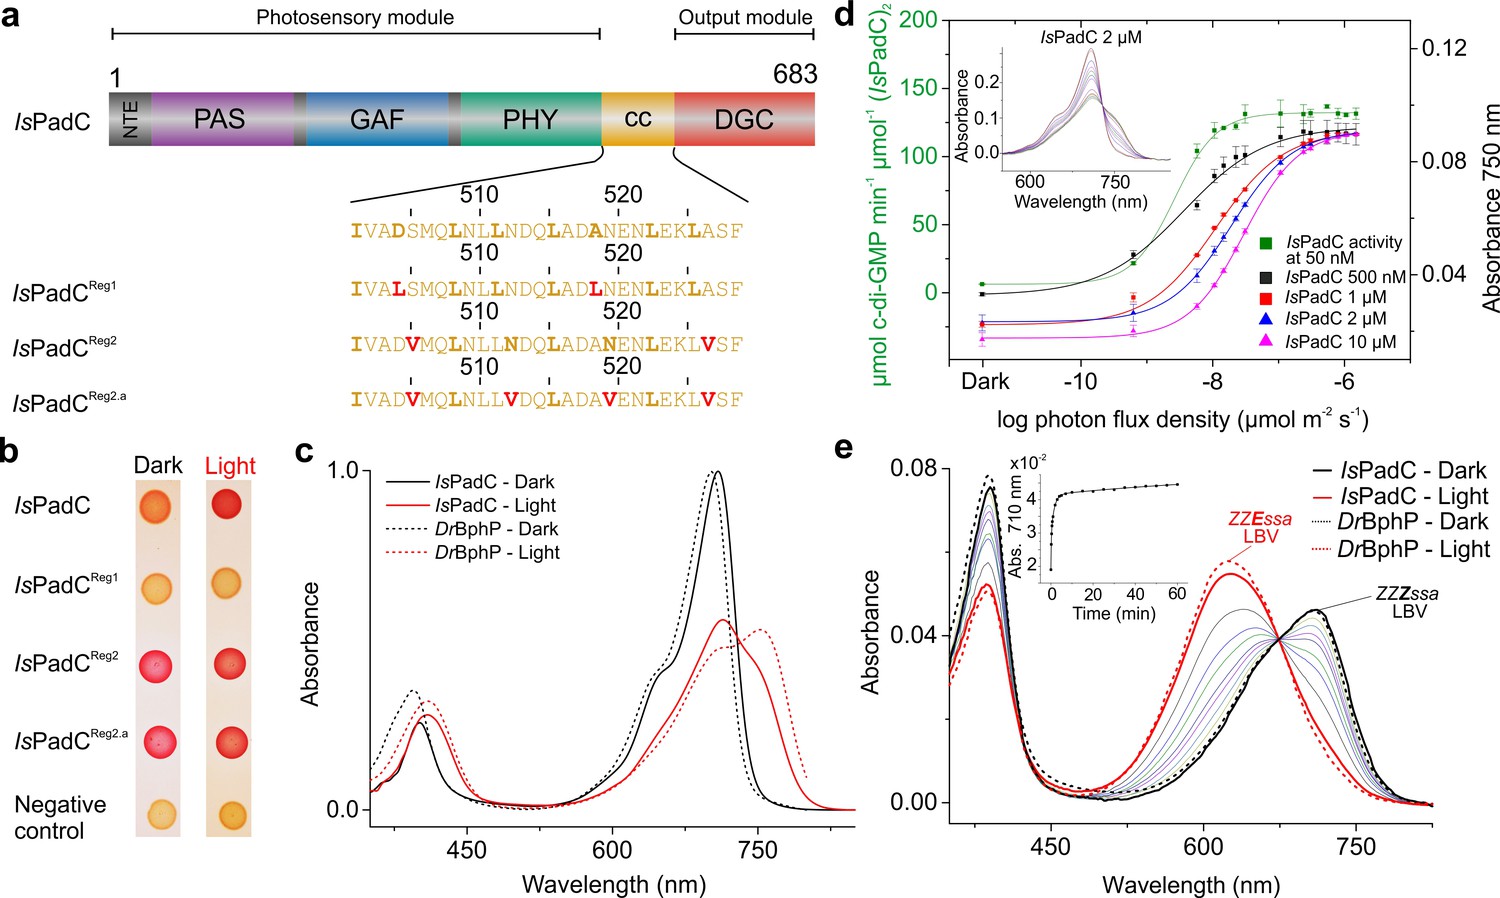
IsPadC constructs and their functional characterization.
(a) Schematic representation of IsPadC and coiled-coil linker variants. Individual domains are colored in dark gray, violet, blue, green, orange, and red for the N-terminal extension (NTE), PAS, GAF, PHY, coiled-coil (cc), and DGC domains, respectively. The coiled-coil sequence is shown for each linker variant with red-colored residues indicating substituted amino acids. Bold letters refer to the hydrophobic a and d positions of the abcdefg heptad repeat units of the coiled-coil. Wild-type and IsPadCReg1 are expected to feature the inhibiting coiled coil register 1, whereas IsPadCReg2 and IsPadCReg2.a are stabilized in a different coiled-coil register referred to as register 2 (stimulating). (b) In vivo screening of DGC activity. IsPadC shows the expected increased red coloration upon red light illumination activation (Gourinchas et al., 2017). By contrast the coiled coil variant stabilized in the inhibiting register (IsPadCReg1) shows no activity as reflected by a white coloration, whereas the variants stabilized in the stimulating register (IsPadCReg2, IsPadCReg2.a) show light-independent red coloration. (c) UV/Vis characterization of IsPadC showing the dark state spectrum in comparison to one obtained directly after red light illumination. For comparison, spectra acquired under identical light and measurement setting using D. radiodurans phytochrome (DrBphP) are shown (d) Effect of red light photon flux density on enyzmatic activity and on the spectral contribution at 750 nm. To account for the different protein concentrations, all measurements were scaled based on the respective dark state absorption of the Pr peak. To account for reduced Pr contributions due to partial light activation by the measuring light at low protein concentrations, the 750 nm contributions were subsequently normalized to saturating red light conditions of the 2 µM sample. Full spectra at various flux densities are shown for the 2 µM IsPadC concentration in the inset. (e) Thermal recovery of 15E biliverdin followed by denaturation of 10 μM native samples at different time points. For comparison DrBphP has been denatured in the dark and under illuminated conditions.
Figure 1—figure supplement 1

Coiled-coil linker sequences and heptad repeat assignments.
Representation of the linker heptad units in the context of stimulating and inhibiting linker register conformations for IsPadCReg1 (a), IsPadCReg2 (b), and IsPadCReg2.a (c), respectively. Letters from a to g indicate the position of the residue in the abcdefg heptad unit and colors are used to track individual residues in the inhibiting and in the stimulating register conformations.
Figure 1—figure supplement 2
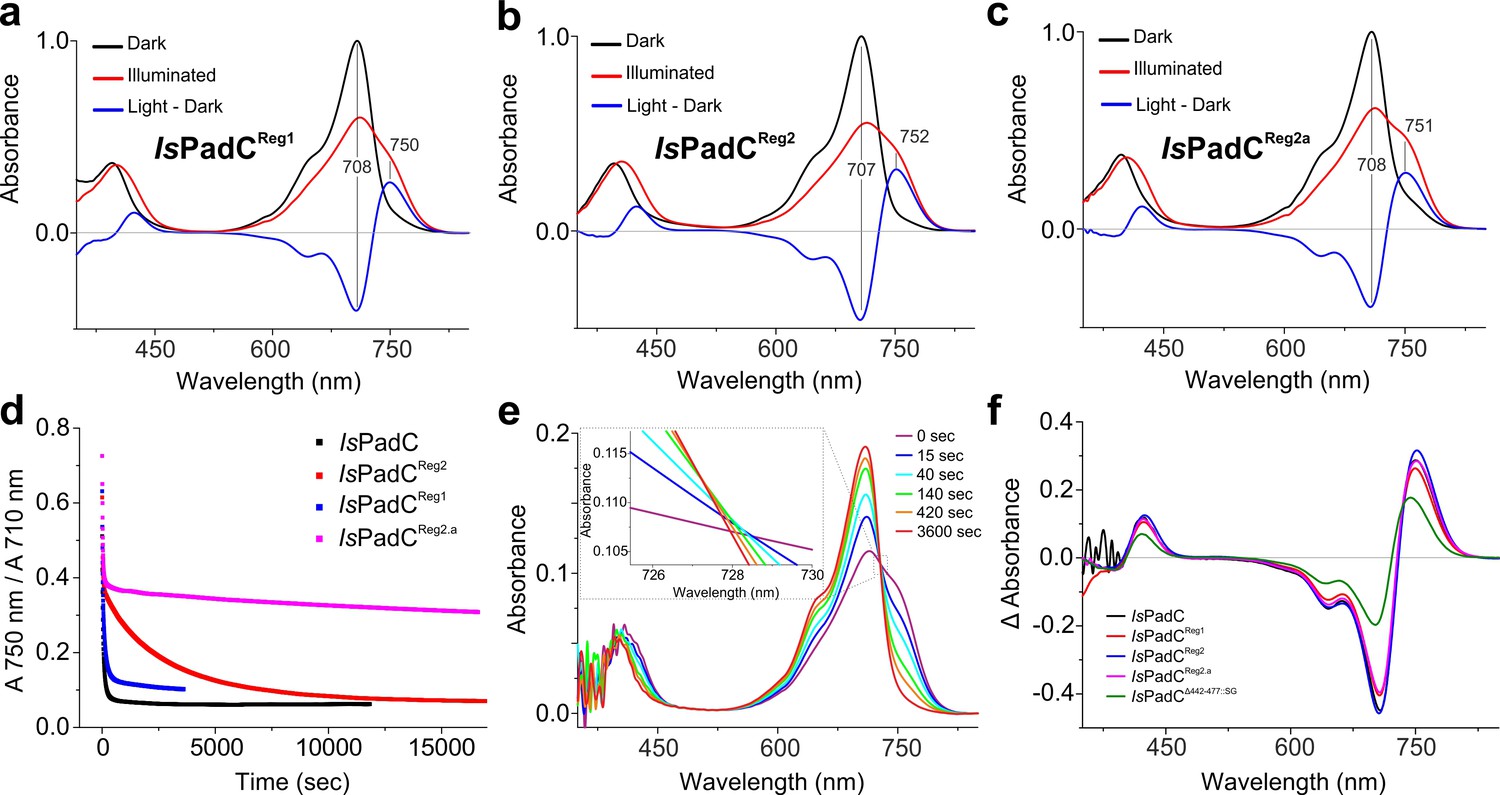
Characterization of sequence variants of the IsPadC coiled-coil linker.
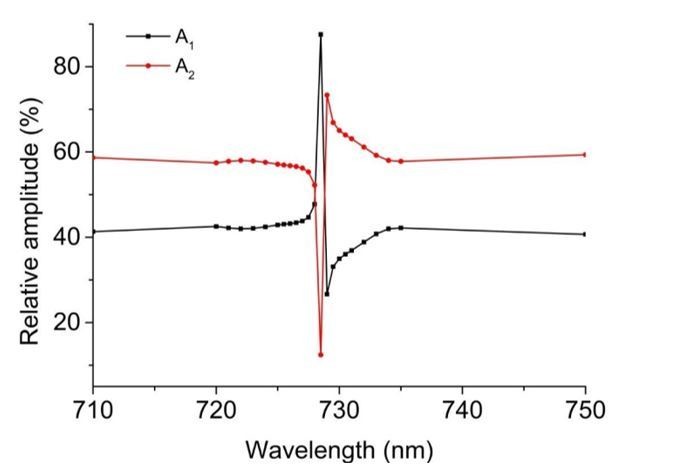
(a–c), UV-Vis spectra of dark-adapted samples and after red light irradiation of IsPadCReg1 (a), IsPadCReg2 (b), and IsPadCReg2.a (c), respectively. The dark state spectra, the light state spectra, and the difference spectra (illuminated minus dark states) are shown as black, red, and blue curves, respectively. All spectra were normalized to the maximum of the Pr absorption peak. (d), Thermal recoveries of the various variants visualized as the ratio of the absorbance at 750 nm over the absorbance at 710 nm. (e), Spectral recovery of IsPadC recorded using a diode-array spectrophotometer with a sampling time of 5 s. Only the main traces until 1 hr of measuring time are represented and an inset shows a close up view to show the non-isosbestic recovery. (f), Comparison of difference spectra of illuminated minus dark state contributions of the various IsPadC variants.
Figure 1—figure supplement 3
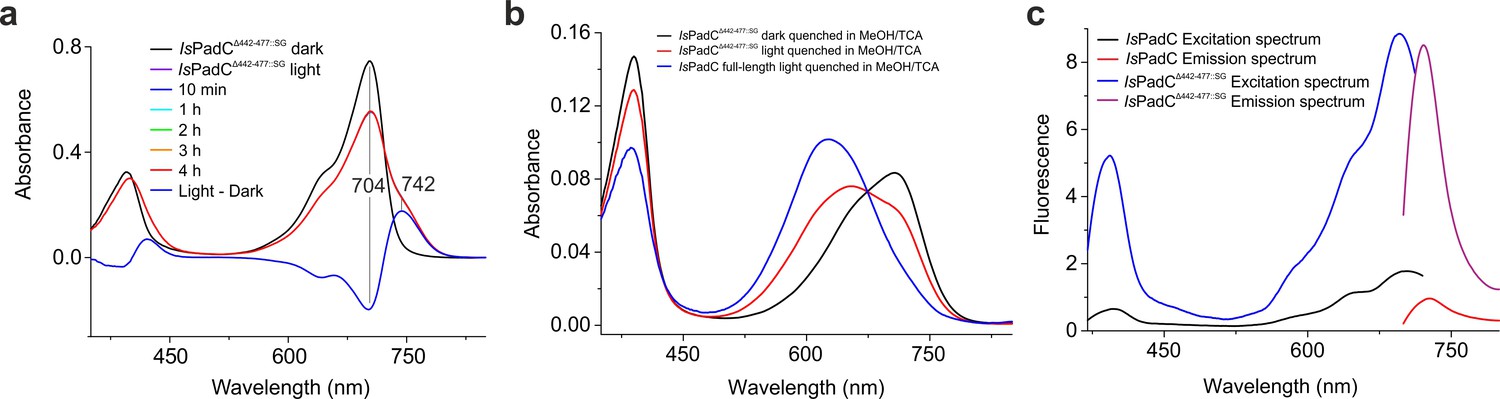
Spectral characterization of IsPadCΔ442-477::SG.
(a) Time series of UV-Vis spectra of IsPadCΔ442-477::SG following 1 min illumination with saturating red light. All recovery spectra overlap almost perfectly indicating no significant recovery to the ground state even after 4 hr in the dark. The difference spectrum of the illuminated minus dark state is represented in blue. Due to a different ratio of the Soret and Q bands relative to tongue containing IsPadC variants, we scaled the spectra to the more constant Soret band of the dark state spectra shown in Figure 1—figure supplement 2. (b) Denaturation of IsPadCΔ442-477::SG in the dark-adapted state and after illumination with saturating red light in methanol/TCA 0.1%. For comparison denatured IsPadC after illumination with saturating red light is included. (c) Fluorescence measurements of IsPadCΔ442-477::SG and IsPadC at 2 μM protein concentration recorded after red light illumination of the sample.
Figure 1—figure supplement 4
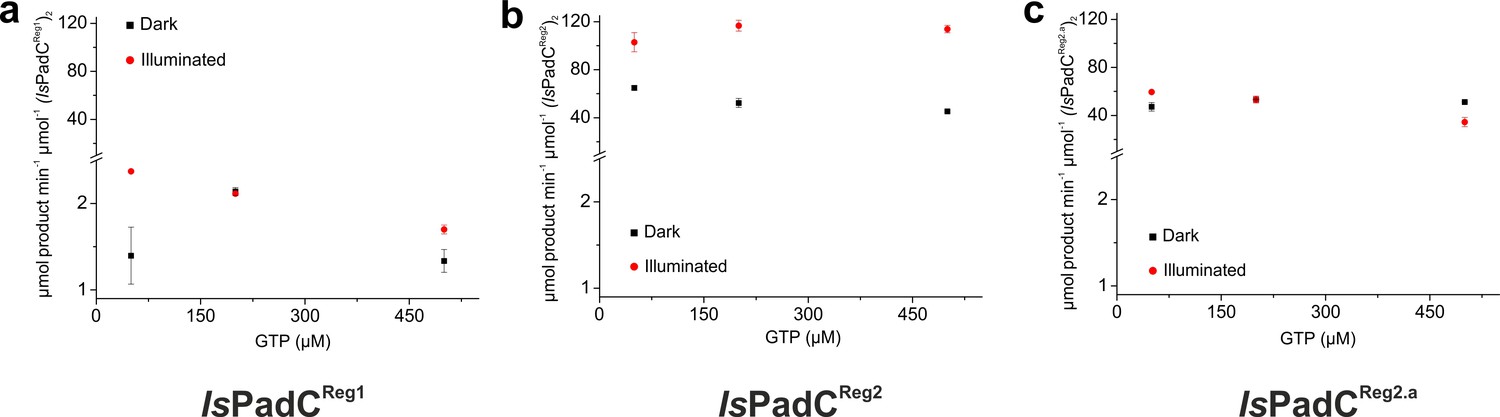
Kinetic characterization of product formation of IsPadCReg1 (a), IsPadCReg2 (b), and IsPadCReg2.a (c), respectively.
Product formation was quantified in triplicate for different reaction times and the standard deviation of individual points contributed to the error estimation of the linear fit that is used to calculate the initial rate of product formation. The error of the estimate of the linear fit is represented as error bar for each GTP concentration. Dark-state data are shown in black and light-state data in red.
Figure 2 with 3 supplements
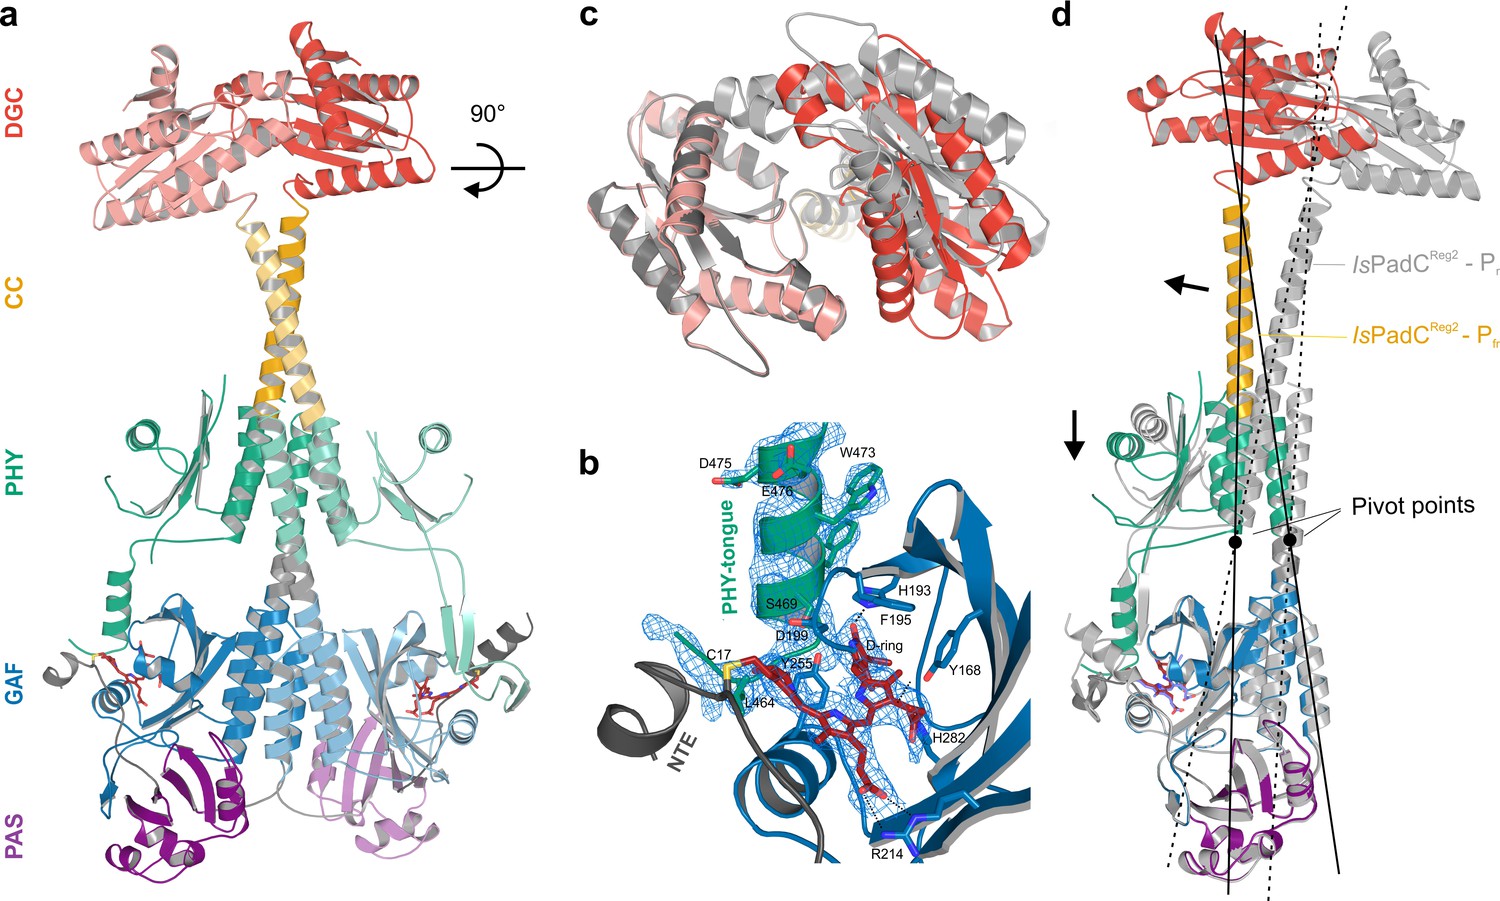
Asymmetric activation of a bacteriophytochrome dimer.
(a) Crystal structure of IsPadCReg2 in cartoon representation with individual domains colored according to Figure 1a. Within the dimer, the activated protomer is highlighted in bold colors. The biliverdin chromophore is colored in dark red and represented in sticks. (b) Close-up view of the biliverdin-binding pocket corresponding to the Pfr conformation, highlighting the secondary structure change of the PHY-tongue element. The 2Fo-Fc electron density map contoured at 1σ around the chromophore is shown as light blue mesh. Important residues are shown in sticks. For clarity residues 200–213 have been hidden from the view. (c) Top view of the asymmetric GGDEF dimer induced by the coiled-coil linker helix translation. The GGDEF dimers are superimposed by aligning protomer A of IsPadCReg2 to the corresponding protomer B (residues 529–683) and the moved copy of the GGDEF dimer is represented as gray cartoon. (d) Superposition of the Pfr protomer of IsPadCReg2 (colored as in a) and the Pr protomer of IsPadCReg2 (colored in light gray) based on the PAS-GAF core (residues 1–312) of the respective chain A and B. Arrows indicate the structural rearrangements associated with Pfr formation. The pivot points and the associated lines show the hinge-like rearrangements at the central helical spine and the terminal PHY-helix extending into the coiled-coil linker.
Figure 2—figure supplement 1
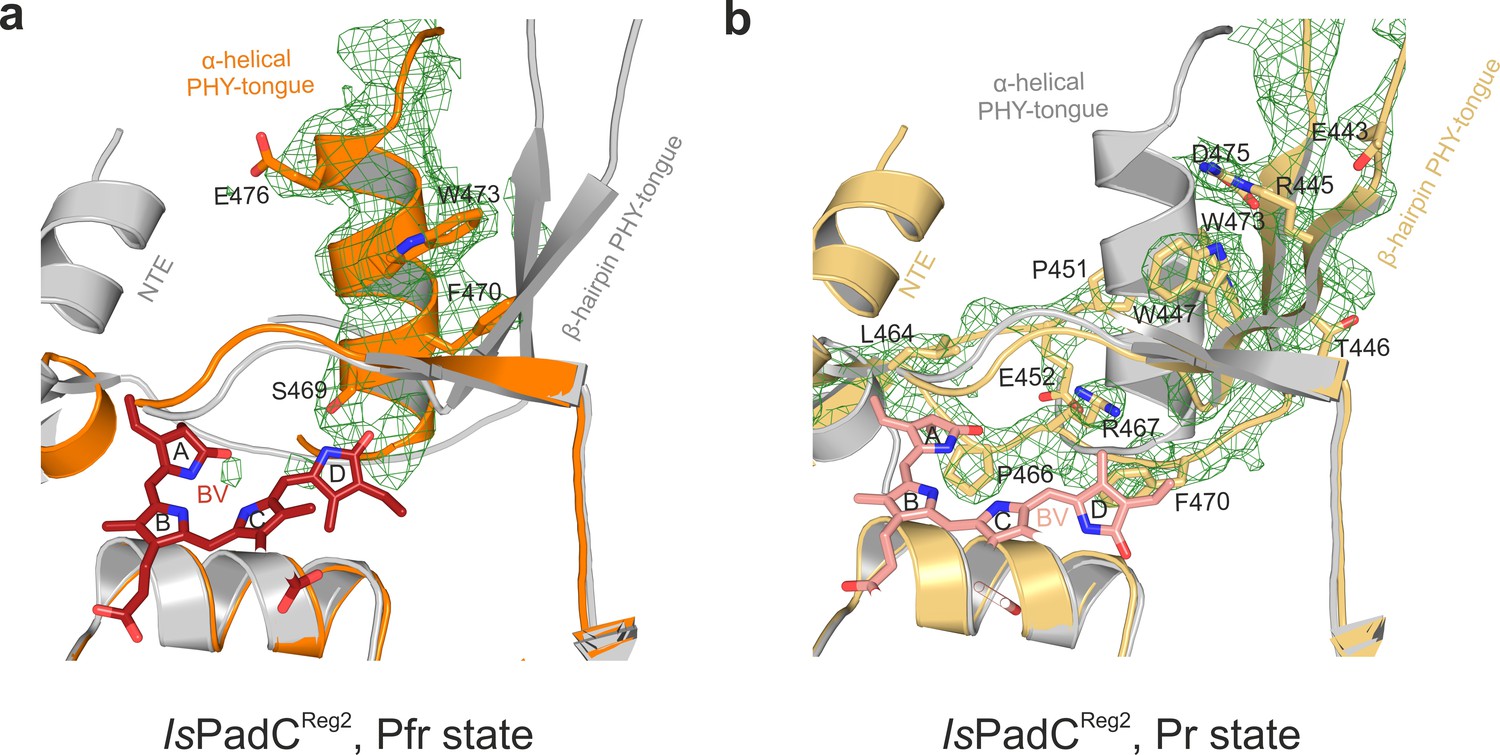
Pr and Pfr models and electron density of the PHY-tongue regions of IsPadCReg2.
(a), Polder-map of the omitted PHY-tongue region (residues 441–479) of protomer A featuring a Pfr state. The PHY-tongue region adopting a Pfr environment is represented in cartoon and colored in orange. The PHY-tongue region of protomer B (colored in light gray) is superimposed based on the PAS-GAF core to highlight the difference between electron density in this region and the Pr conformation of the PHY-tongue. (b), Polder-map of the omitted PHY-tongue region (residues 441–479) of protomer B (in light orange) featuring a Pr state. The PHY-tongue region of the protomer A is superimposed based on the PAS-GAF core and colored in light gray. The polder-map is a difference electron density map contoured at 3σ and shown as green mesh.
Figure 2—figure supplement 2
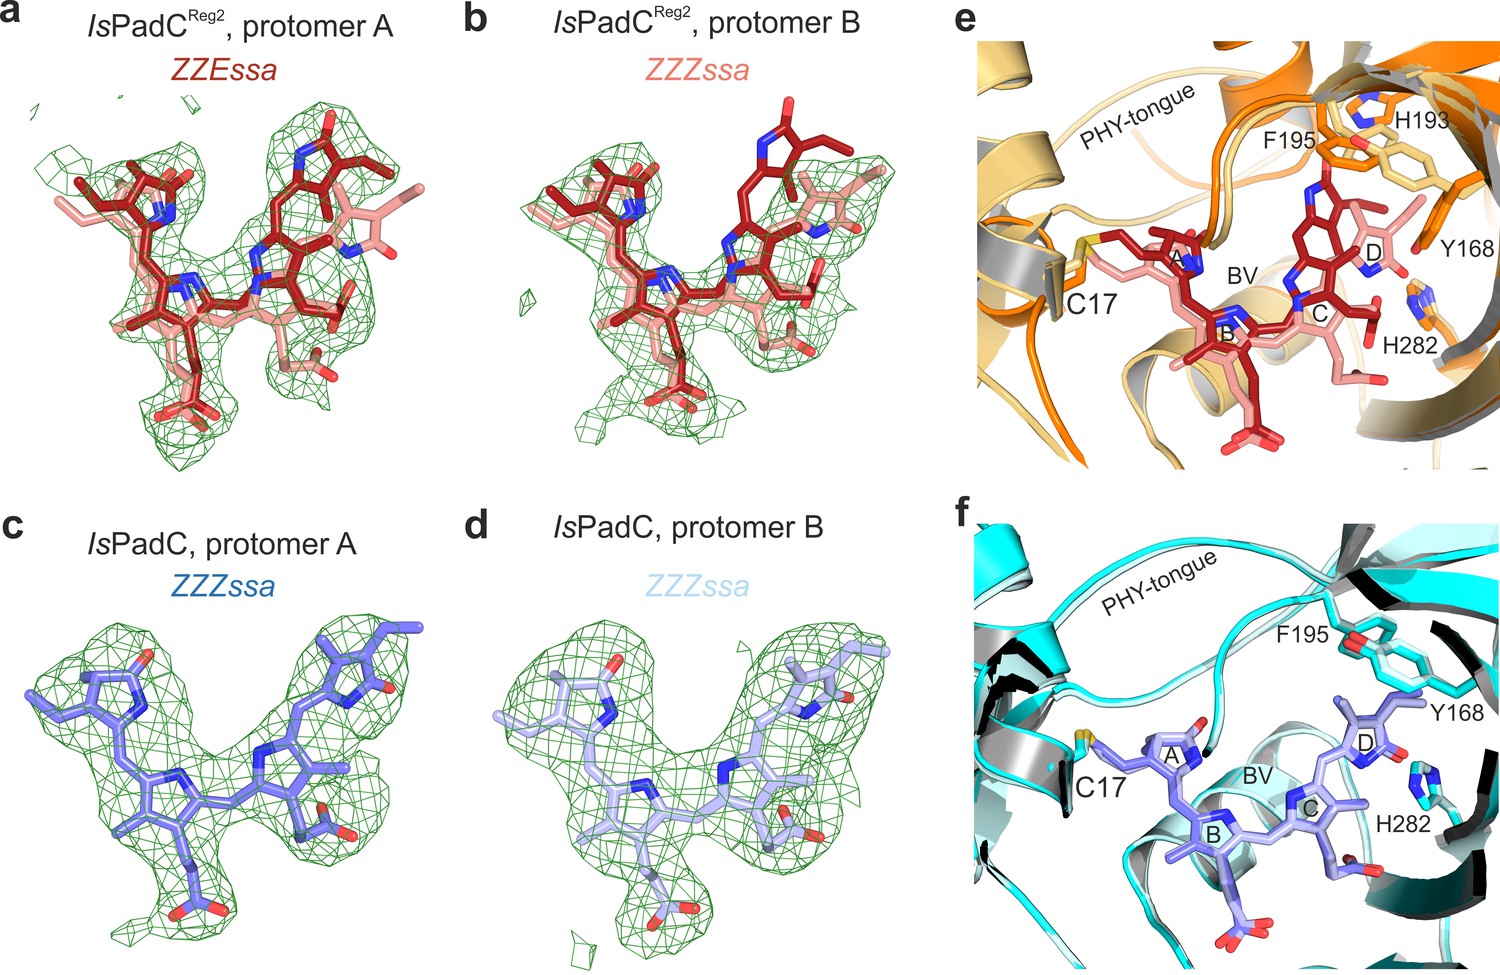
Polder-maps generated for the cofactor binding site with chromophores omitted from both chains of IsPadCReg2 and wild-type IsPadC.
(a–b), Polder-map of chromophore binding sites in IsPadCReg2 chains A and B from left to the right. In each case, the chromophore of the corresponding other protomer is superimposed based on the structural alignment of the PAS-GAF core (residues 1–312). The ZZEssa chromophore is colored in dark red while the ZZZssa conformation is colored in light red. (c–d), Polder-map of omitted chromophores in IsPadC (PDB: 5LLW) chains A and B from left to the right. The ZZZssa chromophore of protomer A is colored in slate while the ZZZssa chromophore of protomer B is colored in light blue. All polder-maps are Fo-Fc difference electron density maps contoured at 4σ and shown as green mesh. (e), The two chromophores of IsPadCReg2 protomers A and B are superimposed based on their PAS-GAF domains (residues 1–312). The chromophore in the Pfr state is colored in dark red while the chromophore in the Pr state is colored in light red. Important residues that change rotamer positions upon chromophore isomerization are highlighted in stick representation. Structural elements obscuring the view on the superimposed chromophores were clipped from the view. (f), The two chromophores of IsPadC protomers A and B are superimposed based on their PAS-GAF domains (residues 1–312). The chromophore of protomer A is colored in slate while the chromophore of protomer B is colored in light blue. Structural elements obscuring the view on the superimposed chromophores were clipped from the view.
Figure 2—figure supplement 3

Crystal spectra of IsPadCReg2 and IsPadC at 100K.
A spectrum corresponding to IsPadCReg2 crystals is compared to a spectrum of IsPadC dark state crytals recorded at cryogenic temperatures. To account for preferred orientation of proteins in the crystal lattice, various spectra at different positions of the protein crystal with respect to the light path were averaged (20 and 4 individual spectra have been averaged for IsPadCReg2 and IsPadC, respectively). The two averaged spectra are scaled such that they reflect the isosbestic point of Pr and Pfr states.
Figure 3 with 2 supplements
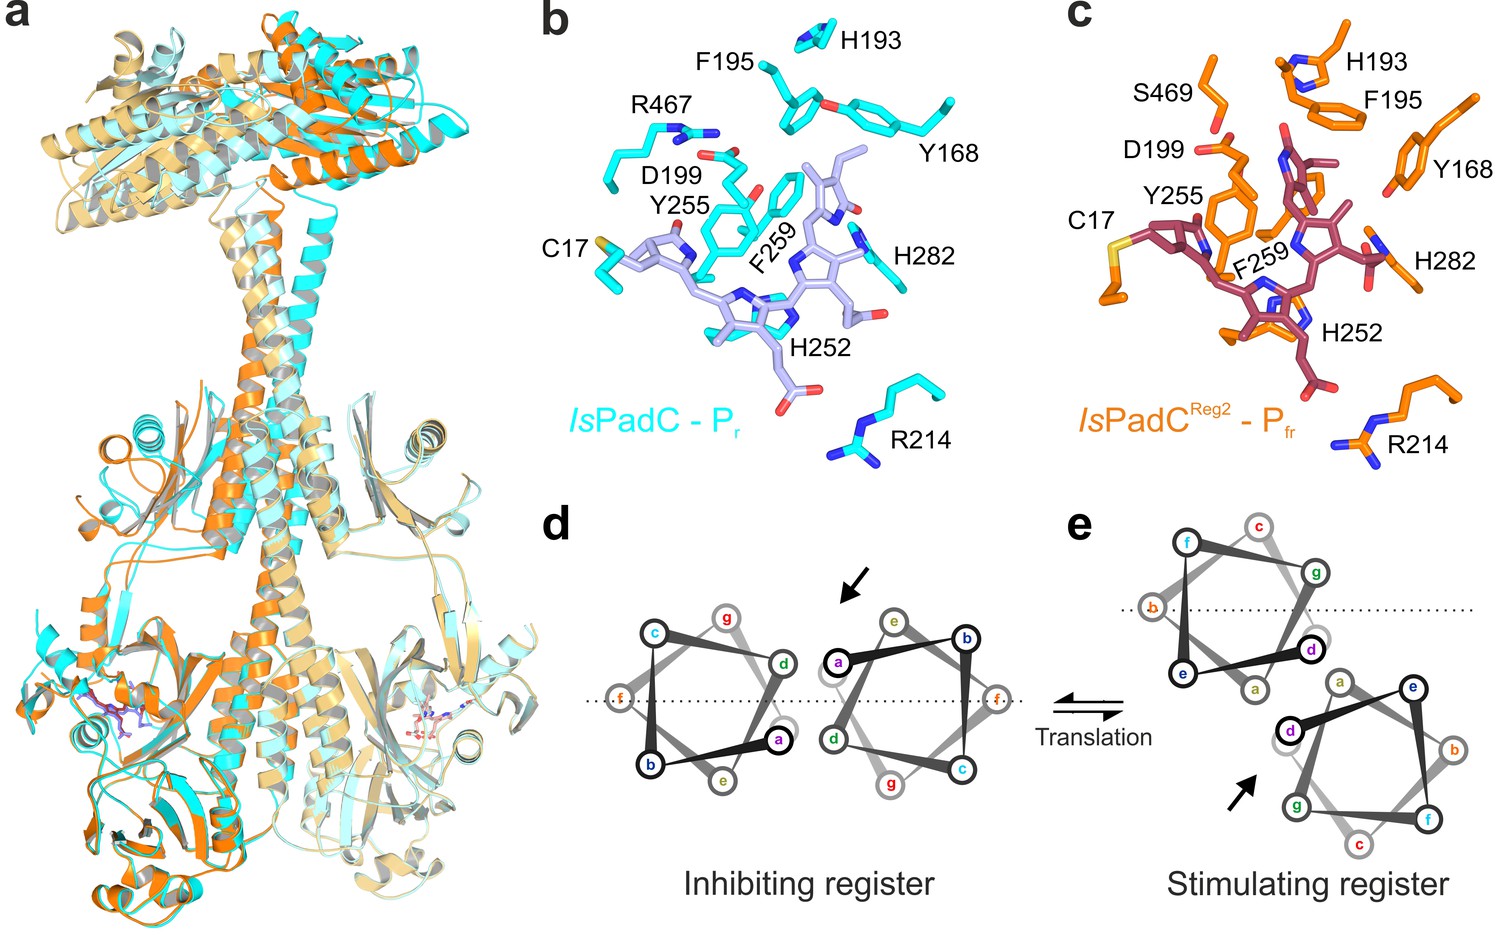
Structural rearrangements in the dimer conformation upon PHY-tongue refolding.
(a) Superposition of the IsPadC dark-state structure (colored in cyan) with the activated IsPadCReg2 structure (colored in orange) based on the PAS-GAF cores (residues 1–312) of the respective chains B. The superposition shows the quasi-translational rearrangement in the middle of the coiled-coil linker associated with PHY-tongue refolding of one protomer. The superposition of the Pr-state phytochrome protomers of IsPadC and IsPadCReg2 (respective chains B) is almost identical (RMSD of 0.26 Å over 347 Cα-atoms). (b–c) Stick representation of residues around the biliverdin D-ring for the IsPadC Pr-state (b) and the IsPadCReg2 Pfr-state (c), respectively. The ZZEssa configuration of biliverdin results in rotamer repositioning of Tyr168, Phe195, His193, Tyr255, and results in loss of the Asp199-Arg467 salt bridge between the GAF domain and the PHY-tongue. (d–e) The stimulating register 2 conformation of the coiled-coil linker is populated by translation of one linker helix upon PHY-tongue refolding.
Figure 3—figure supplement 1

Flexibility of the coiled-coil linker element in response to the molecular cross-talk between sensor and effector.
(a), Superposition of IsPadCReg2 (orange) and IsPadC soaked with GTP (purple) structures onto the IsPadC dark-state (cyan) structure based on the PAS-GAF cores (residues 1–312) of the respective chains B. To focus on the coiled-coil linker conformation, the DGC dimer was removed for clarity from the rotated view. The superposition shows that GTP binding and the rearrangement of the DGC dimer feature structural changes that are similar to those of the stimulating coiled-coil linker conformation. (b), Close up view on the hinge-like motion of the coiled-coil linker helices upon switching to the stimulating register. For the central coiled-coil region, indicated by dashed lines, this shows that the structural rearrangement can be approximated by a translation of one helix with respect to the other. (c), Superposition of the IsPadC dark-state structure (cyan) and the activated IsPadCReg2 structure (orange) based on the PAS-GAF cores (residues 1–312) of the respective chains B, revealed a destabilization of the PHY dimer interface by disrupting the intermolecular Arg327 – Asp494 salt bridge.
Figure 3—figure supplement 2

Allosteric effects of the coiled-coil rearrangement on the conformation of the DGC dimer.
(a), Structural alignment of the IsPadCReg2 (orange) and the IsPadC (cyan) DGC dimers based on superposition of their Pr state protomers (chains B) from residues 529 to 683 (RMSD of 0.369 Å over 148 α-carbons). (b), The rotated view shows the rotational displacement of the DGC dimer due to the associated coiled-coil linker helix translation. (c), Close up view of the GGEEF site shows that, upon coiled-coil linker register switching and rearrangement of the DGC dimer, the relative positioning of the two substrate coordinating sites is changed to potentially facilitate initiation of the catalytic cycle. (d), Close up view of the interface between helices α1/α2 of one DGC protomer and helix α4 of the other protomer. Important residues at the interface are highlighted in stick representation.
Figure 4 with 2 supplements
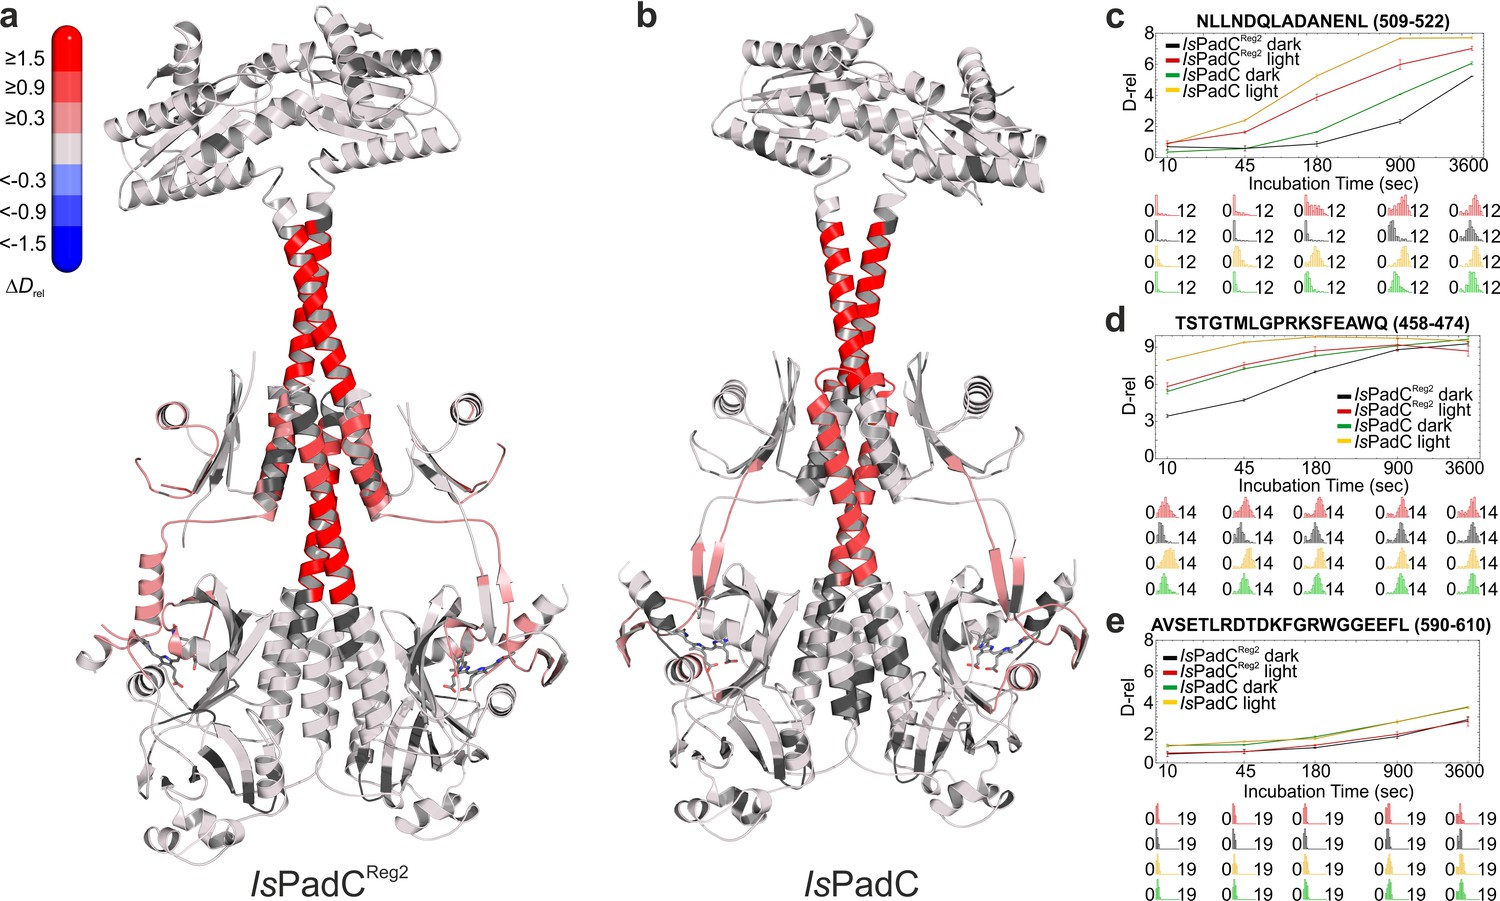
Comparison of the changes in conformational dynamics upon illumination of IsPadCReg2 and IsPadC.
(a–b) Changes in conformational dynamics upon illumination of IsPadCReg2 (a) and IsPadC (b), respectively, evaluated by HDX-MS. Since time dependent deuterium uptake at the amide positions for different peptides correlates with the stabilization of both β-sheets and α-helices, the deuterium uptake of individual peptides can be related to the stability of the secondary structure elements in a defined region. Closer inspection of individual peptides (panels c–e), revealed that the absolute conformational dynamics of individual peptides differ substantially. The presented structures are colored according to the observed changes in relative deuterium incorporation (ΔDrel) between light-state and dark-adapted state (Drel light – Drel dark) after 15 min of deuteration. The changes in ΔDrel are indicated by the scale in the top left corner with blue corresponding to reduced deuterium incorporation and red reflecting increased exchange of amide protons upon red light illumination. The biliverdin chromophore is represented as sticks and colored in gray. (c–e) Comparison of deuterium uptake curves of IsPadCReg2 and IsPadC peptides in the coiled-coil linker region (c), in the PHY-tongue region (d), and in the GGEEF element of the DGC (e), respectively. Drel is plotted against the deuteration time for light- and dark-state HDX-MS experiments. The error indicators correspond to the sample standard deviation of triplicate measurements. The lower parts show software-estimated abundance distributions of individual deuterated species on a scale from undeuterated to all exchangeable amides deuterated.
Figure 4—figure supplement 1

Comparison of changes in conformational dynamics of IsPadCReg2 and IsPadC evaluated by HDX-MS.
(a), The presented structures are colored according to the observed changes in relative deuterium incorporation (ΔDrel) between the dark-adapted states of IsPadC and IsPadCReg2 (Drel Dark IsPadCReg2 – Drel Dark IsPadC) (a), and between the light illuminated states of IsPadC and IsPadCReg2 (Drel Light IsPadCReg2 – Drel Light IsPadC) (b), after 3 min of deuteration. The changes in ΔDrel are indicated by the scale in the top left corner with blue corresponding to reduced deuterium incorporation and red reflecting increased exchange of amide protons in the IsPadCReg2 variant stabilized in the stimulating register. The biliverdin chromophore is represented as stick model and colored in gray.
Figure 4—figure supplement 2
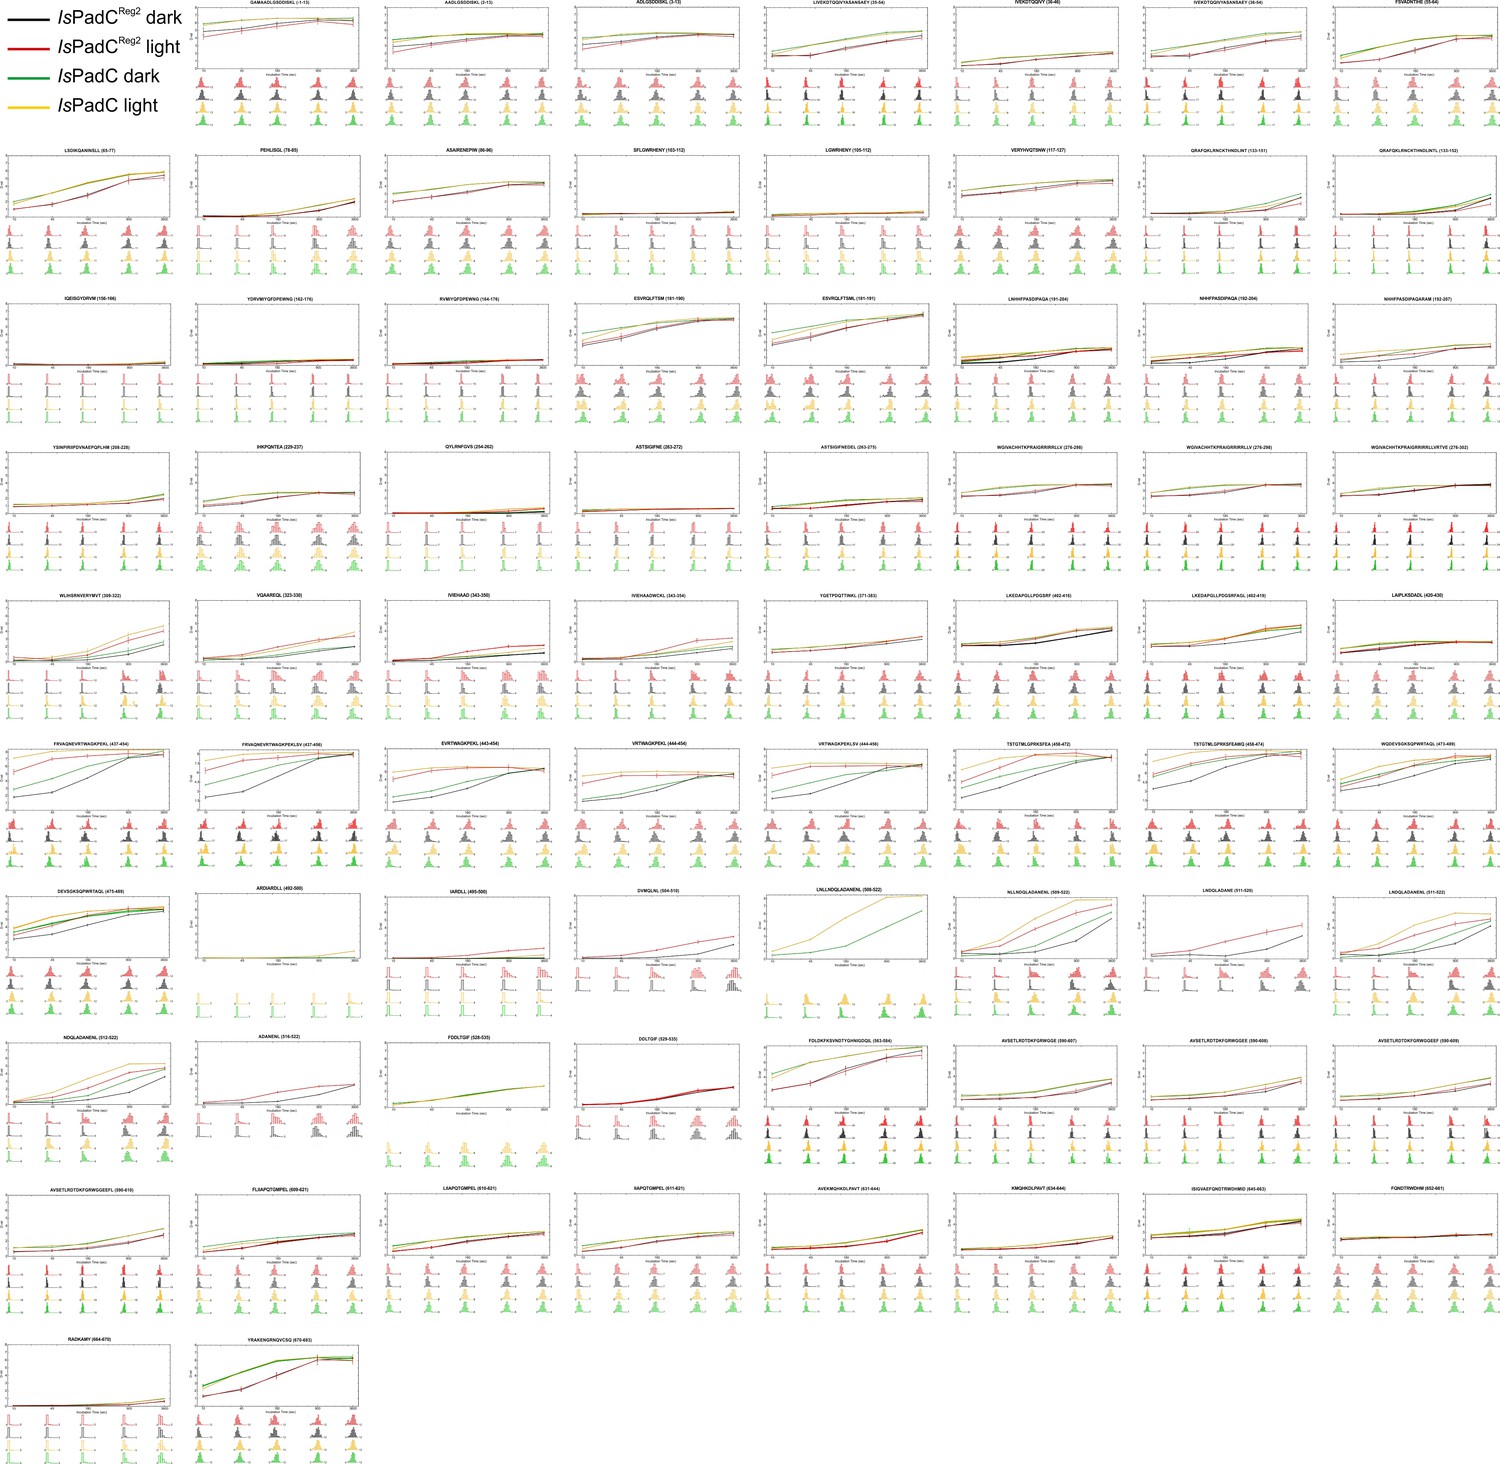
Individual deuterium incorporation plots of all evaluated peptides and comparison of common IsPadCReg2 and IsPadC peptides.
Peptide sequences and their corresponding positions are shown on top of each sub-panel. The relative deuterium incorporation is plotted against the labeling time in seconds. IsPadC traces are colored in green and orange for the dark- and light-state, respectively, while IsPadCReg2 traces are colored in black and red for the dark- and light-state, respectively. Drel values are shown as the mean of three independent measurements and error bars correspond to the standard deviation. The lower part of each sub-panel shows software-estimated abundance distributions of individual deuterated species on a scale from undeuterated to all exchangeable amides deuterated. Please zoom in on the electronic version to visualize all details.
Figure 5
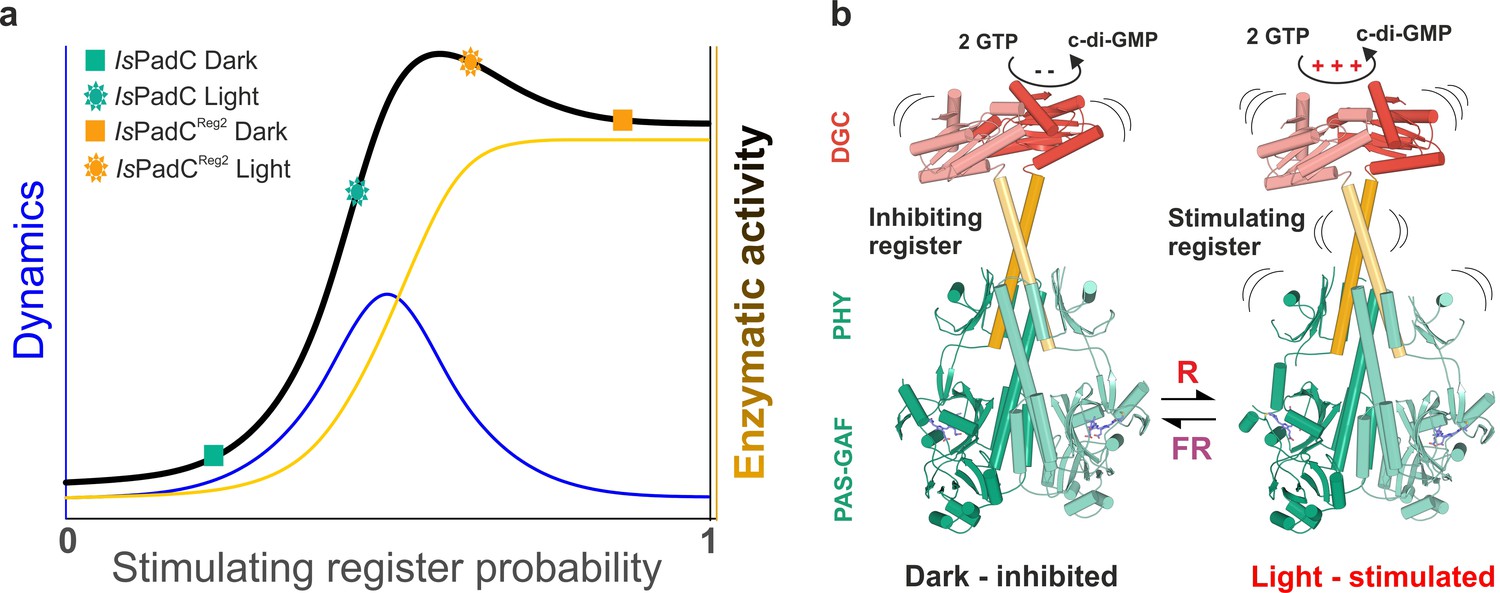
A toggle mechanism between linker conformations modulates DGC activity.
(a) Schematic representation of how DGC activity is modulated by the coiled-coil linker register and its intrinsic conformational dynamics. The transition between the inhibiting and the stimulating coiled-coil conformations is represented on the x-axis as the probability to be in the stimulating register. Under conditions where a switching between coiled-coil registers is possible the dynamics of the system are increased (blue curve). In combination with the structural contribution of the stimulating register for DGC activity (orange curve), the overall enzymatic activity is approximated as the sum of both contributions (dark curve). A large photodynamic range can only be obtained by a fine-tuned balance of conformational flexibility and structural differences of the coiled coil conformations. (b) Schematic model of PadC activation. In the dark, a stable β-hairpin conformation of the PHY tongue elements maintains the coiled-coil linker in its inhibiting conformational register. Upon red light illumination and isomerization of the biliverdin of one protomer, the dimeric interface of the PSM rearranges leading to more conformational freedom at the PHY interface allowing the population of the stimulating linker register that in turn facilitates GTP conversion at the GGDEF domains.
Author response image 1
Tables
Table 1
Comparison of PadC kinetics of substrate conversion
https://doi.org/10.7554/eLife.34815.007| Comparison of initial rates* @ 200 µM GTP (µmol product min−1 µmol−1 enzyme2) | |||
|---|---|---|---|
| Construct | Dark state | Light state | Fold activation |
| IsPadC (Gourinchas et al., 2017) | 0.8 ± 0.1 | 34.2 ± 0.4 | 44x |
| IsPadCReg1 | 2.13 ± 0.05 | 2.12 ± 0.01 | - |
| IsPadCReg2 | 52 ± 4 | 117 ± 5 | 2.2x |
| IsPadCReg2.a | 53.2 ± 0.4 | 53 ± 3 | - |
-
*Comparison of product formation between the various constructs was performed for initial reaction rates at 200 µM GTP. Initial rates are quantified from experimental triplicates for three time points, and the sample standard deviation of individual points contributed to the error estimation of the linear fit that is used to calculate the initial rate of product formation. The SE of the estimate from the linear regression is used as error indicator.
Additional files
-
Supplementary file 1
- https://doi.org/10.7554/eLife.34815.019
-
Transparent reporting form
- https://doi.org/10.7554/eLife.34815.020
Download links
A two-part list of links to download the article, or parts of the article, in various formats.
Downloads (link to download the article as PDF)
Open citations (links to open the citations from this article in various online reference manager services)
Cite this article (links to download the citations from this article in formats compatible with various reference manager tools)
Asymmetric activation mechanism of a homodimeric red light-regulated photoreceptor
eLife 7:e34815.
https://doi.org/10.7554/eLife.34815


