Oligodendrocytes control potassium accumulation in white matter and seizure susceptibility
- Johns Hopkins University School of Medicine, United States
- Colorado State University, United States
- University Medical Center of the Johannes Gutenberg University, Germany
Figures
Figure 1 with 2 supplements
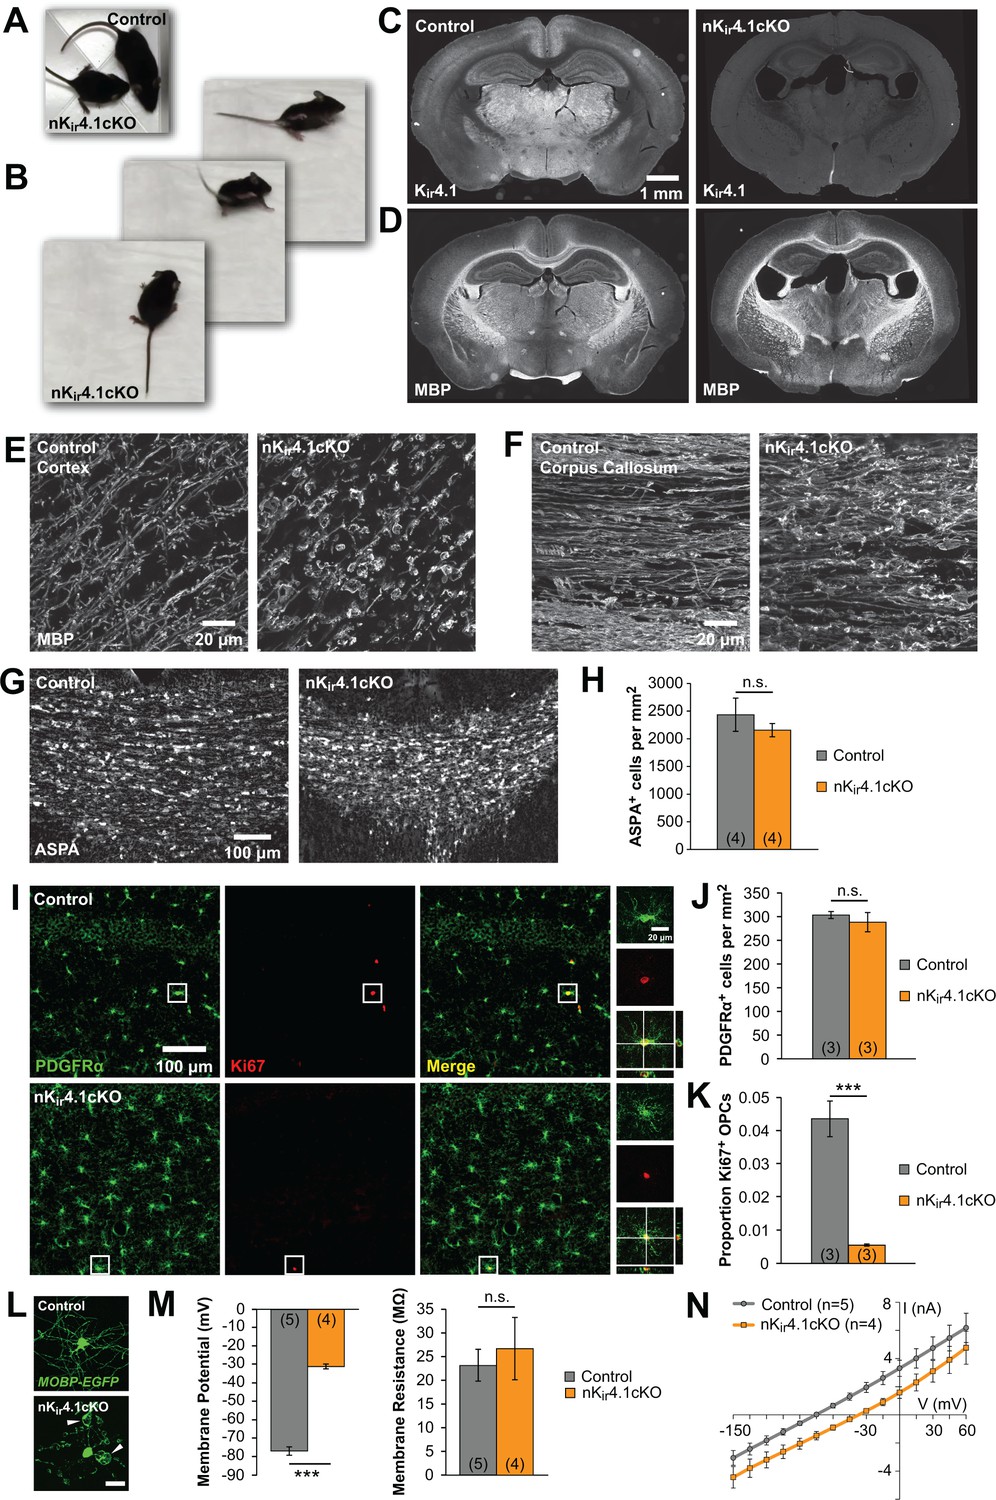
The fate of oligodendroglia following constitutive deletion of Kir4.1 from the CNS.
(A) A P24 Nes-Cre;Kcnj10fl/fl (nKir4.1cKO) mouse and a Nes-Cre;Kcnj10fl/+ (control) littermate. (B) nKir4.1cKO mice display ataxic gate (see Figure 1—video 1). (C) Coronal brain sections from control (left) and nKir4.1cKO (right) mice at P24, immunostained with antibody against Kir4.1. (D) Coronal brain sections from control (left) and nKir4.1cKO (right) mice at P24, immunostained with antibody against Myelin Basic Protein (MBP). (E–F) Higher magnification images of cortex (E) and corpus callosum (F) in control and nKir4.1cKO mice, immunostained for MBP. Images of additional brain regions are included in Figure 1—figure supplement 1. (G) Immunostaining for aspartoacylase (ASPA, a marker of mature oligodendrocytes) in corpus callosum of control (left) and nKir4.1cKO (right) mice. (H) Quantification of ASPA+ cells per mm2 in control (n = 4) and nKir4.1cKO (n = 4) mice. No significant difference in oligodendrocyte density was observed (p=0.60; Student’s t-test). (I) Immunostaining for PDGFRα (green) and Ki67 (red) in hippocampus of control (top row) and nKir4.1cKO (bottom row) mice. Insets show PDGFRα and Ki67 double-immunoreactive cells. (J) Quantification of PDGFRα+ cells per mm2 in hippocampus of control (n = 3) and nKir4.1cKO (n = 3) mice. No significant difference in OPC density was observed (p=0.52; Student’s t-test). (K) Quantification of the proportion of PDGFRα+ cells that were Ki67+ in hippocampus of control (n = 3) and nKir4.1cKO (n = 3) mice. Significantly fewer OPCs were Ki67+ in nKir4.1cKO mice (p=0.002; Student’s t-test). (L) Layer 1 oligodendrocytes in cortex (flat-mount) from Mobp-EGFP (control, top) and nKir4.1cKO;Mobp-EGFP (bottom) mice. Scale bar = 20 μm. White arrowheads indicate large myelin vacuoles. (M) Resting membrane potential and membrane resistance of corpus callosum oligodendrocytes recorded in acute slices from control (Nes-Cre;Mobp-EGFP, n = 5 cells) and nKir4.1cKO (Nes-Cre;Kcnj10fl/fl;Mobp-EGFP, n = 4 cells) mice at P21. nKir4.1cKO oligodendrocytes had a depolarized membrane potential compared to controls (p=7.6 × 10⁻⁷; Student’s t-test), but no significant difference was observed in membrane resistance (p=0.62; Student’s t-test). (N) I-V curves of control (gray) and nKir4.1cKO (orange) corpus callosum oligodendrocytes. nKir4.1cKO cells were depolarized, but maintained a linear I-V curve.
Figure 1—figure supplement 1
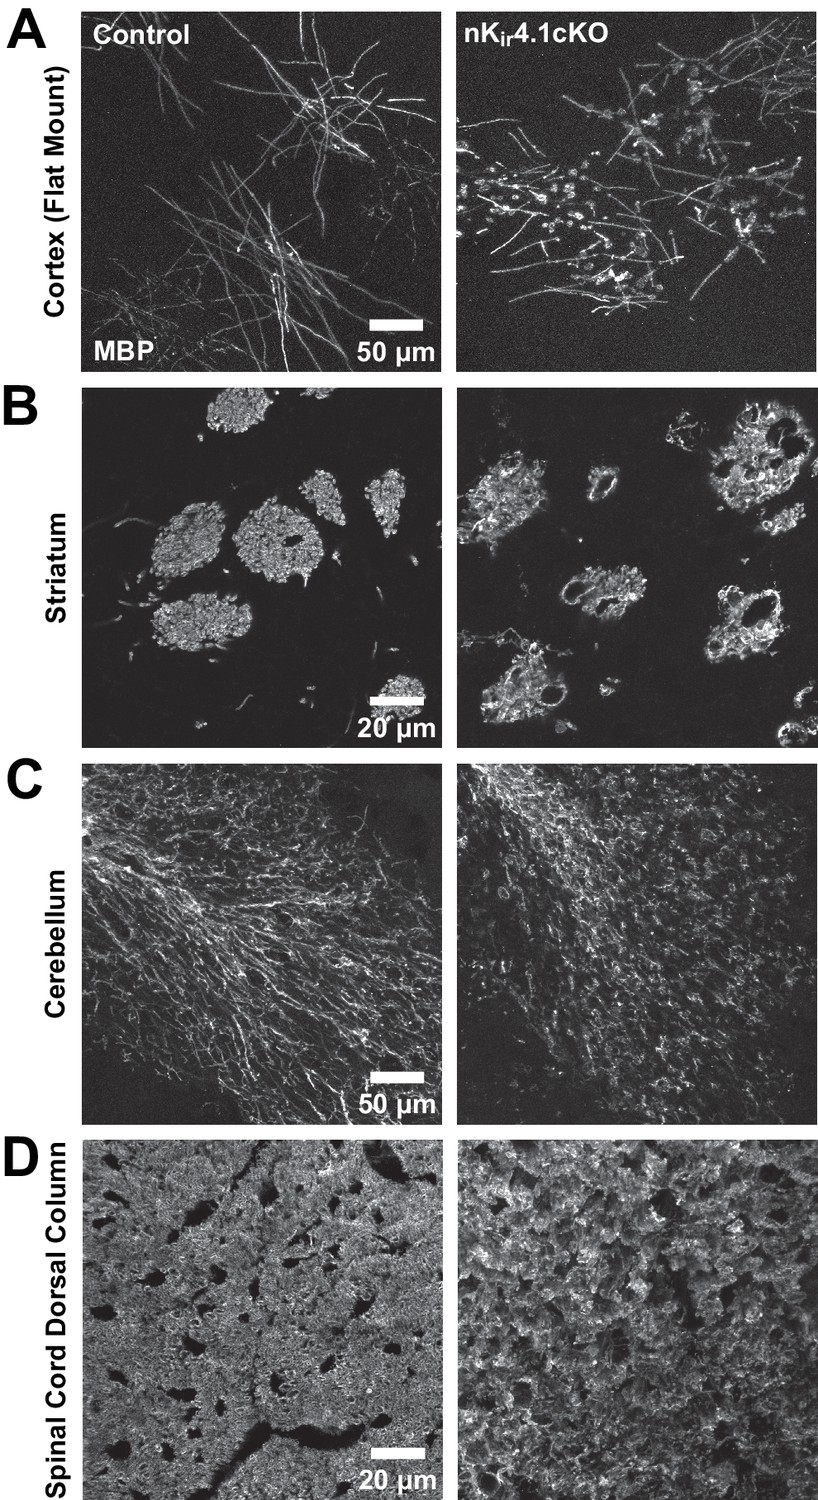
Immunostaining for MBP in layer 1 of cortex (flat mount preparation) (A), striatum (B), cerebellum (C), and spinal cord dorsal column (D) of control and nKir4.1cKO mice.
https://doi.org/10.7554/eLife.34829.003
Figure 1—video 1
Nes-Cre;Kcnj10fl/fl (nKir4.1cKO) mouse at P24 displays an ataxic gait.
https://doi.org/10.7554/eLife.34829.004
Figure 2 with 2 supplements
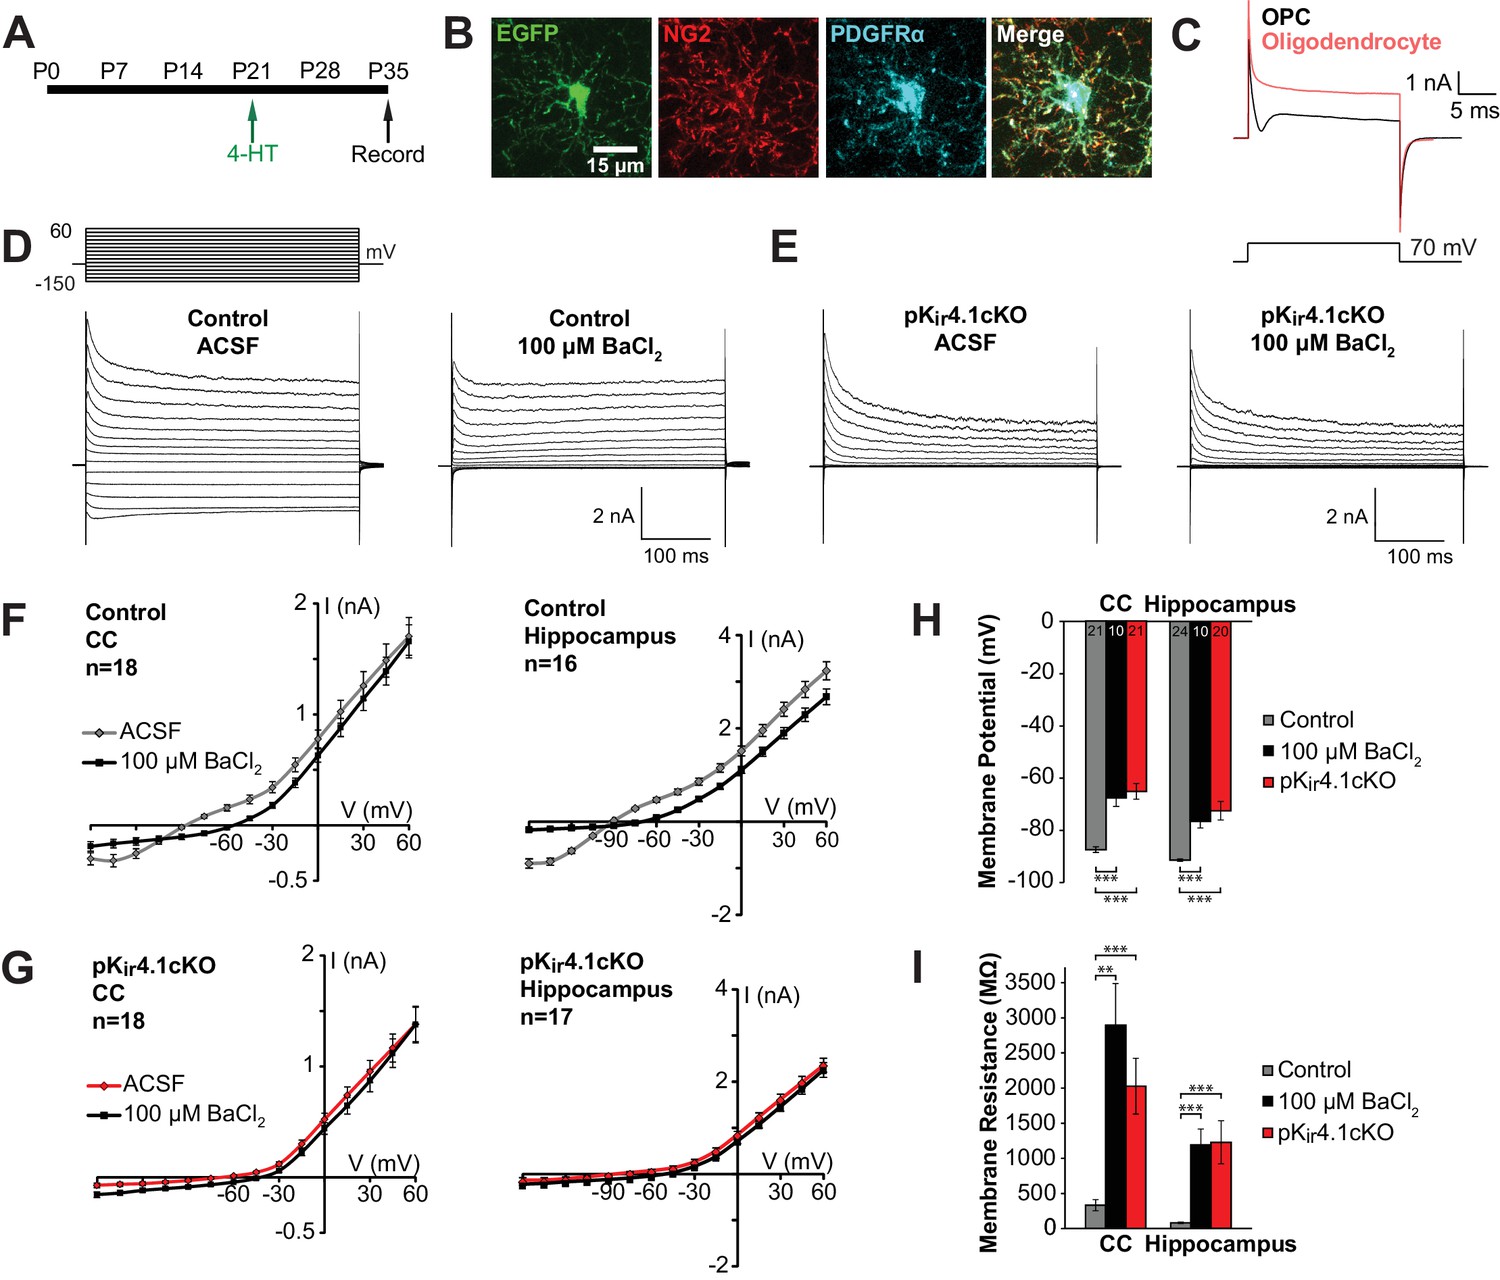
Effect of specific Kir4.1 deletion on the membrane properties of OPCs.
(A) Experimental protocol: 4-hydroxytamoxifen (2 × 1 mg) was administered to Pdgfra-CreER;RCE (control) and Pdgfra-CreER;RCE;Kcnj10fl/fl (pKir4.1cKO) mice i.p. at P21, and mice were sacrificed at P35 for whole cell recording in acute brain slices. (B) Immunostaining in fixed tissue from control mouse showing that EGFP (green) is expressed in OPCs, immunoreactive to NG2 (red) and PDGFRα (blue). (C) Response of an OPC (black) and an oligodendrocyte (red) to a 70 mV depolarizing step. The OPC shows a distinct inward deflection after the initial capacitive current, reflecting activation of voltage-gated sodium channels that are only expressed at the OPC stage. (D) Whole cell recordings from hippocampal OPCs of control mice. Voltage steps (−150 mV to +60 mV, 15 mV intervals) were applied to each cell in regular ACSF and in ACSF +100 μM BaCl2. (E) The same voltage protocol was applied to hippocampal OPCs in pKir4.1cKO mice. (F) Plots showing the I-V relationship of control OPCs in corpus callosum (left, n = 18) and hippocampus (right, n = 16), in regular ACSF (gray) and ACSF +100 μM BaCl2 (black). (G) Plots showing the I-V relationship of pKir4.1cKO OPCs in corpus callosum (left, n = 18) and hippocampus (right, n = 17), in regular ACSF (red) and ACSF +100 μM BaCl2 (black). I-V plots for cortical OPCs are included in Figure 2—figure supplement 1. (H) Quantification of the average resting membrane potential of control OPCs in ACSF (gray, CC: n = 21, Hippocampus: n = 24), control OPCs in 100 μM BaCl2 (black, CC: n = 10, Hippocampus: n = 10), and pKir4.1cKO OPCs (red, CC: n = 21, Hippocampus: n = 20). The three groups are significantly different (CC: F = 27.3, p=1.1 × 10⁻⁸; Hippocampus: F = 19.5, p=5.1 × 10⁻⁷) (one-way ANOVA). Differences between control/ACSF and control/BaCl2 (CC: p=1.3 × 10⁻⁴, Hippocampus: p=1.9 × 10⁻⁴) and between control/ACSF and pKir4.1cKO (CC: p=2.4 × 10⁻⁷, Hippocampus: p=4.0 × 10⁻⁵) are statistically significant (Bonferroni’s test, α = 0.017). CC = corpus callosum. (I) Quantification of membrane resistance of OPCs in (H). The three groups are significantly different (CC: F = 13.2, p=2.7 × 10⁻⁵; Hippocampus: F = 10.8, p=1.2 × 10⁻⁴) (one-way ANOVA). Differences between control/ACSF and control/BaCl2 (CC: p=0.0019, Hippocampus: p=7.7 × 10⁻⁴) and between control/ACSF and pKir4.1cKO (CC: p=3.9 × 10⁻⁴, Hippocampus: p=0.0014) are statistically significant (Bonferroni’s test, α = 0.017). Quantifications of membrane resistance and membrane potential of cortical OPCs are included in Figure 2—figure supplement 1. The distribution of membrane potential and membrane resistance among control and pKir4.1cKO cells, as well as example I-V curves of ‘knockout-like’ and ‘wild-type-like’ pKir4.1cKO OPCs, are included in Figure 2—figure supplement 2.
Figure 2—figure supplement 1
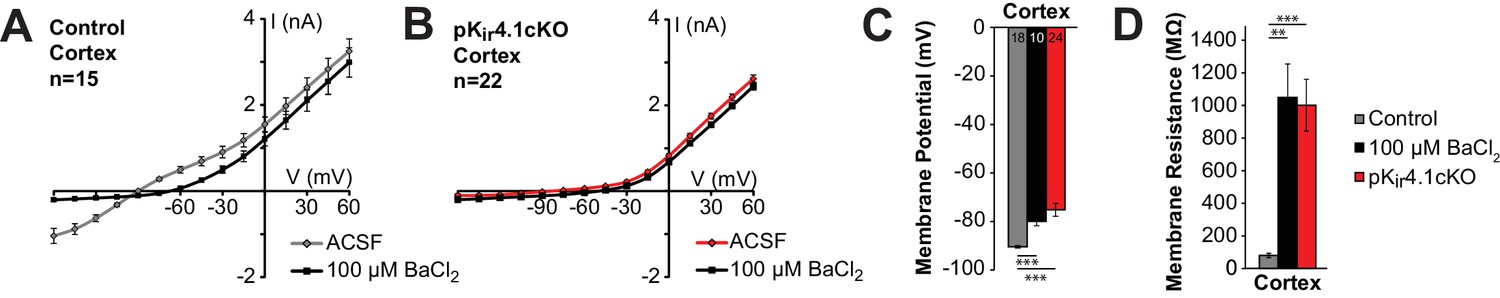
Kir4.1 deletion from cortical OPCs.
(A) I-V plot showing the average current-voltage relationship of control OPCs in cortex (n = 15) in regular ACSF (gray) and ACSF + 100 μM BaCl2 (black). (B) I-V plot showing the average current-voltage relationship of pKir4.1cKO OPCs in cortex (n = 18) in regular ACSF (red) and ACSF + 100 μM BaCl2 (black). (C) Quantification of the average resting membrane potential of control cortical OPCs in ACSF (gray, n = 18), control cortical OPCs in 100 μM BaCl2 (black, n = 10), and pKir4.1cKO cortical OPCs (red, n = 24). The three groups are significantly different (F = 13.9, p=1.7 × 10⁻⁵) (one-way ANOVA). Differences between control/ACSF and control/BaCl2 (p=2.5 × 10⁻⁴) and between control/ACSF and pKir4.1cKO (p=7.0 × 10⁻⁶) are statistically significant (Bonferroni’s test, α = 0.017). (D) Quantification of the average membrane resistance of the same OPCs as in (C). The three groups are significantly different (F = 14.2, p=1.3 × 10⁻⁵) (one-way ANOVA). Differences between control/ACSF and control/BaCl2 (p=0.0010) and between control/ACSF and pKir4.1cKO (p=6.5 × 10⁻⁶) are statistically significant (Bonferroni’s test, α = 0.017).
Figure 2—figure supplement 2
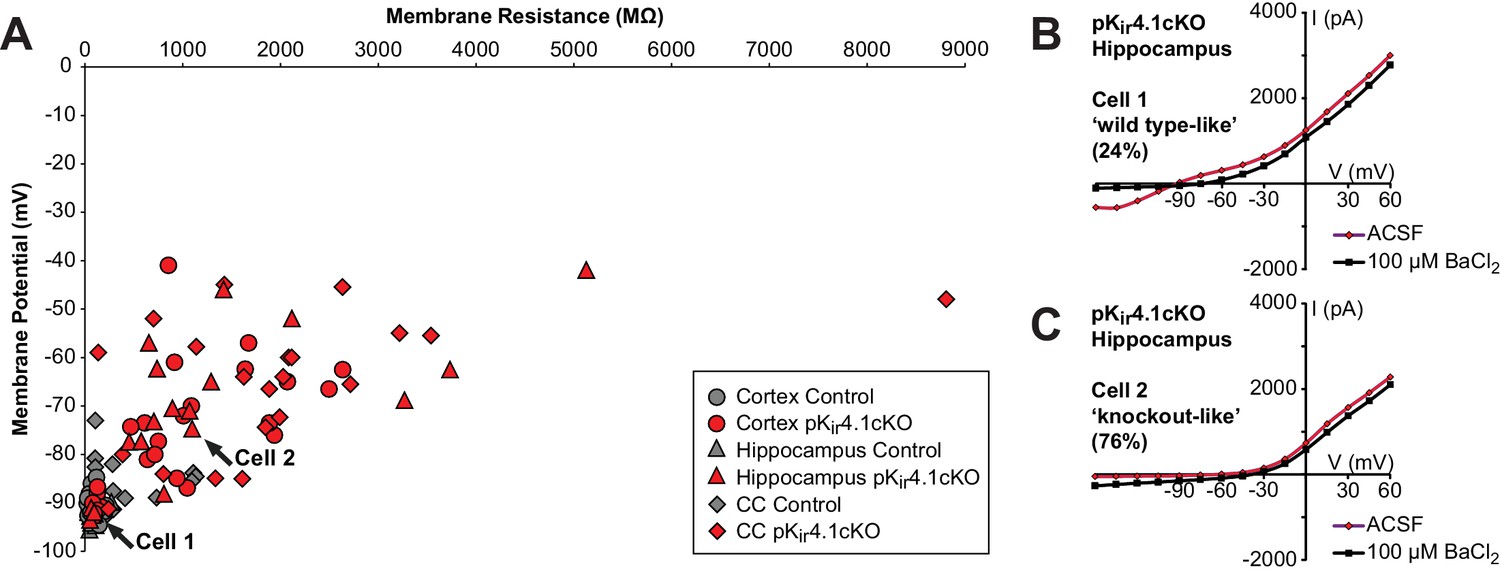
EGFP+ OPCs in pKir4.1cKO animals can be classified in two groups based on membrane currents.
(A) Scatterplot of membrane resistance (X-axis) vs. resting membrane potential (Y-axis) of control (gray) and pKir4.1cKO (red) OPCs in cortex, corpus callosum, and hippocampus. 49/65 (76%) of pKir4.1cKO OPCs, including ‘Cell 2’, displayed increased Rm and depolarized RMP, while 16/65 (24%), including ‘Cell 1’, displayed a wild type-like phenotype. CC = corpus callosum. (B) I-V plot of the cell marked ‘Cell 1’ in (E), in regular ACSF (red), and ACSF +100 μM BaCl2 (black). This pKir4.1cKO cell displays a ‘wild-type-like’ phenotype. (C) I-V plot of the cell marked ‘Cell 2’ in (E), in regular ACSF (red), and ACSF +100 μM BaCl2 (black). This pKir4.1cKO cell displays a ‘knockout-like’ phenotype.
Figure 3 with 3 supplements
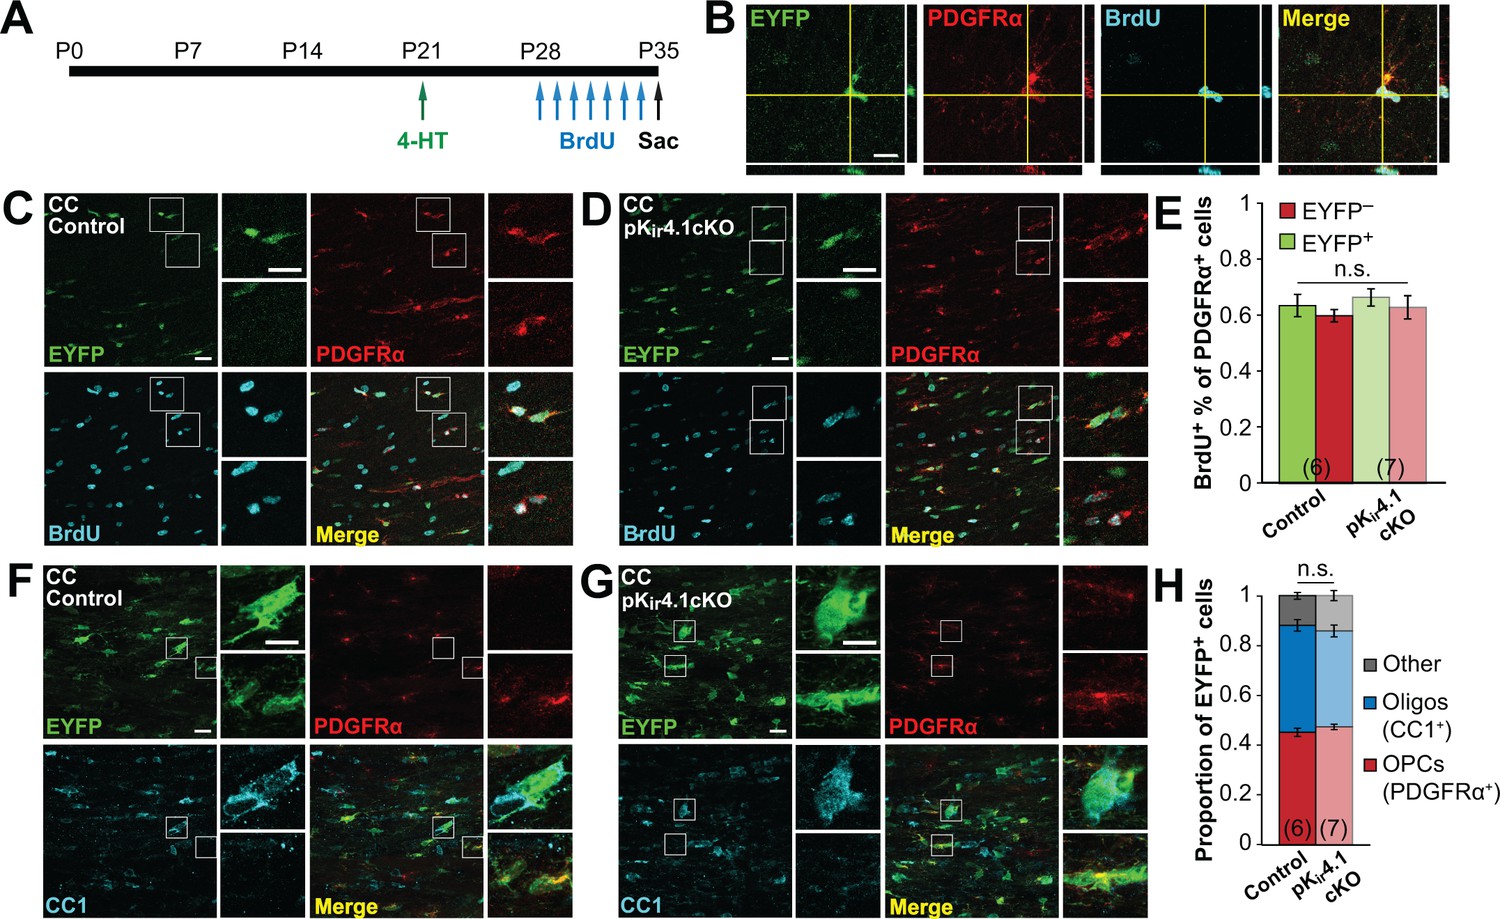
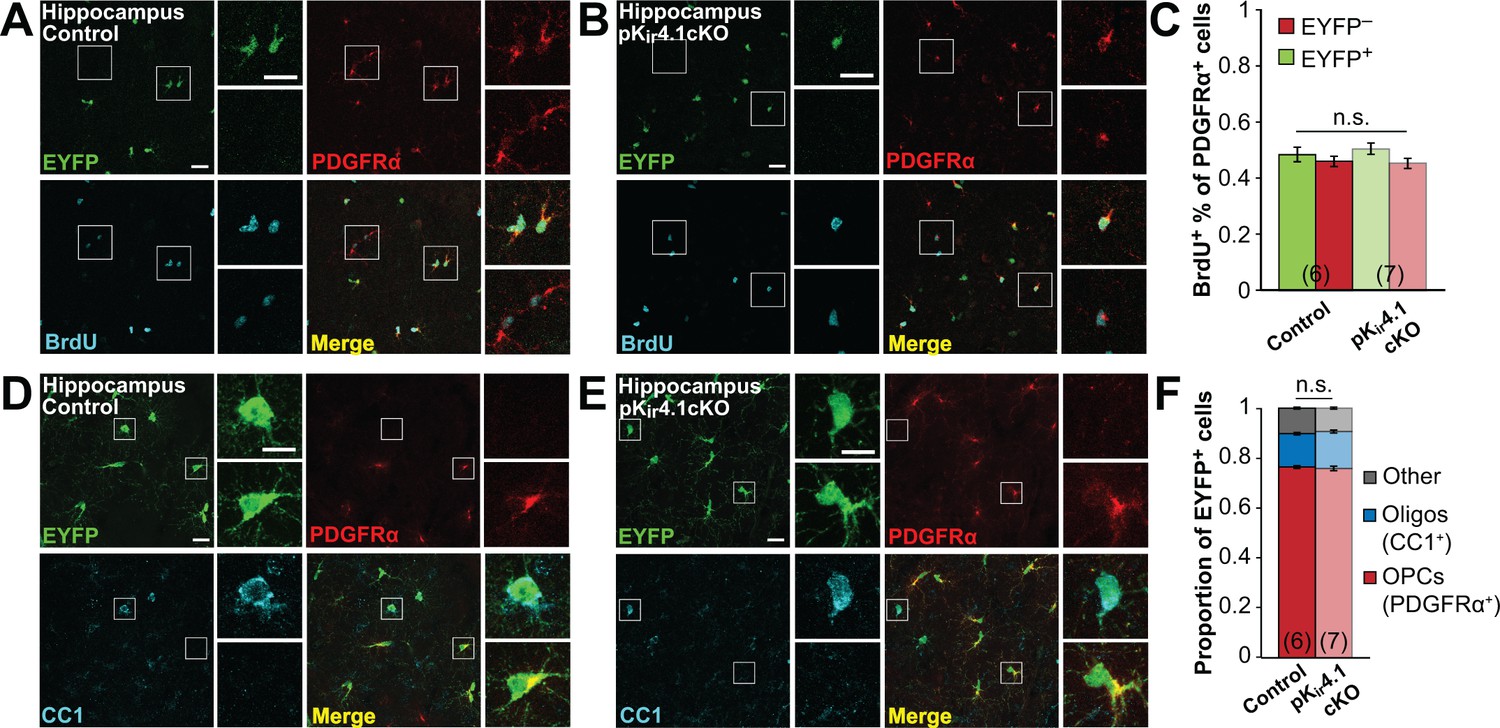
Deletion of Kir4.1 from OPCs does not affect their proliferation or differentiation.
(A) Experimental protocol: 4-hydroxytamoxifen (2 × 1 mg) was administered to Pdgfra-CreER;R2R-EYFP (control) and Pdgfra-CreER;R26R-EYFP;Kcnj10fl/fl (pKir4.1cKO) mice i.p. at P21. BrdU (2 × 50 mg/kg i.p. +1 mg/mL in drinking water) was administered daily from P28-P34, and mice were sacrificed at P35. (B) Immunostaining for EYFP (green), PDGFRα (red), and BrdU (cyan), showing a BrdU+ OPC in the hippocampus of a control mouse. Orthogonal views show colocalization of the signals in the z plane. (C–D) Immunostaining for EYFP (green), PDGFRα (red), and BrdU (cyan) in the corpus callosum of a control (C) and pKir4.1cKO (D) mouse. Top insets show EYFP+ PDGFRα+ BrdU+ OPCs, bottom insets show EYFP− PDGFRα+ BrdU+ OPCs. (E) Quantification of the proportions of EYFP+ and EYFP− PDGFRα+ cells that incorporated BrdU in the corpus callosum of control (n = 6) and pKir4.1cKO (n = 7) mice. There is no significant interaction between genotype and EYFP expression (Finteraction = 9.9 × 10⁻⁵, p=0.99) (two-way ANOVA). All pairwise comparisons between groups are not statistically significant (p>0.008; Bonferroni’s test). (F–G), Immunostaining for EYFP (green), PDGFRα (red), and CC1 (cyan) in the corpus callosum of a control (F) and pKir4.1cKO (G) mouse. Top insets show EYFP+ PDGFRα− CC1+ oligodendrocytes, bottom insets show EYFP+ PDGFRα+ CC1− OPCs. (H) Quantification of the proportions of EYFP+ cells expressing PDGFRα+ (red), CC1+ (blue), or neither (gray) in corpus callosum of control (n = 6) and pKir4.1cKO (n = 7) mice. All pairwise comparisons are not statistically significant (p>0.017; Bonferroni’s test). Recombination efficiencies of the Rosa-CAG-EGFP and R26R-EYFP reporter lines are compared in Figure 3—figure supplement 1. OPC densities in control and pKir4.1cKO mice are quantified in Figure 3—figure supplement 2. Analysis of OPC proliferation and differentiation in hippocampus is included in Figure 3—figure supplement 3.
Figure 3—figure supplement 1
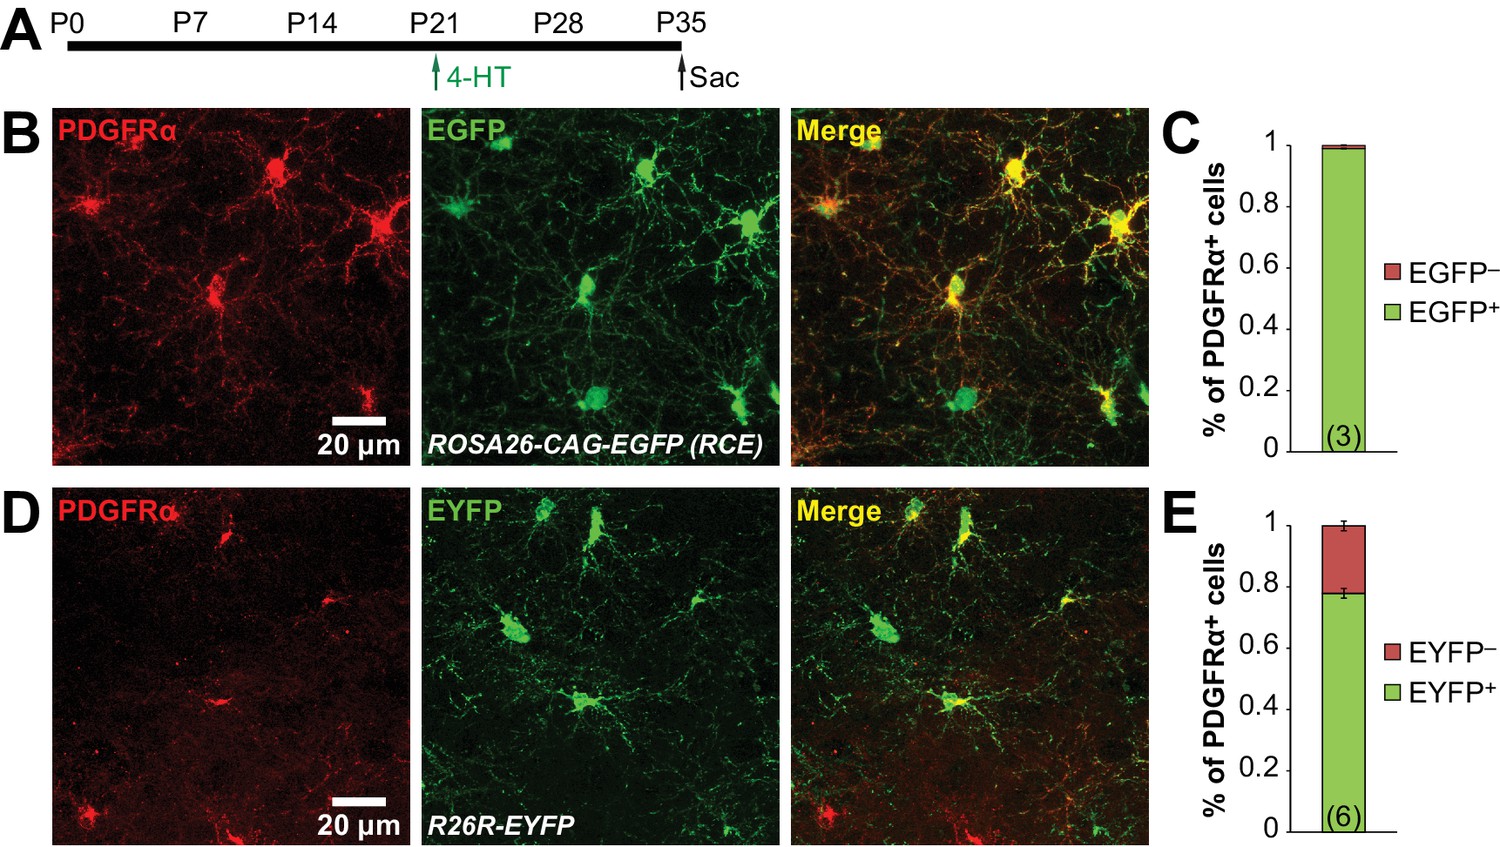
Recombination efficiencies of ROSA26-CAG-EGFP and R26R-EYFP reporter lines.
(A) Protocol for 4-HT injection. Pdgfra-CreER;RCE (n = 3) and Pdgfra-CreER;R26R-EYFP (n = 6) animals were injected i.p. with 2 × 1 mg 4-HT at P21, and sacrificed at P35 for histologial analysis. (B) Immunostaining for PDGFRα (red) and EGFP (green) in hippocampus of a Pdgfra-CreER;RCE mouse. (C) Quantification of the proportion of PDGFRα+ cells that are EGFP+ (green) and EGFP− (red) in the hippocampus of Pdgfra-CreER;RCE mice. 99.0 ± 0.1% of PDGFRα+ cells are EGFP+. (D) Immunostaining for PDGFRα (red) and EYFP (green) in hippocampus of a Pdgfra-CreER; R26R-EYFP mouse. (E) Quantification of the proportion of PDGFRα+ cells that are EYFP+ (green) and EYFP− (red) in the hippocampus of Pdgfra-CreER;R26R-EYFP mice. 78.0 ± 1.6% of PDGFRα+ cells are EYFP+.
Figure 3—figure supplement 2
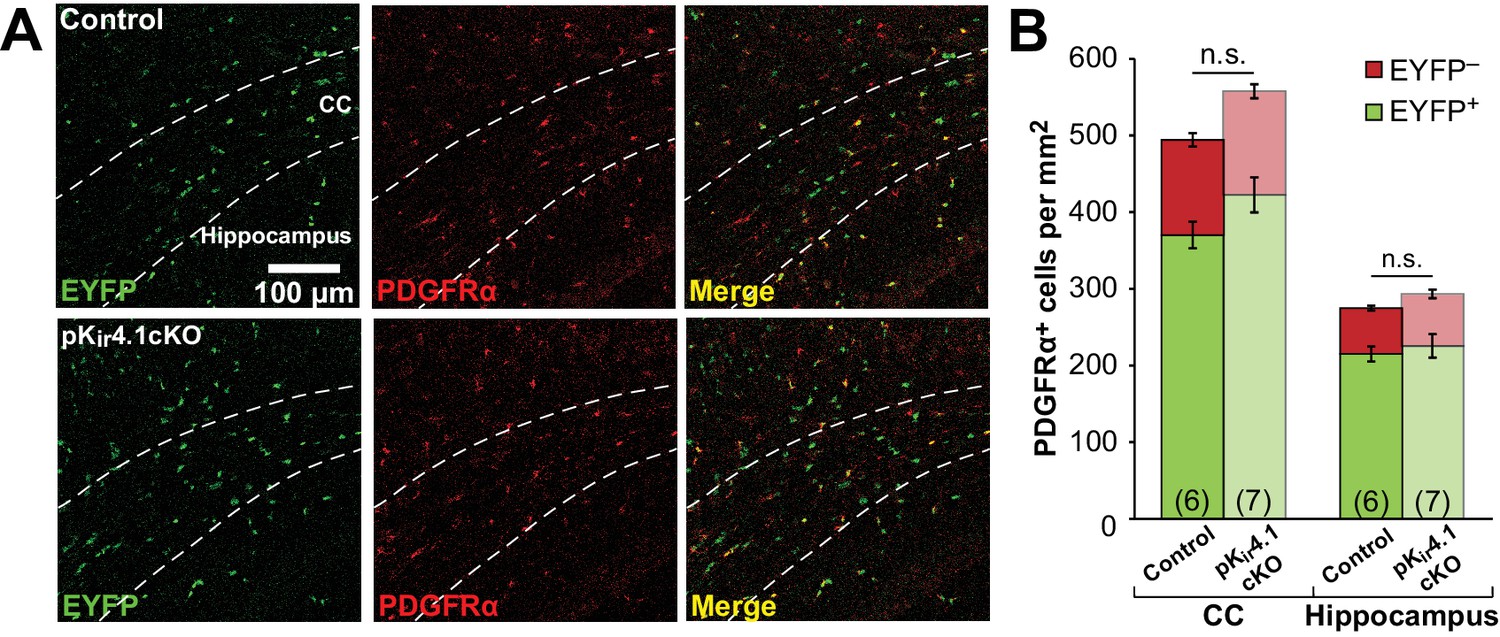
Deletion of Kir4.1 from OPCs does not affect their density.
(A) Immunostaining for EYFP (green) and PDGFRα (red) in brain sections from control (top) and pKir4.1cKO (bottom) mice. Dashed lines demarcate the corpus callosum (CC). (B) Quantification of the density of EYFP+ PDGFRα+ (green) and EGFP− PDGFRα+ (red) cells in the corpus callosum and hippocampus of control (n = 6) and pKir4.1cKO (n = 7) mice. No significant differences were observed in the overall density or in the EYFP+ proportion of PDGFRα+ cells.
Figure 3—figure supplement 3
OPC proliferation and differentiation in hippocampus.
(A–B) Immunostaining for EYFP (green), PDGFRα (red), and BrdU (cyan) in the hippocampus of a control (A) and pKir4.1cKO (B) mouse. Top insets show EYFP+ PDGFRα+ BrdU+ OPCs, bottom insets show EYFP− PDGFRα+ BrdU+ OPCs. (C) Quantification of the proportions of EYFP+ and EYFP− PDGFRα+ cells that have incorporated BrdU in the hippocampus of control (n = 6) and pKir4.1cKO (n = 7) mice. There is no significant interaction between genotype and EYFP expression (Finteraction = 0.44, p=0.51) (two-way ANOVA). All pairwise comparisons between groups are not statistically significant (p>0.008; Bonferroni’s test). (D–E) Immunostaining for EYFP (green), PDGFRα (red), and CC1 (cyan) in hippocampus of a control (D) and pKir4.1cKO (E) mouse. Top insets show EYFP+ PDGFRα− CC1+ oligodendrocytes, bottom insets show EYFP+ PDGFRα+ CC1− OPCs. (F) Quantification of the proportions of EYFP+ cells expressing PDGFRα+ (red), CC1+ (blue), or neither (gray) in hippocampus control (n = 6) and pKir4.1cKO (n = 7) mice. All pairwise comparisons are not statistically significant (p>0.017; Bonferroni’s test).
Figure 4 with 4 supplements
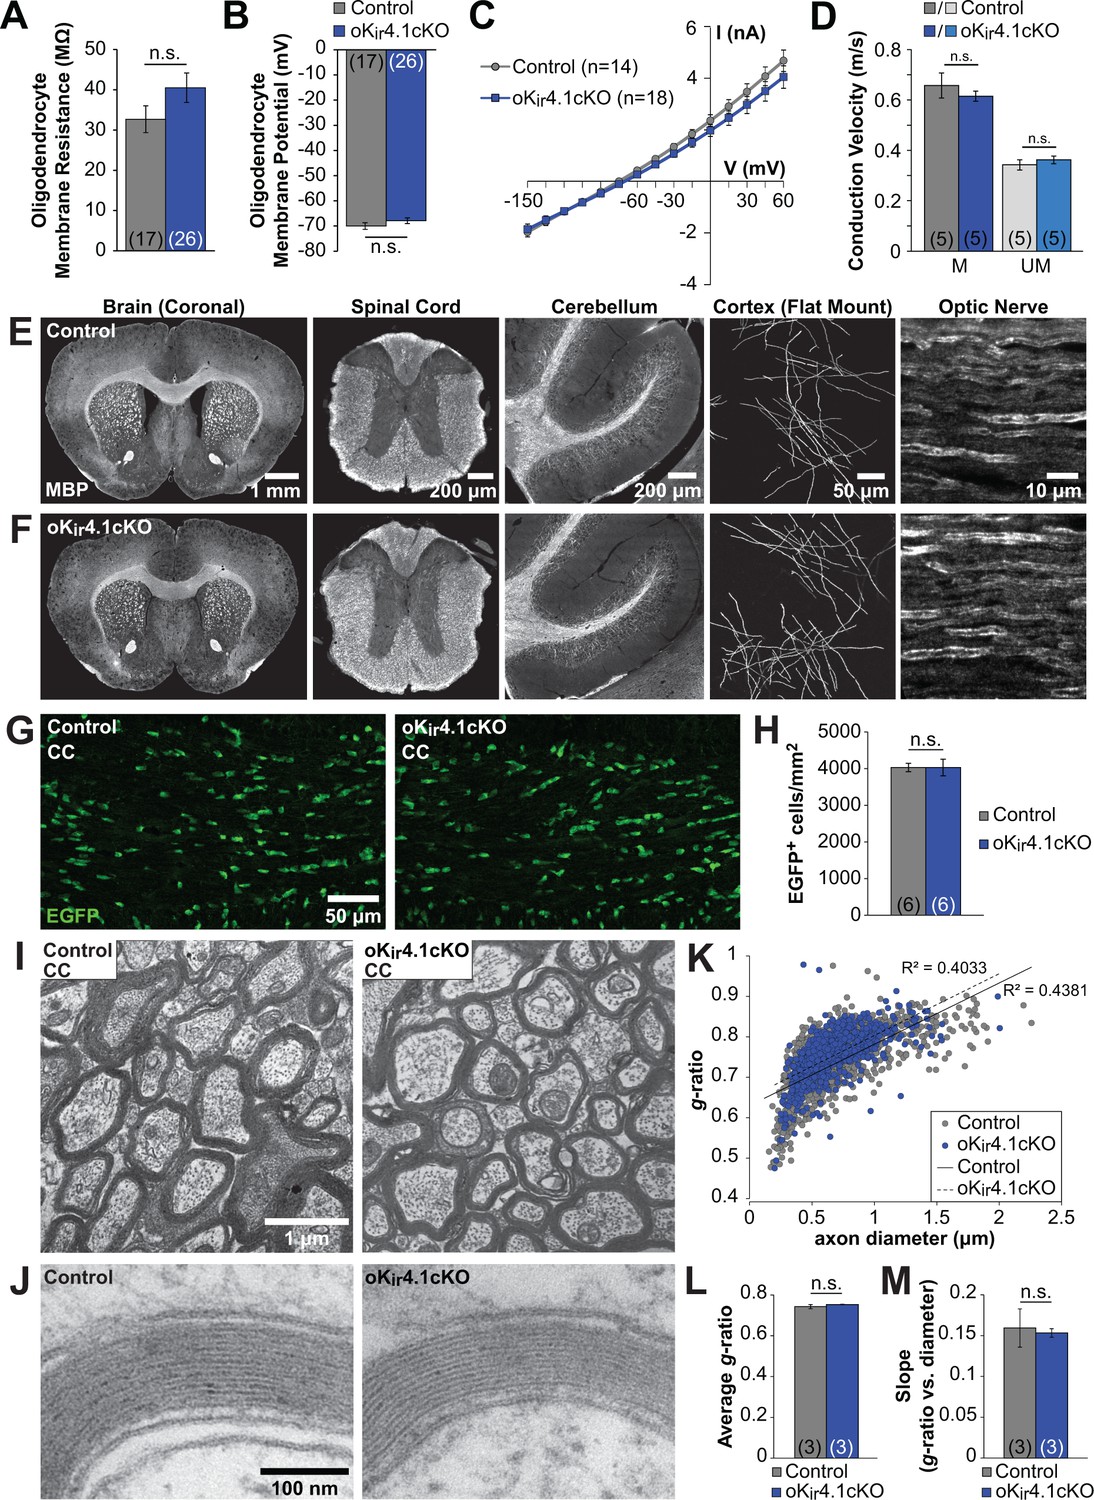
Oligodendrocyte membrane properties and myelin are preserved following selective Kir4.1 deletion.
(A) Membrane resistance of corpus callosum oligodendrocytes recorded in acute slices from control (Mog-iCre;RCE, n = 17 cells) and oKir4.1cKO (Mog-iCre;RCE;Kcnj10fl/fl, n = 26 cells) mice at 5 to 6 weeks of age. No significant difference was observed in membrane resistance (p=0.22; Student’s t-test). (B) Resting membrane potential of corpus callosum oligodendrocytes recorded in acute slices from control and oKir4.1cKO mice at 5 to 6 weeks of age. No significant difference was observed in resting membrane potential (p=0.25; Student’s t-test). (C) I-V curves of control (n = 14) and oKir4.1cKO (n = 18) corpus callosum oligodendrocytes at 5 to 6 weeks of age. Kir4.1 deletion did not significantly affect the current-voltage relationship. (D) Quantification of average conduction velocity of myelinated (M) and unmyelinated (UM) axons, measured via extracellular field recordings of compound action potentials in the corpus callosum of control (gray, n = 5 slices from two mice) and oKir4.1cKO (blue, n = 5 slices from two mice) animals. No significant differences in conduction velocity were observed (M: p=0.42, UM: p=0.37; Student’s t-test). (E) Tissue sections from a 10-week-old control animal immunostained for MBP (left to right: whole brain (coronal), thoracic spinal cord (transverse), cerebellum (sagittal), layer 1 of cortex (flat mount), optic nerve (longitudinal)). (F) Tissue sections from a 10-week-old oKir4.1cKO animal immunostained for MBP. Same regions as in (E). (G) Immunostaining for EGFP in corpus callosum of 10-week-old control (left) and oKir4.1cKO (right) mice. (H) Quantification of the density of EGFP+ oligodendrocytes in the corpus callosum of control (n = 6) and oKir4.1cKO (n = 6) mice. No significant difference was observed (p=0.997; Student’s t-test). (I) Transmission electron micrographs showing myelinated axons in the corpus callosum of 10-week-old control and oKir4.1cKO mice. (J) Higher-magnification micrographs showing compact myelin in control and oKir4.1cKO mice. (K) Scatterplot of the relationship between axon diameter (X-axis) and myelin g-ratio (diameter of axon/diameter of axon + myelin) (Y-axis). 1103 axons from three control animals (gray) and 692 axons from 3 oKir4.1cKO animals (blue) were analyzed. Solid line = linear regression of control data, R2 = 0.4831. Dashed line = linear regression of oKir4.1cKO data, R2 = 0.4033. (L) Average g-ratio of corpus callosum axons from control (n = 3) and oKir4.1cKO (n = 3) animals. No significant difference was observed (p=0.38; Student’s t-test). (M) Average value of the slope of the linear regression (axon diameter vs. g-ratio) from control (n = 3) and oKir4.1cKO (n = 3) animals. No significant difference was observed (p=0.81; Student’s t-test). Quantitative RT-PCR demonstrating reduced Kir4.1 expression in oKir4.1cKO oligodendrocytes is included in Figure 4—figure supplement 1. The effect of application of BaCl2 to control and oKir4.1cKO oligodendrocytes is shown in Figure 4—figure supplement 2. Example traces from extracellular field recordings measuring corpus callosum axon conduction velocity are included in Figure 4—figure supplement 3. Immunostaining for SMI32 and GFAP in oKir4.1cKO mice is included in Figure 4—figure supplement 4.
Figure 4—figure supplement 1
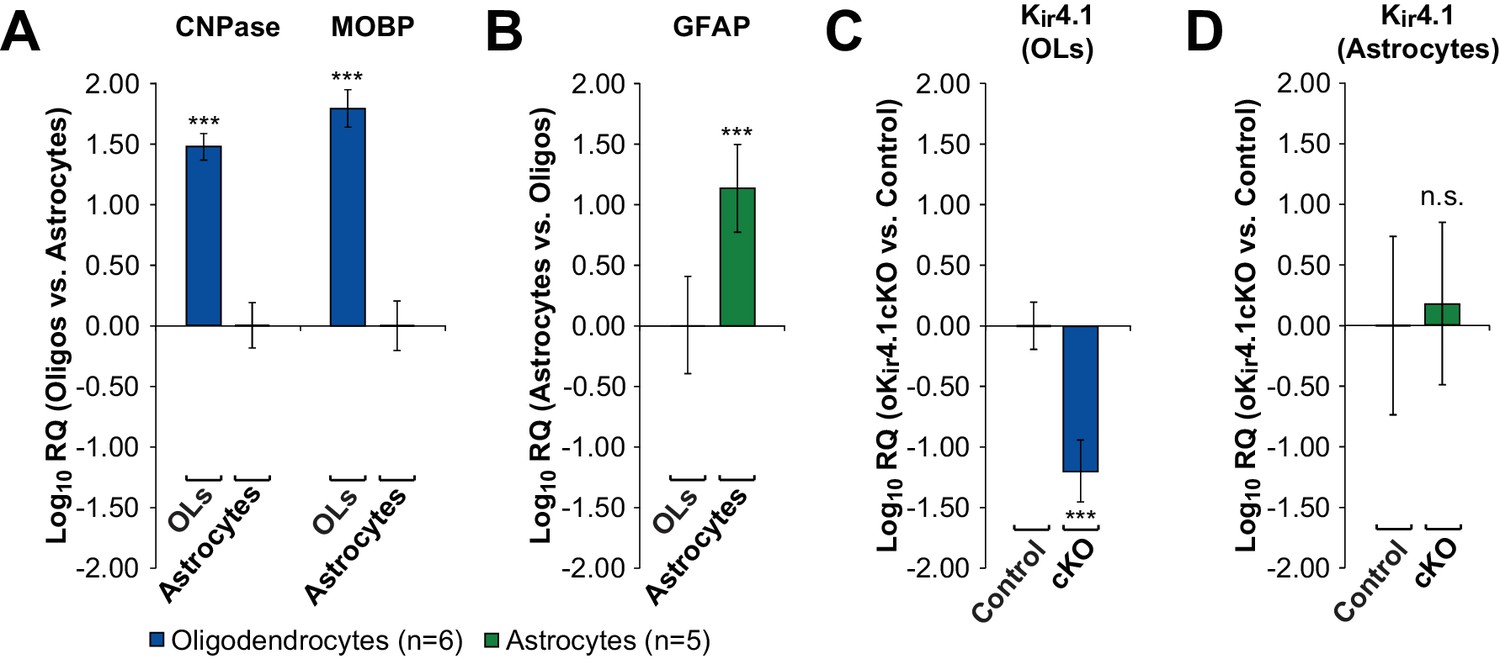
Genetic deletion of Kir4.1 specifically from oligodendrocytes.
(A) Relative quantity of CNPase and MOBP mRNA (expressed in log10) between FACS-sorted EGFP+ oligodendrocytes from Mog-iCre;RCE mice (n = 6) and FACS-sorted EGFP+ astrocytes from Mog-iCre;Slc1a2-EGFP mice (n = 5). GAPDH mRNA transcript levels were used to normalize each sample prior to comparison. Oligodendrocytes had significantly higher levels of CNPase (RQ = 30.3, 95% CI = 23.5–39.1) and MOBP (RQ = 62.2, 95% CI = 43.5–88.9) mRNA than astrocytes. (B) Relative quantity of GFAP mRNA between FACS-sorted EGFP+ astrocytes from Mog-iCre;Slc1a2-EGFP mice (n = 5) and FACS-sorted EGFP+ oligodendrocytes from Mog-iCre;RCE mice (n = 6). Astrocytes had significantly higher levels of GFAP mRNA than oligodendrocytes (RQ = 13.5, 95% CI = 5.8–31.3). (C) Relative quantity of Kir4.1 mRNA between FACS-sorted EGFP+ oligodendrocytes from Mog-iCre;RCE; Kcnj10fl/fl (oKir4.1cKO) mice (n = 3) and Mog-iCre;RCE (control) mice (n = 3). oKir4.1cKO oligodendrocytes had significantly lower levels of Kir4.1 mRNA than control oligodendrocytes (RQ = 0.063, 95% CI = 0.035–0.112). (D,) Relative quantity of Kir4.1 mRNA between FACS-sorted EGFP+ astrocytes from Mog-iCre; Kcnj10fl/fl;Slc1a2-EGFP (oKir4.1cKO) mice (n = 3) and Mog-iCre;Slc1a2-EGFP (control) mice (n = 2). oKir4.1cKO and control astrocytes did not have significantly different Kir4.1 mRNA levels (RQ = 1.52, 95% CI = 0.32–7.10). *=p < 0.05, **=p < 0.01, ***=p < 0.001 (Student’s t-test).
Figure 4—figure supplement 2

Effect of barium on oligodendrocyte membrane resistance.
(A) Membrane resistance of oligodendrocytes in the corpus callosum and alveus of control (gray, n = 25) or oKir4.1cKO (blue, n = 32) mice, in ACSF (gray/blue) and 100 µM BaCl2 (black). Membrane resistance was recorded at −80 mV with a 10 mV voltage step. BaCl2 significantly increased the membrane resistance of control (p=6.8 × 10⁻⁵, paired Student’s t-test) and oKir4.1cKO (p=1.5 × 10⁻⁶, paired Student’s t-test) oligodendrocytes. (B) There was no significant difference in the effect of application of BaCl2 on the membrane resistance of control (gray) and oKir4.1cKO (blue) oligodendrocytes (p=0.33, Student’s t-test).
Figure 4—figure supplement 3
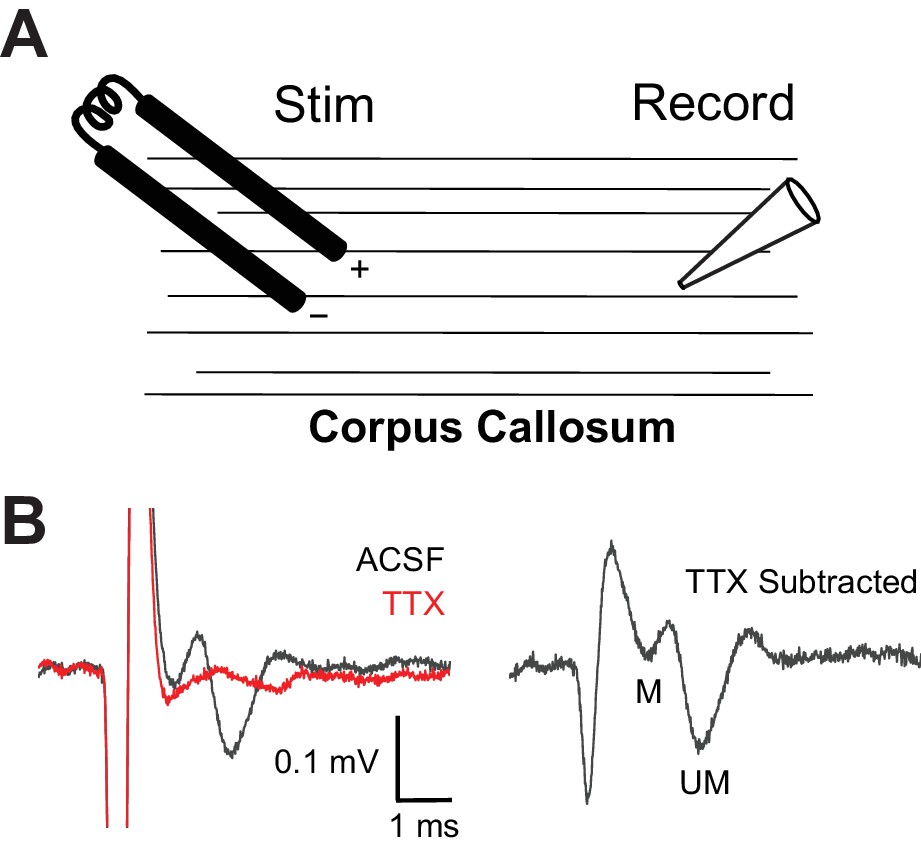
Example of extracellular field recordings in corpus callosum.
(A) Schematic depiction of recording set-up: extracellular field recordings were made in the corpus callosum, while axons were stimulated at a distance of 0.5–1 mm. (B) Example of a corpus callosum compound action potential (CAP). TTX was applied after each recording (red trace), and TTX traces were subtracted from CAP traces to reduce the stimulus artifact (right). The CAP consists of two negative waves, the first representing action potentials from myelinated axons (M), and the second representing action potentials from unmyelinated axons (UM).
Figure 4—figure supplement 4

Kir4.1 deletion from oligodendrocytes does not lead to axon degeneration.
(A–B) Immunostaining for non-phosphorylated neurofilament (SMI32) in the brains of control (A) and oKir4.1cKO (B) mice. Right: higher magnification images of corpus callosum. No SMI32+ axons were observed in corpus callosum of six control and six oKir4.1cKO mice. (C–D) Immunostaining for GFAP in the brains of control (C) and oKir4.1cKO (D) mice. Right: higher magnification images of corpus callosum. There was no evidence of reactive astrocytosis in three oKir4.1cKO mice examined.
Figure 5 with 1 supplement
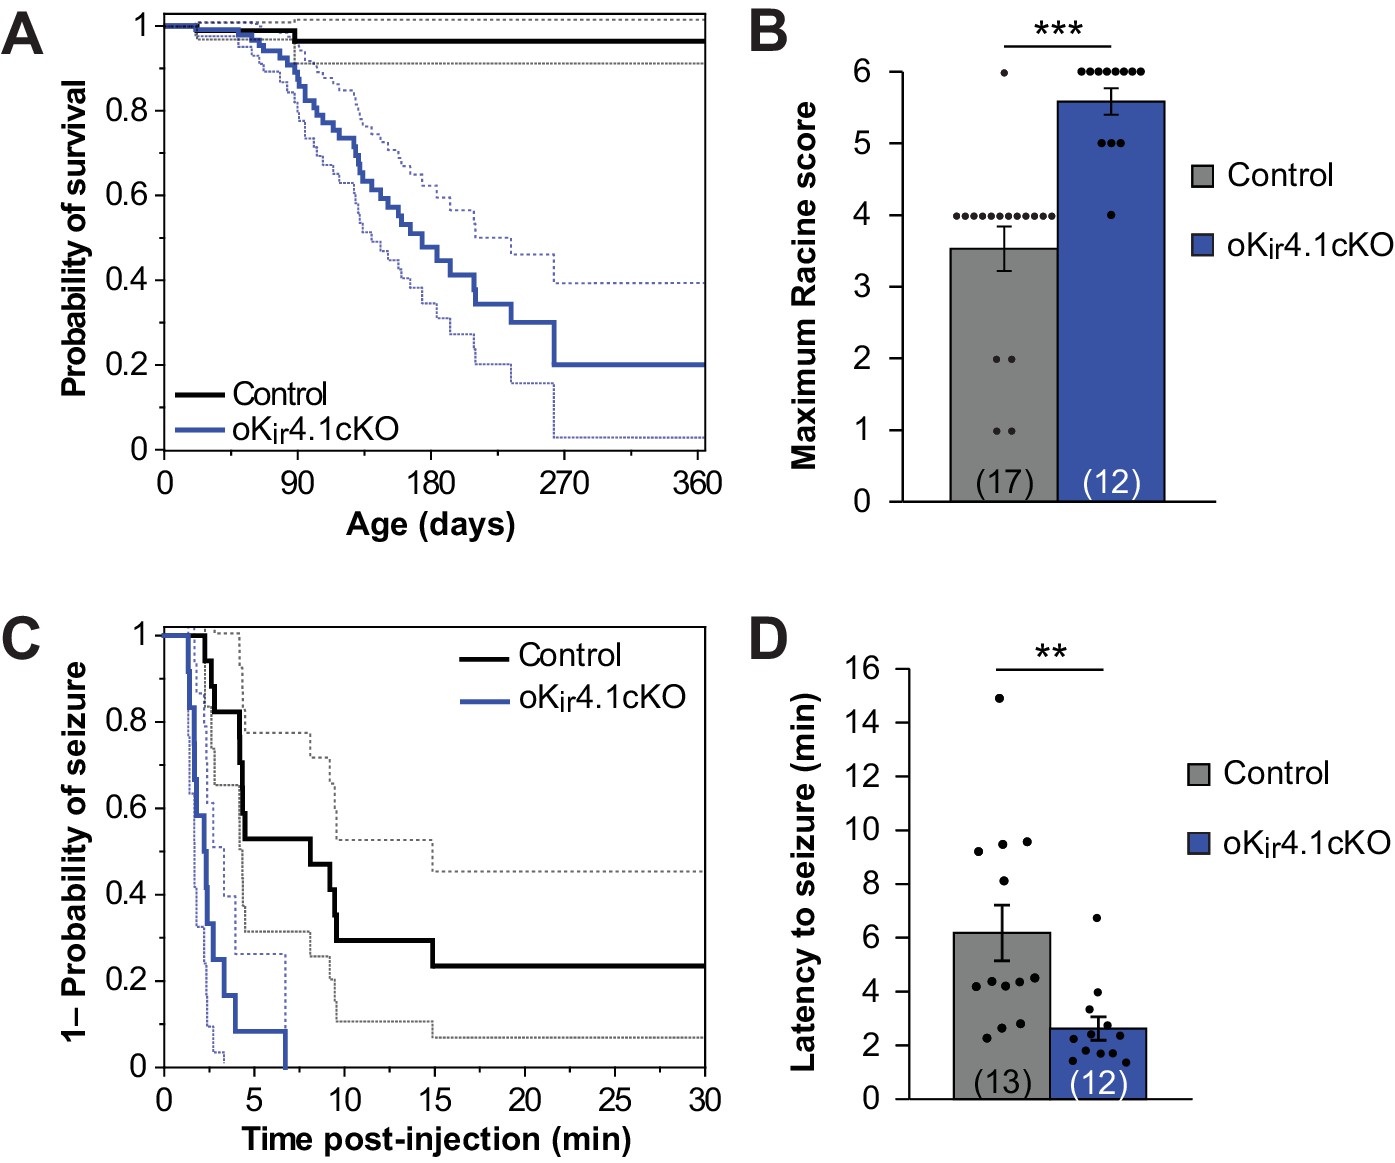
Kir4.1 deletion from oligodendrocytes results in early mortality and reduced seizure threshold.
(A) Kaplan-Meier curve showing the probability of survival of control (black) vs. oKir4.1cKO (blue) mice from birth to one year of age. Dashed lines represent the 95% confidence interval. oKir4.1cKO mice have significantly shorter survival than controls (p=6.8 × 10⁻⁷; log-rank test). Mice sacrificed for experimental use were censored on the date of sacrifice. Analysis is based on a total of 113 control and 129 oKir4.1cKO mice. (B) Maximum seizure score achieved by control (n = 17) and oKir4.1cKO (n = 12) mice 30 min following PTZ (40 mg/kg) injection. oKir4.1cKO mice reached significantly higher seizure scores than controls (U = –4.36, p=3.6 × 10⁻⁵; Mann Whitney test). (C) Kaplan-Meier curve showing probability of (score ≥3) seizure-free survival between PTZ injection and 30 minutes post-injection. Dashed lines represent the 95% confidence interval. oKir4.1cKO mice (n = 12) had significantly shorter seizure-free survival than controls (n = 17) (p=1.2 × 10⁻⁵; log-rank test). (D) Mean latency to maximal seizure among mice reaching a seizure score of 3 and above (n = 13 control, n = 12 oKir4.1cKO). oKir4.1cKO mice had significantly shorter latency to seizure (p=0.006, Student’s t-test).
Figure 5—video 1
Control and oKir4.1cKO mice undergoing PTZ-induced seizures.
Time displayed is time after PTZ injection. The control mouse (first) displays a typical modified Racine stage four seizure, with myoclonic jerks, rearing, and falling over onto the side. The oKir4.1cKO mouse (second) displays a typical Racine stage five seizure, with full limb extension.
Figure 6 with 1 supplement

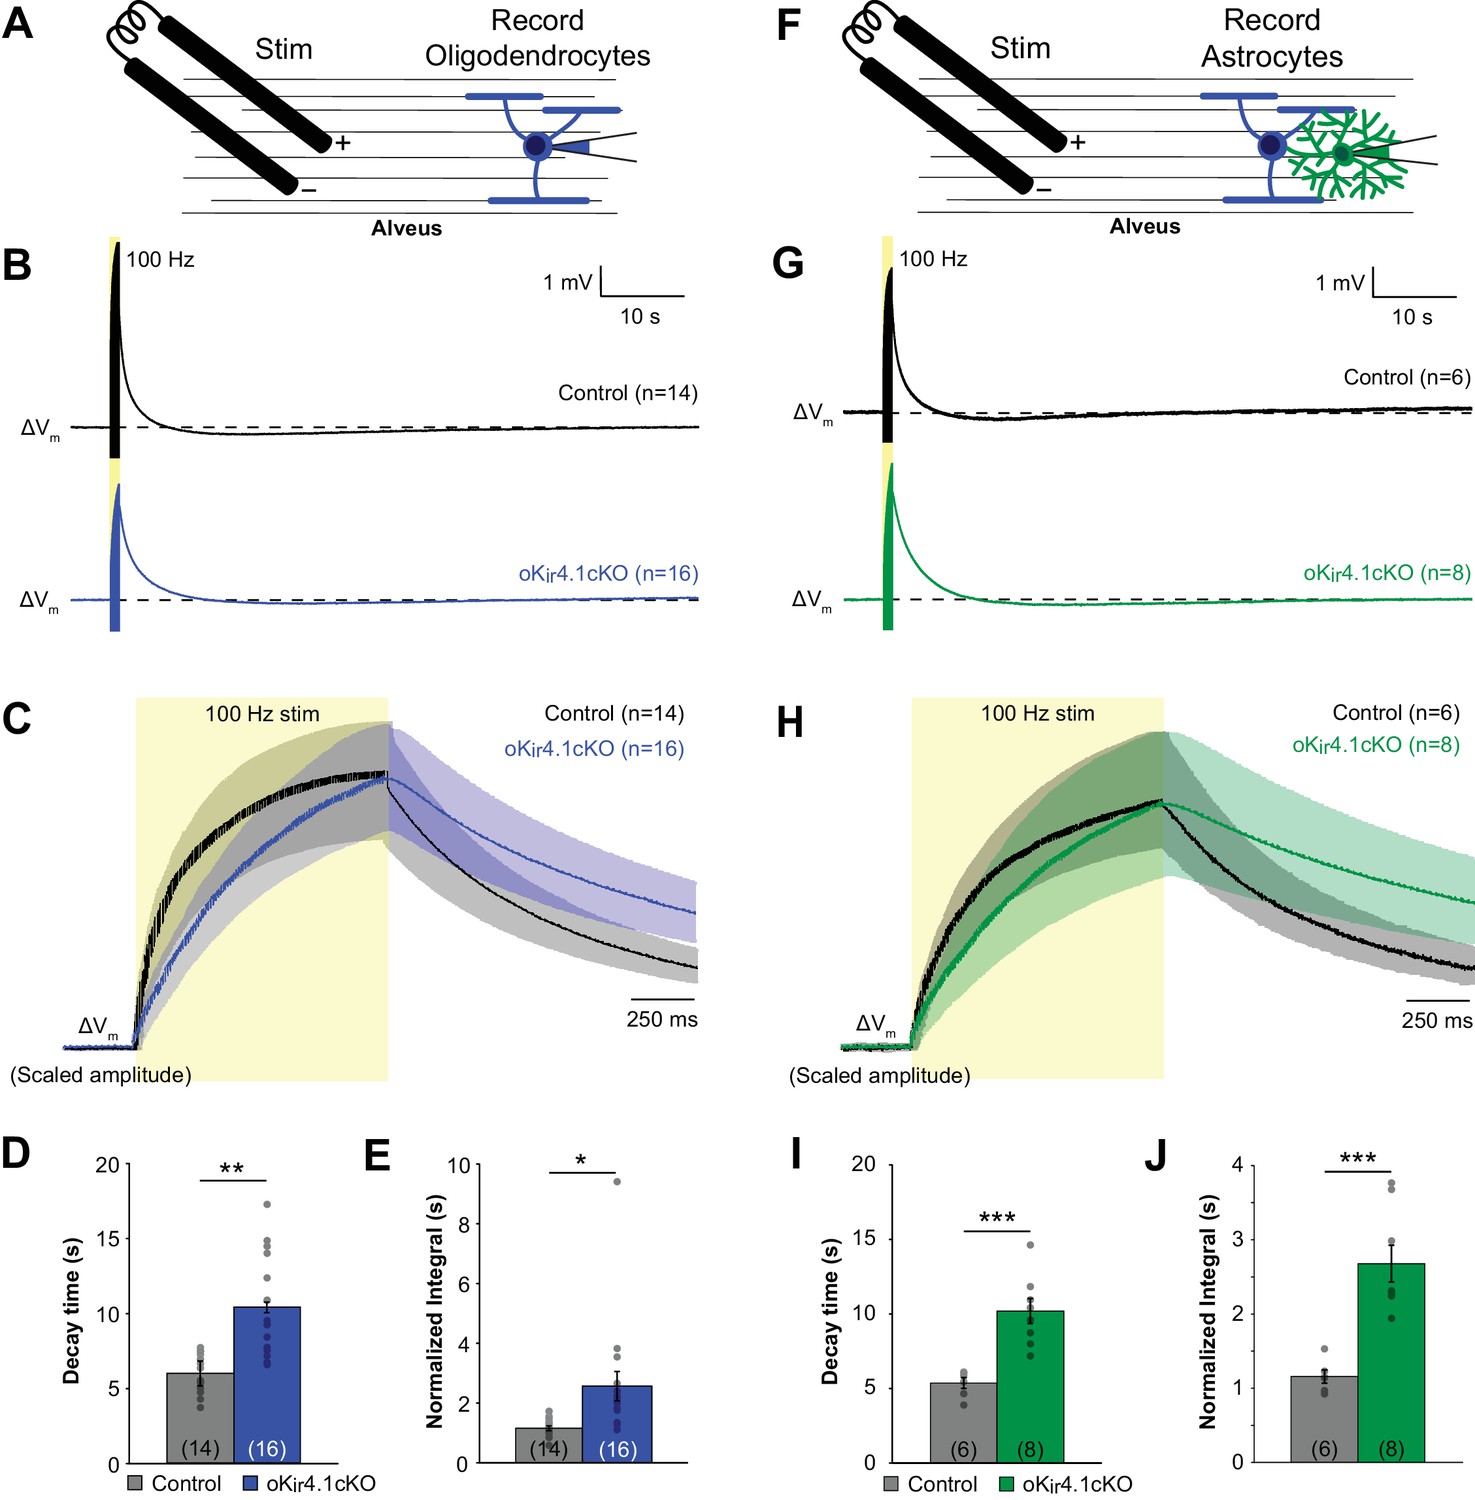
K+ clearance after high-frequency stimulation of corpus callosum axons is impaired following deletion of Kir4.1 from oligodendrocytes.
(A) Recording set-up: EGFP+ oligodendrocytes in the corpus callosum were targeted for whole cell recording in control; RCE and oKir4.1cKO;RCE mice. Axons were stimulated at 100 Hz for 1 s with a bipolar electrode at a distance of ~200 μm. (B) Membrane potential changes of oligodendrocytes recorded in current clamp mode during and after 100 Hz stimulation. Shown are averaged responses of cells from control mice (black, n = 15), oKir4.1cKO mice (blue, n = 15), and control mice in the presence of 1 μM TTX (red, n = 7). Dashed line represents baseline RMP. (C) Average responses of control and oKir4.1cKO oligodendrocytes in (B) shown on an expanded time scale to highlight membrane potential changes during and immediately after stimulation. Response amplitudes are scaled to the same value at the end of stimulation to facilitate comparison of response kinetics. Stimulation artifacts have been eliminated for clarity. (D) Quantification of the average decay time, defined as the time from the end of stimulation until the membrane potential first crosses its initial baseline value. This value is independent of response amplitude. oKir4.1cKO oligodendrocytes (n = 15) had significantly longer decay times than control oligodendrocytes (n = 15, p=0.0017; Student’s t-test). (E) Quantification of the average normalized integral, defined as the area under the curve from the end of stimulation until the membrane potential first crosses the baseline, divided by the peak amplitude. oKir4.1cKO oligodendrocytes had significantly greater normalized integral than control oligodendrocytes (p=0.0022; Student’s t-test). (F) EGFP+ astrocytes in the corpus callosum were targeted for whole cell recording in control;Slc1a2-EGFP and oKir4.1cKO;Slc1a2-EGFP mice. Same protocol as in (A). (G) Membrane potential changes of astrocytes recorded in current clamp mode during and after 100 Hz stimulation. Shown are averaged responses of cells from control mice (black, n = 7), oKir4.1cKO mice (green, n = 5), and control mice in the presence of 1 μM TTX (red, n = 6). Dashed line represents baseline RMP. (H) Average responses of control and oKir4.1cKO astrocytes shown in (G), on an expanded time scale. Response amplitudes were scaled to the same value at the end of stimulation, to facilitate comparison of response kinetics. Stimulation artifacts have been eliminated for clarity. (I) Quantification of the average decay time. oKir4.1cKO astrocytes (n = 5) had significantly longer decay times than control astrocytes (n = 7, p=0.026; Student’s t-test). (J) Quantification of the normalized integral. oKir4.1cKO astrocytes had significantly greater normalized integral than control astrocytes (p=0.0049; Student’s t-test). Similar recordings from oligodendrocytes and astrocytes in the alveus of the hippocampus are shown in Figure 6—figure supplement 1.
Figure 6—figure supplement 1
K+ clearance after high-frequency stimulation of alveus is impaired following deletion of Kir4.1 from oligodendrocytes.
(A) Recording set-up: EGFP+ oligodendrocytes in the alveus were targeted for whole cell recording in control;RCE and oKir4.1cKO;RCE mice. Axons were stimulated at 100 Hz for 1 s with a bipolar electrode at a distance of ~200 μm. (B) Membrane potential changes of oligodendrocytes recorded in current clamp mode during and after 100 Hz stimulation. Shown are averaged responses of cells from control mice (black, n = 14) and oKir4.1cKO mice (blue, n = 16). Dashed line represents baseline RMP. (C) Average responses of control and oKir4.1cKO oligodendrocytes shown in (B), on an expanded time scale to show membrane potential changes during and immediately after stimulation. Response amplitudes are scaled to the same value at the end of stimulation, to facilitate comparison of response kinetics. Stimulation artifacts have been eliminated for clarity. (D) Quantification of the average decay time, defined as the time from the end of stimulation until the membrane potential first crosses its initial baseline value. This value is independent of response amplitude. oKir4.1cKO oligodendrocytes (n = 14) had significantly longer decay times than control oligodendrocytes (n = 16, p=7.8 × 10⁻⁵; Student’s t-test). (E) Quantification of the average normalized integral, defined as the area under the curve from the end of stimulation until the membrane potential first crosses the baseline, divided by the peak amplitude. oKir4.1cKO oligodendrocytes had significantly greater normalized integral than control oligodendrocytes (p=0.012; Student’s t-test). (F) EGFP+ astrocytes in the alveus were targeted for whole cell recording in control;Slc1a2-EGFP and oKir4.1cKO;Slc1a2-EGFP mice. Same protocol as in (A). (G) Membrane potential changes of astrocytes recorded in current clamp mode during and after 100 Hz stimulation. Shown are averaged responses of cells from control mice (black, n = 6) and oKir4.1cKO mice (green, n = 8). Dashed line represents baseline RMP. (H) Average responses of control and oKir4.1cKO astrocytes shown in (G), on an expanded time scale. Response amplitudes were scaled to the same value at the end of stimulation, to facilitate comparison of response kinetics. Stimulation artifacts have been eliminated for clarity. (I) Quantification of the average decay time. oKir4.1cKO astrocytes (n = 8) had significantly longer decay times than control astrocytes (n = 6, p=5.0 × 10⁻⁴). (J) Quantification of the normalized integral. oKir4.1cKO astrocytes had significantly greater normalized integral than control astrocytes (p=2.7 × 10⁻⁴; Student’s t-test).
Figure 7 with 1 supplement
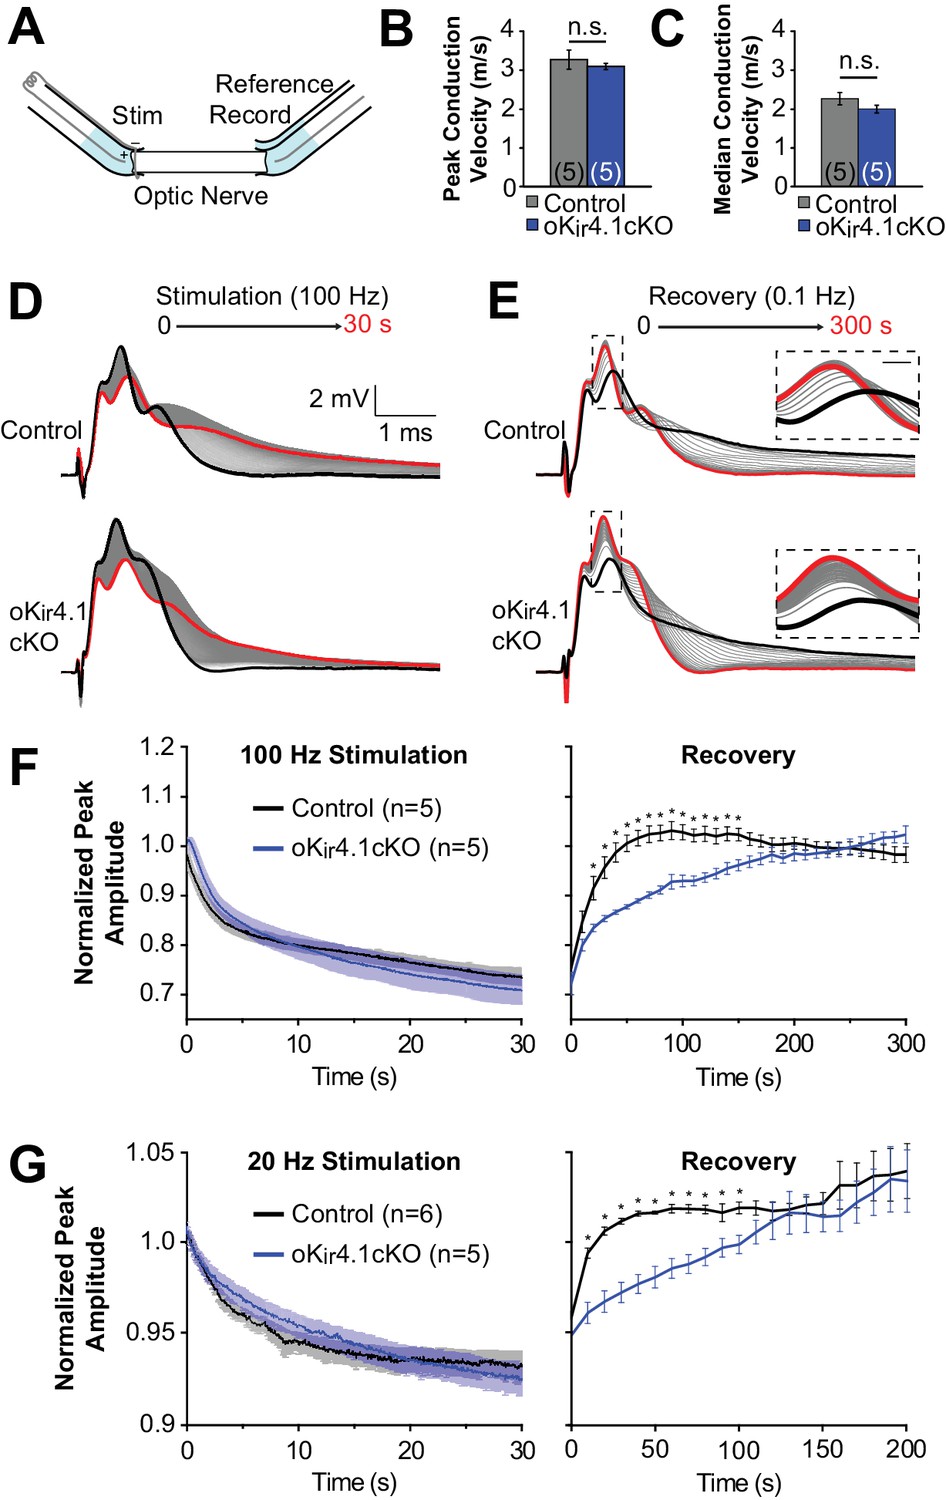
Recovery of axonal firing patterns after high frequency activity is slowed following deletion of Kir4.1 from oligodendrocytes.
(A) Schematic diagram of optic nerve recording set-up. Nerve is inserted into suction electrodes, stimulated at the retinal end, and recorded at the chiasmatic end. A reference electrode is placed next to the recording electrode, and the signals are subtracted to reduce the stimulus artifact. (B) Quantification of the peak (mode) conduction velocities of optic nerve axons from control (n = 5 nerves) and oKir4.1cKO (n = 5 nerves) mice. No significant difference was observed (p=0.51; Student’s t-test). (C) Quantification of the median conduction velocities of optic nerve axons from control (n = 5 nerves) and oKir4.1cKO (n = 5 nerves) mice. Median was calculated over 6 ms following stimulus artifact. No significant difference was observed (p=0.11; Student’s t-test). (D) CAPs recorded from a control (top) and oKir4.1cKO (bottom) optic nerve during 30 s of 100 Hz stimulation. The bold black trace is the first sweep, and the bold red trace is the last sweep. (E) CAPs recorded at 0.1 Hz from a control (top) and oKir4.1cKO (bottom) optic nerve during 5 min of recovery from stimulation. The bold black trace is the first sweep, and the bold red trace is the last sweep. Insets: higher resolution views of the CAP peaks during recovery, showing slower recovery of the oKir4.1cKO nerve. (F) Peak CAP amplitude, as a fraction of the baseline value, of control and oKir4.1cKO nerves during 100 Hz stimulation and recovery. oKir4.1cKO nerves recovered significantly more slowly than control nerves (Finteraction = 5.14, p=8.5 × 10⁻¹⁴; two-way ANOVA) (*=p < 0.05; simple effects post-test). (G) Peak CAP amplitude, as a fraction of the baseline value, of control and oKir4.1cKO nerves during 20 Hz stimulation and recovery. oKir4.1cKO nerves recovered significantly more slowly than control nerves (Finteraction = 1.82, p=0.027; two-way ANOVA) (*=p < 0.05; simple effects post-test). Plots of the normalized CAP integral and median conduction latency during stimulation and recovery are included in Figure 7—figure supplement 1.
Figure 7—figure supplement 1
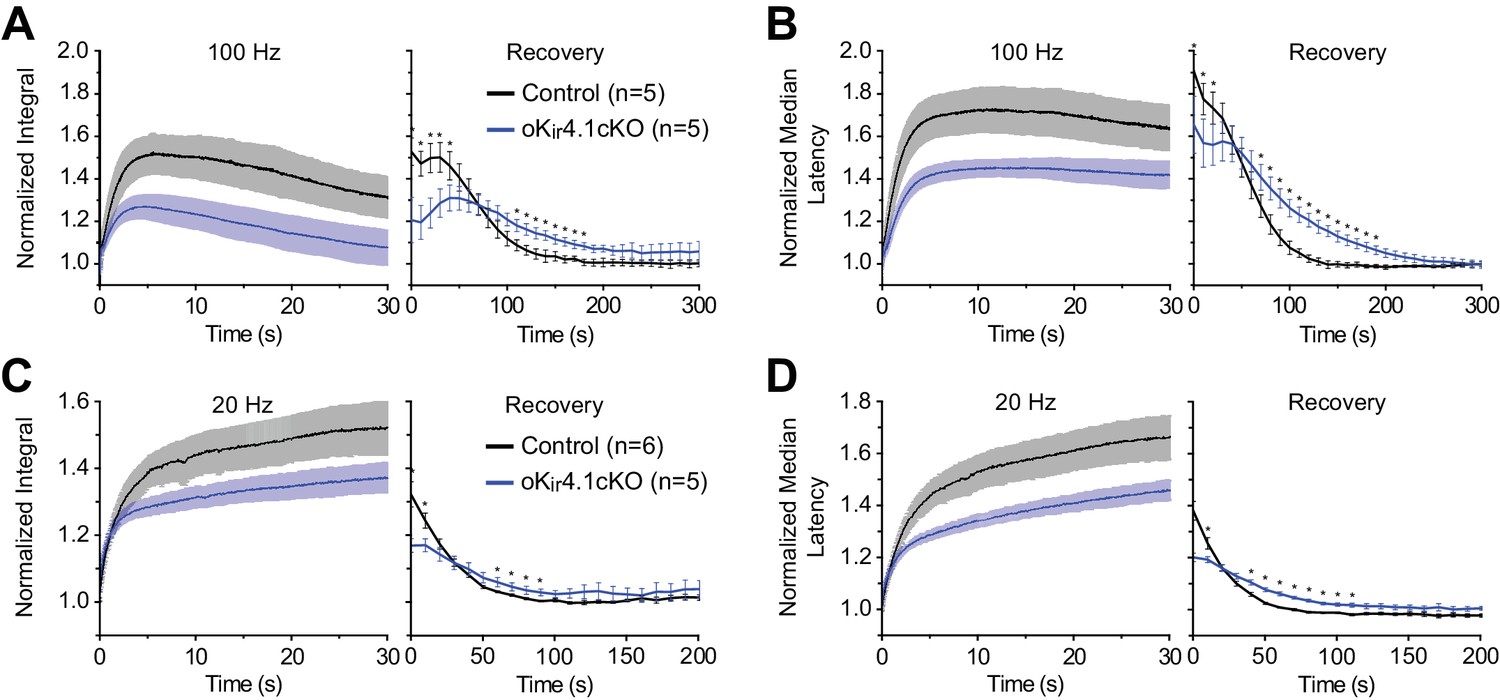
Recovery of CAP integral and median conduction latency are slowed following deletion of Kir4.1 from oligodendrocytes.
(A) CAP integral, as a fraction of the baseline value, of control and oKir4.1cKO nerves during 100 Hz stimulation and recovery. Integral was calculated over a period of 6 ms following the stimulus artifact. The curves differed significantly, with the oKir4.1cKO nerve taking longer to recover (Finteraction = 4.35, p=3.7 × 10⁻¹¹; two-way ANOVA). (B) Median CAP latency, as a fraction of the baseline value, of control and oKir4.1cKO nerves during 100 Hz stimulation and recovery. Median latency was calculated over a period of 6 ms following the stimulus artifact. (Finteraction = 3.01, p=1.3 × 10⁻⁶; two-way ANOVA). (C) CAP integral during 20 Hz stimulation and recovery (Finteraction = 4.05, p=1.6 × 10⁻⁷; two-way ANOVA). (D) Medial CAP latency during 20 Hz stimulation and recovery (Finteraction = 11.69, p=1.2 × 10⁻²³; two-way ANOVA). (*=p < 0.05, simple effects post-test).
Figure 8

Deletion of Kir4.1 from oligodendrocytes results in activity-dependent motor deficits.
(A) Quantification of total beam breaks and rears per minute during 30 min in an open field chamber. No significant difference was observed between control (n = 13) and oKir4.1cKO (n = 11) mice in total activity (p=0.71; Student’s t-test) or rearing (p=0.56; Student’s t-test). (B) Latency to fall on the accelerating rotarod. Initial speed was 5 rpm, with acceleration of 1 rpm every 5 s. There was a significant relationship between genotype and performance which was independent of trial day (Fgenotype = 20.38, p=2.7 × 10⁻⁵; Finteraction = 0.007, p=0.99; two-way ANOVA) (*=p < 0.05, **=p < 0.01; simple effects post-test). (C) Distance run on a freely available running wheel per 24 hr period over 7 days of exposure. There was a significant interaction between genotype and trial day (Finteraction = 3.09, p=0.008, two-way ANOVA). oKi4.1cKO mice (n = 8) had significantly less daily distance than control mice (n = 10) on days 5–7 (**=p < 0.01, ***=p < 0.001; simple effects post-test). (D) Cumulative distance run on a freely-available running wheel over 7 days of exposure. oKir4.1cKO mice ran significantly less distance than control mice (p=0.0057; Student’s t-test). (E) Average running speed during intervals where running occurred. oKir4.1cKO mice had lower average speed than control mice (p=0.021; Student’s t-test).
Tables
Key resources table
| Reagent type (species) or resource | Designation | Source or reference | Identifiers | Additional information |
|---|---|---|---|---|
| Gene (Mus musculus) | Kcnj10; Kir4.1 | NA | OMIM: 602208 | |
| Genetic reagent (M. musculus) | B6.129-Kcnj10tm1Kdmc/J | K. McCarthy, UNC Chapel Hill.Djukic et al., 2007. PMID:17942730. | RRID:IMSR_JAX:026826 | |
| Genetic reagent (M. musculus) | Mog-iCre (knock-in) | A. Waisman, Johannes Gutenberg University.Buch et al. (2005). PMID:15908920 | NA | |
| Genetic reagent (M. musculus) | B6.Cg-Tg(Nes-cre)1Kln/J | Jackson Laboratory | RRID:IMSR_JAX:003771 | |
| Genetic reagent (M. musculus) | B6N.Cg-Tg(Pdgfra-cre/ERT)467Dbe/J | Bergles Lab, Johns Hopkins University.Kang et al. (2010). PMID:21092857 | RRID:IMSR_JAX:018280 | |
| Genetic reagent (M. musculus) | STOCK Gt(ROSA)26Sortm1.1(CAG-EGFP)Fsh/Mmjax | G. Fishell, NYU.Sousa et al., 2009. PMID:19363146 | RRID:MGI:4412377 | |
| Genetic reagent (M. musculus) | B6.129 × 1-Gt(ROSA)26Sortm1(EYFP)Cos/J | Jackson Laboratory | RRID:IMSR_JAX:006148 | |
| Genetic reagent (M. musculus) | STOCK Tg(Mobp-EGFP) IN1Gsat/Mmucd | MMRRC | RRID:MMRRC_030483-UCD | |
| Genetic reagent (M. musculus) | Slc1a2-EGFP (BAC-transgenic) | J. Rothstein, Johns Hopkins University.Regan et al. (2007). PMID:17581948 | NA | |
| Antibody | Anti-ASPA (rabbit polyclonal) | Genetex | Cat# GTX113389; RRID:AB_2036283 | (1:1500) |
| Antibody | Anti-BrdU (rat monoclonal) | BioRad | Cat# OBT0030G; RRID:AB_609567 | (1:500); Clone BU1/75 |
| Antibody | Anti-APC (CC1) (mouse monoclonal) | EMD Millipore (Calbiochem) | Cat# OP80; RRID:AB_2057371 | (1:50) |
| Antibody | Anti-GFAP (rabbit polyclonal) | Dako | Cat# Z0334; RRID:AB_10013382 | (1:500) |
| Antibody | Anti-GFP (chicken polyclonal) | Aves Labs | Cat# GFP-1020; RRID:AB_10000240 | (1:4000) |
| Antibody | Anti-GFP (goat polyclonal) | SICGEN | Cat# AB0020-200; RRID:AB_2333099 | (1:5000) |
| Antibody | Anti-Ki67 (rabbit polyclonal) | Abcam | Cat# Ab15580; RRID:AB_443209 | (1:1000) |
| Antibody | Anti-Kir4.1 (rabbit polyclonal) | Alomone Labs | Cat# APC-035; RRID:AB_2040120 | (1:2000) |
| Antibody | Anti-MBP (chicken polyclonal) | Aves Labs | Cat# MBP; RRID:AB_2313550 | (1:500) |
| Antibody | Anti-MBP (mouse monoclonal) | BioLegend | Cat# 808401; RRID:AB_2564741 | (1:500) |
| Antibody | Anti-NG2 (guinea pig polyclonal) | Bergles Lab, Johns Hopkins University. Kang et al., 2013. PMID:23542689 | NA | (1:10000) |
| Antibody | Anti-PDGFRα (rabbit polyclonal) | W. Stallcup, Burnham Institute. Nishiyama et al., 1996.PMID:8714520 | NA | (1:500) |
| Antibody | Anti-PDGFRα (rabbit polyclonal) | Cell Signaling Technology | Cat# 3174S; RRID:AB_2162345 | (1:500) |
| Antibody | Anti-Neurofilament-H (SMI32) (mouse monoclonal) | BioLegend | Cat# 801702; RRID:AB_2715852 | (1:1000) |
| Antibody | Donkey anti-chicken Alexa 488 | Jackson Immunoresearch | Cat# 703-546-155; RRID:AB_2340376 | (1:2000) |
| Antibody | Donkey anti-goat Alexa 488 | Jackson Immunoresearch | Cat# 705-546-147; RRID:AB_2340430 | (1:2000) |
| Antibody | Donkey anti-rabbit Alexa 488 | Jackson Immunoresearch | Cat# 711-546-152; RRID:AB_2340619 | (1:2000) |
| Antibody | Donkey anti-chicken Cy3 | Jackson Immunoresearch | Cat# 703-165-155; RRID:AB_2340363 | (1:2000) |
| Antibody | Donkey anti-guinea pig Cy3 | Jackson Immunoresearch | Cat# 706-166-148; RRID:AB_2340461 | (1:2000) |
| Antibody | Donkey anti-mouse Cy3 | Jackson Immunoresearch | Cat# 715-166-151; RRID:AB_2340817 | (1:2000) |
| Antibody | Donkey anti-rabbit Cy3 | Jackson Immunoresearch | Cat# 711-166-152; RRID:AB_2313568 | (1:2000) |
| Antibody | Donkey anti-chicken Alexa 647 | Jackson Immunoresearch | Cat# 703-605-155; RRID:AB_2340376 | (1:2000) |
| Antibody | Donkey anti-mouse DyLight 650 | Thermo Fisher Scientific | Cat# SA5-10169; RRID:AB_2556749 | (1:2000) |
| Antibody | Donkey anti-rabbit DyLight 650 | Thermo Fisher Scientific | Cat# SA5-10041; RRID:AB_2556621 | (1:2000) |
| Antibody | Donkey anti-rat Cy5 | Jackson Immunoresearch | Cat# 712-175-153; RRID:AB_2340672 | (1:2000) |
| Sequence-based reagent | Cnp primers: TTTACCCGCAAAAGCCACACA (f); CACCGTGTCCTCATCTTGAAG (r) | MGH PrimerBank | PrimerBank ID:6753476a1 | |
| Sequence-based reagent | Mobp primers: AGTACAGCATCTGCAAGAGCG (f); TCCTCAATCTAGTCTTCTGGCA (r) | MGH PrimerBank | PrimerBank ID:678910a1 | |
| Sequence-based reagent | Gfap primers: CGGAGACGCATCACCTCTG (f); TGGAGGAGTCATTCGAGACAA (r) | MGH PrimerBank | PrimerBank ID:6678910a1 | |
| Sequence-based reagent | Kcnj10 primers: GTCGGTCGCTAAGGTCTATTACA (f); GGCCGTCTTTCGTGAGGAC (r) | MGH PrimerBank | PrimerBank ID:34328498a1 | |
| Sequence-based reagent | Gapdh primers: AAGATGGTGATGGGCTTCCCG (f); TGGCAAAGTGGAGATTGTTGCC (r) | Rhinn et al. (2008). PMID: 18611280 | NA | |
| Commercial assay or kit | Neural Tissue Dissociation Kit (P) | Miltenyi Biotec | Cat# 130-092-628 | |
| Commercial assay or kit | FastLane Cell cDNA Kit | Qiagen | Cat# 215011 | |
| Commercial assay or kit | QuantiTect SYBR Green PCR Kit | Qiagen | Cat# 204143 | |
| Chemical compound, drug | (Z)−4-Hydroxytamoxifen (4-HT) | Sigma-Aldrich | Cat# H7904; CAS:68392-35-8 | |
| Chemical compound, drug | 5-Bromo-2′-deoxyuridine (BrdU) | Sigma-Aldrich | Cat# B5002; CAS:59-14-3 | |
| Chemical compound, drug | Pentylenetetrazol | Sigma-Aldrich | Cat# P6500; CAS:54-95-5 | |
| Chemical compound, drug | Tetrodotoxin citrate | Abcam | Cat# Ab120055; CAS:18660-81-6 | |
| Software, algorithm | Adobe Illustrator CS6 | Adobe | RRID:SCR_014198 | |
| Software, algorithm | Fiji | http://fiji.sc | RRID:SCR_002285 | |
| Software, algorithm | ImageJ | https://imagej.nih.gov/ij/ | RRID:SCR_003070 | |
| Software, algorithm | Origin 8.0 | OriginLab Corp. | RRID:SCR_014212 | |
| Software, algorithm | pClamp10, pClamp9.2 | Molecular Devices | RRID:SCR_011323 | |
| Software, algorithm | Python programming language | https://www.python.org/ | RRID:SCR_008394 | |
| Software, algorithm | StepOne software | Applied Biosystems | RRID:SCR_014281 | |
| Software, algorithm | Zen Blue | Zeiss | RRID:SCR_013672 |
Additional files
-
Transparent reporting form
- https://doi.org/10.7554/eLife.34829.024
Download links
A two-part list of links to download the article, or parts of the article, in various formats.
Downloads (link to download the article as PDF)
Open citations (links to open the citations from this article in various online reference manager services)
Cite this article (links to download the citations from this article in formats compatible with various reference manager tools)
Oligodendrocytes control potassium accumulation in white matter and seizure susceptibility
eLife 7:e34829.
https://doi.org/10.7554/eLife.34829


