OGT binds a conserved C-terminal domain of TET1 to regulate TET1 activity and function in development
- University of California San Francisco, United States
- Memorial Sloan Kettering Cancer Center, United States
- Weill Cornell Graduate School of Medical Sciences, Cornell University, United States
- Salk Institute for Biological Studies, United States
- Howard Hughes Medical Institute, University of Chicago, United States
- University of Chicago, United States
- University of Minnesota, United States
- Perelman School of Medicine, University of Pennsylvania, United States
Figures
Figure 1 with 1 supplement

The short TET1 C-terminus is required for interaction with OGT.
(A) Domain architecture of TET1. (B) Diagram of FLAG-tagged TET1 CD constructs expressed in HEK293T cells (upper). FLAG and OGT western blot of inputs and FLAG IPs from HEK293T cells transiently expressing FLAG-TET1 CD truncations and His-OGT (lower). (C) Diagram of His-tagged OGT constructs expressed in HEK293T cells (upper). FLAG and His western blot of input and FLAG IPs from HEK293T cells transiently expressing FLAG-TET1 CD and His-OGT TPR deletions (lower).
Figure 1—figure supplement 1
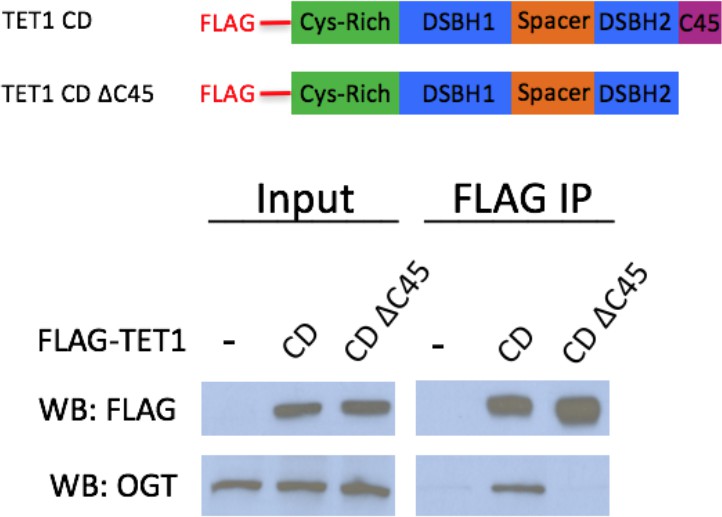
TET1 C45 is necessary for interaction with endogenous OGT FLAG and OGT western blot of inputs and FLAG IPs from HEK293T cells transiently expressing FLAG-TET1 CD or FLAG-TET1 CD ΔC45 (diagrammed in the upper panel).
https://doi.org/10.7554/eLife.34870.003
Figure 2
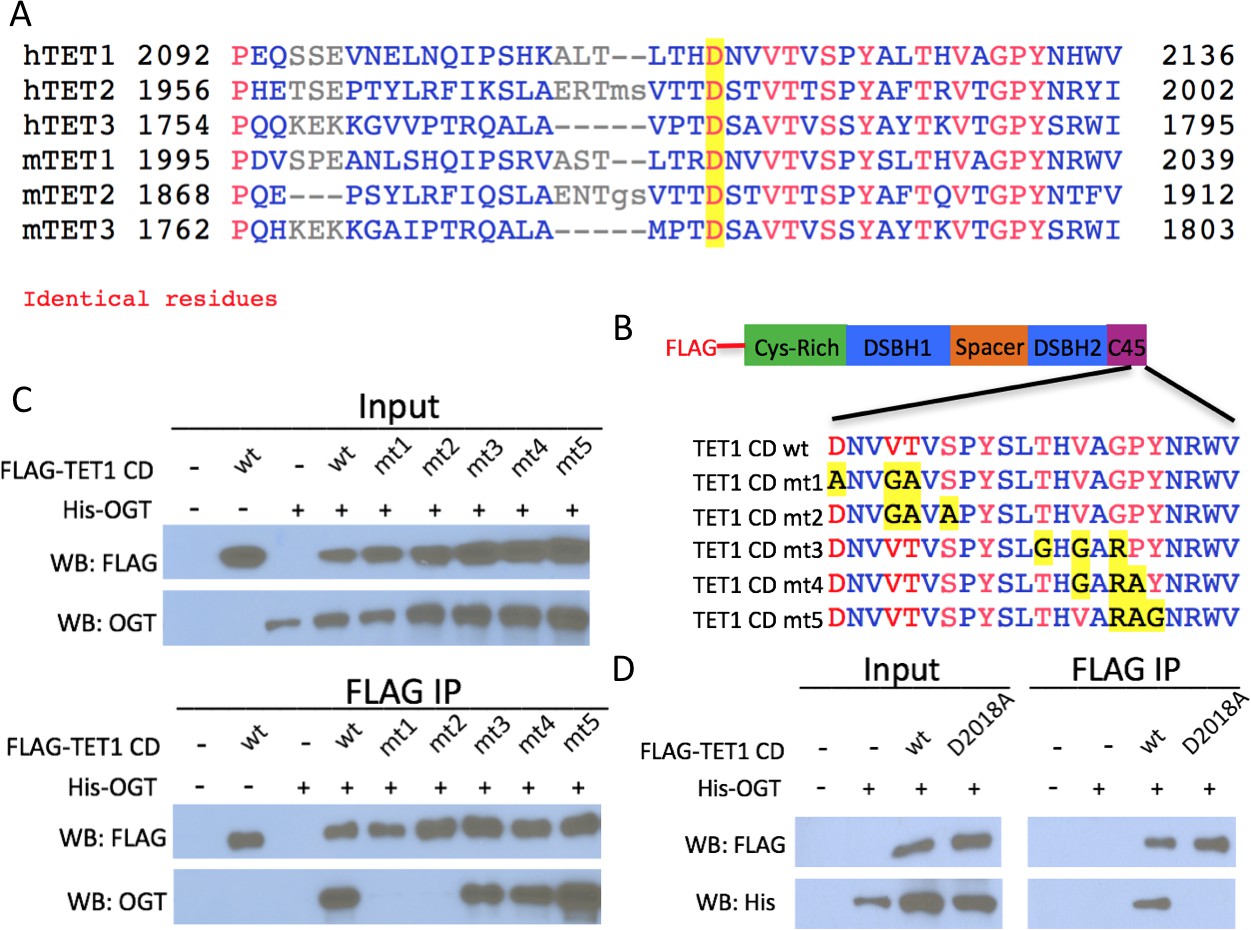
Conserved residues in the TET1 C45 are necessary for the TET1-OGT interaction.
(A) Alignment of the C-termini of human (h) and mouse (m) TETs 1, 2, and 3. A conserved aspartate residue mutated in D is highlighted. (B) Diagram of FLAG-tagged TET1 CD constructs expressed in HEK293T cells. (C) FLAG and OGT western blot of inputs and FLAG IPs from HEK293T cells transiently expressing FLAG-TET1 CD triple point mutants and His-OGT. (D) FLAG and His western blot of inputs and FLAG IPs from HEK293T cells transiently expressing His-OGT and FLAG-TET1 CD or FLAG-TET1 CD D2018A.
Figure 3
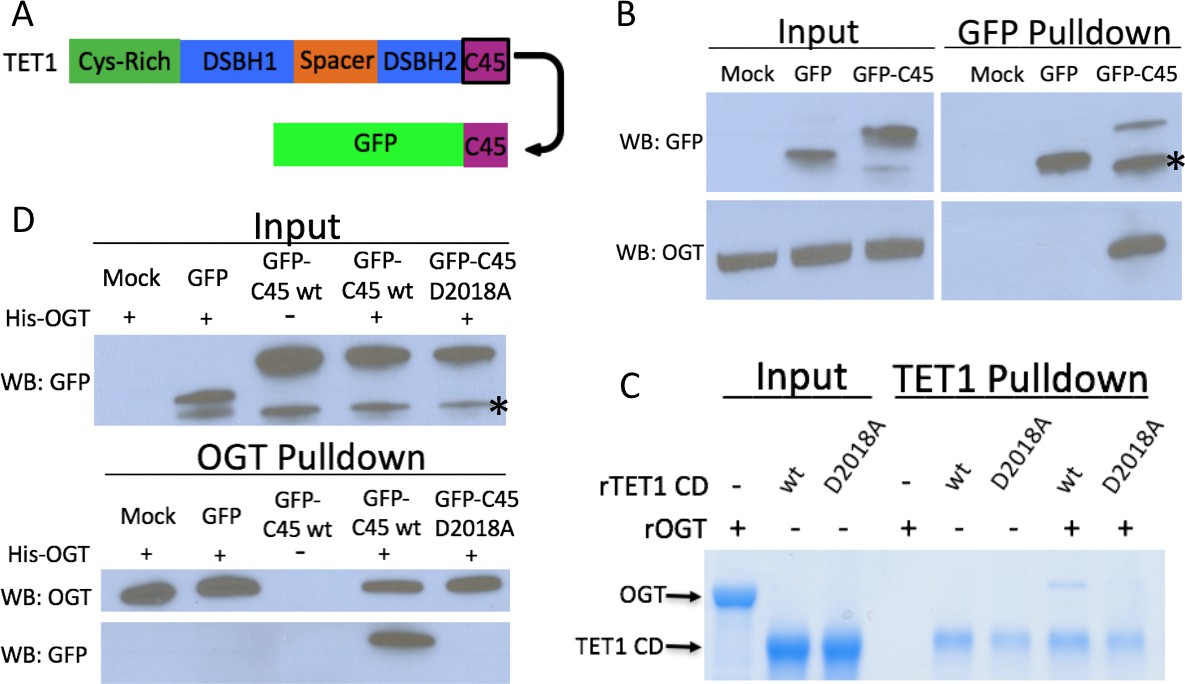
The TET1 C45 is sufficient for interaction with OGT in cells and in vitro.
(A) Schematic of the TET1 C45 fusion to the C-terminus of GFP. (B) GFP and OGT western blot of inputs and GFP IPs from HEK293T cells transiently expressing GFP or GFP-TET1 C45. *Truncated GFP. (C) Coomassie stained protein gel of inputs and TET1 IPs from in vitro binding reactions containing rOGT and rTET1 CD wild type or D2018A. No UDP-GlcNAc was included in these reactions. (D) GFP and OGT western blot of inputs and OGT IPs from in vitro binding reactions containing rOGT and in vitro translated GFP constructs. *Truncated GFP.
Figure 4
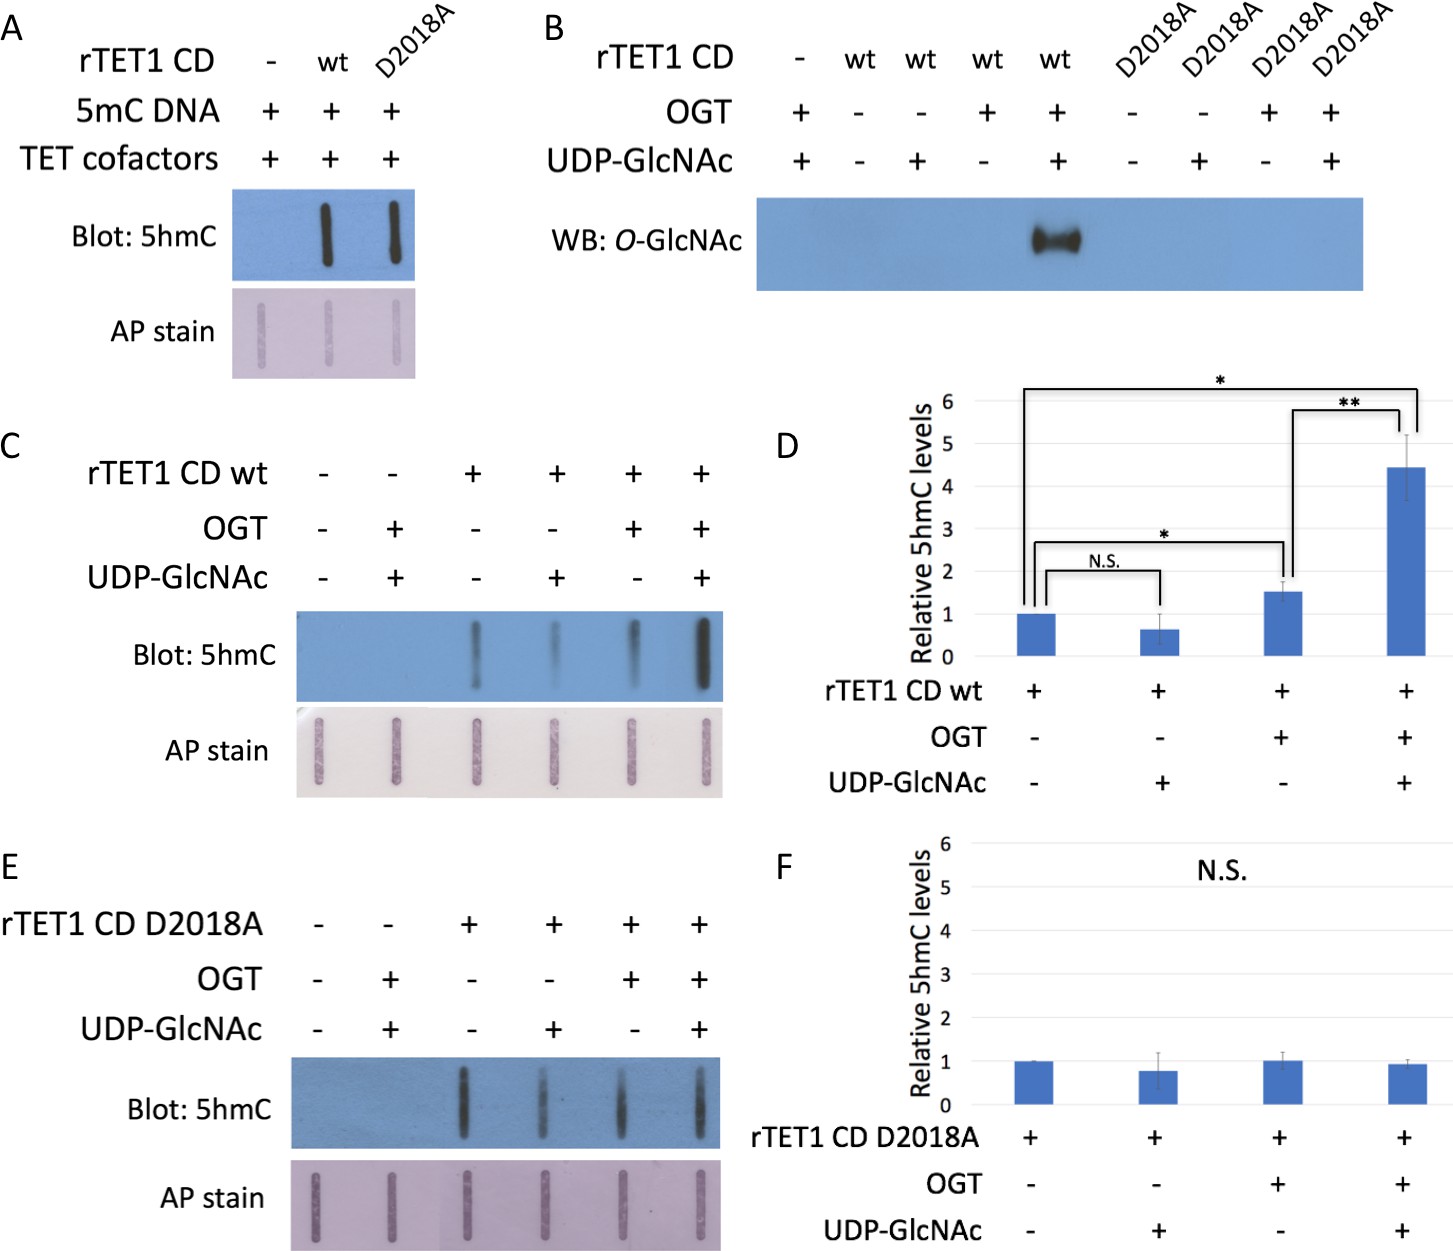
The D2018A mutation impairs TET1 CD stimulation by OGT.
(A) 5hmC slot blot of biotinylated 5mC containing lambda DNA from rTET1 CD activity assays. Alkaline phosphatase staining was used to detect biotin as a loading control. (B) Western blot for O-GlcNAc in in vitro O-GlcNAcylation reactions. (C) 5hmC slot blot of biotinylated 5mC containing lambda DNA from rTET1 wt activity assays. Alkaline phosphatase staining was used to detect biotin as a loading control. (D) Quantification of 5hmC levels from rTET1 wt activity assays. Results are from 3 to 5 slot blots and normalized to rTET1 wt alone. (E) 5hmC slot blot of biotinylated 5mC containing lambda DNA from rD2018A activity assays. Alkaline phosphatase staining was used to detect biotin as a loading control. (F) Quantification of 5hmC levels from rD2018A activity assays. Results are from 3 to 5 slot blots and normalized to rD2018A alone. Error bars denote s.d. *p<0.01, **p<0.01, N.S. – not significant.
-
Figure 4—source data 1
For Figure 4D and 4F Quantification of 5hmC levels from activity assays with rTET1 wt.
- https://doi.org/10.7554/eLife.34870.007
Figure 5
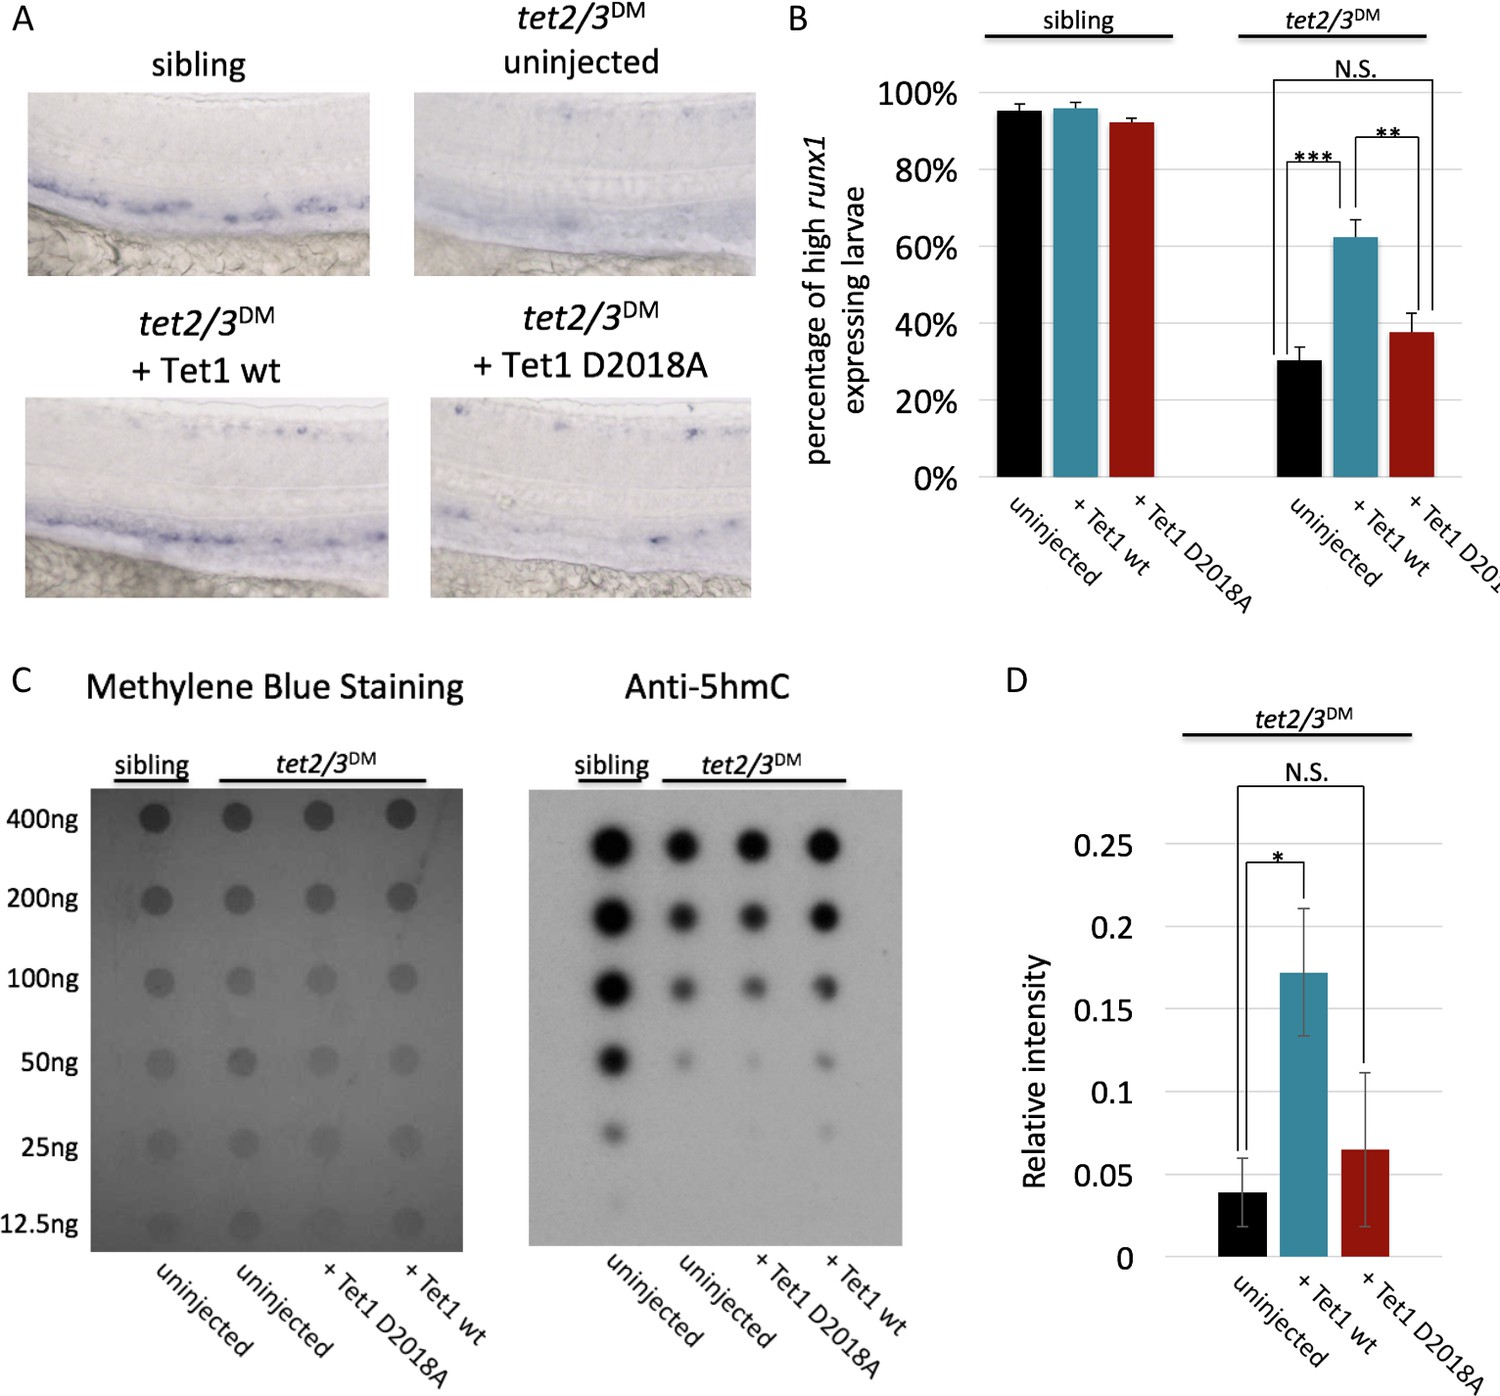
The TET1-OGT interaction promotes TET1 function in the zebrafish embryo.
(A) Representative images of runx1 labeling in the dorsal aorta of wild type or tet2/3DM zebrafish embryos, uninjected or injected with mRNA encoding mouse Tet1 wild type or D2018A. (B) Percentage of embryos with high runx1 expression along the dorsal aorta. (C) 5hmC dot blot of genomic DNA from wild type or tet2/3DM zebrafish embryos injected with Tet1 wild type or D2018A mRNA. Methylene blue was used as a loading control. (D) Quantification of 5hmC levels from three dot blots, normalized to methylene blue staining. Error bars denote s.d. *p<0.05, **p<0.01, ***p<0.001, N.S. – not significant.
-
Figure 5—source data 1
For Figure 5B Quantification of runx1 levels in zebrafish embryos used to generate graph in Figure 5B.
- https://doi.org/10.7554/eLife.34870.009
Figure 6 with 3 supplements
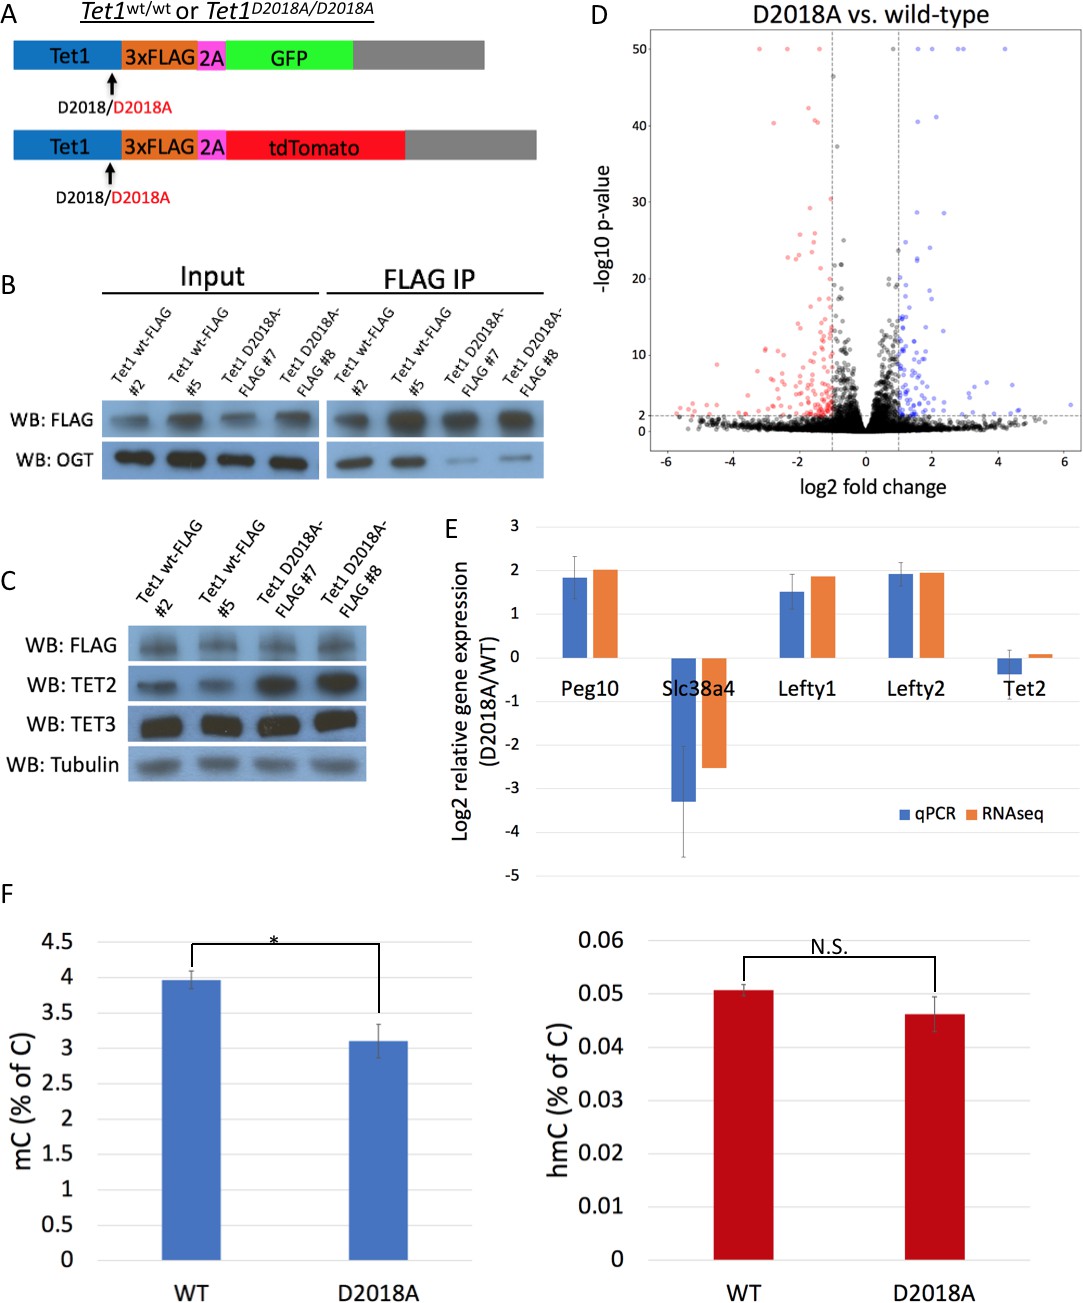
The D2018A mutation alters gene expression and 5mC levels in mESCs.
(A) Schematic of WT and D2018A mESC lines. (B) FLAG and OGT western blot of inputs and FLAG IPs from WT and D2018A mESCs. (C) Western blots for FLAG, TET2, and TET3 of protein extracts from WT and D2018A mESCs. (D) Volcano plot showing differentially expressed genes in D2018A vs. WT mESCs. Red: decreased expression (log2 fold change > −1, Benjamini-Hochberg adjusted p-value<0.01). Blue: increased expression (log2 fold change >1, Benjamini-Hochberg adjusted p-value<0.01) E) qPCR analysis of selected differentially expressed genes. (F) Mass spec quantification of mC and hmC levels in WT and D2018A cells. Error bars denote s.d. *p<0.05, N.S. – not significant.
-
Figure 6—source data 1
For Figure 6E Quantification of gene expression by RT-qPCR used for graph in Figure 6E.
- https://doi.org/10.7554/eLife.34870.014
-
Figure 6—source data 2
For Figure 6F Mass spectrometry quantification of 5mC and 5hmC in WT and D2018A mESCs, used to generate graph in Figure 6F.
- https://doi.org/10.7554/eLife.34870.015
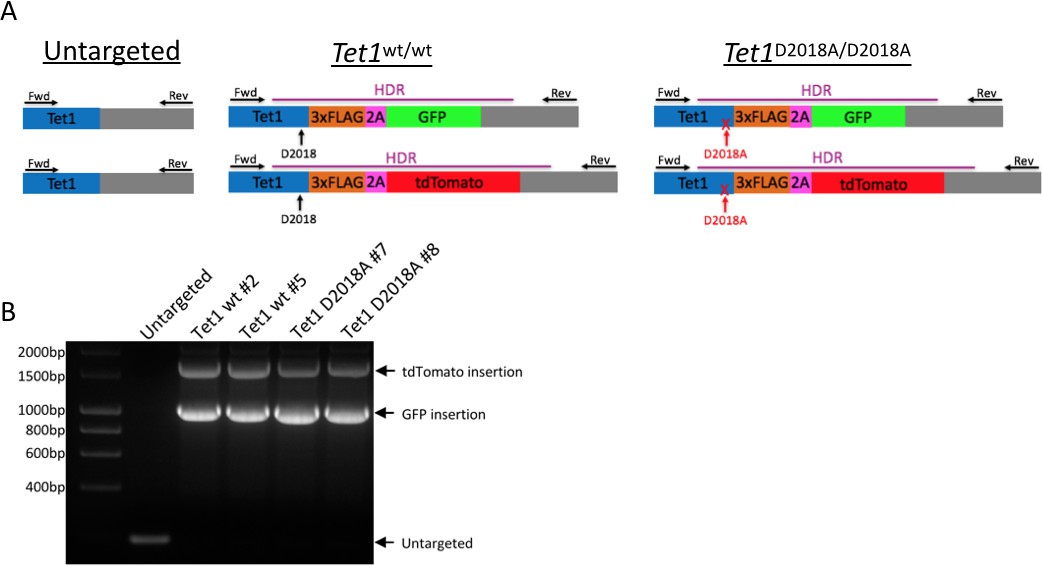
Figure 6—figure supplement 1
Generation of mESC lines.
(A) Schematic of mESC lines. DNA encoding a 3xFLAG tag was added to the 3’ end of both alleles of Tet1, followed by a 2A sequence and a fluorescent protein (GFP or tdTomato). The 2A sequence causes ribosome skipping, resulting in separate translation of TET1-3xFLAG and 2A-GFP or 2A-tdTomato. Purple line: template used for homology-directed repair (HDR). Horizontal arrows: primers used for PCR genotyping. Vertical arrows: D2018 residue. (B) PCR genotyping of independently derived, clonal, targeted mESC lines using primers indicated in A.
Figure 6—figure supplement 2
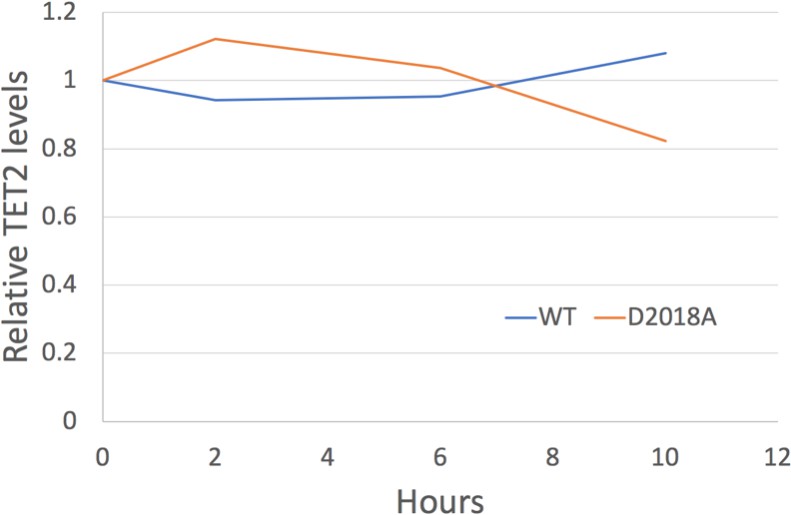
Analysis of TET2 protein stability.
Quantification of western blots (TET2 signal normalized to Tubulin signal) of protein lysates from WT and D2018A mESCs treated with cycloheximide (50 µg/mL) at indicated timepoints.
-
Figure 6—figure supplement 2—source data 1
For Figure 6—figure supplement 2 Quantification of western blots for TET2 and Tubulin from WT and D2018A mESCs treated with cycloheximide, used to generate graph in Figure 6—figure supplement 2.
- https://doi.org/10.7554/eLife.34870.016
Figure 6—figure supplement 3
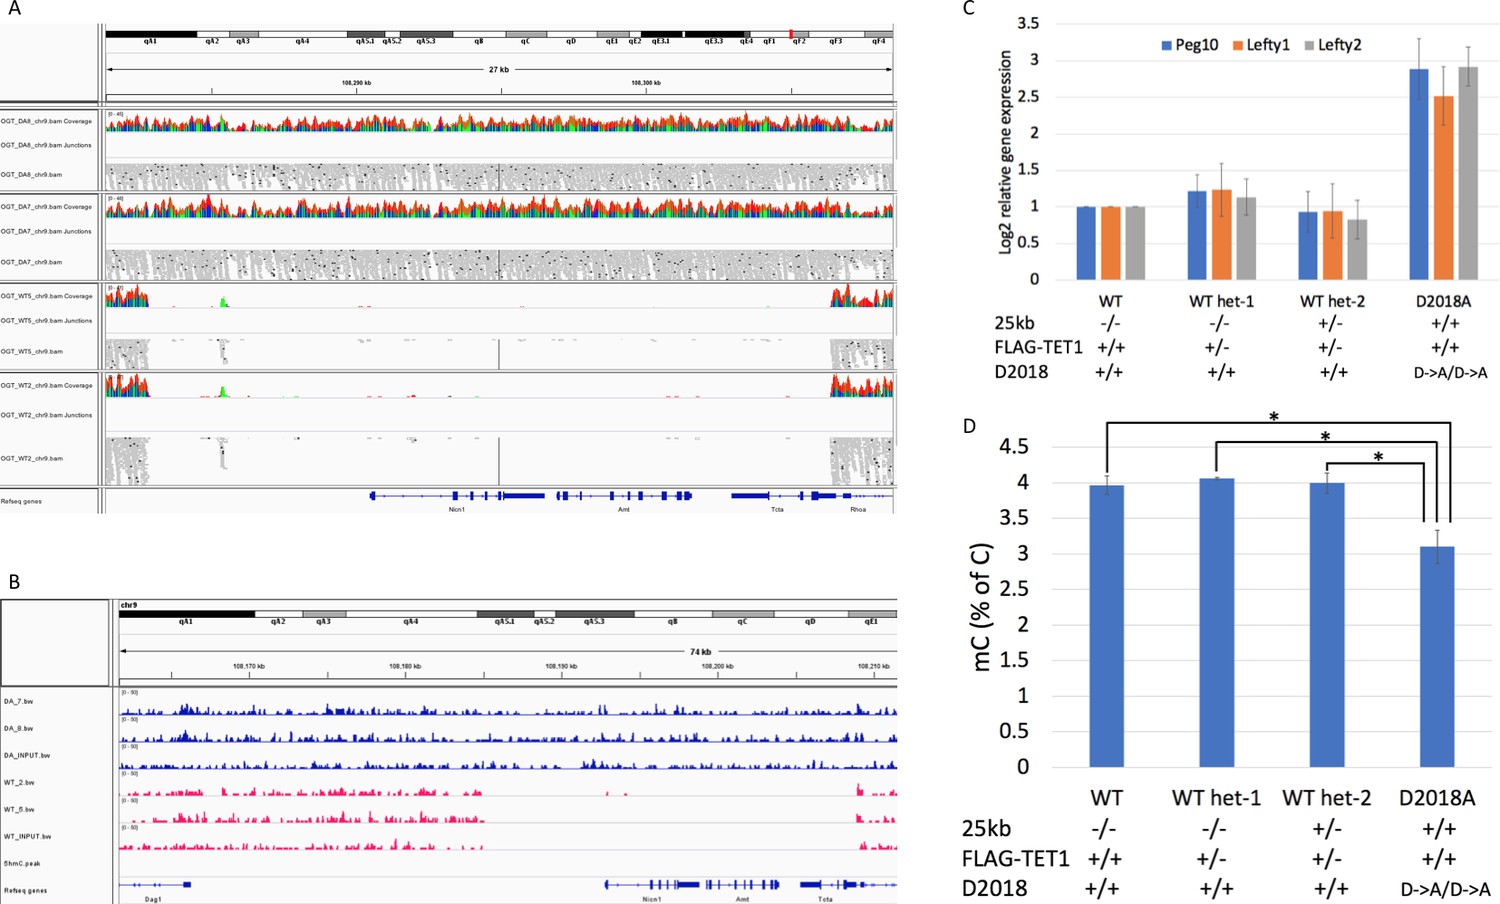
Analysis of 25 kb deletion in WT cells Coverage from WGBS.
(A) and 5hmC-Seal (B) showing ~25 kb deleted in WT cells. (C) qPCR comparing gene expression in WT, D2018A, and WT single targeted (het-1 and het-2) cell lines. Het-2 cells have wild-type TET1 and one intact copy of the 25 kb region. (D) Mass spec comparing 5mC levels in WT, D2018A, and WT single targeted (het-1 and het-2) cells. Error bars denote s.d. *p<0.05.
-
Figure 6—figure supplement 3—source data 1
For Figure 6—figure supplement 3C Quantification of gene expression by RT-qPCR used for graph in Figure 6—figure supplement 3C.
- https://doi.org/10.7554/eLife.34870.017
-
Figure 6—figure supplement 3—source data 2
For Figure 6—figure supplement 3D Mass spectrometry quantification of 5mC in mESCs, used to generate graph in Figure 6—figure supplement 3D.
- https://doi.org/10.7554/eLife.34870.018
Figure 7

5hmC-Seal analysis of WT and D2018A mESCs.
(A) Genomic annotations of differentially hydroxymethylated regions in WT vs. D2018A mESCs. (B) Heatmap depicting 95 differentially hydroxymethylated genes in WT vs. D2018A mESCs. (C) Distribution of averaged hmCpG level at all genes.
Figure 8 with 1 supplement
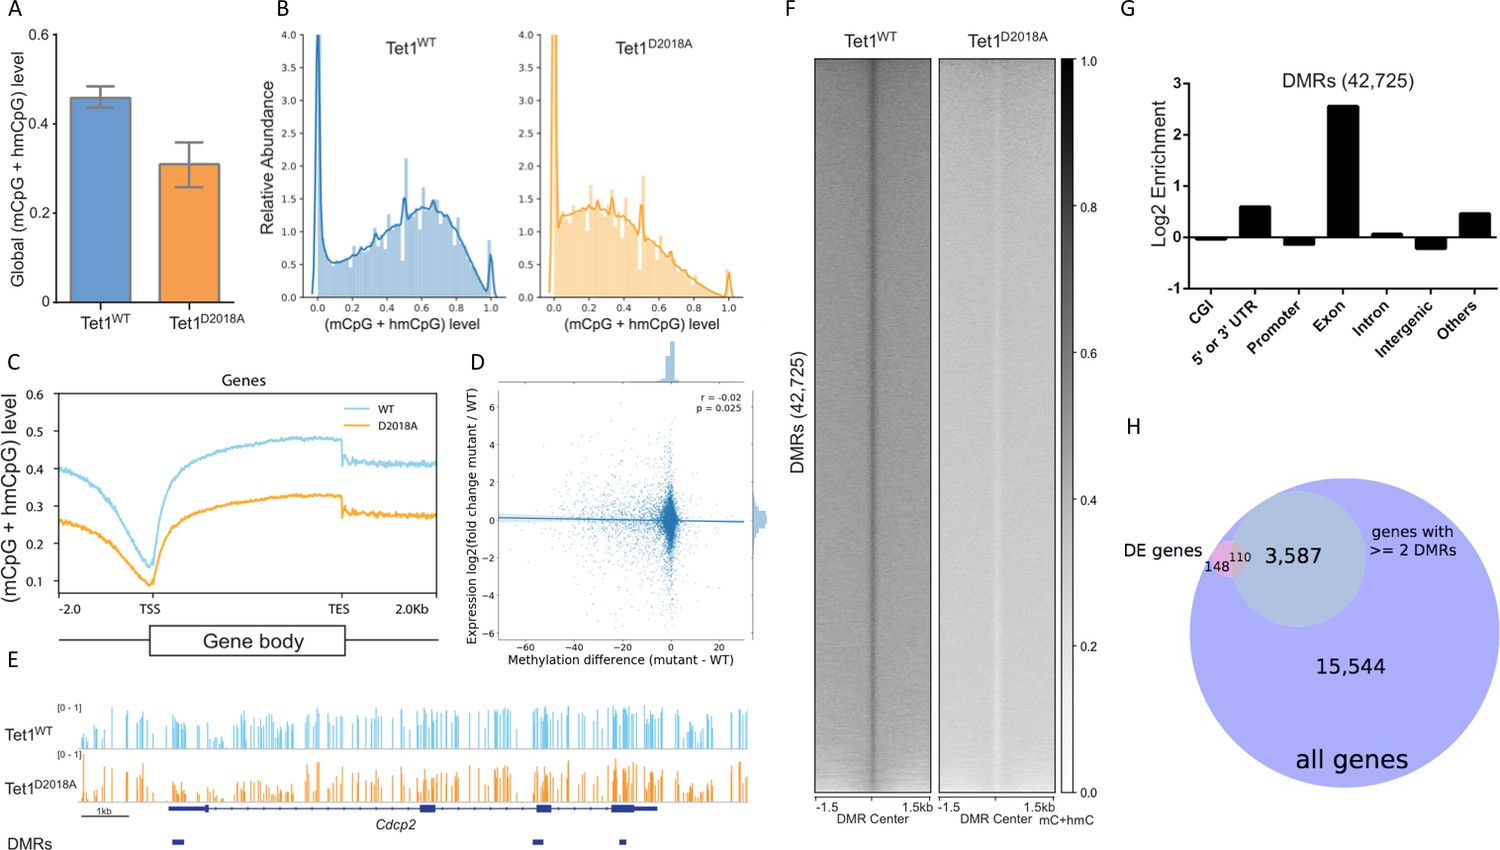
Whole genome bisulfite sequencing of WT and D2018A mESCs.
(A) Genome-wide levels of mCpG +hmCpG. (B) Distribution of mC +hmC levels for individual CG sites fitting with kernel density estimate (KDE). (C) Distribution of averaged mCpG +hmCpG level at all genes. (D) Scatter plot of difference (D2018A - WT) in average CpG methylation in a 500 bp window around each promoter vs. log2 fold change (D2018A/WT) of corresponding genes. (E) An example of hypo CG-DMRs in exons of Cdcp2 gene in D2018A mESCs. (F) Average mCpG +hmCpG level ((h)mCG/CG) of individual ranked DMRs and flanking regions (±1.5 kb). (G) Genomic annotations of hypo CG-DMRs in D2018A mESCs. CGI: CpG island. (H) Overlap between DEGs and the set of genes with ≥ 2 DMRs between the gene's start and end sites (hypergeometric p value = 1.770e-19).
Figure 8—figure supplement 1
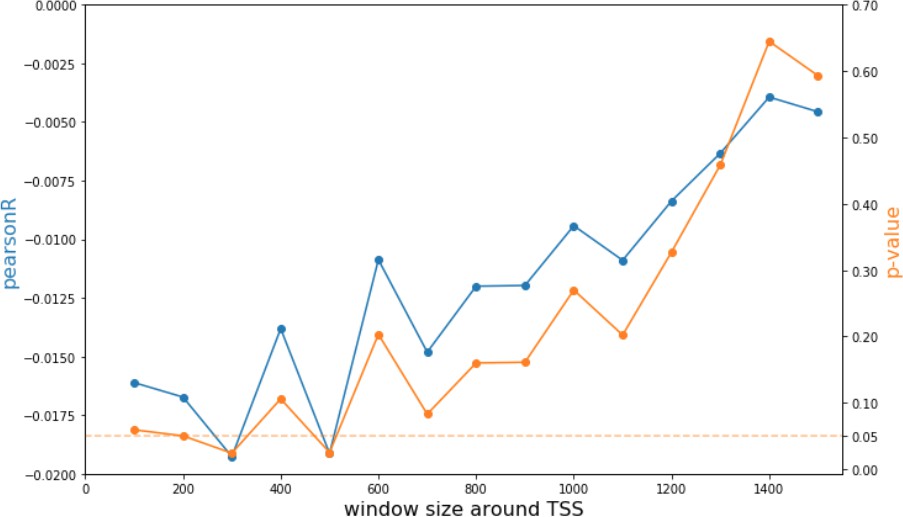
Analysis of CpG modification changes in promoters of differentially expressed genes.
Pearson correlations and p-values of comparisons between promoter CpG modifications and fold change of corresponding genes as a function of window size around each promoter.
Figure 9
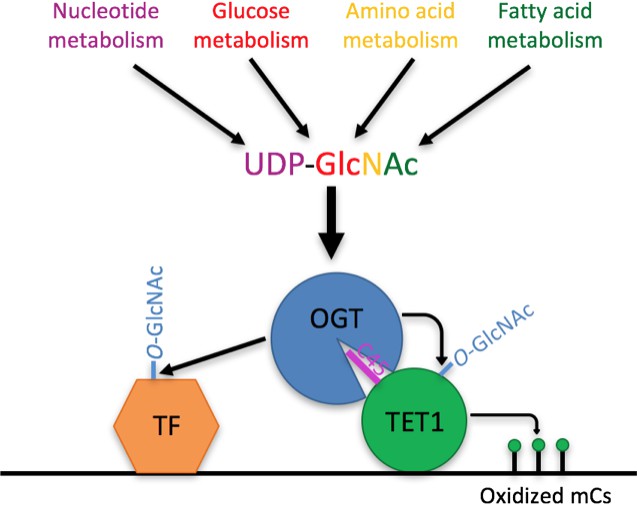
Model Model showing two roles of the TET1-OGT interaction in regulation of gene expression.
OGT’s activity is regulated by the abundance of its cofactor UDP-GlcNAc, whose synthesis has inputs from nucleotide, glucose, amino acid, and fatty acid metabolism. OGT (blue circle) binds to TET1 (large green circle) via the TET1 C45 (purple line). OGT modifies TET1 and regulates its catalytic activity (small green circles representing modified cytosines). At the same time, TET1 binding to DNA brings OGT into proximity of other DNA-bound transcription factors (orange hexagon), which OGT also modifies and regulates.
Additional files
-
Supplementary file 1
Genes changed 2-fold or more in D2018A vs WT mESCs by RNA-seq
- https://doi.org/10.7554/eLife.34870.023
-
Supplementary file 2
Primers used for creating and genotyping mESC lines
- https://doi.org/10.7554/eLife.34870.024
-
Supplementary file 3
Gene blocks amplified to make HDR templates
- https://doi.org/10.7554/eLife.34870.025
-
Supplementary file 4
Primers used for qPCR
- https://doi.org/10.7554/eLife.34870.026
-
Supplementary file 5
Analysis of zebrafish larvae.
(A) Representative images of larvae with high and low runx1 expression. (B) Embryo numbers and scoring for all five biological replicates.
- https://doi.org/10.7554/eLife.34870.027
-
Transparent reporting form
- https://doi.org/10.7554/eLife.34870.028
Download links
A two-part list of links to download the article, or parts of the article, in various formats.
Downloads (link to download the article as PDF)
Open citations (links to open the citations from this article in various online reference manager services)
Cite this article (links to download the citations from this article in formats compatible with various reference manager tools)
OGT binds a conserved C-terminal domain of TET1 to regulate TET1 activity and function in development
eLife 7:e34870.
https://doi.org/10.7554/eLife.34870


