Embryonic hematopoiesis modulates the inflammatory response and larval hematopoiesis in Drosophila
- Institut de Génétique et de Biologie Moléculaire et Cellulaire, France
- Centre National de la Recherche Scientifique, France
- Institut National de la Santé et de la Recherche Médicale, France
- Université de Strasbourg, France
Figures
Figure 1 with 4 supplements
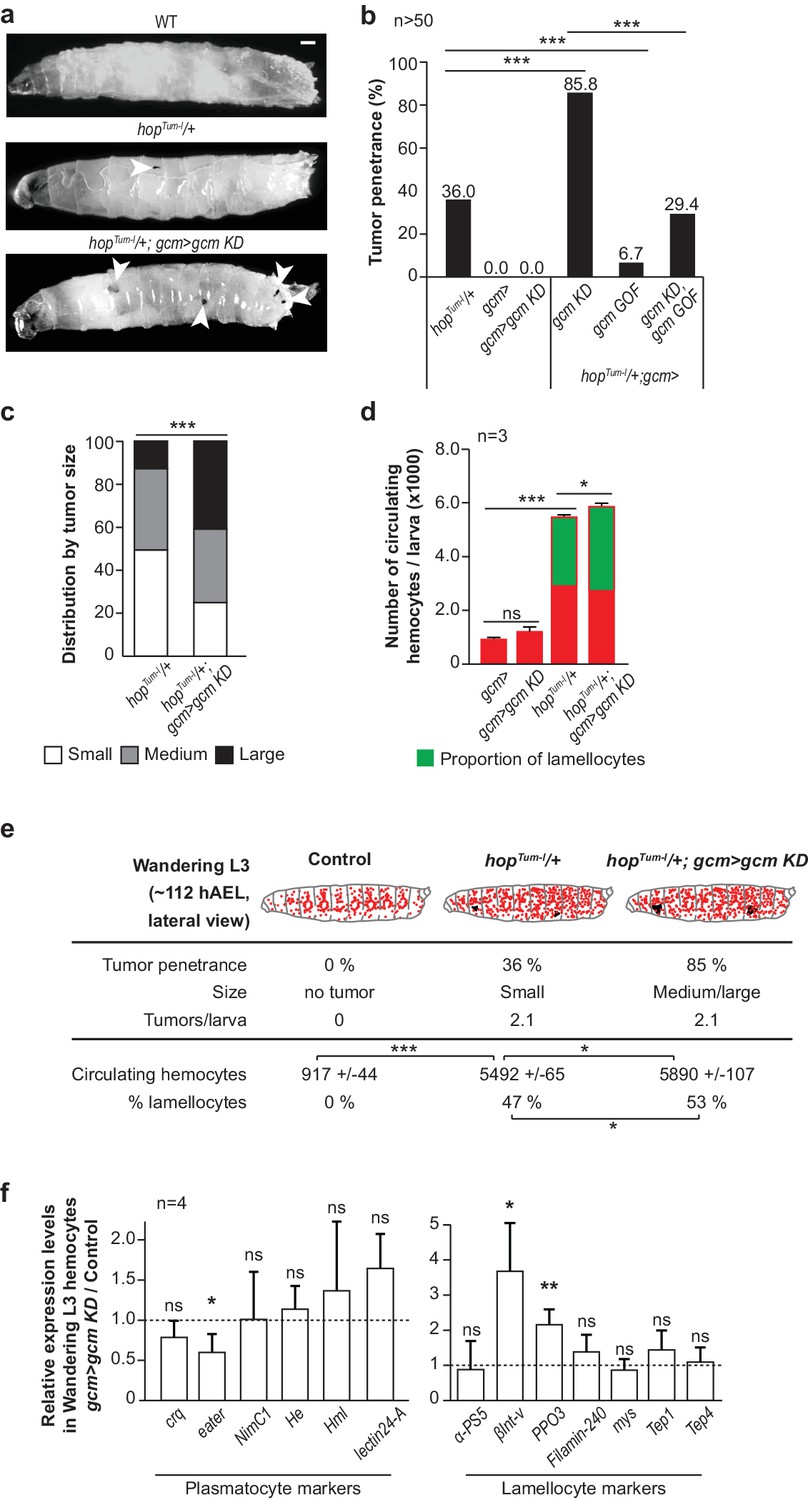
Gcm hinders Jak/Stat-mediated melanotic tumor formation.
(a) Third instar larvae of the indicated genotypes (Note that all the detailed genotypes are in the Supplementary Methods, Fly strains and genetics section). White arrowheads indicate the melanotic tumors. (b) Penetrance of melanotic tumors (50). (c) Phenotype expressivity assessed as tumor size (n > 40). (d) Total number of circulating hemocytes and lamellocyte contribution (n = 3, using 10 larvae/replicate). (e) Hemocytes (red) and tumors (black) in third instar larvae of the mentioned genotypes. Assessment in terms of tumor penetrance, size and number of tumors/larva, number of circulating hemocytes and percentage of lamellocytes (n = 3, using 10 larvae/replicate). In all figures, *p<0.00.5, **p<0.01; ***p<0.001, ns: not significant; scale bar: 50 µm unless otherwise specified. All the P values shown in this and in the following figures are in Figure 1—source data 1. (f) Relative expression levels of plasmatocyte and lamellocyte markers in larval hemocytes gcm> gcm KD compared to gcm> , measured by qPCR. The data are normalized to two housekeeping genes and then the ratio (gcm> gcm KD/gcm) is plotted (n = 4). The error bars represent the sum of the s.e.m. of gcm> gcm KD and gcm> .
-
Figure 1—source data 1
p-values for all figures.
- https://doi.org/10.7554/eLife.34890.007
Figure 1—figure supplement 1
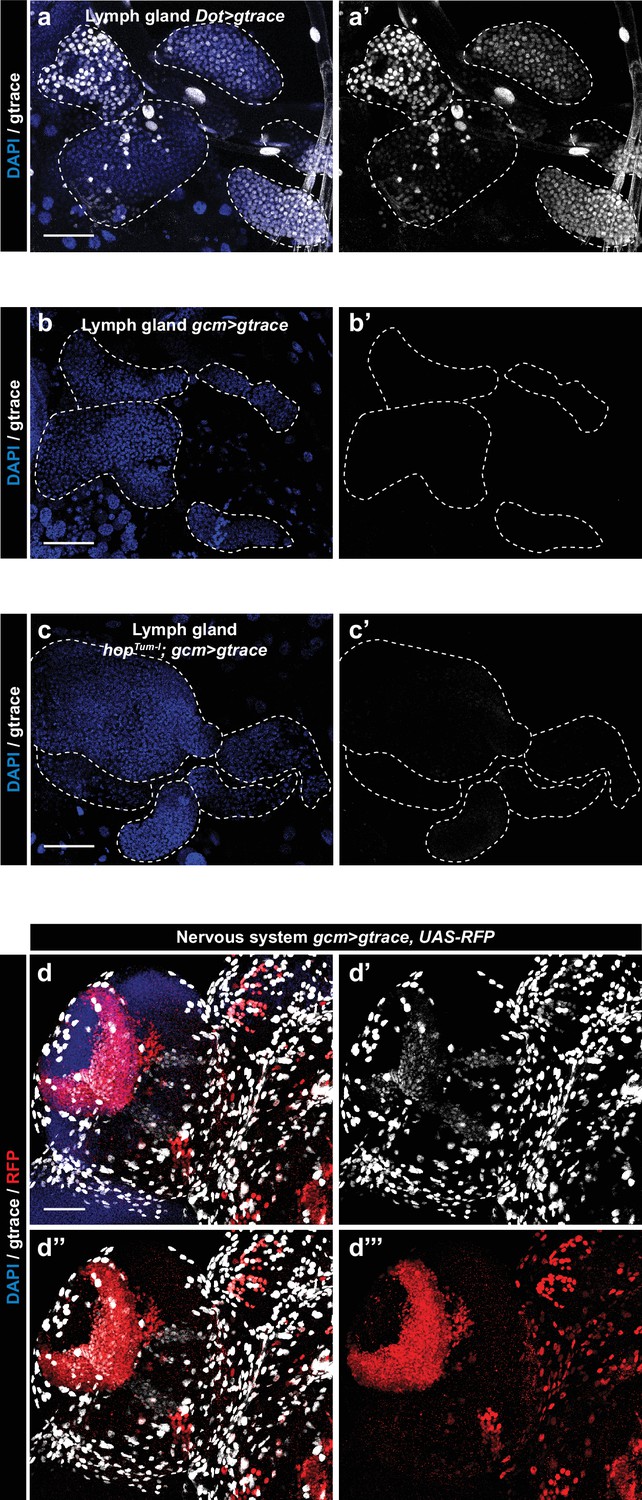
Gcm is not expressed in the second hematopoietic wave.
Control lineage tracing in the lymph gland of Wandering L3 using the lymph gland specific Dot> gtrace line (Kimbrell et al., 2002) (a,a’). Lineage tracing in Wandering L3 using gcmgtrace (b,b’) and hopTum-l;gcm> gtrace lines (c,c’). The gtrace construct allows the constitutive expression of GFP as soon as the driver (here Dot> or gcm> ) is expressed in the cell. Thus, the GFP signal indicates cells that have expressed the driver during development and/or are still expressing it (Evans et al., 2009). DAPI in blue and gtrace in white, maximum Z-projections. Note the expression of Dot in all the cells of the lymph gland (a,a’) and the absence of Gcm expression (b,b’) even upon constitutive Jak/Stat activation (c,c’). (d–d’’’) Control lineage tracing showing Gcm expression in the larval nervous system. In this case, the gcmgtrace,UAS-RFP construct makes it possible to specifically identify the cells currently expressing Gcm as RFP positive. Gcm is expressed in many cell lineages (glia for gtrace signal and lamina neurons (Chotard et al., 2005) for RFP+ gtrace signals).
Figure 1—figure supplement 2
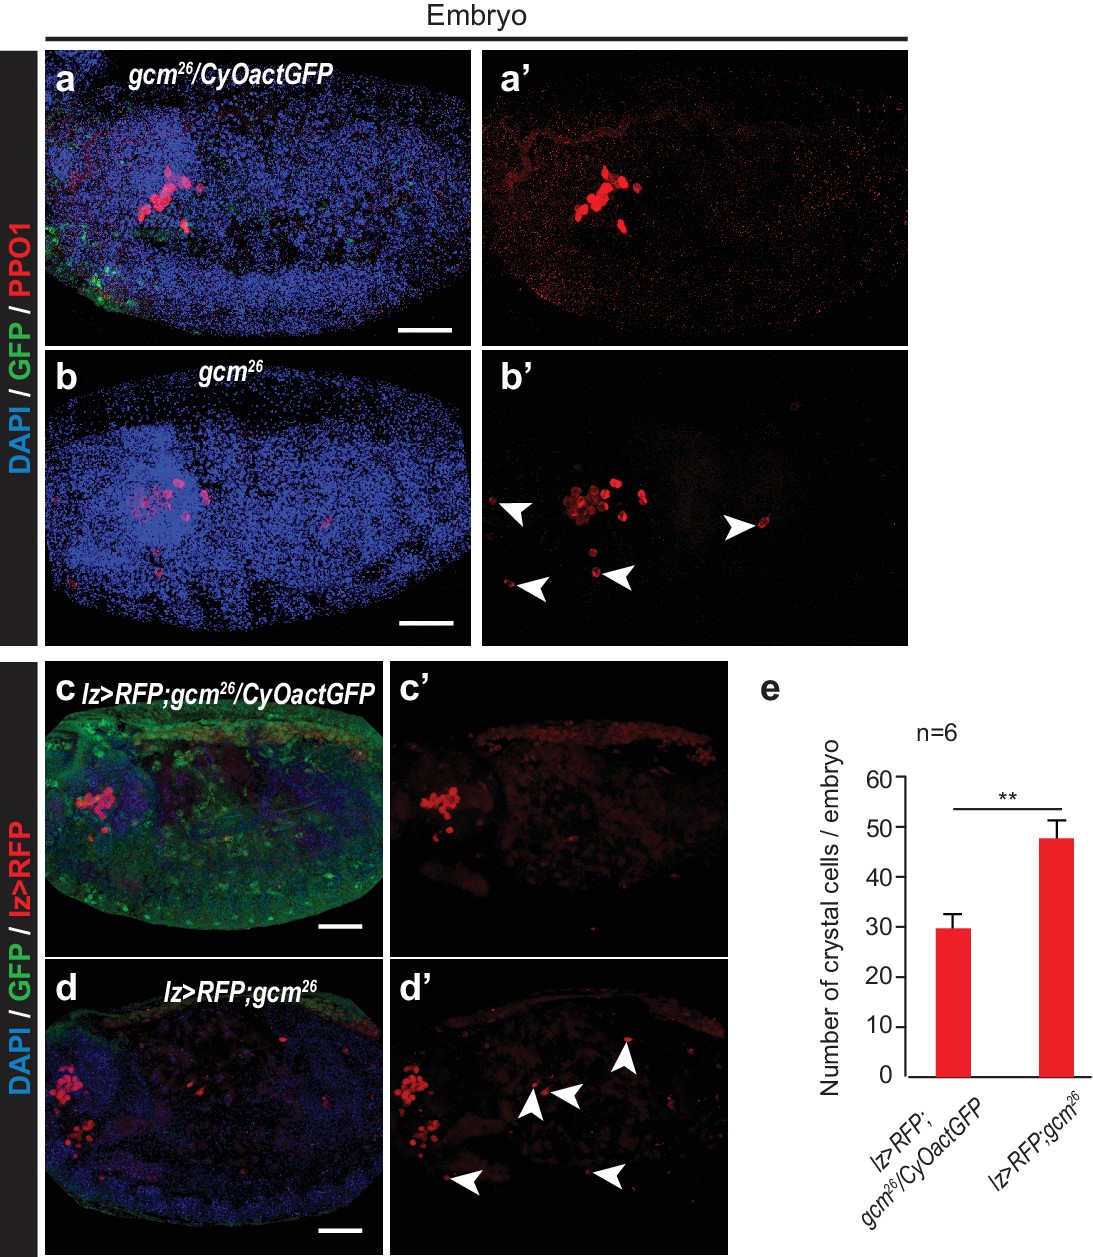
Crystal cell phenotype in gcm26 embryos.
(a–b’) Immunolabelling of gcm26/CyOactinGFP (a,a’) and gcm26 homozygous embryos (b,b’) (DAPI in blue, GFP in green, PPO1 crystal cell marker in red). (a,b) show merge of the three channels and (a’,b’) show PPO1 alone. (c–d’) Immunolabelling of lz> RFP,gcm26/CyOactinGFP (c,c’) and lz > RFP,gcm26 embryos (d,d’) (DAPI in blue, GFP in green, RFP in red). (c,d) show merge of the three channels and (c’,d’) show RFP labelling alone. (e) Number of crystal cells counted in stage 13 lz> RFP,gcm26/CyOactinGFP and lz > RFP,gcm26 embryos. Note that in the mutant background, crystal cell labelling is also observed at ectopic positions, scattered along the embryo (white arrowheads in b’ and d’) and the total number of crystal cells increases compared to that observed in heterozygous embryos, in agreement with previous data (Bataillé et al., 2005).
Figure 1—figure supplement 3
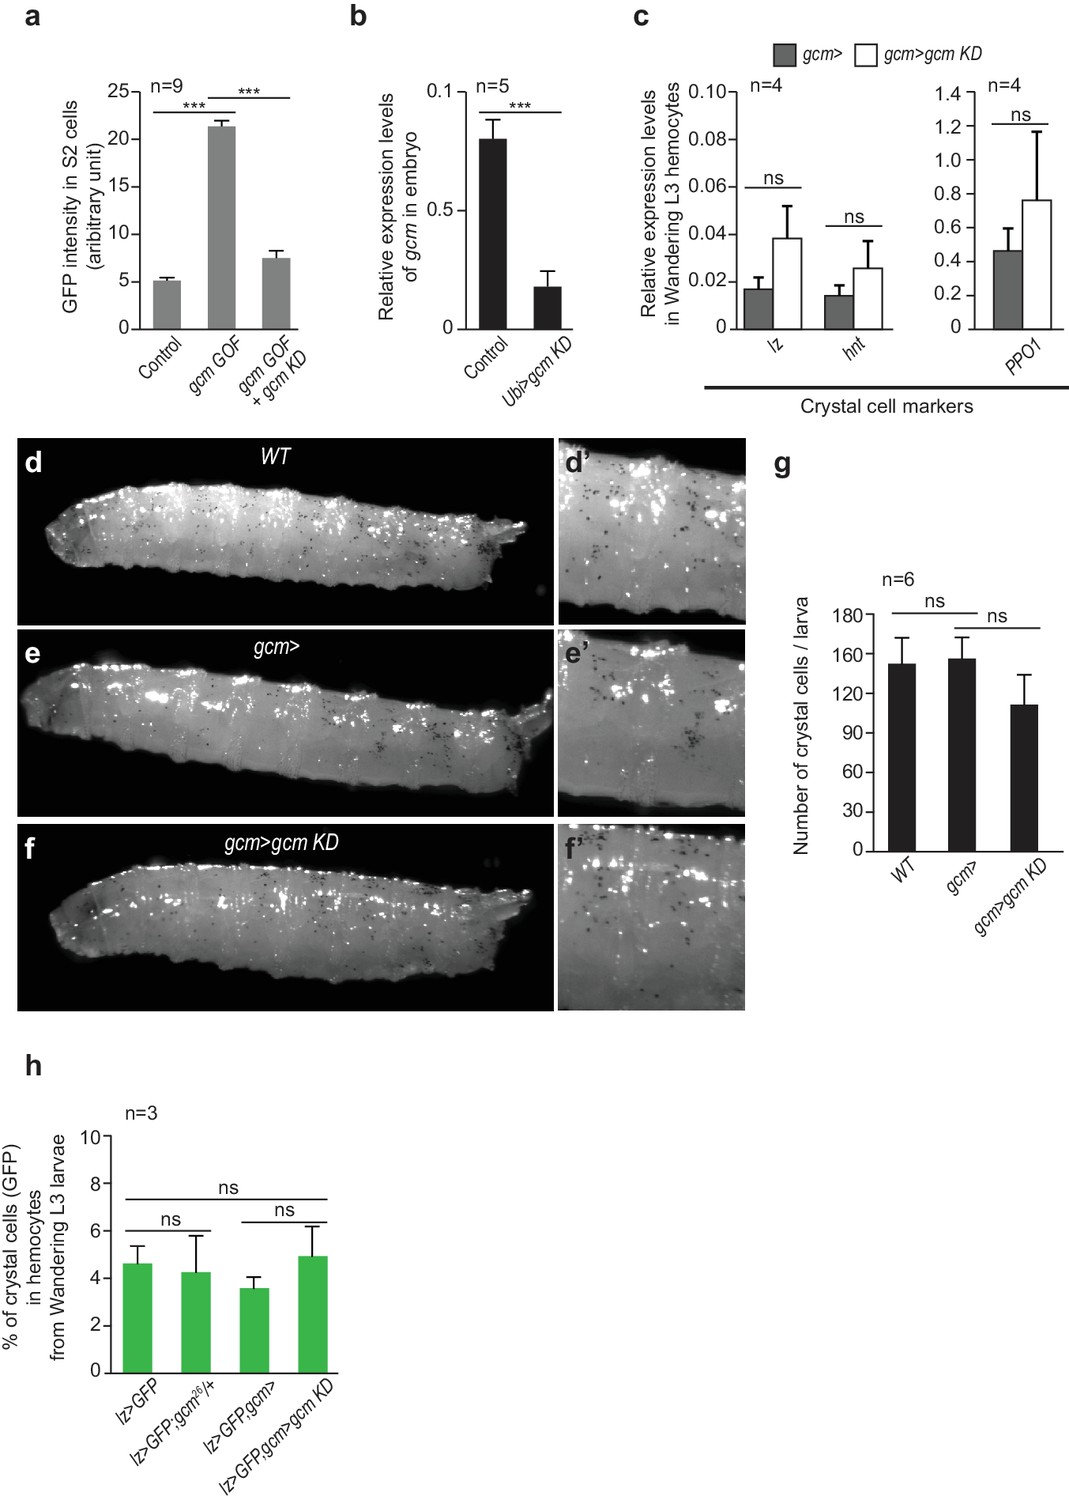
Crystal cell phenotype in gcm KD larvae.
(a) gcm RNAi efficiency in S2 cells detected by GFP intensity in gcm GOF + gcm KD transfected S2 cells as compared to controls (n = 9). GFP signal measured upon transfection with pPac-gal4, pUAS-gcm and repo-GFP plasmids (column 2) or pPac-gal4, pUAS-gcm, pUAS-gcmRNAi and repo-GFP plasmids (column three) respectively. repo-GFP represents the reporter for Gcm activity (Laneve et al., 2013). (b) gcm RNAi efficiency in embryos. The levels of gcm were measured by qPCR on embryos (overnight lay) of the following genotypes: UAS-gcmRNAi/+ (Control) and Ubi> gcm KD (Ubi> is a driver ubiquitously expressed). The levels are represented relative to the two housekeeping genes Gapdh1 and Act5c. (c) Relative expression levels of crystal cell markers in hemocytes from gcm> and gcmgcm KD Wandering L3 measured by qPCR and normalized to two housekeeping genes (n = 4). (d–f’) Crystal cells visualized in Wandering L3 after heat treatment at 70°C for 10 min. (g) Average number of crystal cells/larva in WT, gcm> and gcmgcm KD animals (n = 6). (h) Average percentage of crystal cells in circulating and sessile compartments in the mentioned genotypes, using the lz> GFP driver specific to crystal cells (Waltzer et al., 2003; Osman et al., 2009) (n = 3).
Figure 1—figure supplement 4
Gcm inhibits Jak/Stat-mediated melanotic tumor formation.
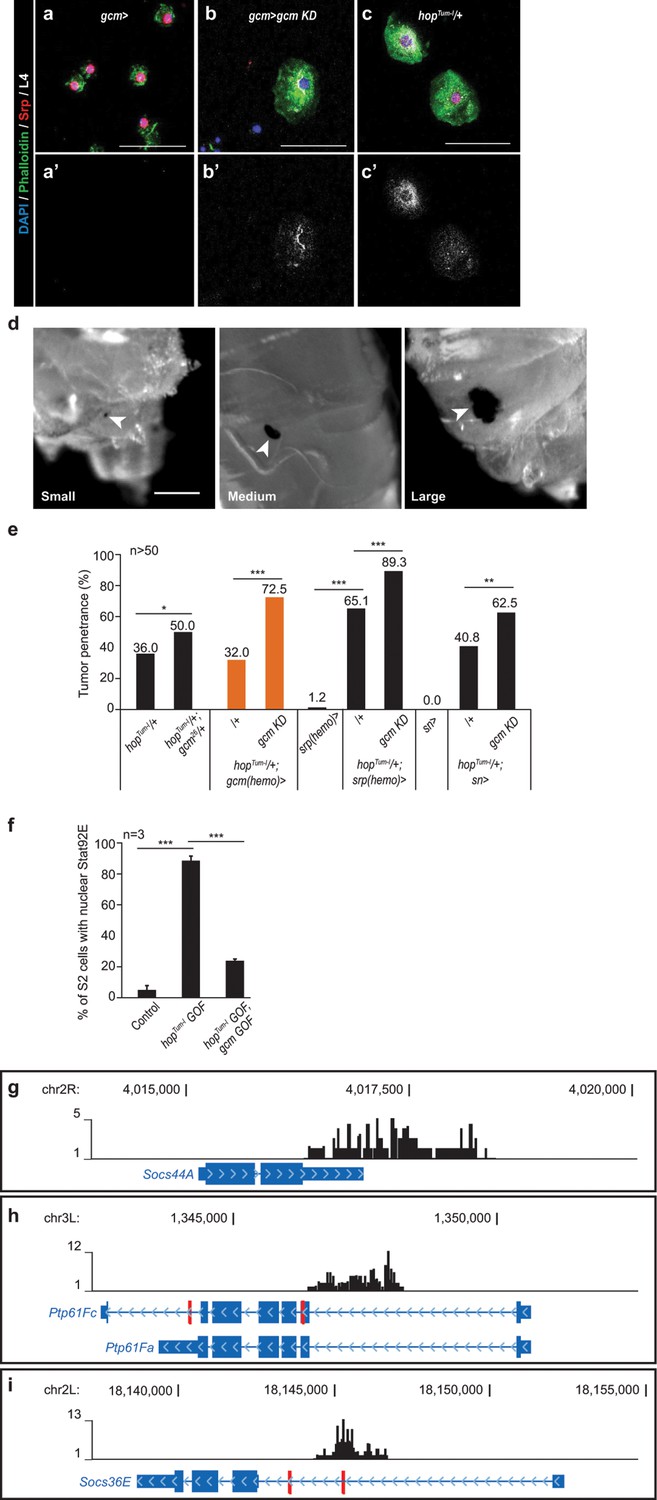
(a–c) Immunolabelling of hemocytes from Wandering L3 of the mentioned genotypes (DAPI in blue, Phalloidin in green, Srp in red, lamellocyte marker L4 in white), (n > 3). Strong Phalloidin labelling is specific to lamellocytes (Avet-Rochex et al., 2010; Stofanko et al., 2010). In all fluorescent confocal images, maximum Z-projections are presented. (d) Melanotic tumors of different size (arrowheads). See Materials and methods for quantitative assessment. (e) Tumor penetrance in hopTum-l/+;gcm26/+ larvae (column 2), hopTum-l/+;gcm(hemo)Gal4/+ (column 3), hopTum-l/+;srp(hemo)Gal4/+ (column 6) and hopTum-l/+;snGal4/+ (column 9) or upon gcm KD (columns 4, 7 and10) as compared to controls (n > 50). (f) Percentage of S2 cells presenting nuclear Stat92E labelling after transfection with pPac-gal4 and pUAS-RFP (Control), or pPac-gal4, pUAS-RFP and pUAS- hopTum-l (hopTum-l GOF), or pPac-gal4, pUAS-RFP, pUAS- hopTum-l and pPac-gcm (hopTum-l GOF, gcm GOF). The quantification was done on at least 20 cells in triplicates. The labelling is displayed in Figure 2a–c. (g–i) Loci containing DamID peaks (black), Gcm binding sites (GBSs, in red), blue arrows within the loci indicate the direction of transcription, histograms above the locus show a region of 1 kb on each side of a DamID peak scoring a FDR < 0.001, genomic coordinates of the loci are indicated above the histograms: Socs44A (g), Ptp61Fa (cytoplasmic isoform) and Ptp61Fc (nuclear isoform) obtained upon alternative splicing at the 3’ carboxyl terminal of Ptp61F (h) and Socs36E (i).
Figure 2
Gcm induces the expression of Jak/Stat inhibitors and hinders Jak/Stat-mediated melanotic tumor formation.
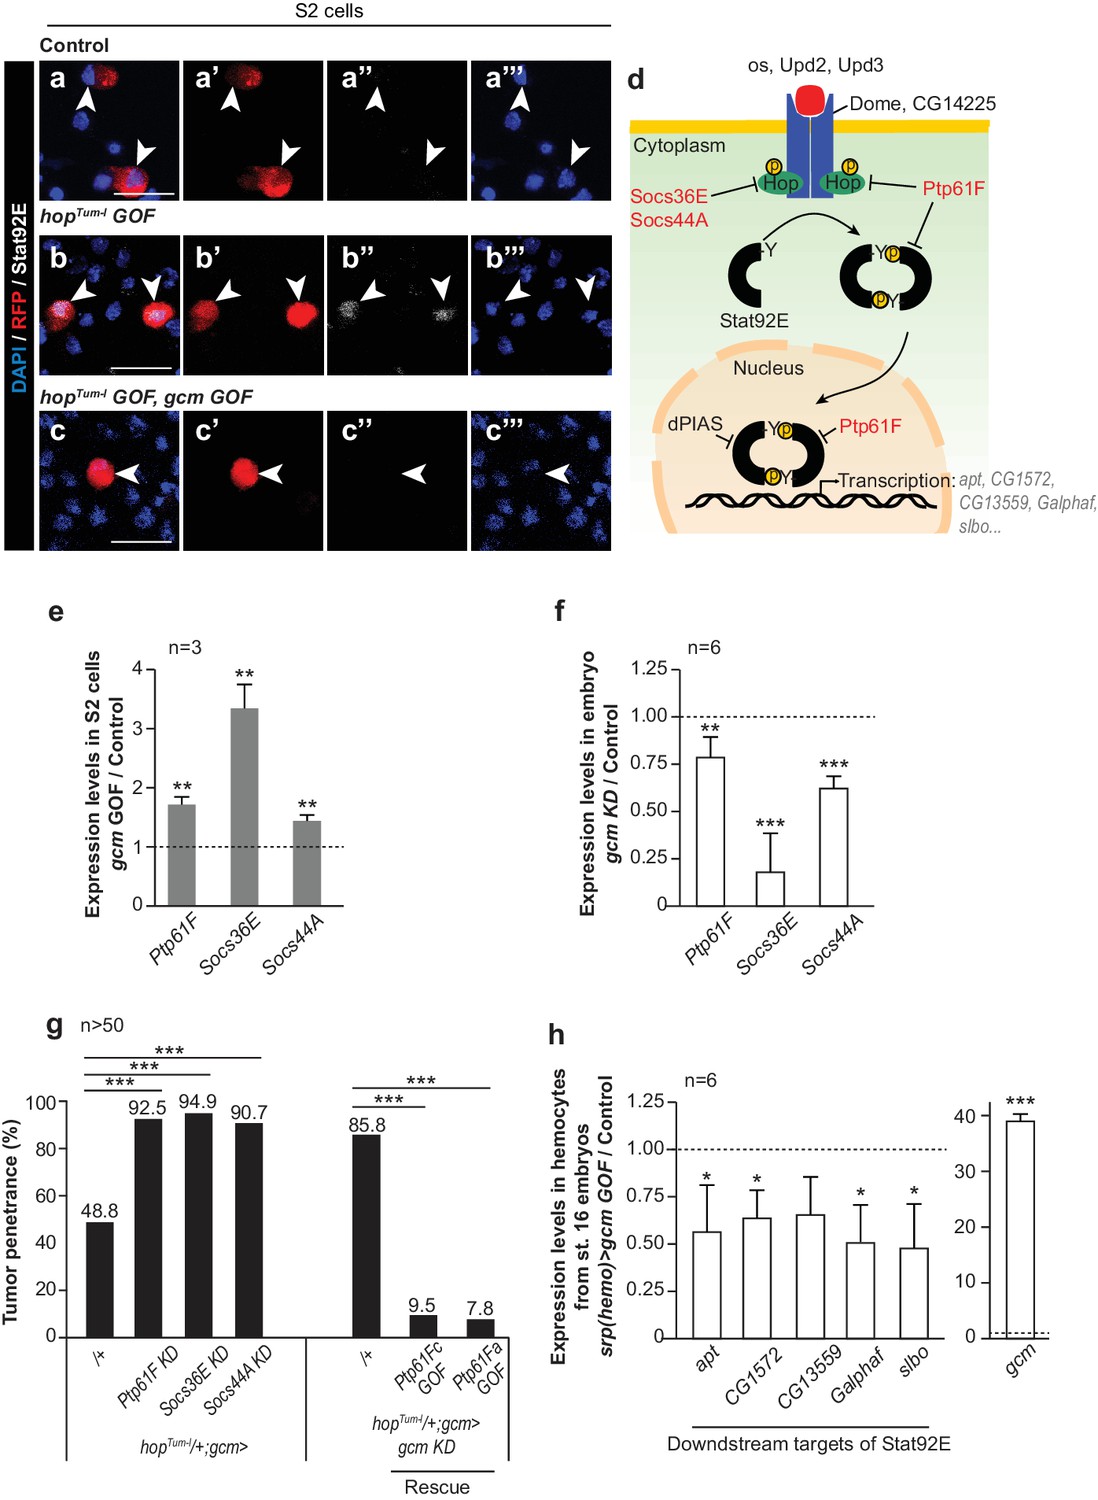
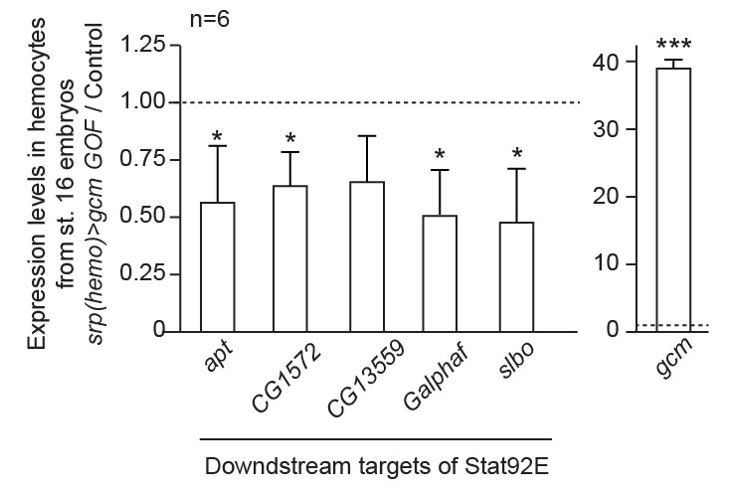
(a–c) Immunolabelling of S2 cells transfected with pPac-gal4 and pUAS-RFP (Control, (a), or pPac-gal4, pUAS-RFP and pUAS- hopTum-l (hopTum-l GOF, (b), or pPac-gal4, pUAS-RFP, pUAS- hopTum-l and pPac-gcm (hopTum-l GOF, gcm GOF, (c) and labelled for DAPI (blue), RFP (red) and Stat92E (gray). (a,b,c) show the merge of the three channels, (a’,b’,c’) show RFP alone, (a’’,b’’,c’’) show Stat92E alone and (a’’’,b’’’,c’’’) show DAPI. Arrowheads indicate transfected S2 cells. Scale bar: 20 µm. The percentage of cells presenting nuclear Stat92E is displayed in Figure 1—figure supplement 4f. (d) Jak/Stat pathway: inhibitors of the pathway that are regulated by Gcm are in red. (e,f) Relative expression levels of Jak/Stat inhibitors in S2 cells transfected with a pPac-gcm expression plasmid (three independent assays) (e) and in embryo gcm> gcm KD (f). In both cases, the data are relative to the levels in controls as described in Figure 1f. (g) Penetrance of melanotic tumors (n > 50). (h) Relative expression levels of Jak/Stat downstream targets (apt (Starz-Gaiano et al., 2008), CG1572 (Bina et al., 2010), CG13559 (Bina et al., 2010), Galphaf (Gα73b) (Bina et al., 2010; Bausek and Zeidler, 2014) and slbo [Silver and Montell, 2001]) in hemocytes from stage 16 embryo srp(hemo)> gcm GOF. The data are relative to the levels in controls as described in Figure 1f.
Figure 3
Embryonic hemocytes signal to the lymph gland.
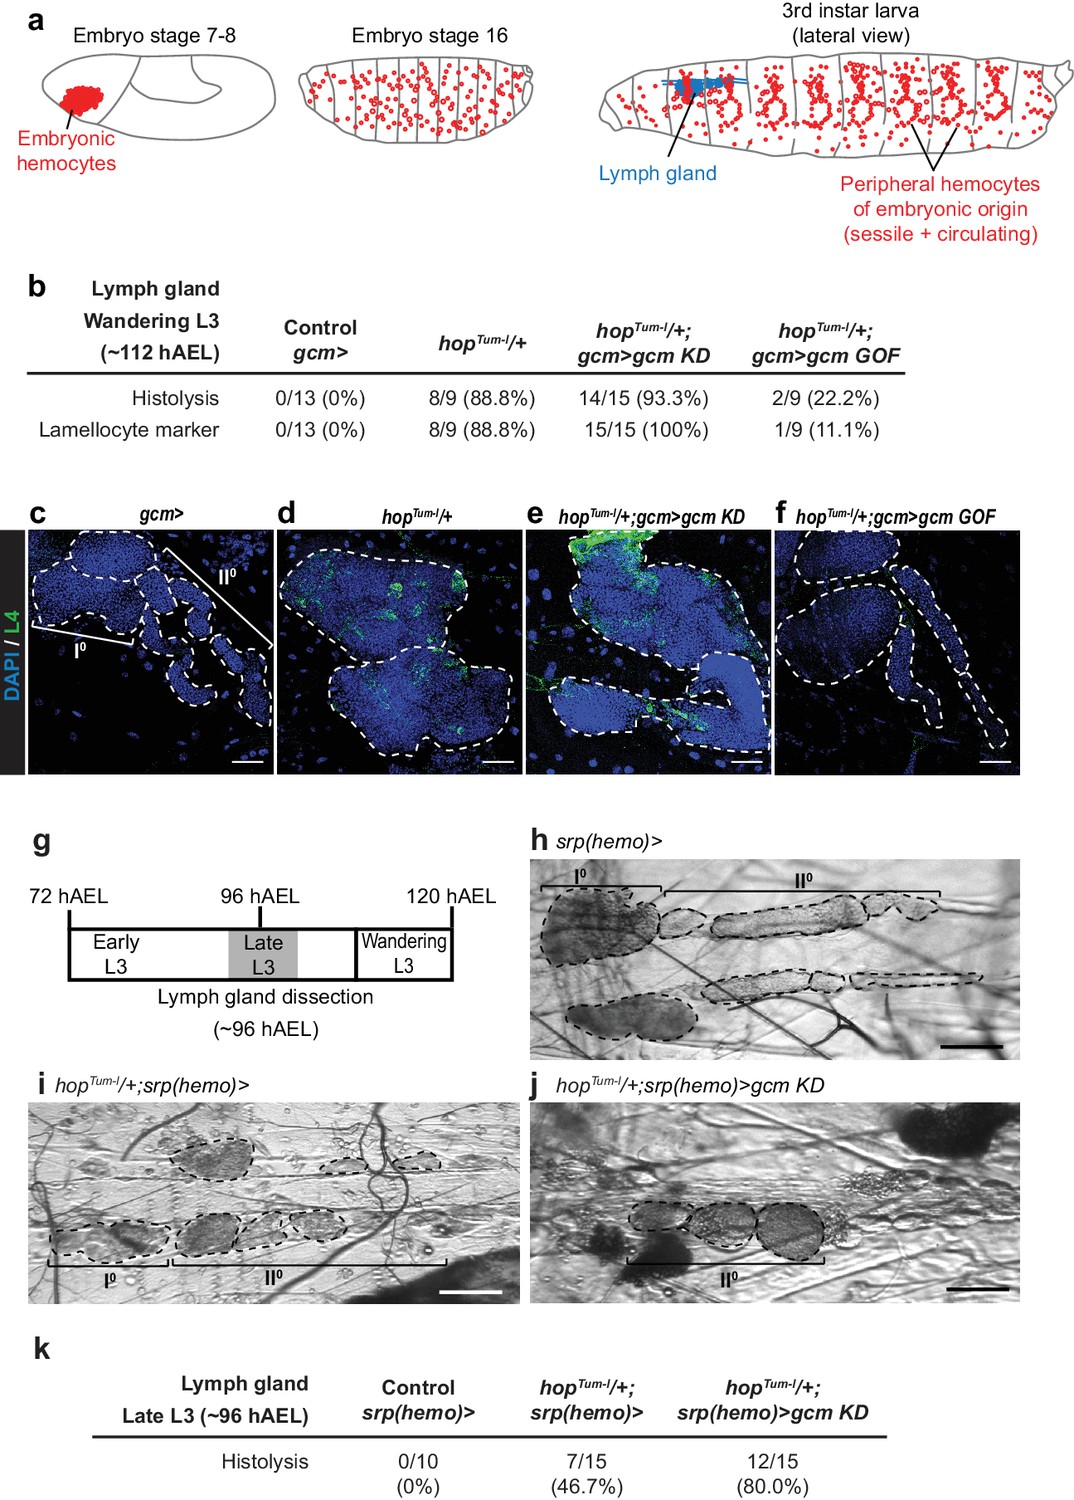
(a) Embryonic hemocytes (red) in early and late embryos as well as in a third instar larva. The lymph gland (blue) histolyzes at the larva to pupa transition. (b) Number and percentage of lymph glands showing histolysis and lamellocyte labelling (L4 marker, green) at wandering L3 stage, DAPI is in blue. (c–f) Lymph glands are indicated by hatched lines. (c) Control lymph gland (gcm> ): I° and II° indicate primary and secondary lobes, respectively. (d,e) show hypertrophic glands, lack of lobes and L4 expression. (f) rescue of the phenotype. (g–j) Bright-field images of lymph glands of the indicated genotypes (h–j) from Late L3 larva (~96 hAEL) as indicated in (g). I° and II° indicate primary and secondary lobes, respectively. Note that the lymph glands are partially histolyzed in hopTum-l/+;srp(hemo)> (i) and hopTum-l/+;srp(hemo)> gcm KD (j) animals. (k) Number and percentage of lymph glands showing histolysis at Late L3 stage (~96 hAEL).
Figure 4 with 1 supplement
Embryonic hemocytes signal through Upd2 and Upd3.
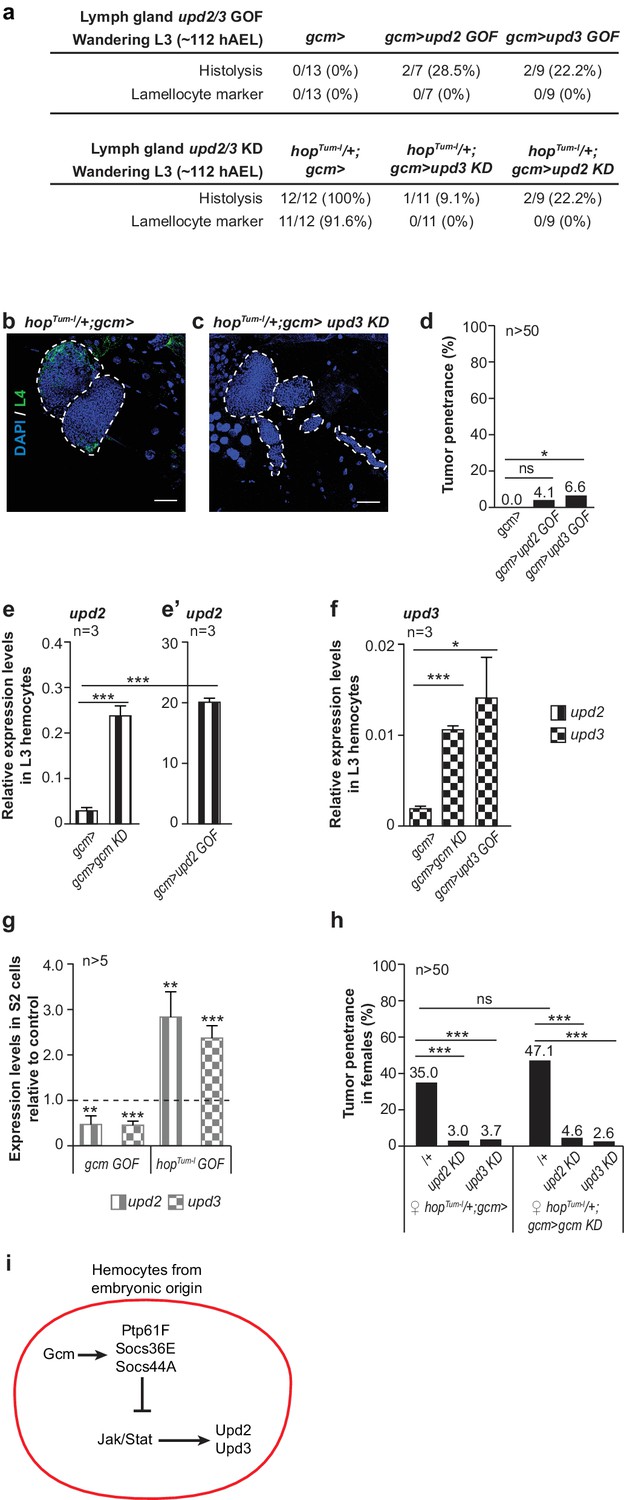
(a) Lymph gland phenotypes. (b,c) Lymph gland immunolabelling as in Figure 3c–f. (d) Tumor penetrance. (e–f) Relative expression levels of upd2 and upd3 in hemocytes from wandering L3 larvae of the mentioned genotypes. upd2 and upd3 expression levels increase in gcmgcm KD (e), first two columns from the left in e) and even further in gcm> upd2/3 GOF third instar larval hemocytes (e’), column three in (f). Note the different scale between (e) and (e’). (g) upd2 and upd3 expression levels in S2 cells upon transfection with pPac-gcm or pUAS-hopTum-l expression vectors, compared to control levels shown by the dashed line (transfection of an empty expression vector) (n > 5). (h) Tumor penetrance in third instar female larvae. (i) Schematic representation of Gcm contribution to Upd2 and Upd3 production from embryonic hemocytes.
Figure 4—figure supplement 1
Interaction between Jak/Stat pathway, Gcm and Upd2/Upd3 cytokines.
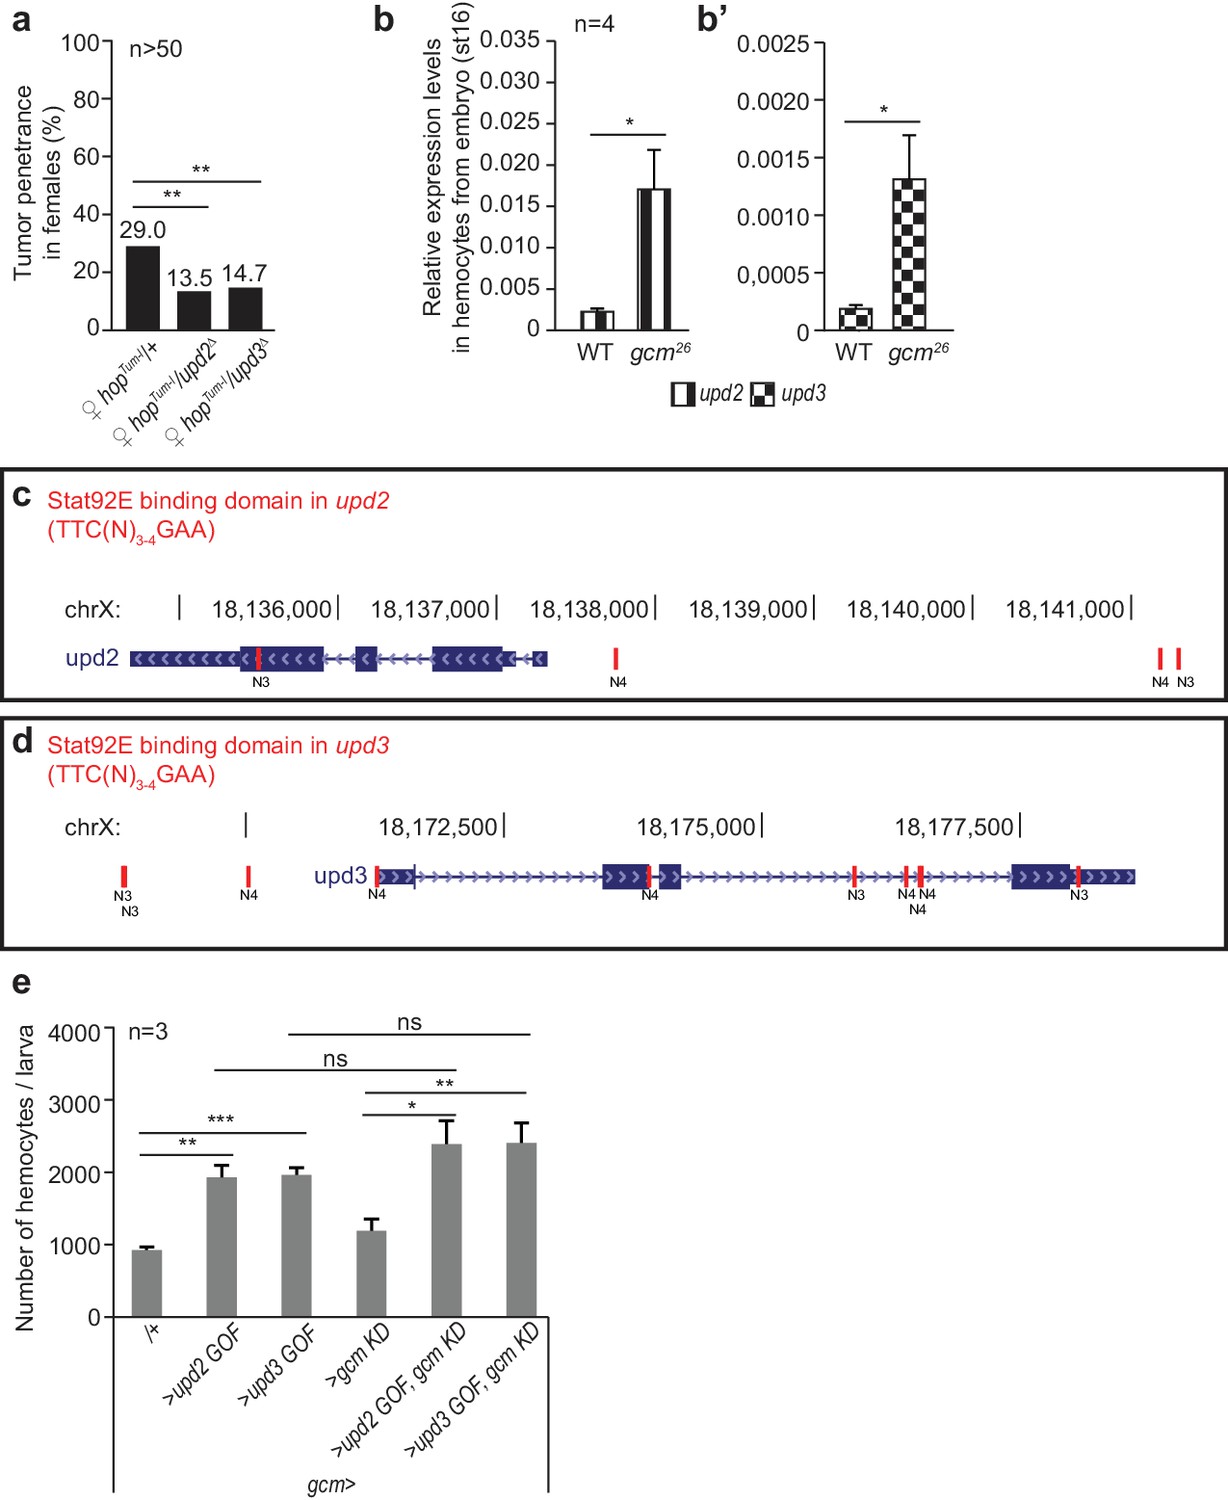
(a) Tumor penetrance in double heterozygous female larvae hopTum-l/upd2Δ and hopTum-l/upd3Δ. (b,b’) upd2 and upd3 expression levels in hemocytes sorted from stage 16 control embryos (srp(hemo)Gal4/UAS-RFP) or gcm26 embryos (srp(hemo)Gal4, gcm26/UAS-RFP,gcm26). Note that the levels of upd2 and upd3 are at the limit of the detection range in WT hemocytes and their levels increase strongly in gcm26 hemocytes. (c,d) Canonical Stat92E binding sites (TTC(N)3-4GAA) (Yan et al., 1996) at upd2 and upd3 loci (in red), symbols as in Figure 1—figure supplement 1. (e) Total number of circulating hemocytes in the indicated genotypes (n = 3).
Figure 5 with 1 supplement
Inflammatory response upon systemic and conditional Jak/Stat activation.
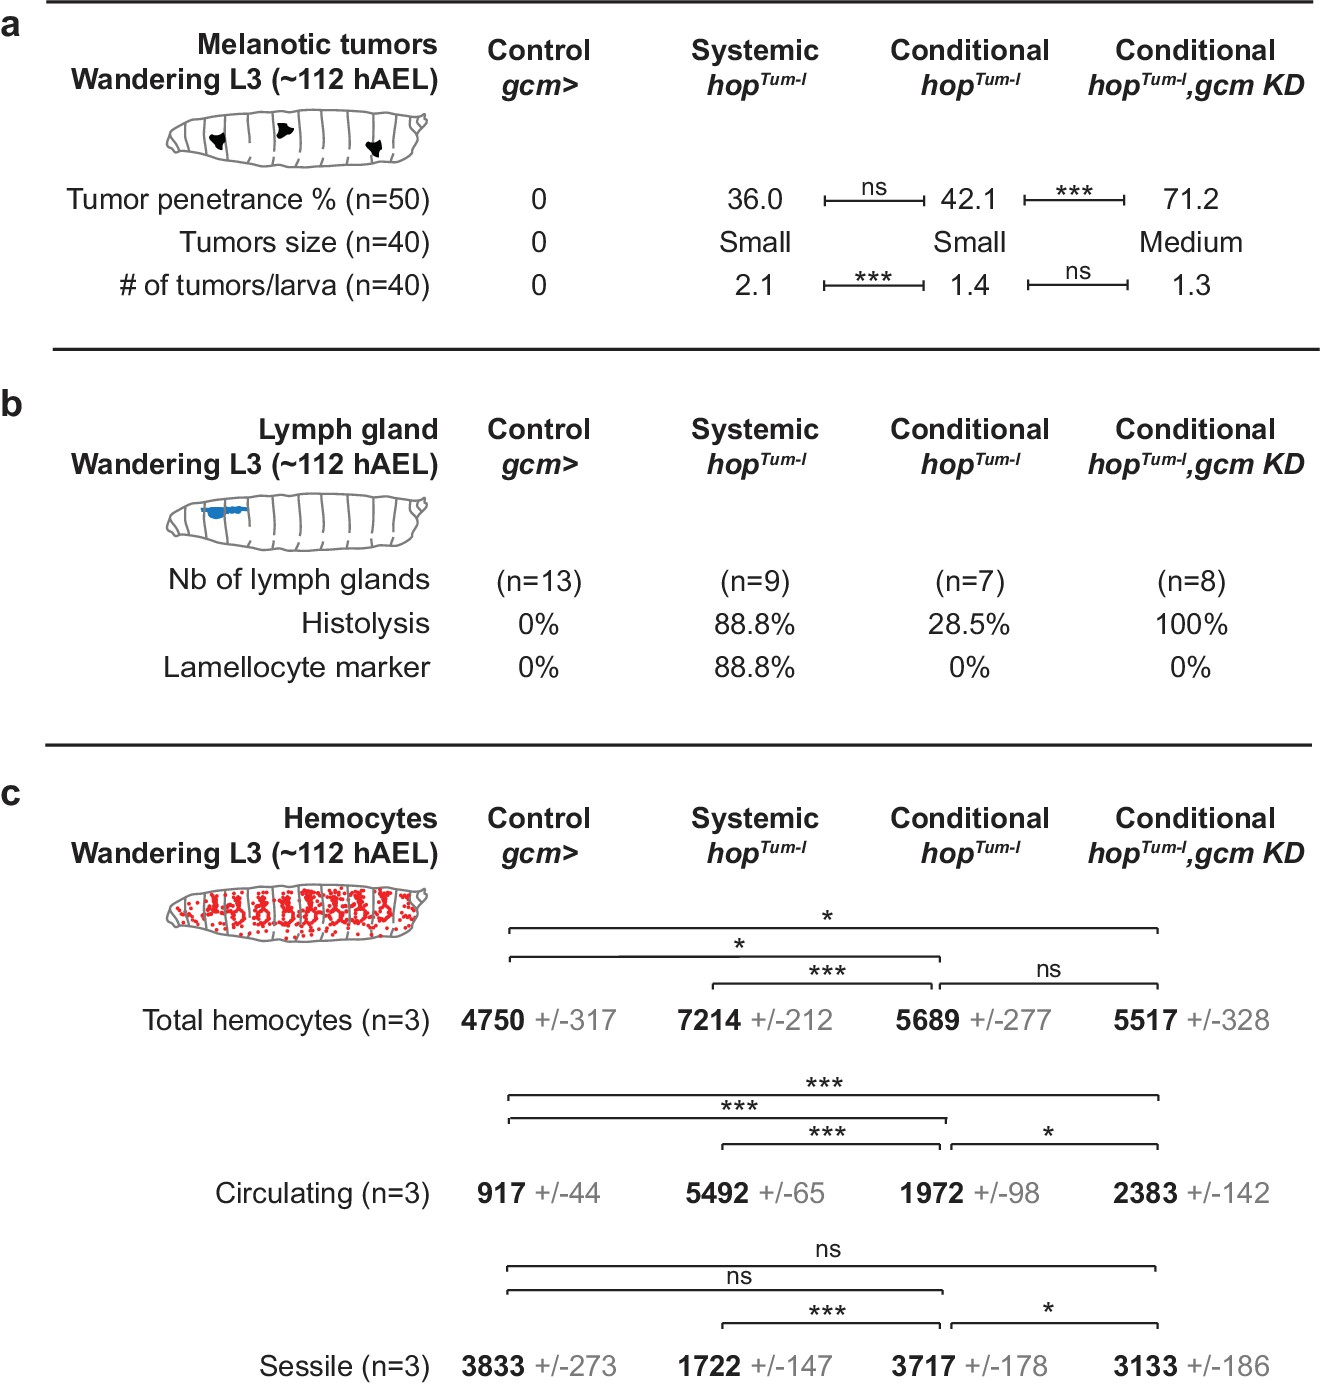
(a) Tumor penetrance, phenotype expressivity assessed as number of tumors/larva and tumor size of control animals (gcm> ), systemic hopTum-l, conditional hopTum-l (gcm> UAS-hopTum-l) and conditional hopTum-l,gcm KD (gcm(hemo)> gcm KD,UAS-hopTum-l). The distribution of the tumor size is detailed in Figure 5—figure supplement 1b. (b) Precocious lymph gland histolysis and lamellocyte labelling, note the 100% histolysis in conditional hopTum-l,gcm KD. (c) Total number of hemocytes (circulating +sessile), number of circulating hemocytes and number of sessile hemocytes in systemic and conditional hopTum-l mutations as compared to controls. n = 3, the numbers in gray indicate s.e.m.
Figure 5—figure supplement 1

Phenotypes induced by conditional activation of the Jak/Stat pathway in the embryonic hemocytes.
(a) Tumor penetrance in conditional hopTum-l animals (UAS-hopTum-l) using srp(hemo)> , sn> , gcm> and gcm(hemo)> drivers as compared to hopTum-l/+ (n > 50). (b) Tumor expressivity assessed as tumor size (n = 40). (c) Fraction of PH3 positive (dividing) cells in circulating and sessile compartment in the systemic and conditional hopTum-l mutations as compared to controls (n = 3). (d–f) Percentage of lamellocytes in whole hemocyte population (circulating + sessile, Total) (d), circulating (e) and sessile (f) compartments in the mentioned genotypes (n = 3). (g–i) 10XStat92E-GFP reporter intensity in somatic muscles. (j–k) Relative expression levels of upd2 (j) and upd3 (k) in hemocytes from wandering L3 hemocytes srp(hemo)> and srp(hemo)> hopTum-1, n = 3.
Figure 6
Jak/Stat activation in the embryonic hemocytes activates the Jak/Stat pathway in Wandering L3 muscles.
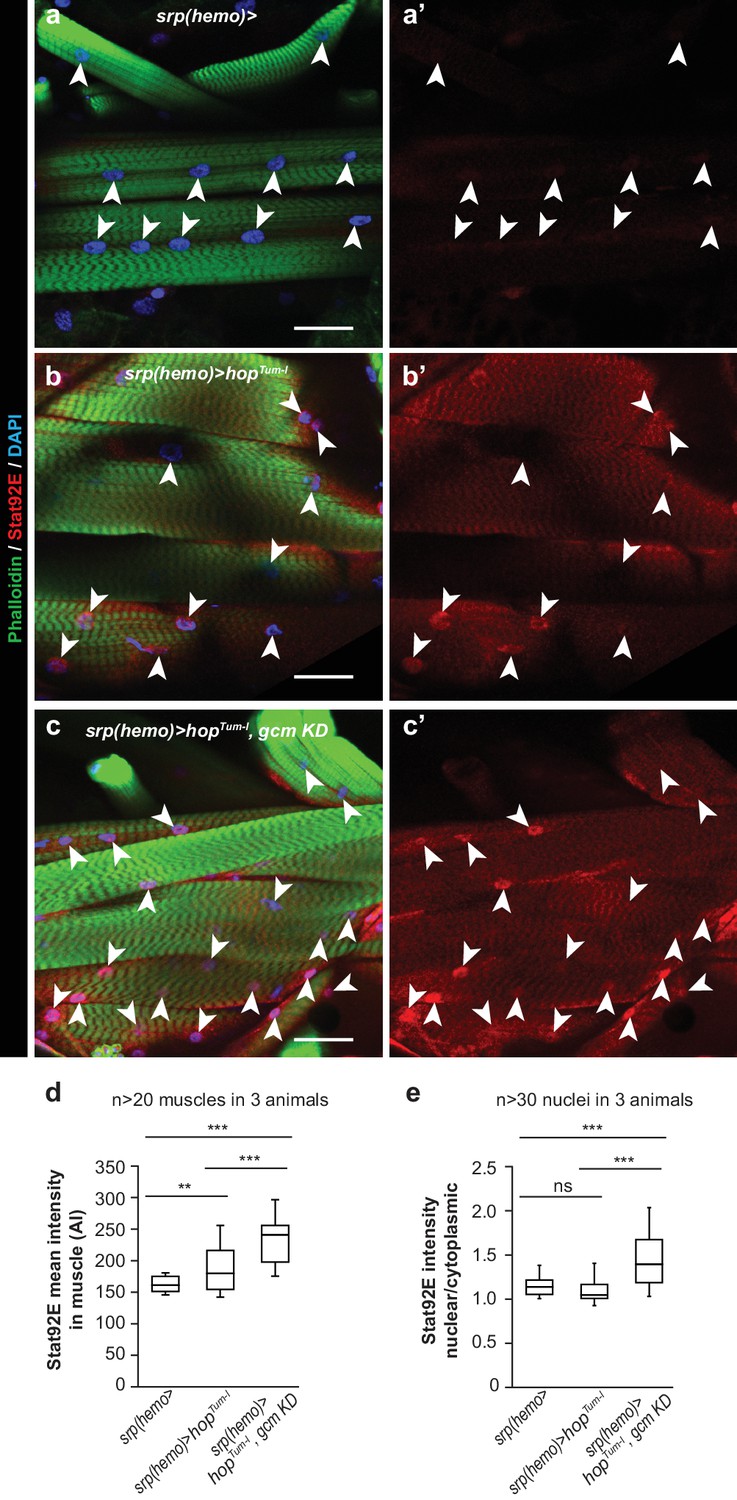
(a–c) Muscle immunolabelling in Wandering larvae of the indicated genotypes. The Phalloidin labelling (in green) highlights the striated muscle fibers rich in actin filament, Stat92E is in red and DAPI in blue. (a,b,c) show the merge of the three channels, (a’,b’,c’) show Stat92E alone. Scale bar: 50 µm. Arrowheads indicate nuclei in the muscles. (d,e) Box-plots representing the distribution of Stat92E intensity (d) and the ratio nuclear/cytoplasmic Stat92E (e) in Wandering L3 muscles of the indicated genotypes. Stat92E intensity was quantified in more than 20 muscles in three animals and the ratio nuclear/cytoplasmic Stat92E was measured in more than 30 nuclei in three animals for each genotype. From bottom to top, the boxes represent the 5% percentile, the first quartile, the median, the third quartile and the 95% percentile. P-values were measured using student test after variance analysis.
Figure 7
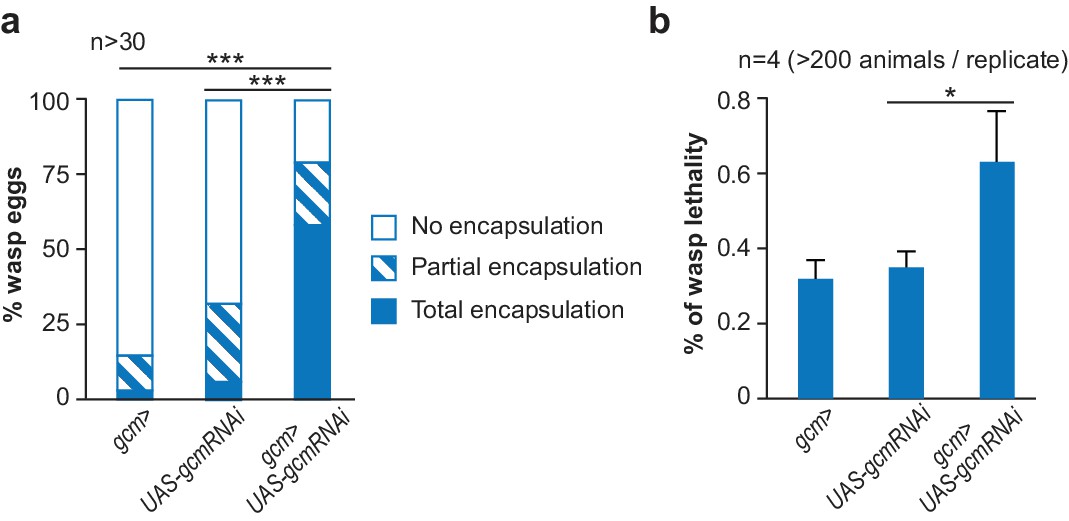
The inflammatory response upon wasp infestation is exacerbated in gcm KD animals.
(a) Histogram representing the percentage of total, partial and no wasp egg encapsulation (n > 30). (b) Lethality of the parasitic wasp after infestation of Drosophila larvae (n = 4) (> 200 animals).
Figure 8 with 1 supplement
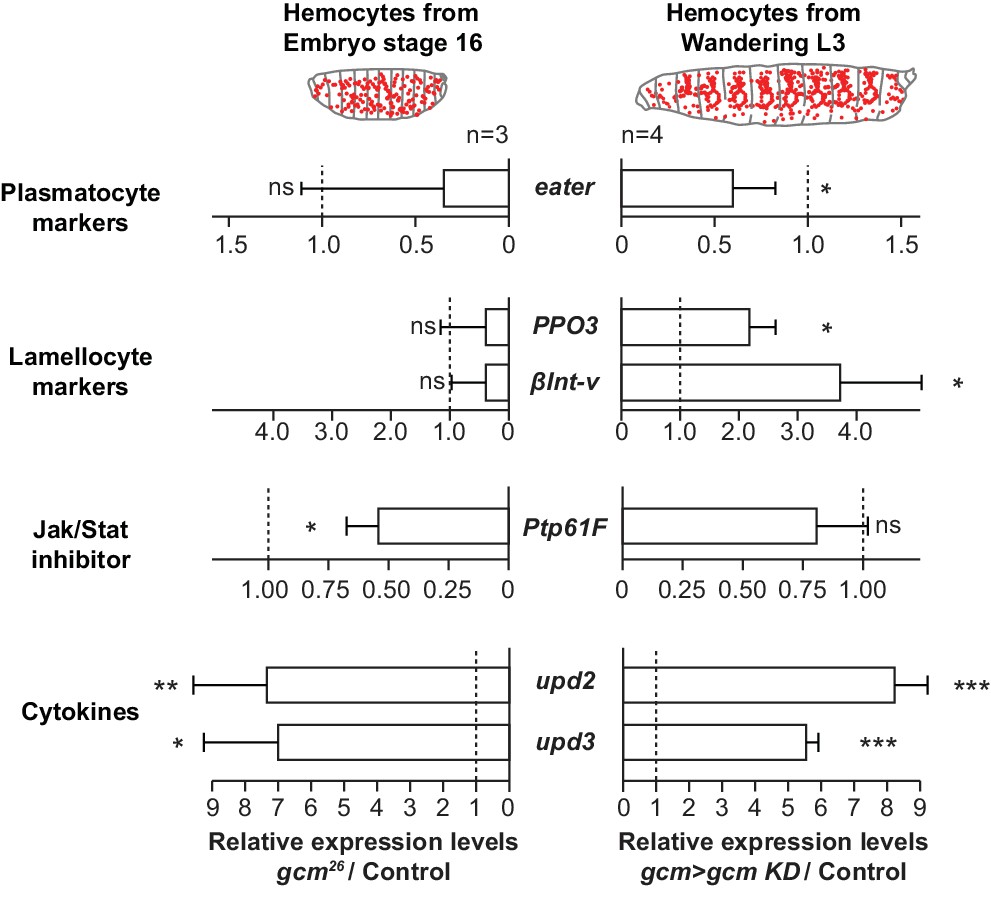
Gcm impacts the development and the inflammatory response of hemocytes.
Relative expression levels of plasmatocyte and lamellocyte markers, Jak/Stat inhibitor and cytokines in hemocytes from stage 16 mutant embryos (srp(hemo)> RFP,gcm [Cattenoz et al., 2016]) or from third instar mutant larvae (gcm> gcm KD). The levels represented are relative to the levels in controls (srp(hemo)> RFP for the embryos and gcm> for the larvae) after normalization against housekeeping genes. The data are displayed as described in Figure 1f.
Figure 8—figure supplement 1

Gcm is not induced in circulating hemocytes nor in lymph glands of 3rd instar larvae upon wasp infestation.
Immunolabelling of hemocytes from third instar larvae gcm> GFP without (a) or after wasp infestation (b). (DAPI in blue, GFP in green and Phalloidin in gray). (c) Immunolabelling of the lymph gland from third instar larva gcm> GFP after wasp infestation. (DAPI in blue, GFP in green). (d) Bright-field image of the melanised tumor induced by wasp infestation in gcm> gtrace LacZ Wandering L3 shown in Figure 9e. Scale bar: 100 µm.
Figure 9

Impact of the wasp infestation on the hemocytes.
(a) Schematic of the correspondence between the timeline after egg laying (AEL) and the larval developmental stage. The wasp infestation was carried out at the L2 stage. (b–c) RFP signals from HmlΔRFP/+larvae at L1, L2, Early L3 and Late L3 stages (b) and Early L3 after wasp infestation (c). The HmlΔRFP transgene induces the expression of RFP in hemocytes starting from L1 (Makhijani et al., 2011). The larvae display an accumulation of hemocytes in the sessile pockets from the L2 stage onward. Upon wasp infestation, the sessile hemocytes are released into circulation. Scale bar: 200 µm. (d) Number of sessile pockets per Late L3 larva (one lateral view per larva = hemi larva) in normal conditions and after wasp infestation. Each hemi-larva is represented by a dot, the bar represents the average and the error-bars s.e.m., n > 11, p-value measured using student test after variance analysis. (e) Representative examples of melanotic tumors at different stages. Immunolabelling of tumors from gcm> gtrace LacZ larvae, 48 hr and 72 hr after wasp infestation. Phalloidin (green), Srp (red) and LacZ (white). Left panels show the merged channels, mid panels show LacZ and Srp labelling and the right panels show LacZ labelling alone. Scale bar: 100 µm. (f) Immunolabelling of gcm> gtrace LacZ larval hemocytes 2 hr, 24 hr and 72 hr after wasp infestation. Phalloidin (green), Srp (red) and LacZ (white). The left panels show the merged channels, the mid panels show LacZ labelling alone and the right panels show Srp labelling alone. Lamellocytes can be recognized by the strong expression of Phalloidin and by their very large size. Scale bar: 50 µm.
Figure 10

Wasp infestation recruits first the embryonic hemocytes and then the LG hemocytes.
Timeline summarizing the sequence of events occurring in the immune system of the larva in normal conditions (top panel) and upon wasp infestation (lower panel). In normal conditions, only embryonic hemocytes (in red) are present in the hemolymph until the pupal stage. They start to colonize the sessile pockets by L2 and continue to do so during L3. The lymph gland (in blue) histolyzes at the beginning of pupal stage to release plasmatocytes into circulation. Upon wasp infestation (occurring at L2 stage), the sessile hemocytes are mobilized, embryonic plasmatocytes differentiate into lamellocytes (rhomboid shaped cells) and tumors start forming at Late L3 upon aggregation of the embryonic hemocytes. The lymph gland histolyzes precociously, to release plasmatocytes and lamellocytes that contribute to tumor formation in Wandering L3. Plasmatocytes and lamellocytes originating from the embryo are indicated in red, the ones from the lymph gland in blue. Lamellocytes originating from the embryo are indicated in red, the ones from the lymph gland are in blue.
Figure 11
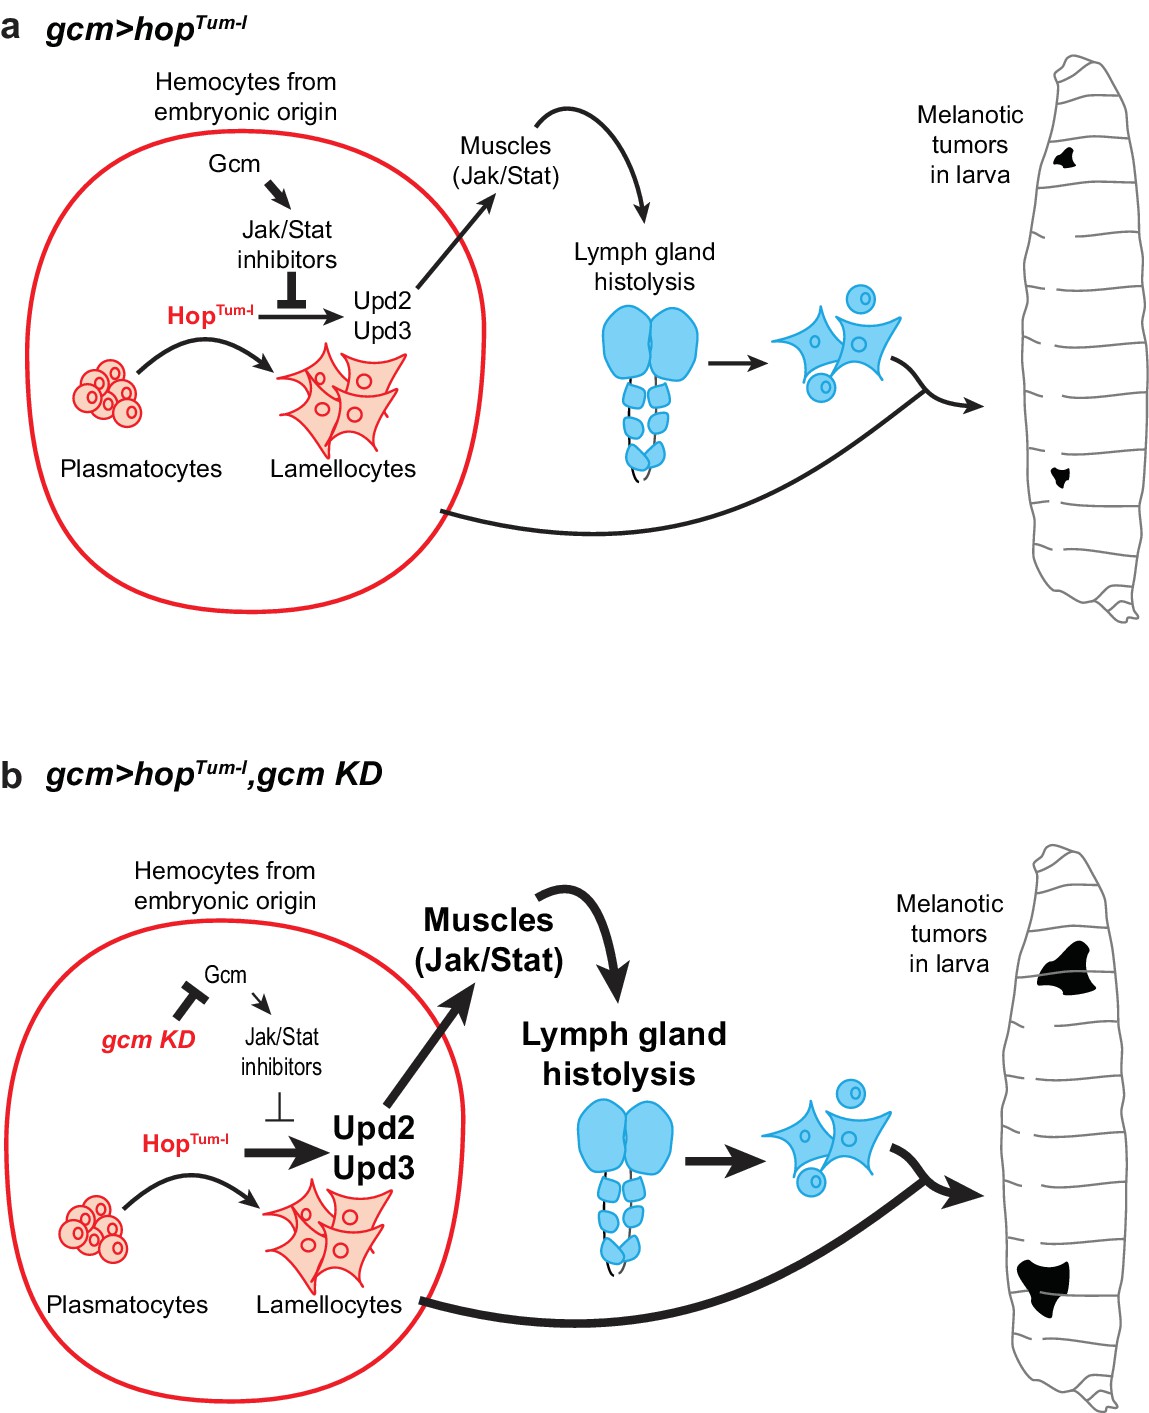
Schematic model on the molecular cascade leading to tumor formation upon Jak/Stat activation in the embryonic hemocytes.
(a) gcm> hopTum-l activates the Jak/Stat pathway exclusively in the hemocytes at embryonic stage. This leads to the production of the Upd2/Upd3 pro-inflammatory cytokines in those cells and to the activation of the Jak/Stat pathway in the larval muscles. This ultimately results in the formation of melanotic tumors and in lymph gland histolysis. When gcm> hopTum-l is combined with gcm KD (b), the levels of the inhibitors of the Jak/Stat pathway controlled by Gcm (i.e. Ptp61F, Socs36E and Socs44A) decrease in the embryonic hemocytes. This leads to a stronger activation of the Jak/Stat pathway in embryonic hemocytes, which enhances the production of Upd2/Upd3 and the activation of the Jak/Stat pathway in the muscles. As a consequence, gcm> hopTum-l, gcm KD animals display stronger phenotypes in terms of lymph gland histolysis and melanotic tumors.
Author response image 1
Author response image 2

Author response image 3
Author response image 4
Tables
Key resources table
| Designation | Source or reference | Identifiers | Additional information |
|---|---|---|---|
| Mouse anti-L4 | Pr. I. Ando | Mouse anti-L4 | (1/30) |
| Rabbit anti-PH3 | Upstate biotechnology #06–570 | Rabbit anti-PH3 | (1/1000) |
| Mouse anti-Hemese | Pr. I. Ando | Mouse anti-Hemese | (1/30) |
| Chicken anti-GFP | abcam #13970 | Chicken anti-GFP | (1/500) |
| Rabbit anti-Serpent | Trebuchet, unpublished | Rabbit anti-Serpent | (1/1000) |
| Rabbit anti-Stat92E | Dr. D. Montell | Rabbit anti-Stat92E | (1/100) |
| Rabbit anti-PPO1 | Dr. WJ. Lee | Rabbit anti-PPO1 | (1/100) |
| Rabbit anti-RFP | abcam #62341 | Rabbit anti-RFP | (1/500) |
| S2 cells | ATCC Ref: CRL-1963 | S2 ATCC | |
| Effectene Transfection Reagent | Qiagen | Effectene Transfection Reagent | |
| WT | Bloomington #5905 | w1118 | |
| hopTum-l | Bloomington #8492 | hopTum-l/FM7c | Point mutation that constitutively activates the Jak/Stat pathway |
| HmlΔRFP | Makhijani et al., 2011 | HmlΔRFP | |
| UAS-hopTum-l | Harrison et al., 1995 | UAS-hopTum-l/CyO, twilacZ | Reporter line for hop Tum-l over-expression |
| Gcm> GFP | Soustelle and Giangrande, 2007 | gcmGal4,UAS-mCD8 GFP/CyO,Tb | Driver specific to embryonic hemocytes and glia, gcm hypomorphic mutation |
| Gcm KD | Bloomington #31519 | UAS-gcmRNAi | dsRNA reporter line for gcm down-regulation |
| Gcm GOF | Bernardoni et al., 1997 | UAS-gcmF18A | Reporter line for gcm over-expression |
| Gcm26 | Vincent et al., 1996 | gcm26/CyOactinGFP | Null gcm mutation |
| Upd2Δ | Bloomington #55727 | upd2Δ | 4.7 kb deletion |
| Upd3Δ | Bloomington #55728 | upd3Δ | Imprecise excision |
| Upd2 KD | Bloomington #33988 | UAS-upd2RNAi | dsRNA reporter line for upd2 down-regulation |
| Upd3 KD | Bloomington #32859 | UAS-upd3RNAi | dsRNA reporter line for upd3 down-regulation |
| Upd2 GOF | Jiang et al., 2009 | UAS-upd2/CyO | Reporter line for upd2 over-expression |
| Upd3 GOF | Jiang et al., 2009 | UAS-upd3/CyO | Reporter line for upd3 over-expression |
| Ptp61F KD | Bloomington #32426 | UAS-Ptp61FRNAi | dsRNA reporter line for Ptp61F down-regulation |
| Socs36E KD | Bloomington #35036 | UAS-Socs36ERNAi | dsRNA reporter line for Socs36E down-regulation |
| Socs44A KD | Bloomington #42830 | UAS-Socs44ARNAi | dsRNA reporter line for Socs44A down-regulation |
| Ptp61Fa GOF | Müller et al., 2005 | UAS-Ptp61Fa/CyO | Reporter line to over-express the cytoplasmic splicing isoform |
| Ptp61Fc GOF | Müller et al., 2005 | UAS-Ptp61Fc/TM3 | Reporter line to over-express the nuclear splicing isoform |
| Gcm(hemo)> | Cattenoz et al., 2016 | gcmGal4,UAS-mCD8GFP, repoGal80/CyO | gcm driver not expressed in glia, hypomorphic mutation |
| sn> | Zanet et al., 2012 | snGal4 | Singed driver, specific to embryonic hemocytes |
| srp(hemo)> | Brückner et al., 2004 | srp(hemo)Gal4 | Serpent driver specific to embryonic hemocytes |
| dot> | Bloomington #67608 | DotGal4 | Dorothy driver specifically expressed in embryonic and larval lymph gland |
| lz> GFP | Bloomington #6314 | lzGal4,UAS-mCD8GFP | Lozenge driver expressed in crystal cells |
| 10xStat92E-GFP | Bloomington #26198 | 10xStat92E-GFP | Reporter line for STAT activity, 10 Stat92E binding sites driving GFP expression |
| Gtrace | Bloomington #28282 | UAS-FLP;;Ubi-p63E (FRT.STOP)Stinger | This line allows the analysis of lineage-traced expression of Gal4 drivers |
| Ubi> | Bloomington #32551 | UbiGal4 | Expresses GAL4 in all cells |
| RFP | Bloomington #30556 | UAS-RFP | Inserted on the second chromosome |
| Gtrace-LacZ | Bloomington #6355 | P{Act5C> polyA> lacZ.nls1}3 | |
| Fiji | Schindelin et al., 2012 | Fiji | |
| pPac-gcm | Miller et al., 1998 | pPac-gcm | |
| repoGFP | Laneve et al., 2013 | 4.3 kb repo-GFP | |
| pUAS-hopTum-l | Harrison et al., 1995 | pUAS-hopTum-l | |
| pUAS-gcmRNAi | Vienna Drosophila Resource Center (VDRC) #dna1452 | pUAS-gcmRNAi |
Additional files
-
Supplementary file 1
details the materials and methods used in the manuscript
- https://doi.org/10.7554/eLife.34890.021
-
Transparent reporting form
- https://doi.org/10.7554/eLife.34890.022
Download links
A two-part list of links to download the article, or parts of the article, in various formats.
Downloads (link to download the article as PDF)
Open citations (links to open the citations from this article in various online reference manager services)
Cite this article (links to download the citations from this article in formats compatible with various reference manager tools)
Embryonic hematopoiesis modulates the inflammatory response and larval hematopoiesis in Drosophila
eLife 7:e34890.
https://doi.org/10.7554/eLife.34890


