The dual role of chloride in synaptic vesicle glutamate transport
- UCSF School of Medicine, United States
Figures
Figure 1 with 3 supplements
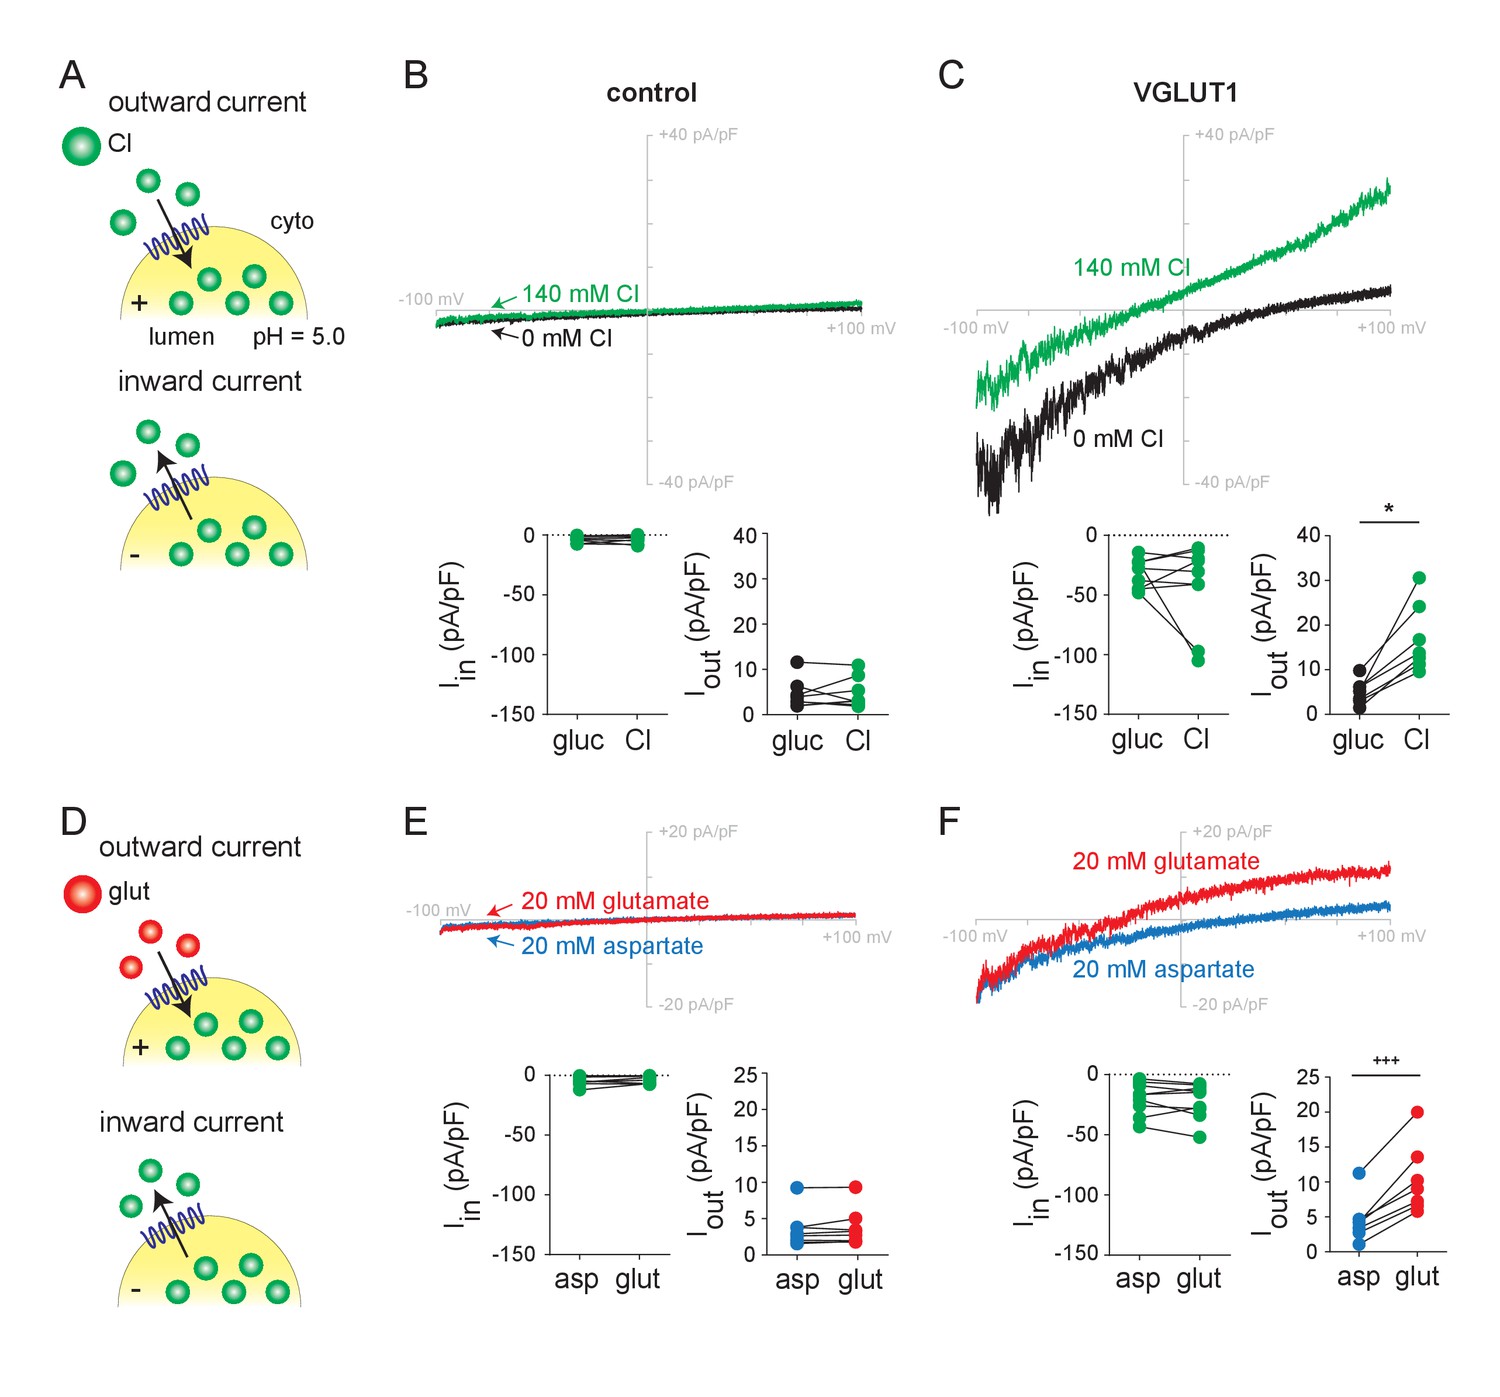
Chloride and glutamate currents in endosomes expressing VGLUT1.
(A,D) Whole endosome patch clamp recording configuration, with 140 mM Cl- at pH 5.0 and NPPB in the pipette, showing outward currents at positive lumenal potentials and inward currents at negative potentials. Representative recordings from control (Rab5 Q79L) and VGLUT1+ (Rab5 Q79L) endosomes with voltage ramps from −100 mV to +100 mV are shown from the same endosome in (B) as in (E) and in (C) as in (F), in the presence of external gluconate (0 Cl-), Cl- (140 mM), aspartate or glutamate (both 20 mM). Insets show the maximum inward and outward currents for each endosome (B, Iin, p=0.698, Iout, p=0.748 both by paired t-test; C, Iin, p=0.910, Iout, p=0.0156 both by Wilcoxon; E, Iin, p=0.202, Iout, p=0.232 both by paired t-test; F, Iin, p=0.360 by paired t-test, Iout, p=0.001 by paired t-test, n = 7–9 for all). *p<0.05 by Wilcoxon matched pairs test; +++p<0.001 by paired t-test.
Figure 1—figure supplement 1

Chloride currents in endosomes without lumenal NPPB.
(A) Whole endosome recording conditions with 140 mM Cl- at pH 5.0 but no NPPB in the pipette (lumen). Representative recordings from cells expressing only rab Q79L (B), VGLUT1 (D), VGLUT2 (E) and VGLUT3 (F), using voltage ramps as described in Figure 1. (C) Maximum inward and outward currents, with 140 mM external gluconate (0 Cl-) used to define the baseline outward current, and no baseline subtraction for the maximum inward current (n = 3–8). Bar graph indicates mean ± SEM. C, control; 1–3, VGLUT1-3 and statistical comparisons are made to C. ‡p<0.01, ‡‡p<0.001 by Mann-Whitney test.
Figure 1—figure supplement 2
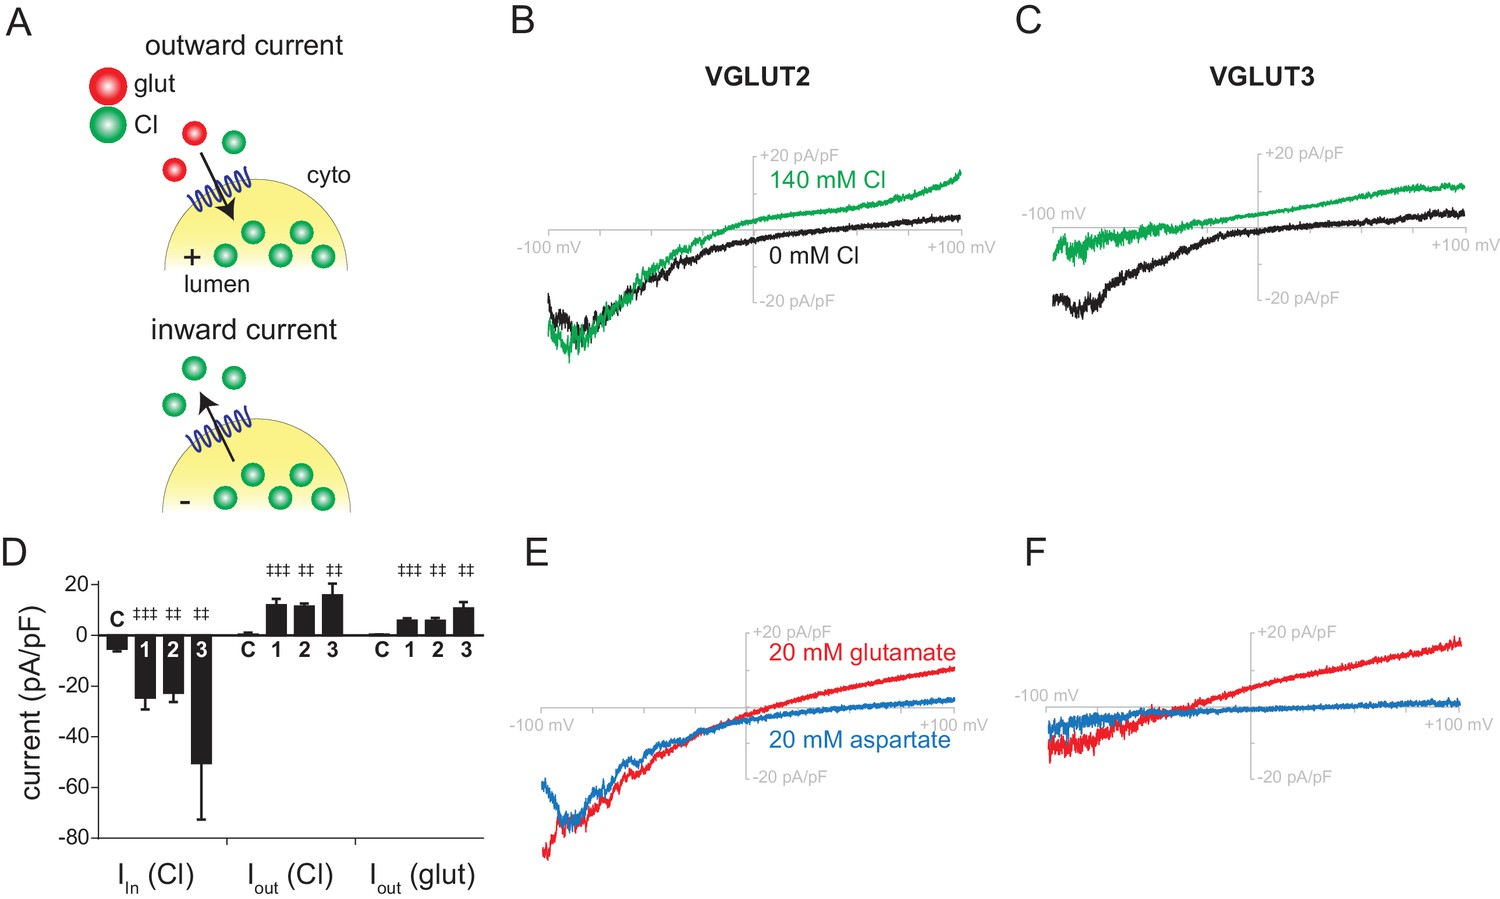
Chloride and glutamate currents (with lumenal NPPB) in VGLUT2+ and VGLUT3+ endosomes.
(A) Whole endosome recording conditions with 140 mM Cl- at pH 5.0 and 200 µM NPPB in the pipette (lumen). Representative recordings from endosomes expressing VGLUT2 (B,E) and VGLUT3 (C,F). The top (A,B) and bottom (C,D) recordings were made from the same endosome, demonstrating inward and outward Cl- currents (top) and outward glutamate currents (bottom). The compiled data from multiple endosomes are shown in D, the currents defined as in Figure 1—figure supplement 1 and statistical comparisons made to control (C). (n = 5–9). Bar graph indicates mean ± SEM. ‡‡p<0.001, ‡‡‡p<0.0001 by Mann-Whitney test.
Figure 1—figure supplement 3
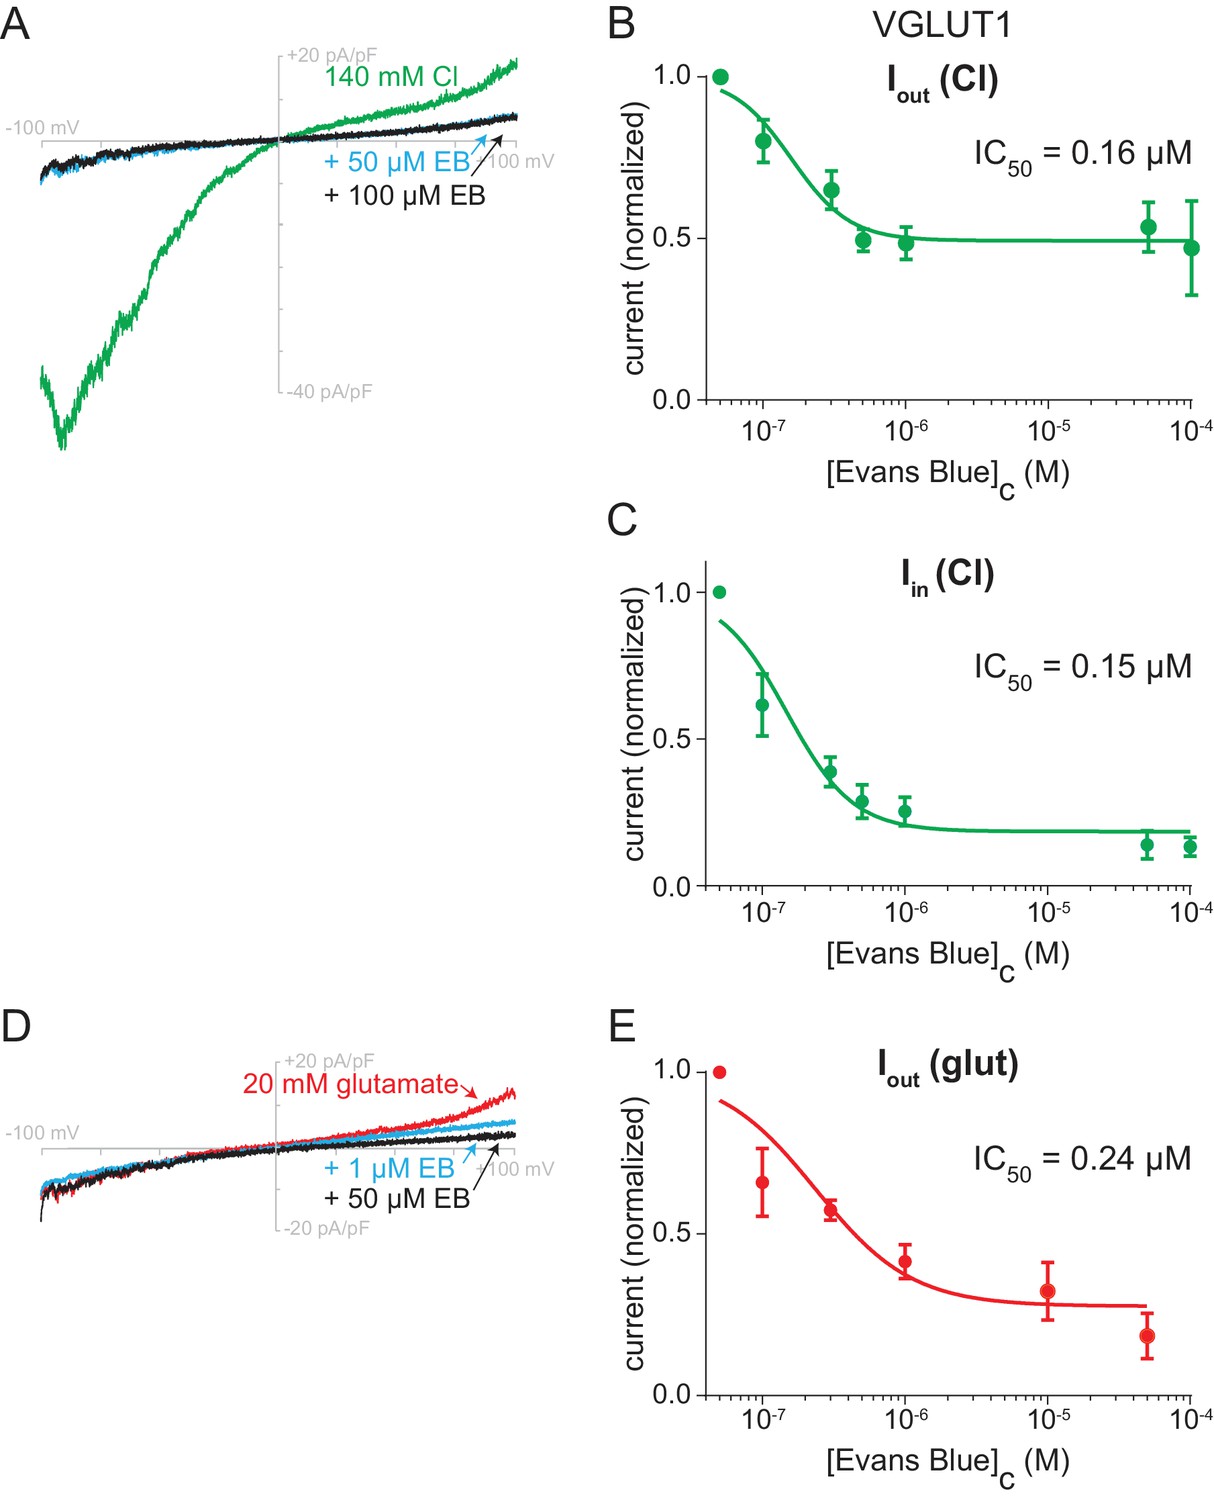
Sensitivity of VGLUT1 Cl- and glutamate currents to Evans Blue.
Representative endosome recordings with 140 mM Cl- at pH 5.0 in the patch pipette, either Cl- (A) or glutamate (D) in the bath solution, with increasing concentrations of Evans Blue in the bath (n = 4). Dose response of the outward Cl- (B), inward Cl- (C) and outward glutamate currents (E) to Evans Blue (n = 3–4).
Figure 2 with 2 supplements
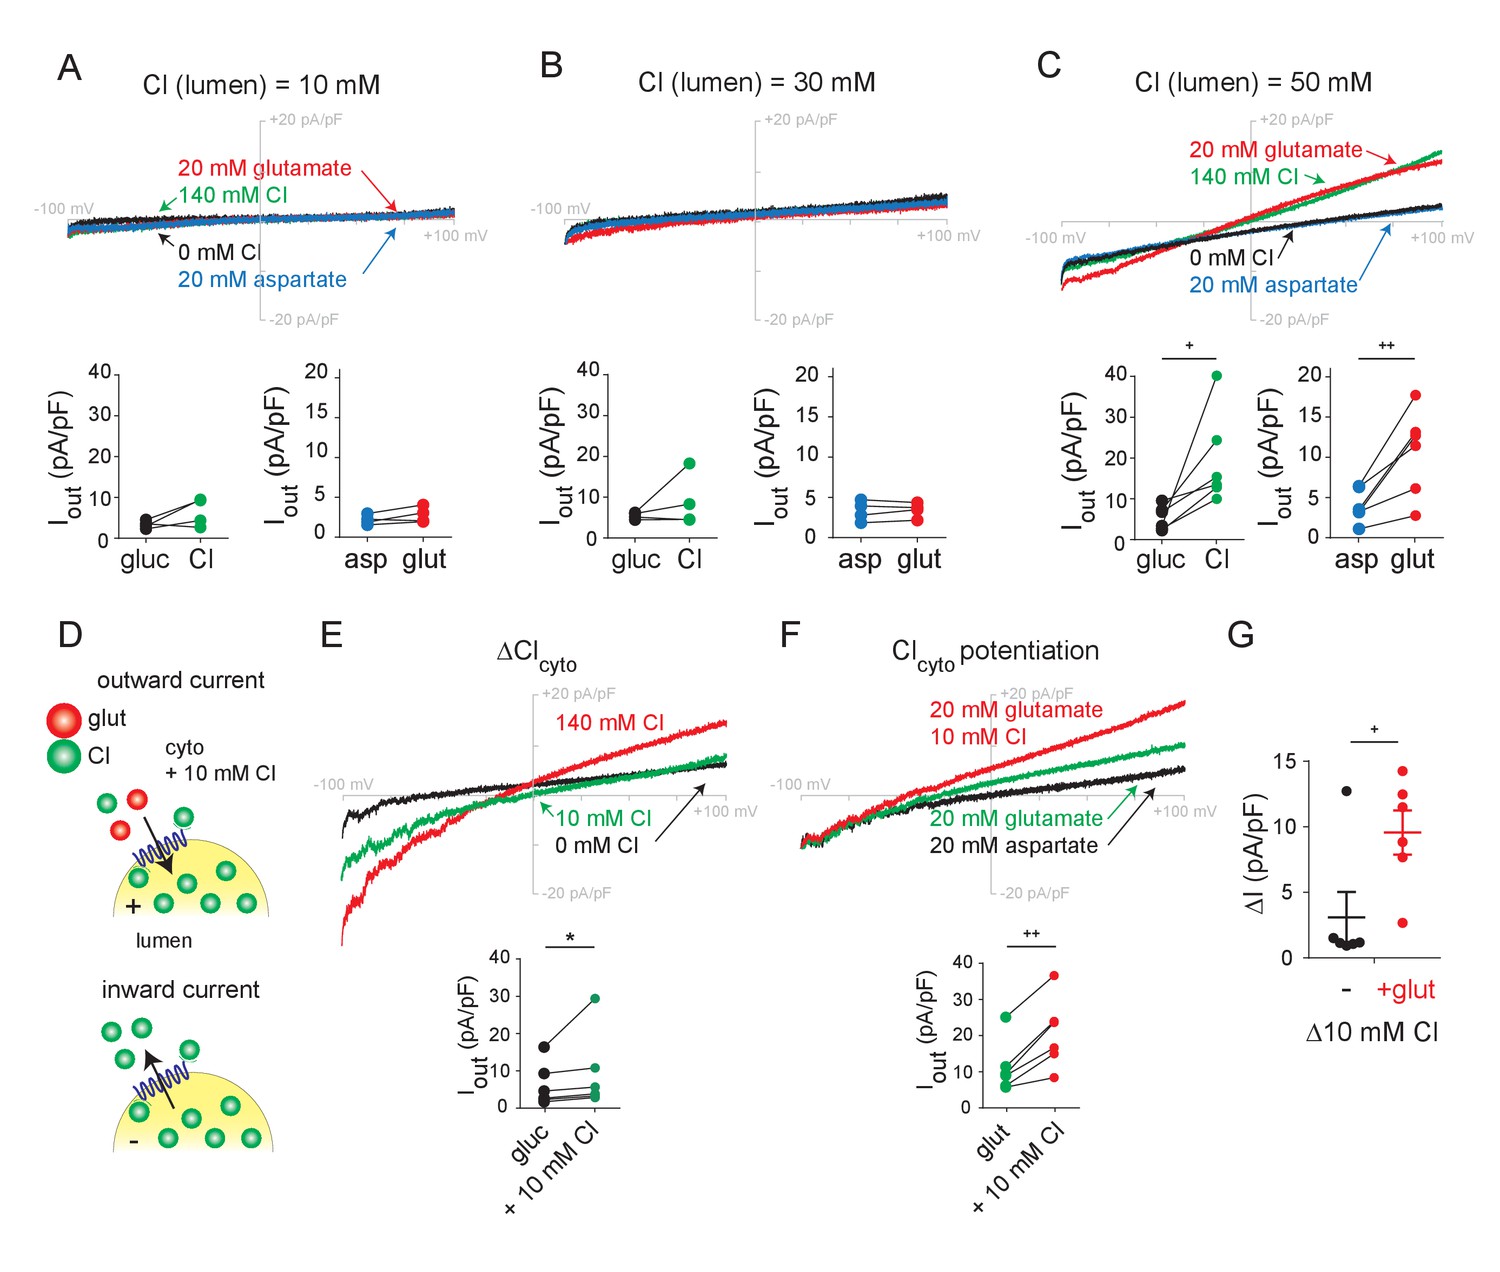
Role of lumenal and cytoplasmic Cl- in endosomes expressing VGLUT1.
(A–C) Representative whole endosome recordings under the same conditions as in Figure 1 but in the presence of 10 mM (A), 30 mM (B) and 50 mM lumenal Cl- (C) (n = 4 each). (D) To assess potentiation, 10 mM Cl- was added to the external solution without (E) or with (F) 20 mM glutamate (n = 5 each). Insets show maximum outward currents for each endosome in the different external conditions (A, ICl, p=0.147, Iglut, p=0.150 both by paired t-test, B, ICl, p=0.327, Iglut, p=0.666 both by paired t-test, C, ICl, p=0.035, Iglut, p=0.010 both by paired t-test, E, ICl, p=0.01 by Wilcoxon, F, Iglut, p=0.002 by paired t-test). (G) Increase in outward current produced by 10 mM external Cl- without or with 20 mM glutamate (p=0.034 by paired t-test). *p<0.05 by Wilcoxon; +p<0.05 and ++p<0.01 by paired t-test.
Figure 2—figure supplement 1
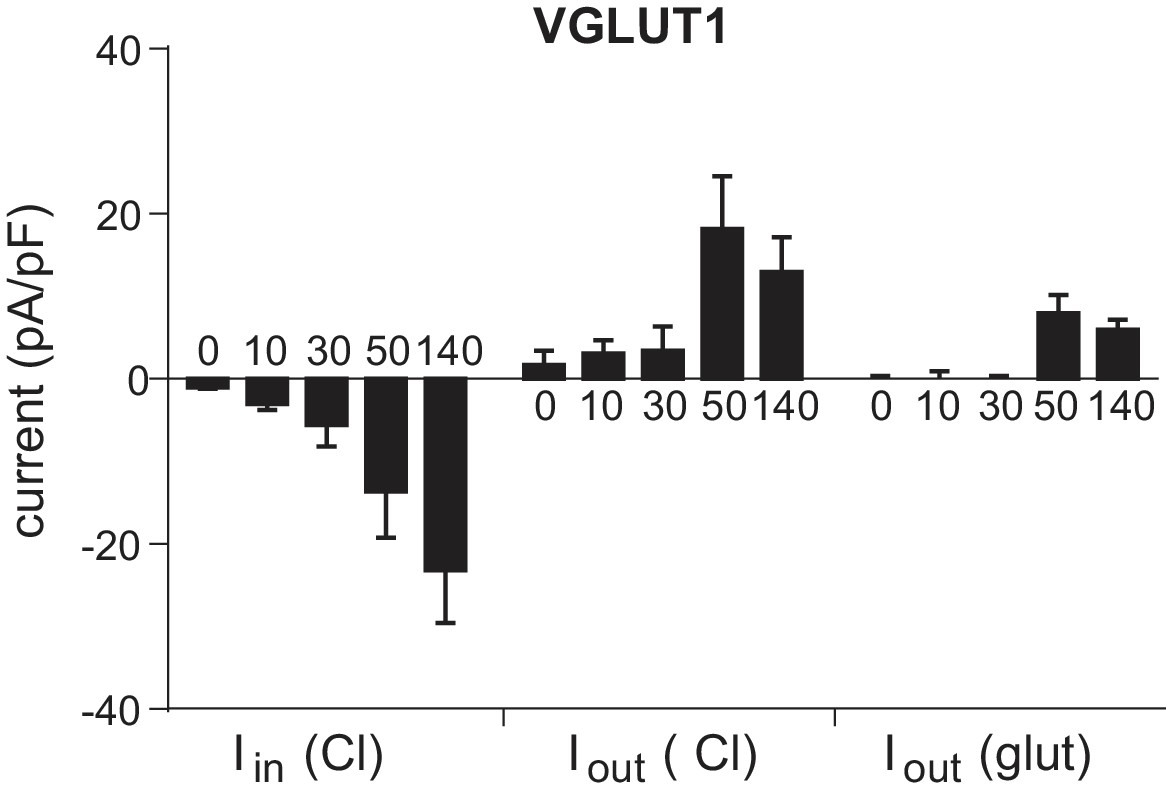
Dependence of VGLUT1 currents on lumenal Cl-.
The compiled inward and outward (Cl- and glutamate) VGLUT1 currents from Figure 2 are replotted as a function of lumenal Cl- concentration. Bar graph indicates mean ± SEM. n = 4.
Figure 2—figure supplement 2
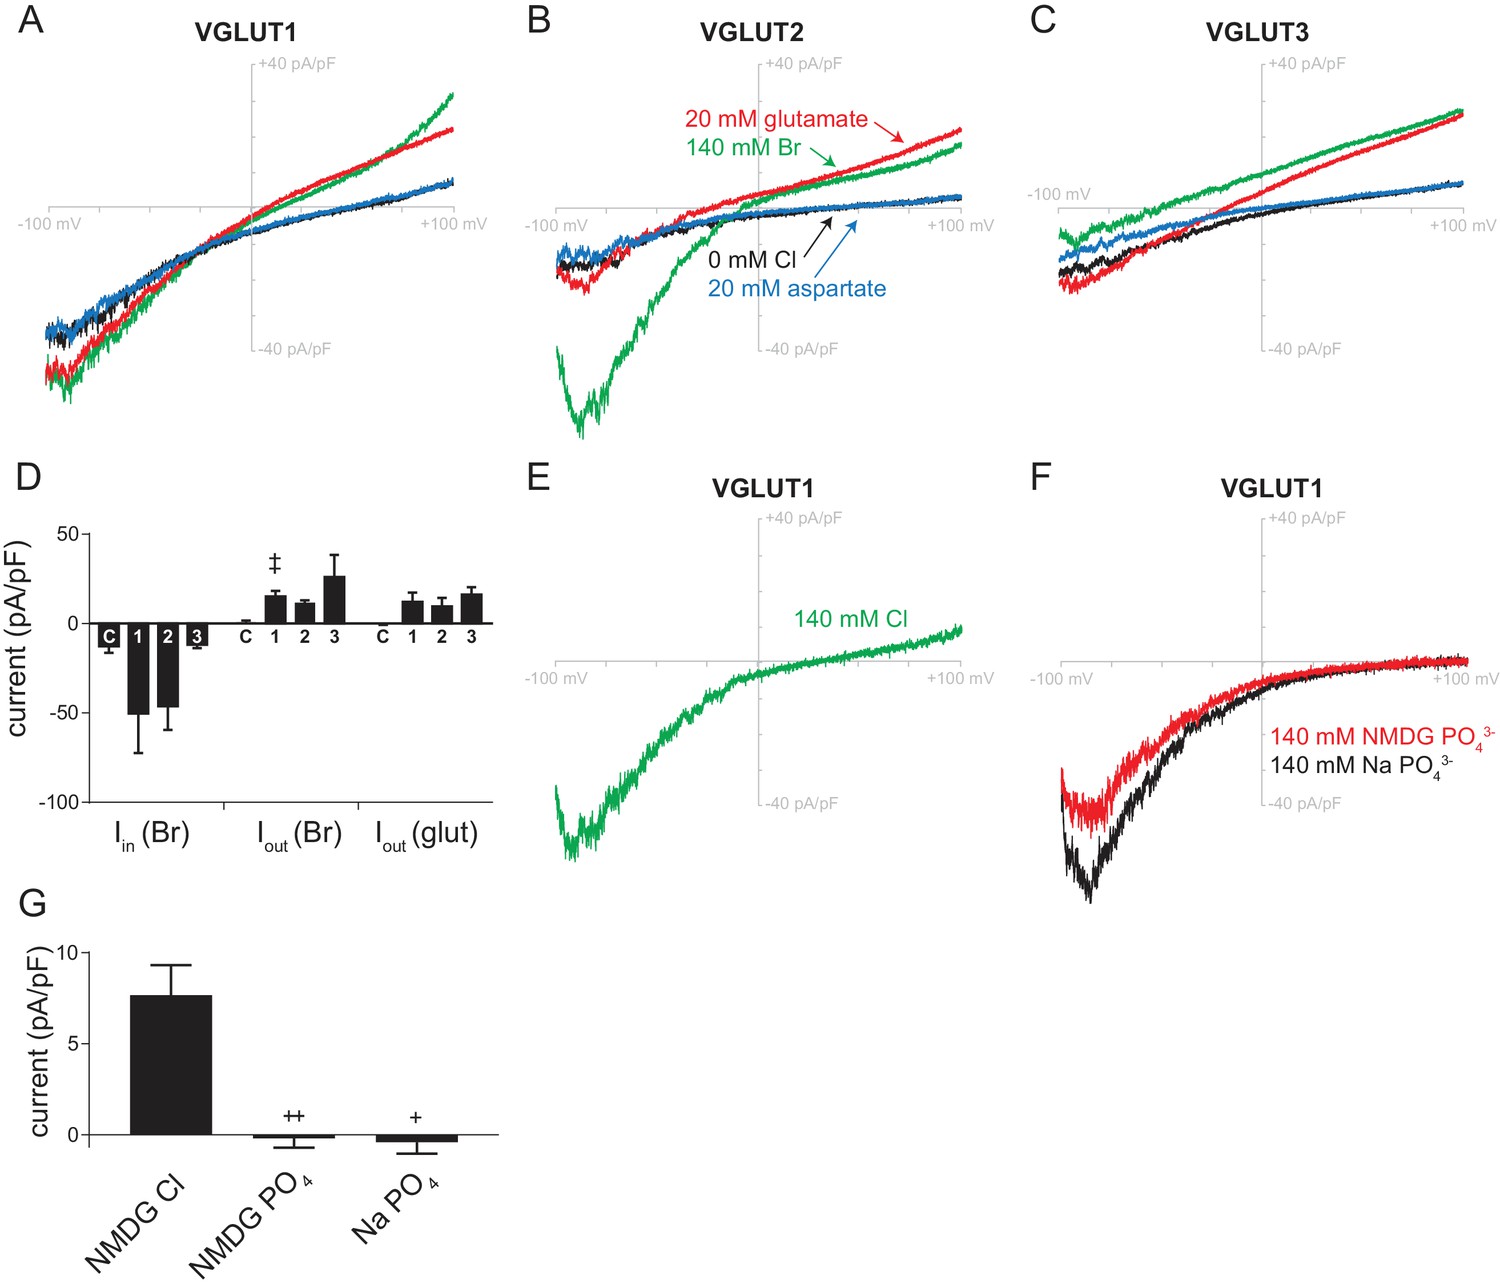
Effects of Br- and PO43- on VGLUT1+ endosomes.
Representative recordings (A–C) and compiled data (D) for VGLUT1+ (A), VGLUT2+ (B) and VGLUT3+ (C) endosomes with 140 mM Br- at pH 5 in the pipette and 140 mM NMDG gluconate (0 Cl-), Br- (140 mM), glutamate or aspartate (both 20 mM) in the bath solution. The outward current for gluconate was used as the baseline for Br-, PO43- and Cl- currents, and the outward current for aspartate was used as the baseline for glutamate currents (D). ‡p<0.05 by Mann-Whitney test. Representative recordings (E,F) and compiled data (G) for VGLUT1-3+ endosomes in the presence of 140 mM external NMDG Cl (E), NMDG PO4 or Na PO4 (F), with 140 mM NMDG Cl at pH 5.0 in the lumen (n = 5). Bar graphs indicate mean ± SEM and statistical comparisons made to control (D) and to NMDG Cl (G). +p<0.05, ++p<0.01 by paired t-test.
Figure 3 with 3 supplements
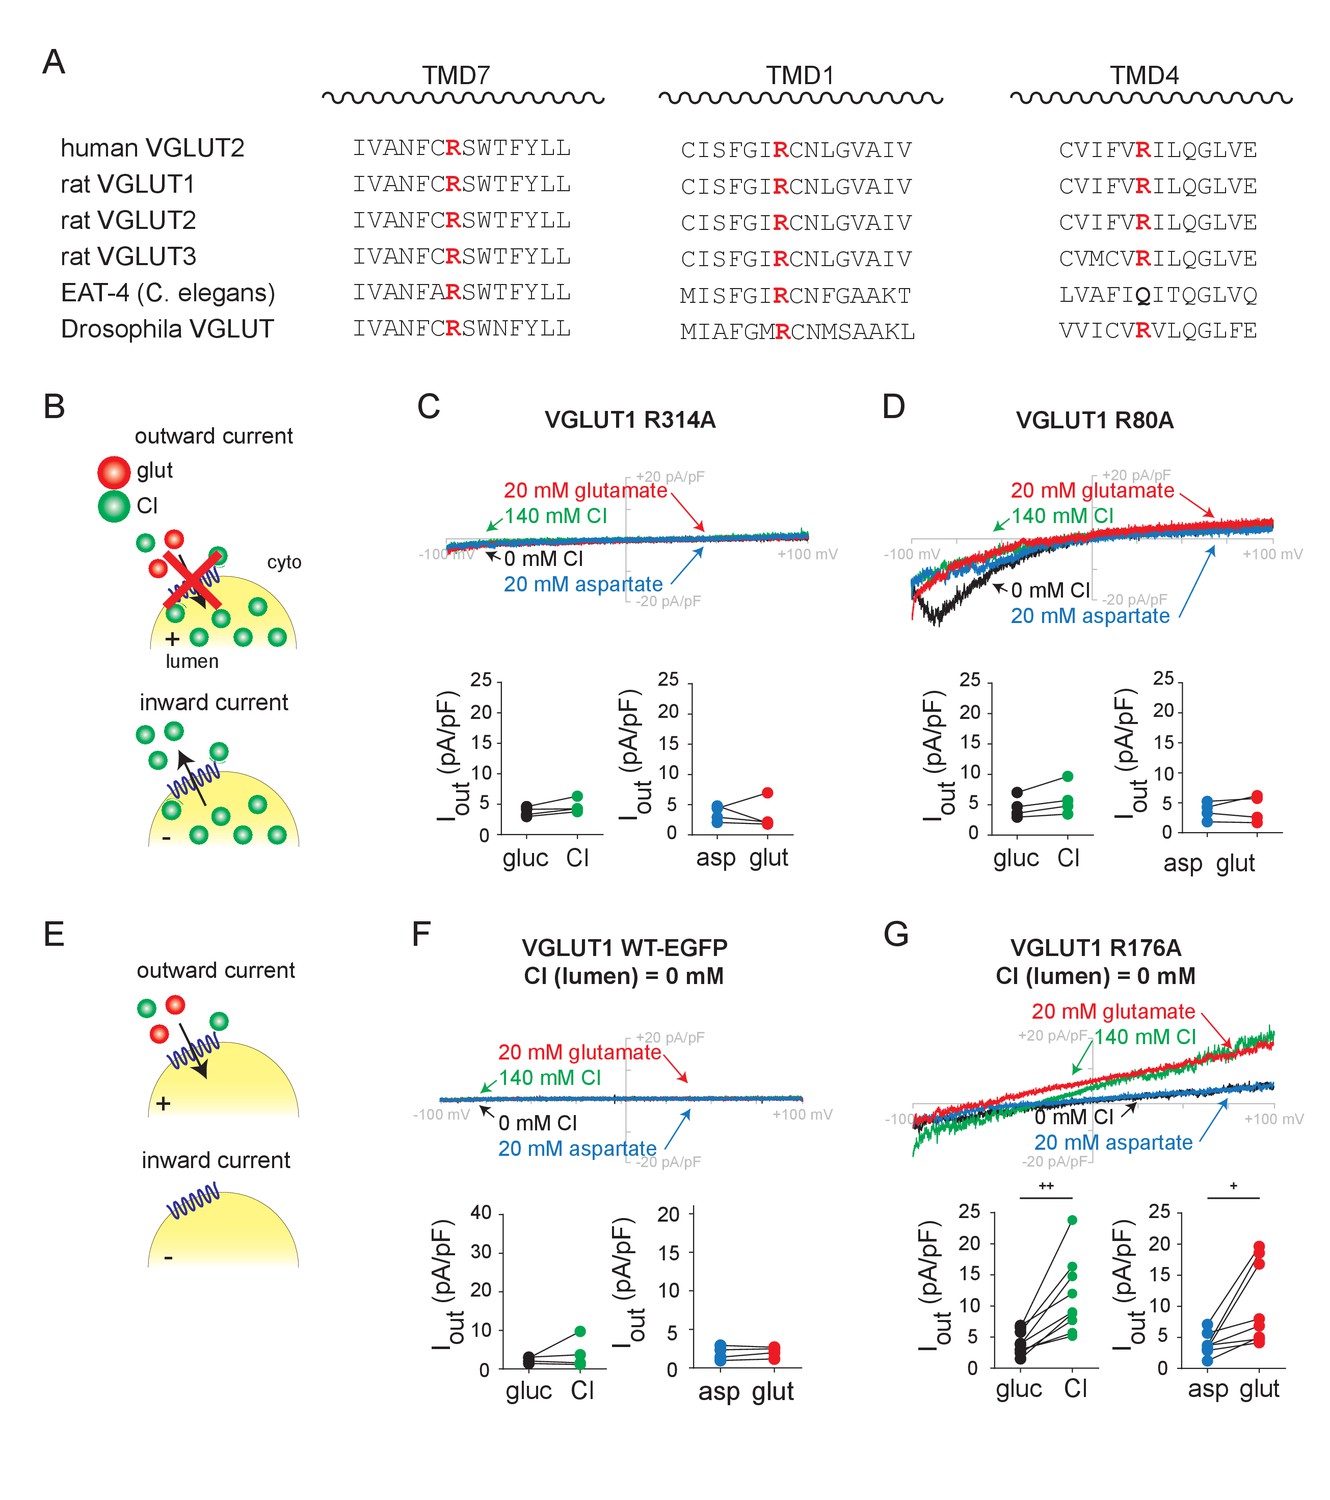
Transmembrane arginine residues control allosteric activation and permeation by Cl-.
(A) Sequence alignment of transmembrane domains TM 7, 1 and 4 from the related VGLUT isoforms and species with highly conserved arginine highlighted (red). (B) Representative whole endosome recordings (with 140 mM NMDG Cl at pH 5.0 in the pipette) of VGLUT1 R314A (C) and R80A (D) (n = 4 each). (E) Representative recordings with 0 mM Cl- in the pipette of endosomes expressing VGLUT1 WT (F) and R176A (G) (n = 5–9). Insets show maximum outward currents in the different external solutions (C, ICl, p=0.547, Iglut, p=0.080 both by paired t-test, D, ICl, p=0.062, Iglut, p=0.782 both by paired t-test, F, ICl, p=0.625 by Wilcoxon, Iglut, p=0.397 by paired t-test, G, ICl, p=0.002, Iglut, p=0.017 both by paired t-test). +p<0.05 and ++p<0.01 by paired t-test. Insets (C,D,F,G) indicate maximal outward currents for each endosome.
Figure 3—figure supplement 1
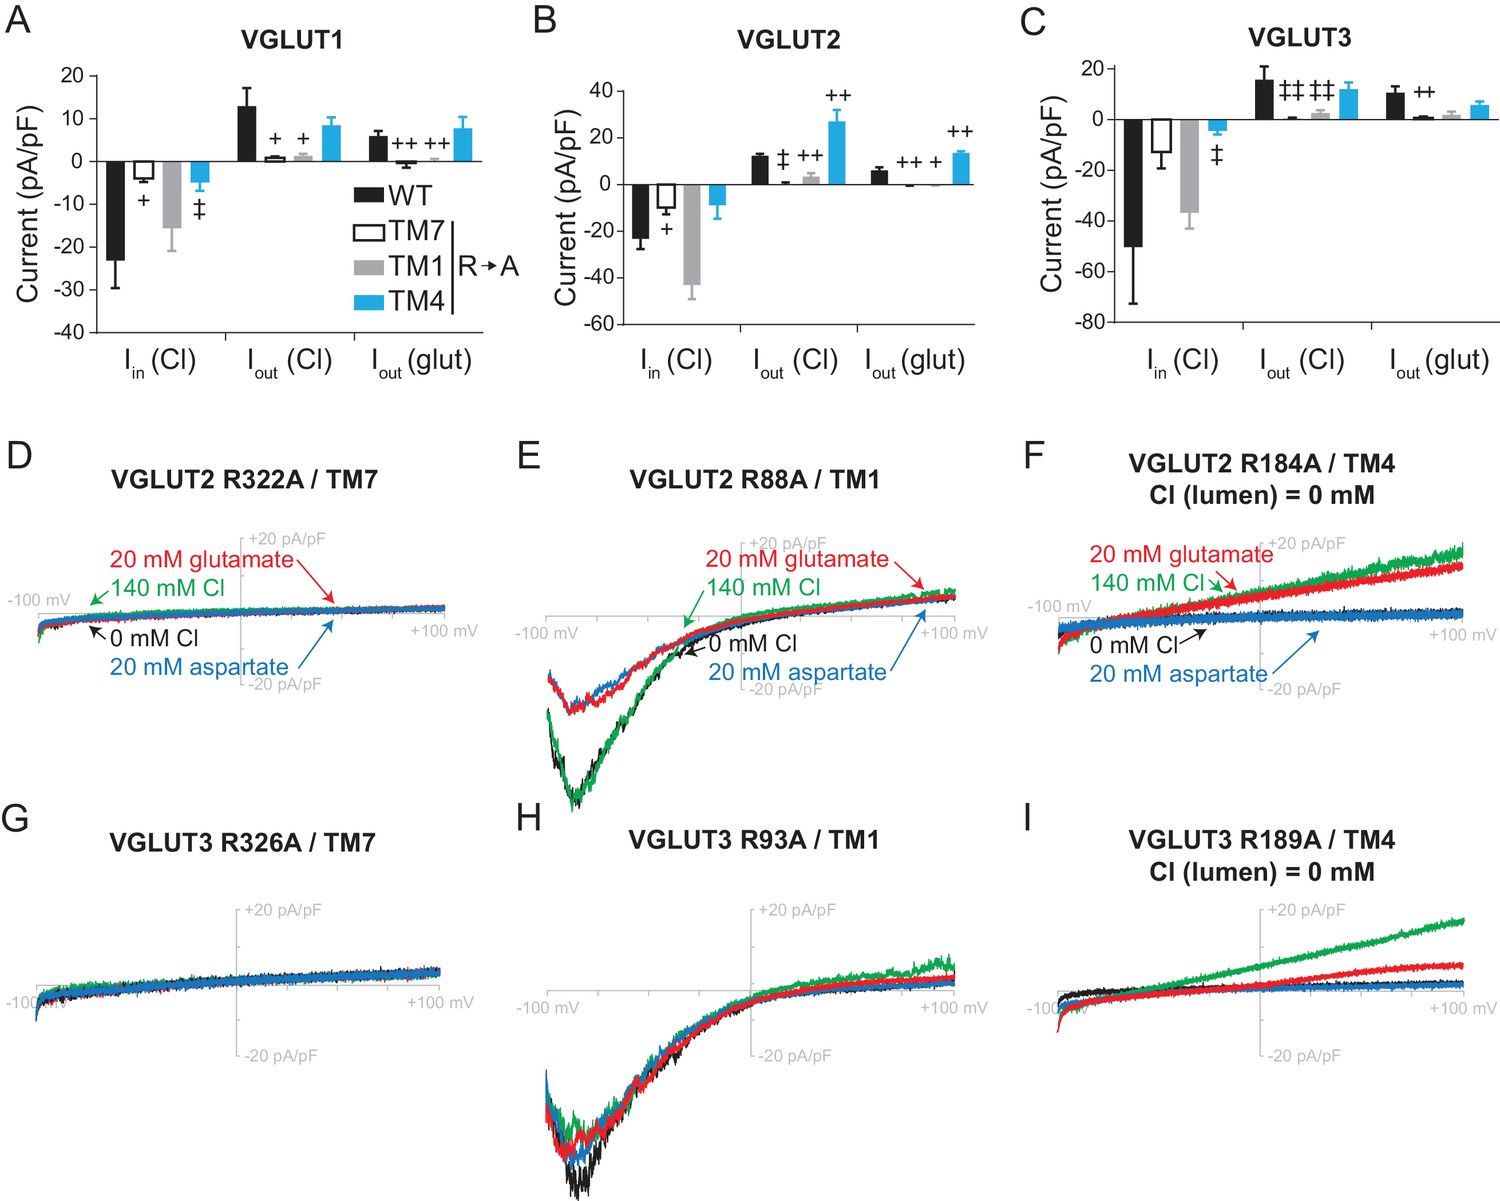
Chloride and glutamate currents in endosomes expressing mutant VGLUTs.
Compiled data (A–C) and sample traces (D–I) for alanine substitutions at conserved arginine residues in TM7, 1 and 4 of VGLUT1 (A), VGLUT2 (B,D–F) and VGLUT3 (C,G–I). All endosomes were recorded with 140 mM NMDG Cl at pH 5.0 in the pipette (n = 3–5) except for those expressing the arginine mutant in TM4, which were recorded with 140 mM NMDG gluconate (0 mM Cl-) in the pipette (n = 4–7). The baselines for outward Cl- and glutamate currents were defined as in Figure 1—figure supplement 1 and Figure 2—figure supplement 2. Bar graphs indicate mean ± SEM. +p<0.05, ++p<0.01 by unpaired t-test and ‡p<0.05, ‡‡p<0.01 by Mann-Whitney test.
Figure 3—figure supplement 2
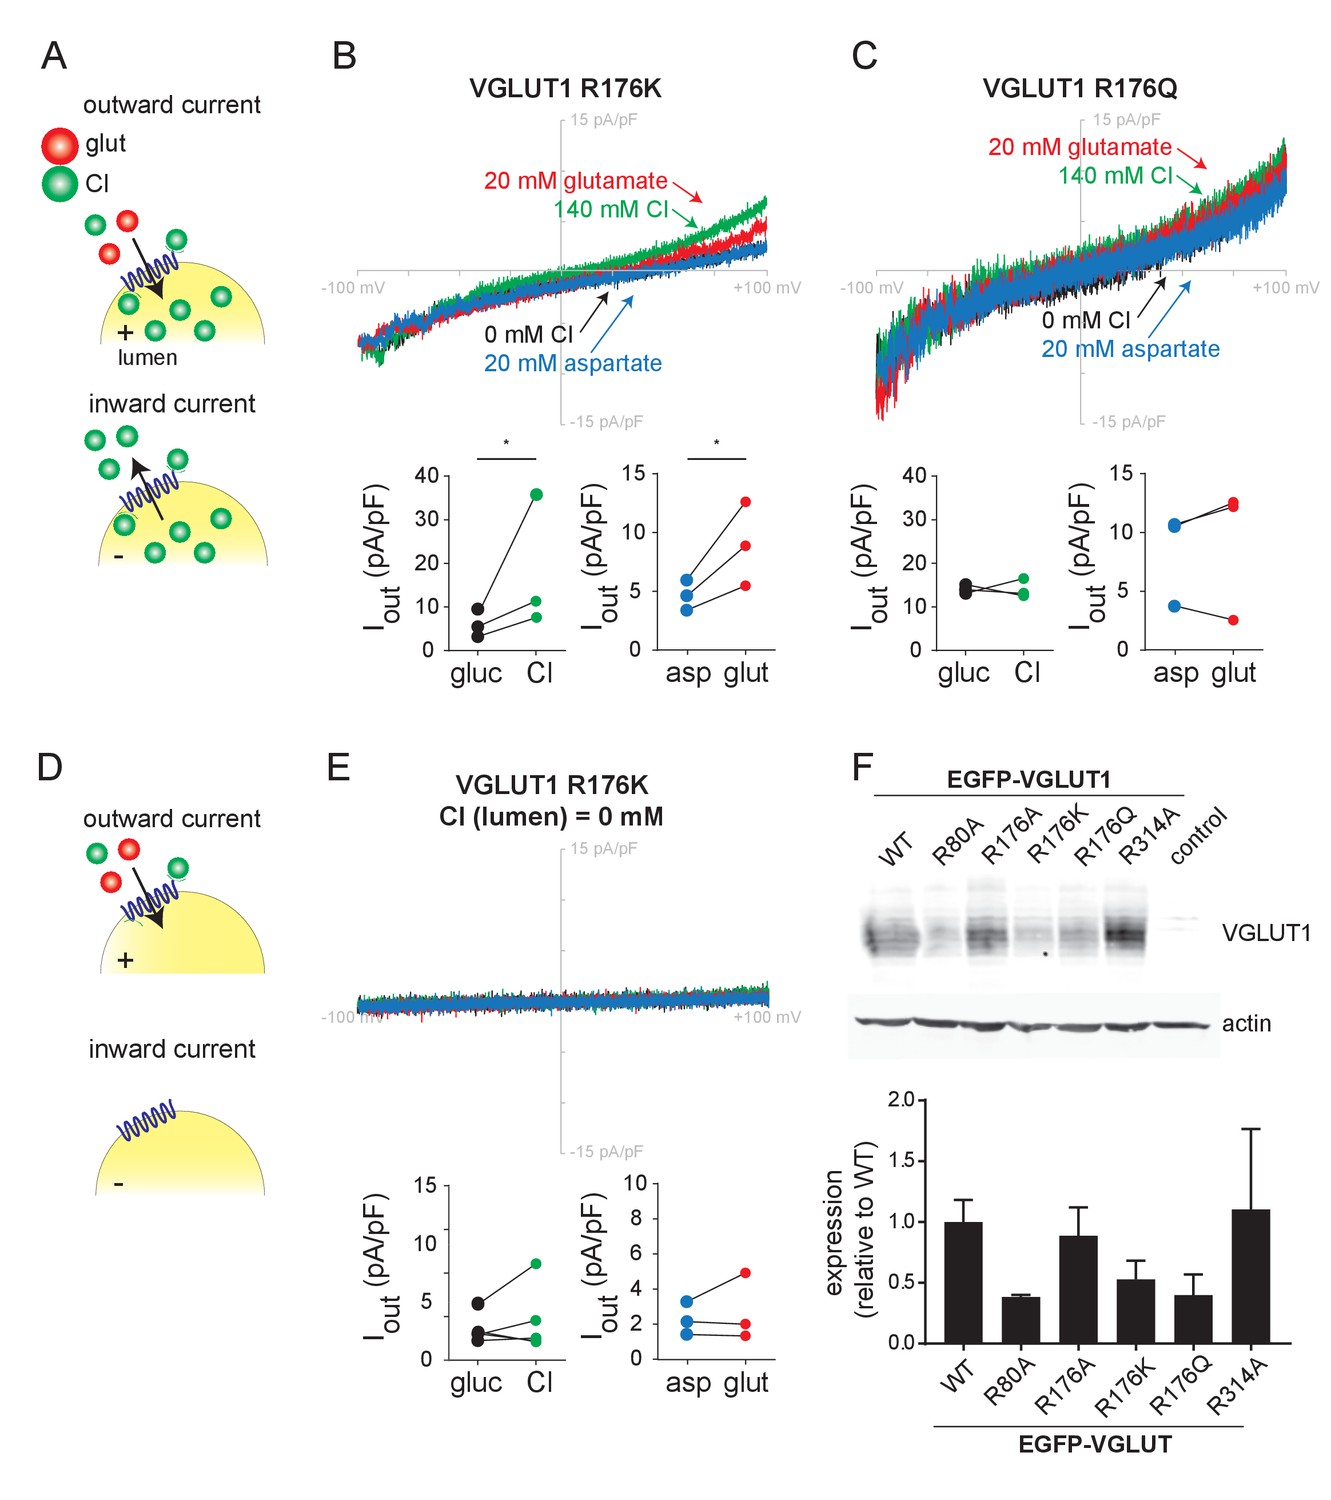
Chloride and glutamate currents in endosomes expressing TM4 arginine mutants.
Representative recordings with 140 mM Cl- in the pipette from endosomes expressing VGLUT1 R176K (B) and R176Q (n = 3) (C). Representative recordings with 0 mM Cl- in the pipette of endosomes expressing VGLUT1 R176K (E) (n = 3). Insets show maximum outward currents in the different external solutions (B, ICl, p=0.048, Iglut, p=0.016 both by paired t-test, C, ICl, p=0.963, Iglut, p=0.894 both by paired t-test, E, ICl, p=0.734, Iglut, p=0.629 both by paired t-test. *p<0.05. (F) Western blot of lysates from HEK293T cells expressing VGLUT1-EGFP (WT, R80A, R176A, R176K, R176Q and R314A) and untransfected cells as negative control. The expression of wild type and mutant VGLUT1-EGFP was analyzed by quantitative fluorescent immunoblotting, with VGLUT1 band intensity normalized to actin. Bar graph indicates mean ± SEM. n = 3.
Figure 3—figure supplement 3
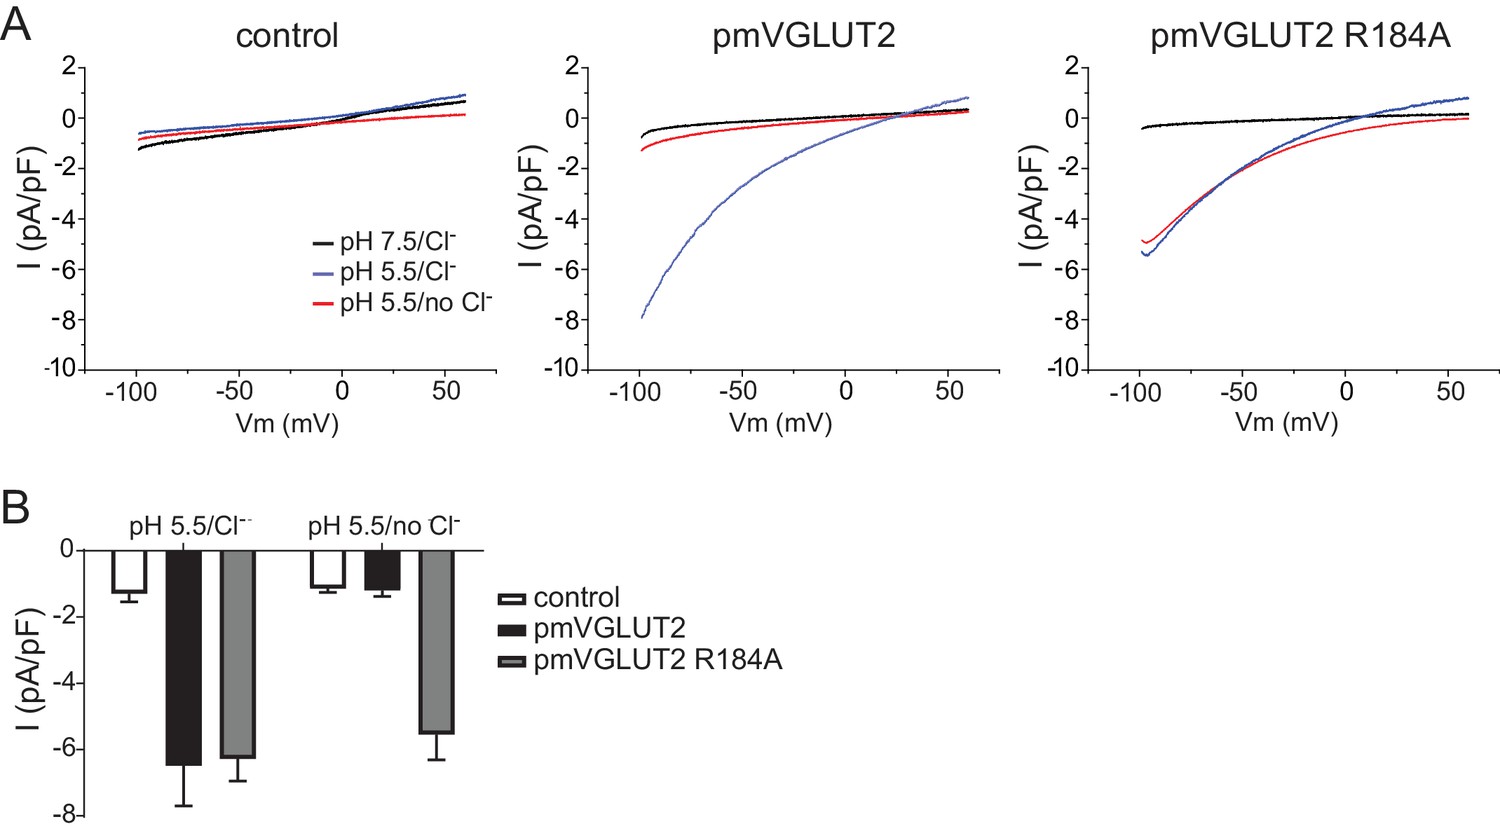
R184A eliminates the requirement for external Cl- to activate the inward Cl- conductance of VGLUT2 misexpressed at the plasma membrane.
Whole cell recording of VGLUT2 misexpressed at the plasma membrane (pmVGLUT2) of HEK293T cells. (A) Representative ramp currents from HEK293T cells expressing wild type pmVGLUT2 (left), R184A pmVGLUT2 (middle) or empty vector as negative control (right) in external choline chloride, pH 7.5 (black), choline chloride, pH 5.5 (blue) and choline gluconate, pH 5.5 (red). (B) Maximal inward currents normalized to cell capacitance from voltage ramps of wild type pmVGLUT2 (black), R184A pmVGLUT2 (grey) and vector-only transfected HEK cells (white) in external choline gluconate, pH 5.5 and choline gluconate, pH 5.5. n = 6–9 cells.
Figure 4
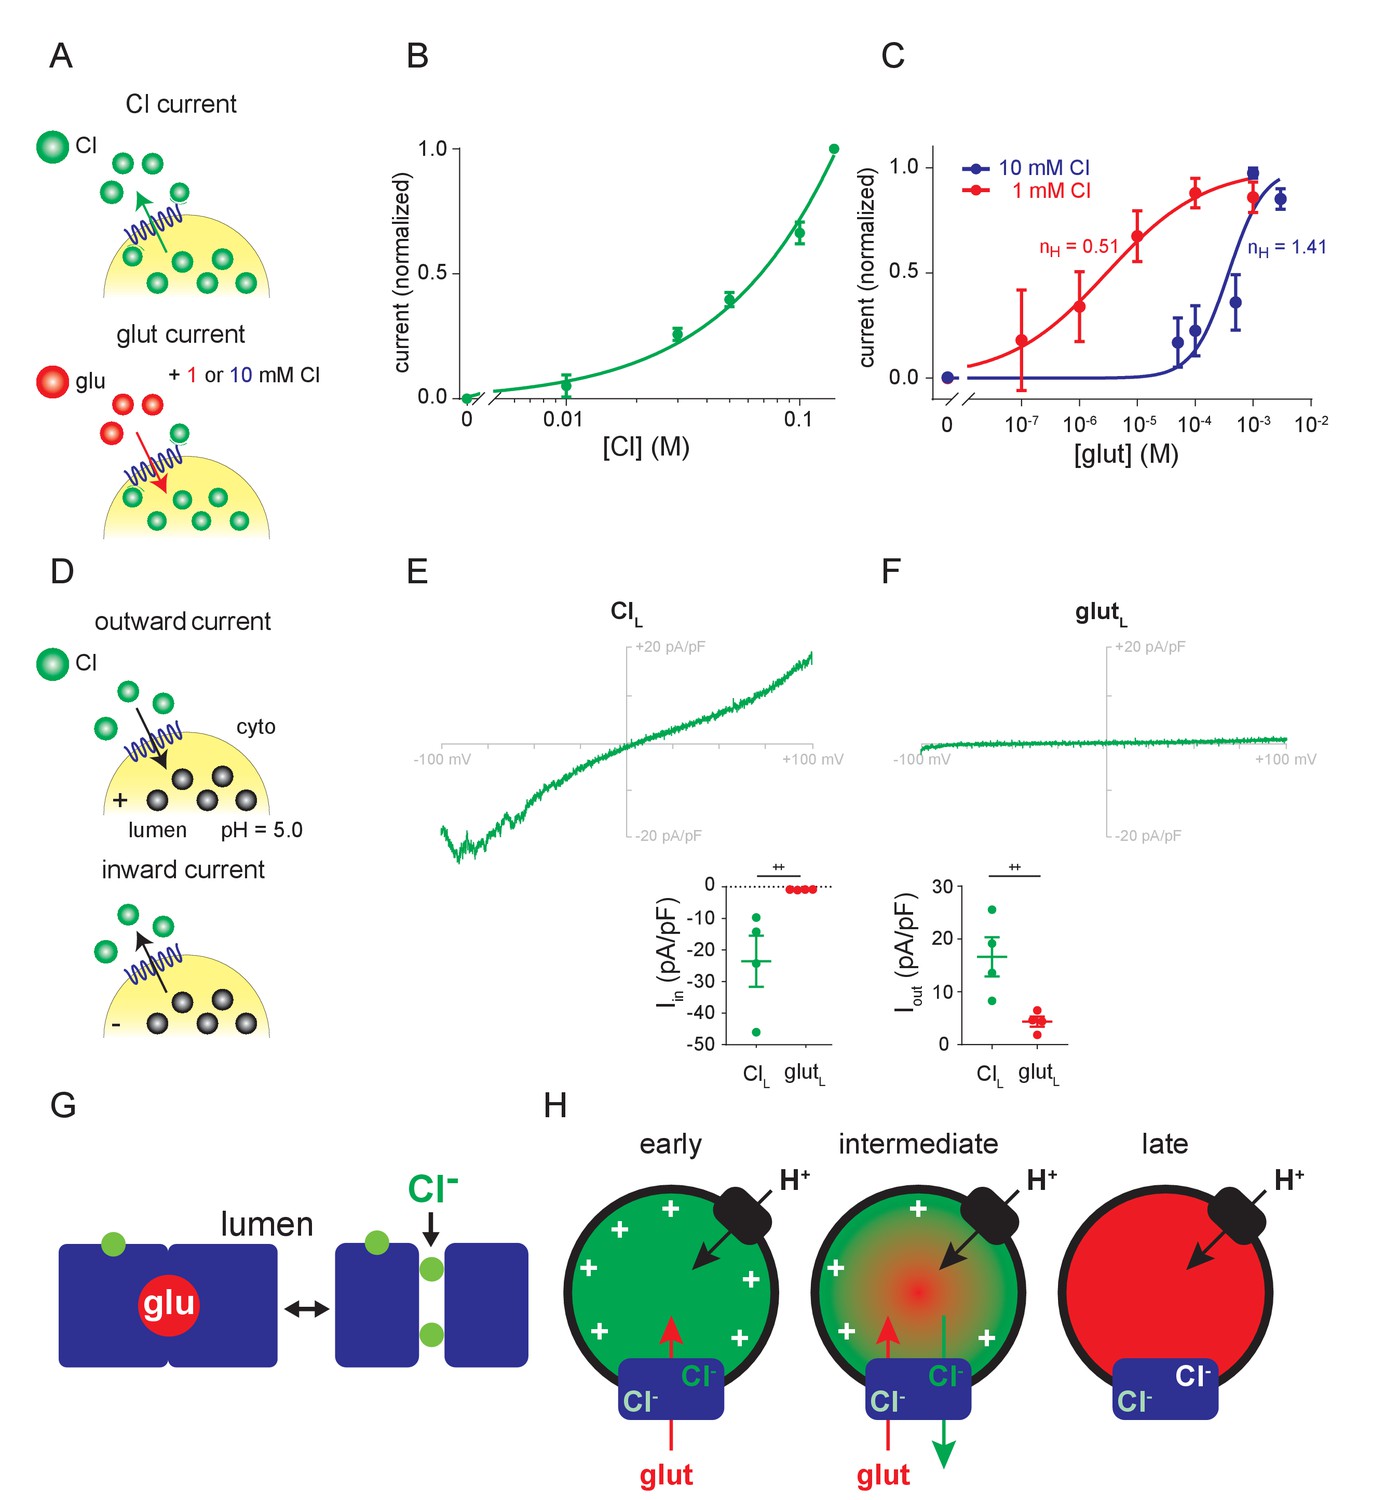
Relationship between Cl- and glutamate conductances.
(A–C) Dose-response of outward currents to external Cl- (B) or glutamate in the presence of either 1 mM or 10 mM external Cl- (C), all at lumenal pH 5.0. The EC50 for glutamate (C) was 376 µM in 10 mM Cl- and 2.95 µM in 1 mM Cl- (p=0.017 by Mann-Whitney, n = 5–6 each). nH, the Hill coefficients for glutamate in different cytoplasmic Cl concentrations. (D–F) Representative recordings and compiled data for endosomes expressing VGLUT1 with either high lumenal Cl- (E) or glutamate (F) in the presence of 140 mM external Cl- (Iin, p=0.029, Iout, p=0.029 both by Mann-Whitney) (++p<0.05 by Mann-Whitney test). (G) Permeation of glutamate by an alternating access mechanism, with the occluded state shown on the left, and permeation by Cl- through a channel (shown on the right). Both anions use a related permeation pathway, but the arginine in TM4 that confers allosteric activation by lumenal Cl- lies outside the permeation pathway. (H) Model for different stages in the filling of synaptic vesicles with glutamate. Immediately after endocytosis (early), the synaptic vesicle contains high concentrations of Cl- which provide the allosteric activation required for anion flux by the VGLUTs (blue). The H+ pump (black) provides the driving force Δψ and cytosolic Cl- allosterically activates rather than inhibits due to the saturating concentration of cytosolic glutamate. As glutamate enters (intermediate), Δψ dissipates and the vesicle acidifies, activating the Cl- conductance and the resulting Cl- efflux maintains the Δψ that drives glutamate uptake. When vesicle filling approaches completion (late), the different permeation mechanisms ensure that efflux of Cl- but not glutamate maintains Δψ while stabilizing the accumulated transmitter.
Tables
Key resources table
| Reagent type | Designation | Source or reference | Identifiers | Additional |
|---|---|---|---|---|
| Gene (Rattus norvegicus) | VGLUT1 | Edwards lab | NM_053859.2 | |
| Gene (Rattus norvegicus) | VGLUT2 | Edwards lab | NM_053427.1 | |
| Gene (Rattus norvegicus) | VGLUT3 | Edwards lab | NM_153725.1 | |
| Cell line (Homo sapiens) | HEK293T cells | UCSF Cell Culture Fac. | ||
| Transfected construct | pEGFP-N1 | Clontech | ||
| Antibody | Mouse anti-actin | Sigma | MAB1501R | (1:3000) |
| Antibody | Guinea pig anti-VGLUT1 | Millipore Sigma | AB5905 | (1:2000) |
| Recombinant DNA reagent | PolyJet | SignaGen | SL100688 | |
| Recombinant DNA reagent | Lipofectamine 2000 | Gibco Life Technologies | ||
| Software, algorithm | Prism 5.0 | GraphPad |
Additional files
-
Transparent reporting form
- https://doi.org/10.7554/eLife.34896.014
Download links
A two-part list of links to download the article, or parts of the article, in various formats.
Downloads (link to download the article as PDF)
Open citations (links to open the citations from this article in various online reference manager services)
Cite this article (links to download the citations from this article in formats compatible with various reference manager tools)
The dual role of chloride in synaptic vesicle glutamate transport
eLife 7:e34896.
https://doi.org/10.7554/eLife.34896


