IgM and IgD B cell receptors differentially respond to endogenous antigens and control B cell fate
- University of California San Francisco, United States
- UT Southwestern Medical Center, United States
- University at Buffalo, The State University of New York, United States
- International Center for Genetic Engineering and Biotechnology (ICGEB), South Africa
- University of Cape Town & Medical Research Council (SAMRC), South Africa
Figures
Figure 1 with 3 supplements

IgD expression enables a dynamic range of IgM responsiveness.
(A) GFP expression in mature Fo splenic B cells (CD19+CD23+CD93-) from Nur77-eGFP BAC Tg reporter mice with either a wild-type BCR repertoire (left), or harboring IgHEL Tg specific for the cognate antigen HEL (hen egg lysozyme) in the absence (middle), or presence (right) of endogenous cognate antigen driven by soluble HEL Tg. WT Fo B cells lacking GFP reporter are included for reference (gray shaded histograms). (B) Surface IgM and IgD expression in splenic Fo B cells from WT, IgM−/−, and IgD−/− mice expressing the Nur77-eGFP reporter. (C) Splenocytes from WT, IgM−/−, and IgD−/− mice were loaded with Indo-1 and stimulated with 2.5 μg/mL of F(ab’)2 anti-IgM or 1:400 anti-IgD. Fo B cells with the highest 20% and lowest 20% Nur77-eGFP expression are compared. (D) Representative histograms and quantification of surface Igκ expression in IgM−/− and IgD−/− Fo B cells normalized to WT. (E) Representative histograms and quantification of Nur77-eGFP expression in IgM−/− and IgD−/− Fo B cells normalized to WT. (F) Median surface Igκ expression of WT, IgM−/−, and IgD−/− Fo B cells was calculated for 200 bins of equal width across the Nur77-eGFP spectrum. For (A), (B) and (F), data are representative of at least n = 4 independent experiments. For (C), n = 3 independent experiments for anti-IgM and n = 2 independent experiments for anti-IgD. For (D) and (E), n = 7 and n = 4, respectively, WT, IgM−/−, and IgD−/− mice. Welch’s t test was used to calculate p values, and mean +SEM is displayed. ***p<0.001.
-
Figure 1—source data 1
Numerical data corresponding to receptor and Nur77 reporter, protein and transcript levels in Figure 1D–F and Figure 1—figure supplement 1D-G, 2B-E.
Numerical data corresponding to receptor and Nur77-eGFP levels in Figure 1D Source code used to calculate median Igκ for given levels of Nur77-eGFP in Figure 1F. Numerical data corresponding to endogenous Nur77 in germ-free mice depicted in Figure 1—figure supplement 1D. Numerical data corresponding to Nr4a1 transcript in germ-free mice depicted in Figure 1—figure supplement 1E. Numerical data corresponding to endogenous Nur77 in MyD88-conditional-knockout peritoneal B1a cells in Figure 1—figure supplement 1F. Numerical data corresponding to Nr4a1 transcript in MyD88-conditional-knockout splenocytes in Figure 1—figure supplement 1G. Numerical data corresponding to surface BCR levels on splenic B cells subsets in Figure 1—figure supplement 2B–C. Numerical data corresponding to surface BCR levels on peritoneal B cell subsets in Figure 1—figure supplement 2D–E.
- https://doi.org/10.7554/eLife.35074.007
-
Figure 1—source data 2
Numerical data corresponding to receptor levels in Figure 1D.
- https://doi.org/10.7554/eLife.35074.008
-
Figure 1—source data 3
Numerical data corresponding to Nur77-eGFP levels in Figure 1E.
- https://doi.org/10.7554/eLife.35074.009
Figure 1—figure supplement 1
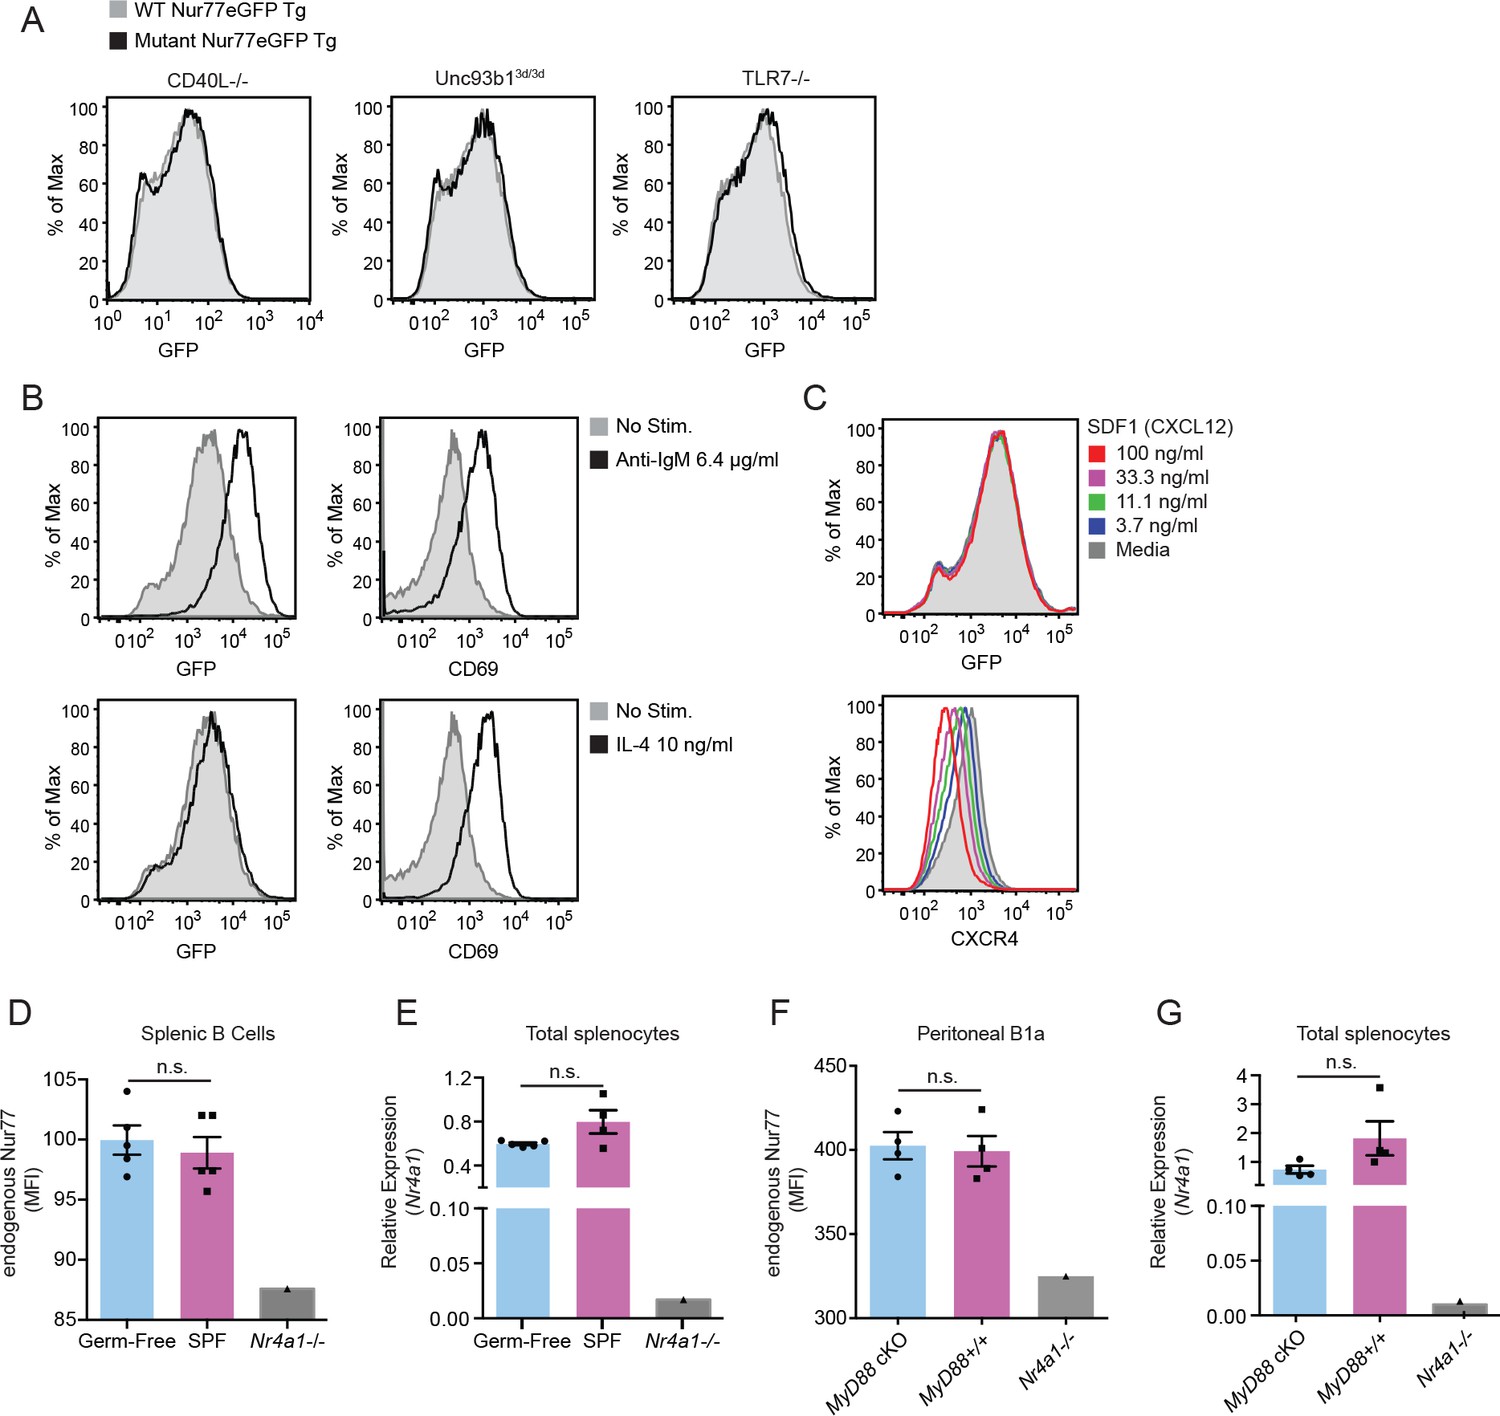
Regulation of endogenous Nur77 and Nur77-eGFP reporter expression.
(A) Nur77-eGFP expression in mature Fo (B220+CD93-CD23+) B cells from mice with mutations in various signaling pathways (CD40L−/−, Unc93b13d/3d,TLR7−/−). This Unc93b1 mutation abolishes signaling through TLR3, TLR7, and TLR9. (B) Nur77-eGFP and CD69 induction in B220+ splenocytes from Nur77-eGFP reporter mice stimulated with either anti-IgM or IL-4 in vitro for 24 hr. (C) Splenic B cells were stimulated with CXCR4 ligand (SDF-1) in vitro for 18 hr and Nur77-eGFP expression and CXCR4 downregulation were assessed. (D–E) Splenocytes from N = 5 Germ-free and SPF mice were taken directly ex vivo and either permeabilized and stained to detect B220+ cells and endogenous Nur77 by intracellular staining (D), or total Nr4a1 transcript by qPCR (E). (F) PerC (peritoneal cavity) cells from n = 4 MB1-Cre+ MyD88fl/fl and controls were permeabilized and stained immediately ex vivo to detect B1a cells and endogenous Nur77 by intracellular staining. (G) Splenocytes from mice analyzed in (F) were harvested directly ex vivo to detect total Nr4a1 transcript by qPCR. In D-G, Nr4a1-/- splenocytes serve as a control for both Ab and primer specificity. Data in (A) and (C) are representative of n = 2 independent experiments. Data in (B) are representative of n = 3 independent experiments.
Figure 1—figure supplement 2
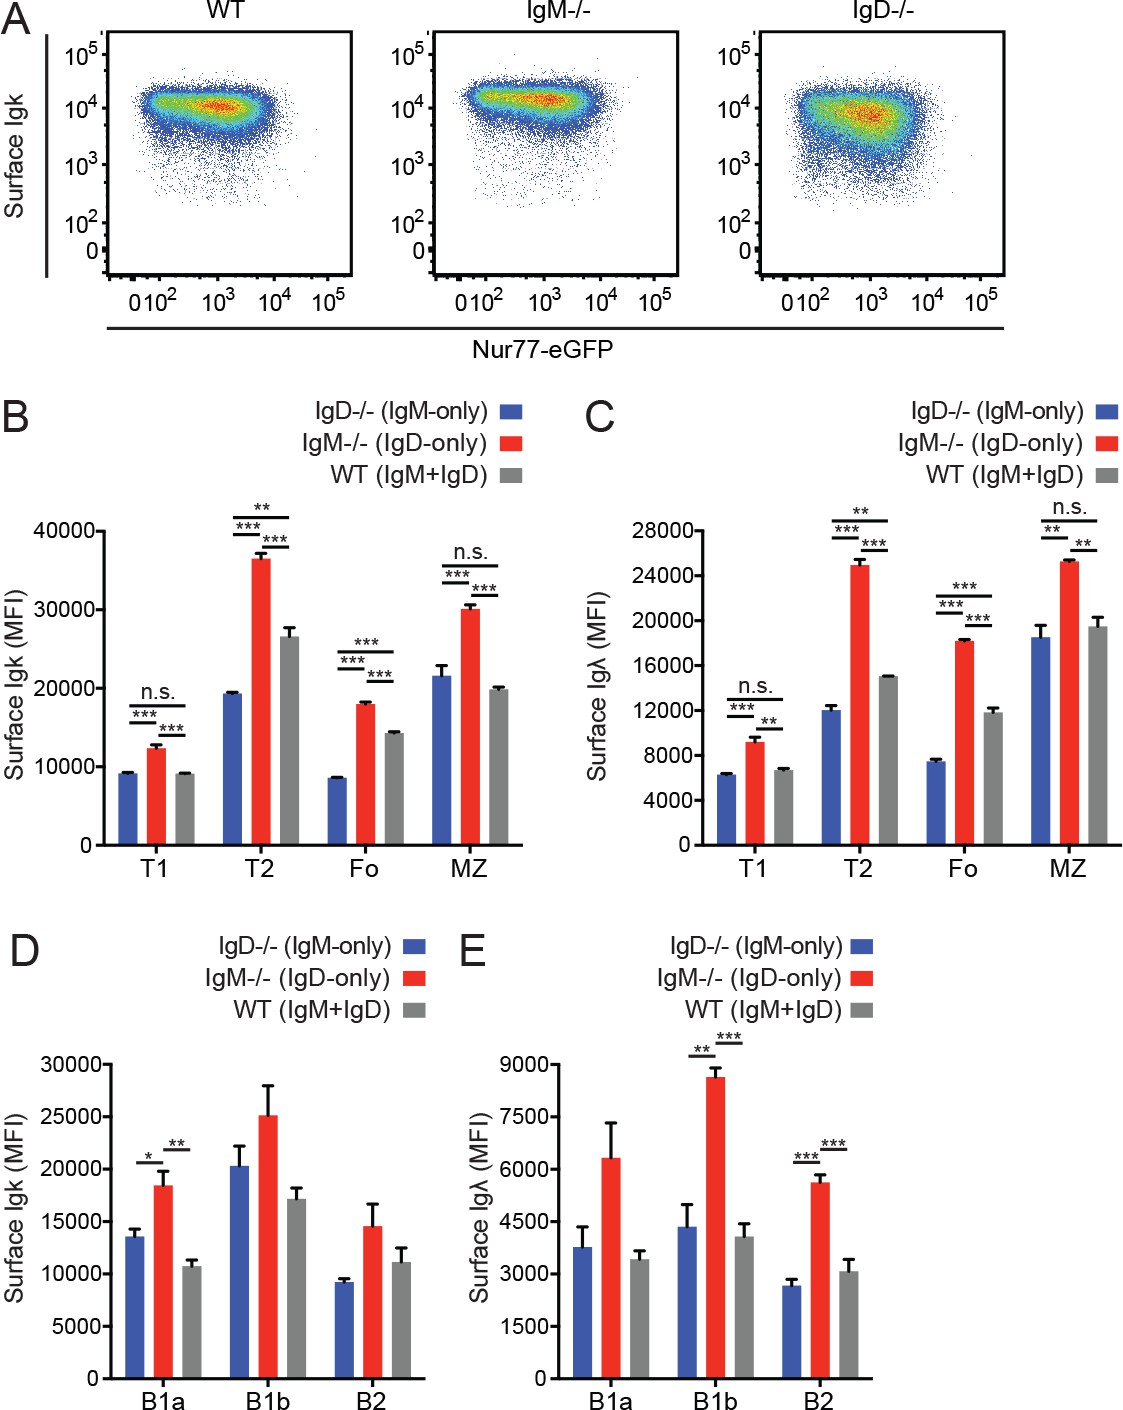
Quantification of surface BCR expression on B cell subsets.
(A) Surface Igκ expression relative to Nur77-eGFP reporter in Fo B cells from WT, IgM−/−, and IgD−/− mice. (B) Mean surface Igκ expression was calculated for Igκ+ splenic B cell (B220+) subsets in WT, IgM−/−, and IgD−/− mice. T1 (CD93+CD23-); T2/3 (CD93+CD23+); Fo (CD93-CD23+); MZ (CD21hiCD23lo). (C) Surface Igλ MFI of Igλ+ B cell subsets described in (B). (D) Surface Igκ MFI of Igκ+ cells in peritoneal B cell (CD19+) subsets. B1a (CD5+CD23-); B1b (CD5-CD23-); B2 (CD5-CD23+). (E) Surface Igλ MFI of Igλ+ cells in peritoneal B cell subsets described in (D). Data in (A) are representative of n = 3 independent experiments. Values in (B-E) were calculated from n = 3 mice of each genotype. One-way ANOVA with Tukey’s multiple comparisons test (B-E) was used to calculate p values, and mean +SEM is displayed. *p<0.05, **p<0.01, ***p<0.001.
Figure 1—figure supplement 3
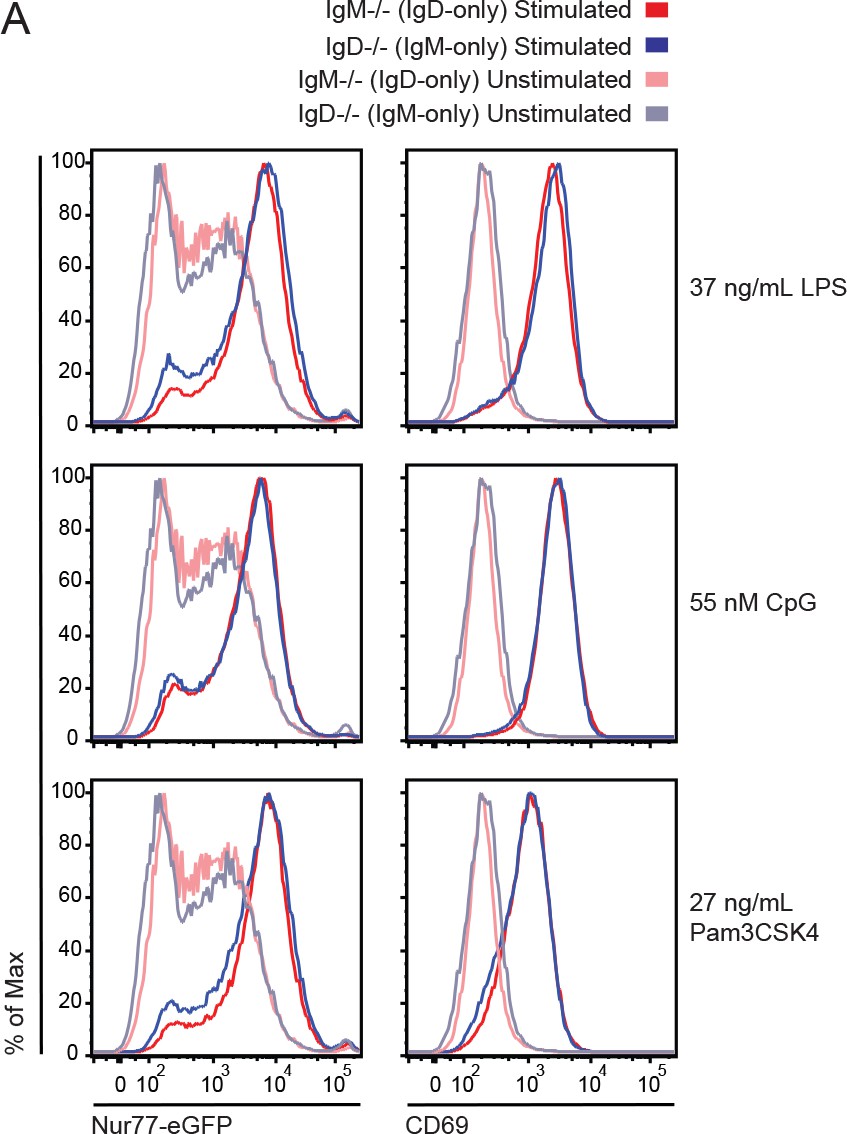
Induction of Nur77-eGFP and CD69 in TLR-stimulated IgM−/− and IgD−/− B cells.
(A) Nur77-eGFP and CD69 upregulation in IgM−/− and IgD−/− splenic B cells stimulated with indicated doses of LPS, CpG, and Pam3CSK4. Histograms compare unstimulated cells with cells incubated with indicated stimuli for 18 hr at 37C. Histograms are representative of two independent experiments.
Figure 2 with 1 supplement
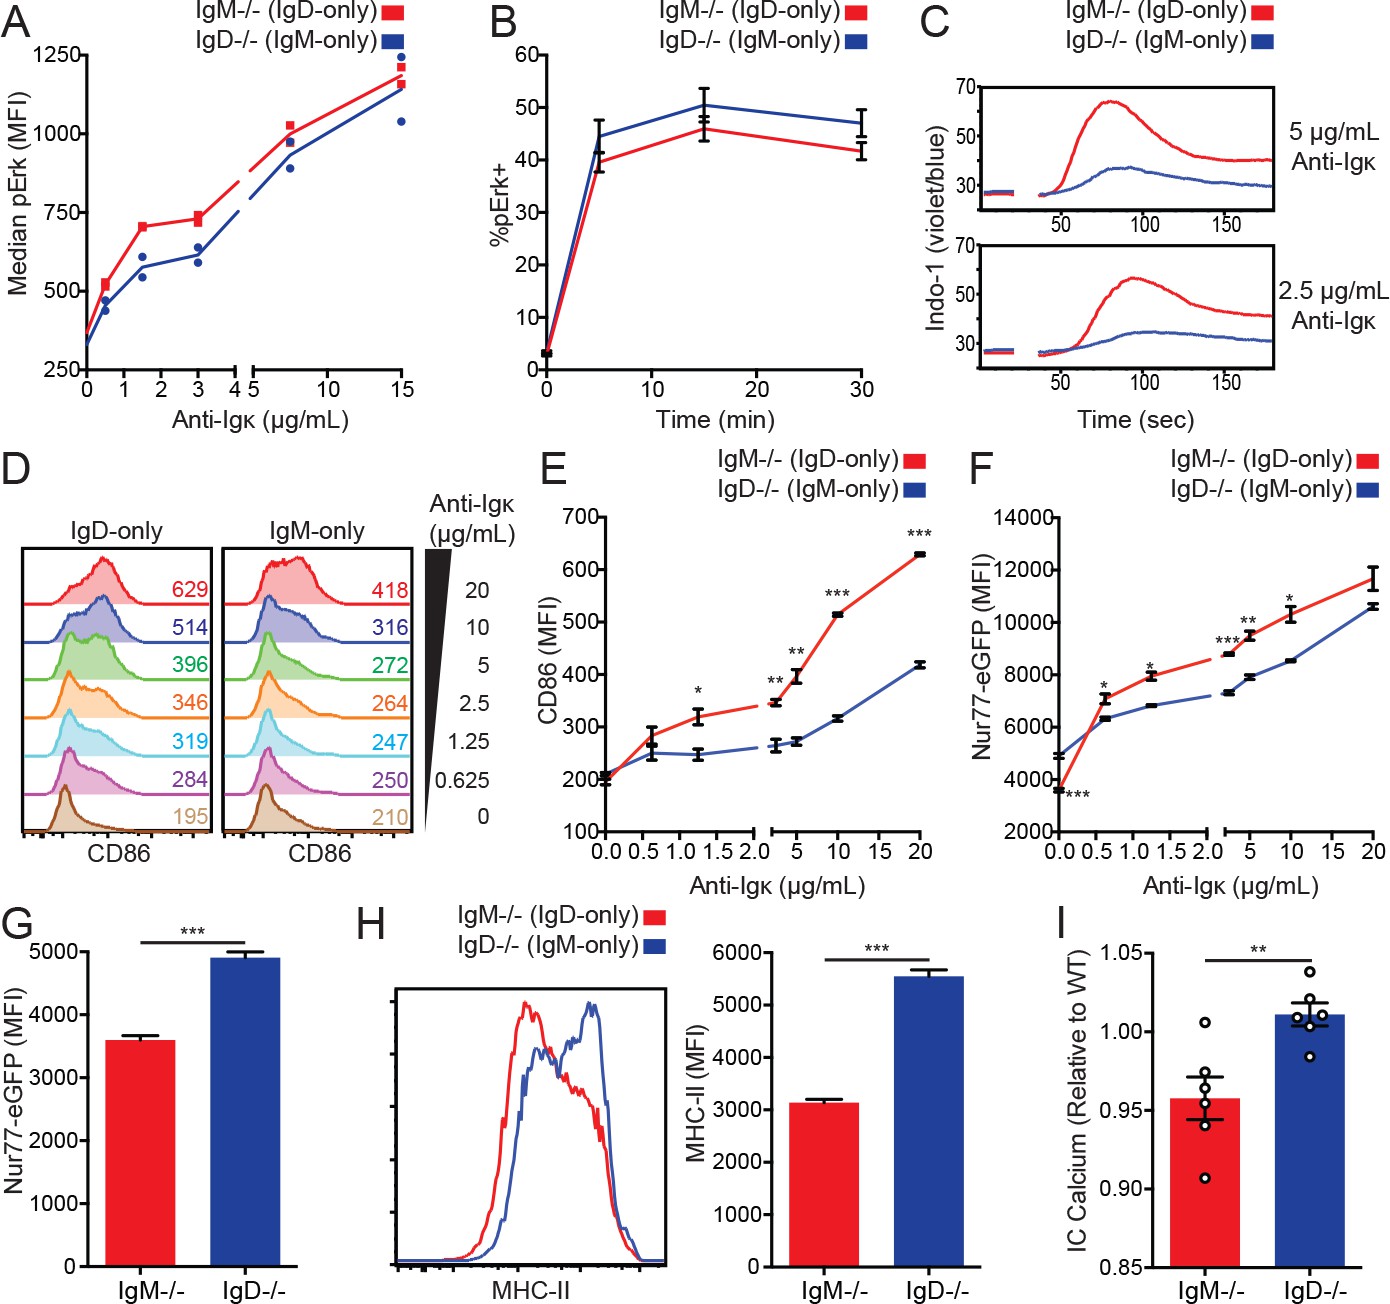
IgD signals strongly in vitro but weakly in vivo.
(A) Median intracellular pErk in splenic CD23+ B cells stimulated with anti-Igκ for 15 min. (B) Erk phosphorylation kinetics in splenic CD23+ B cells stimulated with 15 μg/mL anti-Igκ. (C) Splenocytes from IgM−/− and IgD−/− mice were loaded with Indo-1 and stimulated with 2.5 or 5 μg/mL anti-Igκ. B220+CD23+CD93- Fo B cells are compared. (D) CD86 induction in CD23+ IgM−/− and IgD−/− splenocytes stimulated with anti-Igκ for 18 hr. (E) Summary data for CD86 MFI in (D). (F) Nur77-eGFP induction in cells from (D). (G) Nur77-eGFP in cells from (D) incubated with medium alone (0 μg/mL anti-Igκ). (H) Representative histograms and summary data for MHC-II induction in unstimulated cells from (D). (I) Basal calcium in unstimulated IgM−/− and IgD−/− Fo B cells was calculated by normalizing the geometric mean of [Indo-1(violet)/Indo-1(blue)] to WT B cells in the same experiment. For (A), signaling in cells from n = 2 IgM−/− and IgD−/− mice is displayed, and results for 1.5, 3, and 15 μg/mL of anti-Igκ were replicated in n = 3 independent experiments. Data in (B) was compiled from n = 3 independent experiments with n = 3 mice of each genotype in each experiment. Data in (C) are representative of n = 4 independent experiments for 5 μg/mL and n = 2 independent experiments for 2.5 μg/mL. For (D-H), values were calculated for splenocytes from n = 3 mice of each genotype. For (I), basal calcium ratios from n = 6 independent experiments are compiled. Welch’s t test was used to calculate p values, and mean ±SEM is displayed. *p<0.05, **p<0.01, ***p<0.001.
-
Figure 2—source data 1
Numerical data corresponding to Figure 2A and B, E-I, and Figure 2—figure supplement 1A.
Numerical data corresponding to ERK phosphorylation in Figure 2A–B. Numerical data corresponding to activation marker upregulation in Figure 2E–H. Numerical data corresponding to basal calcium in Figure 2I. Numerical data corresponding to S6 phosphorylation in Figure 2—figure supplement 1A.
- https://doi.org/10.7554/eLife.35074.013
-
Figure 2—source data 2
Numerical data corresponding to basal calcium in Figure 2I.
- https://doi.org/10.7554/eLife.35074.014
Figure 2—figure supplement 1
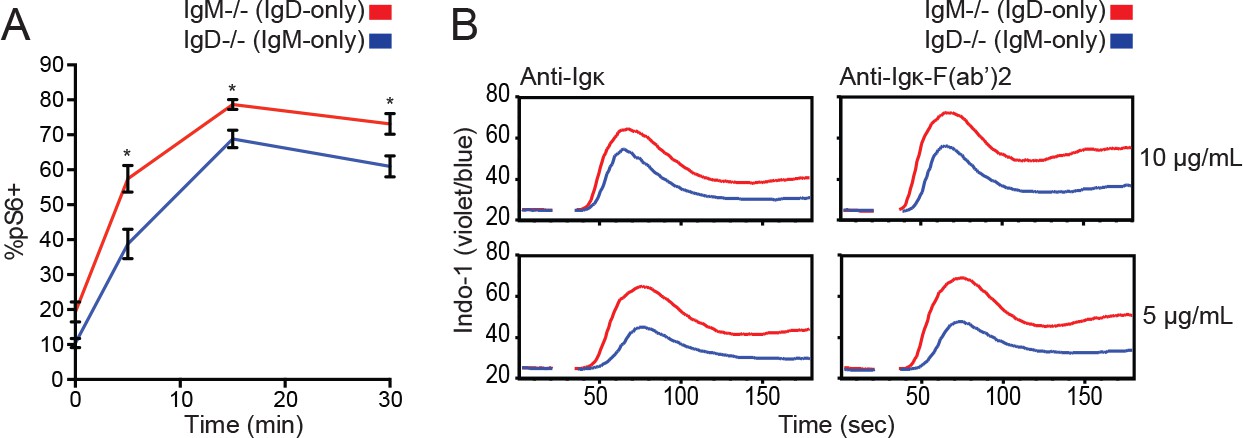
S6 and calcium signaling in IgM-/- and IgD-/- B cells.
(A) S6 phosphorylation kinetics in splenic CD23+ B cells following stimulation with 15 μg/mL anti-Igκ. (B) Splenocytes from IgM−/− and IgD−/− mice were loaded with Indo-1 and stimulated with 10 or 5 μg/mL anti-Igκ or anti-Igκ F(ab’)2. Data in (A) and (B) are representative of n = 3 and n = 2 independent experiments, respectively. Welch’s t test was used to calculate p values, and mean ±SEM is displayed. *p<0.05.
Figure 3 with 1 supplement
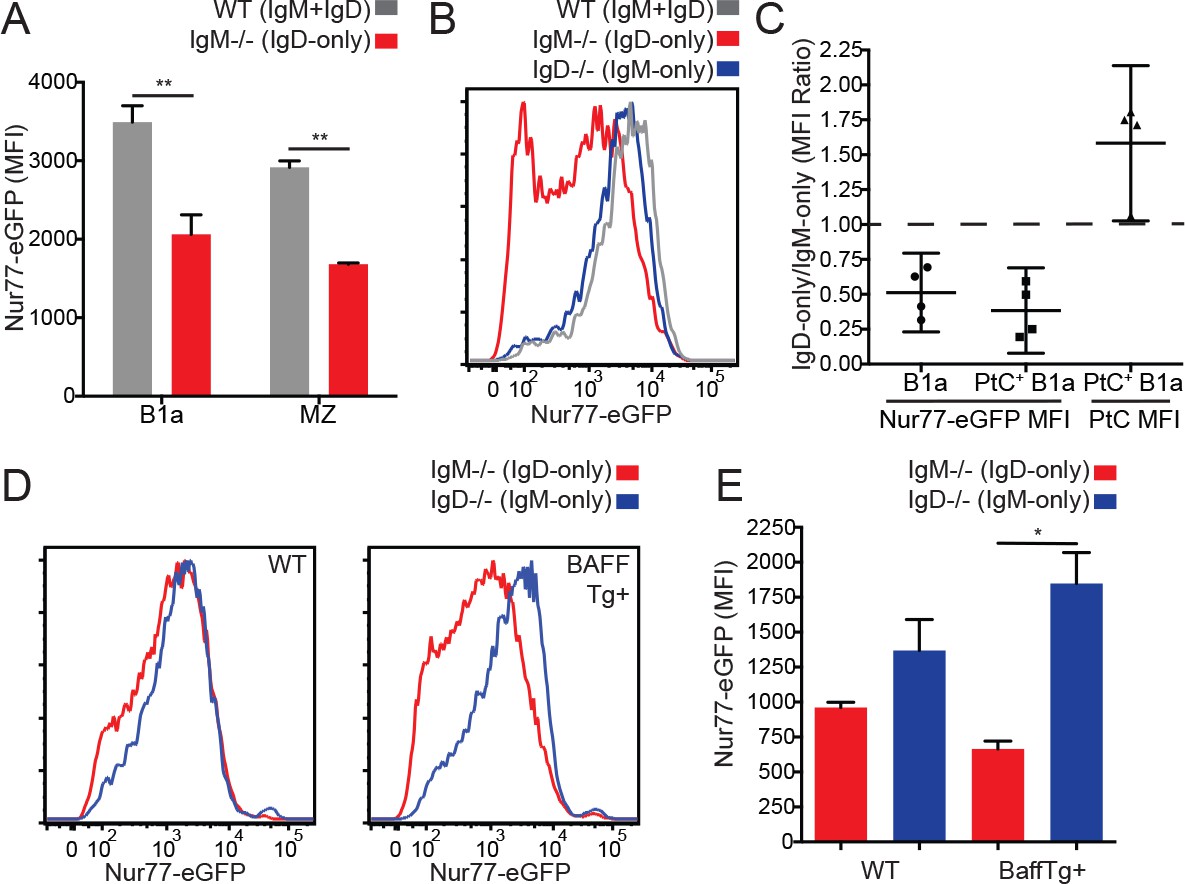
Reduced in vivo antigen sensing by IgD in innate-like B cells.
(A) Nur77-eGFP in peritoneal B1a (CD19+CD5+CD23-) and splenic MZ (B220+CD21hiCD23lo) B cells from WT and IgM−/− mice. (B) Nur77-eGFP in PtC-binding peritoneal B1a cells from WT, IgM−/−, and IgD−/− mice. (C) Nur77-eGFP and PtC MFIs were calculated for total B1a and PtC-binding B1a cells. The ratio of the IgM−/− (IgD-only) MFI to the IgD−/− (IgM-only) MFI is displayed with a 95% confidence interval. (D) Representative histograms of Nur77-eGFP in IgM−/− and IgD−/− splenic MZ B cells from mice without (left) and with (right) a BAFF overexpression transgene. (E) Quantification of Nur77-eGFP in MZ B cells from (D). For (A) and (E), n = 3 mice of each genotype were analyzed. For (B), histograms are representative of n = 4 mice of each genotype. For (C), ratios are pooled for n = 4 mice of each genotype from three independent experiments. For (D), histograms are representative of n = 3 mice of each genotype. Welch’s t test (A and E) was used to calculate p values, and mean +SEM is displayed (except in C). *p<0.05.
-
Figure 3—source data 1
Numerical data corresponding to Nur77-eGFP and BCR expression in innate-like B cells in Figures 3A, C, E, Figure 3—figure supplement 1A-C.
Numerical data corresponding to Nur77-eGFP expression and PtC binding in B1a cells in Figure 3A and C. Numerical data corresponding to Nur77-eGFP and surface receptor levels in BaffTg+ MZ B cells in Figure 3E and Figure 3—figure supplement 1A. Numerical data corresponding to Nur77-eGFP expression in innate-like B cells in Figure 3—figure supplement 1B. Numerical data corresponding to Nur77-eGFP expression in MZ B cells in Figure 3—figure supplement 1C.
- https://doi.org/10.7554/eLife.35074.017
-
Figure 3—source data 2
Numerical data corresponding to Nur77-eGFP expression and PtC binding in B1a cells in Figure 3C.
- https://doi.org/10.7554/eLife.35074.018
Figure 3—figure supplement 1
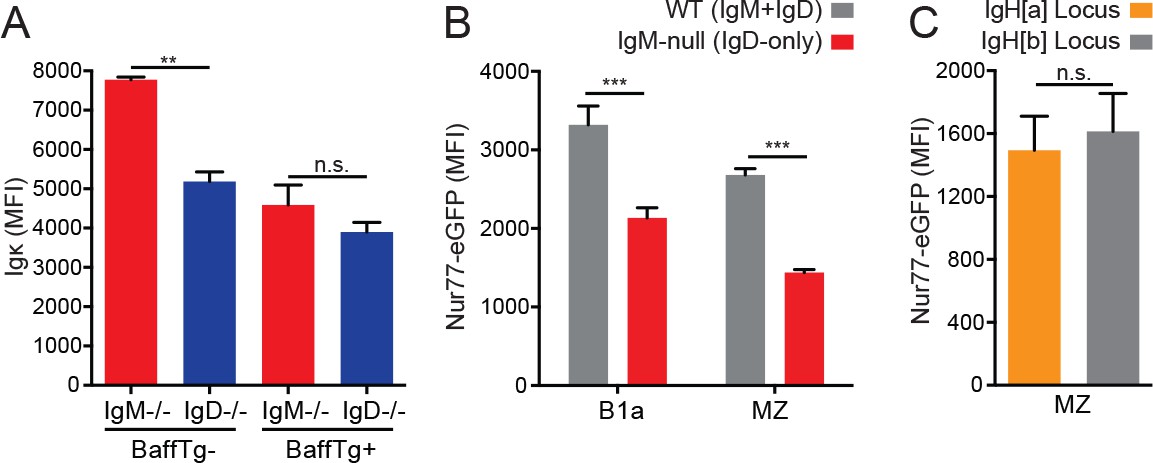
The effect of BAFF, competition, and allotype on Igκ and Nur77-eGFP expression.
(A) Surface Igκ MFI of IgM−/− and IgD−/− splenic MZ B cells from mice without (left) and with (right) a BAFF overexpression transgene. (B) Nur77-eGFP expression in peritoneal B1a and splenic MZ B cells from IgM-null (IgDa+) and WT (IgMb+) loci in IgM+/− mice. (C) Nur77-eGFP expression in IgMa+ and IgMb+ splenic MZ B cells in 6-month-old IgHa/b mice with a BAFF overexpression transgene. Values in (A) were calculated from n = 3 mice of each genotype. Values in (B) and (C) were calculated in n = 6 and n = 4 mice, respectively. Welch’s t test (A) and a paired t test (B-C) were used to calculate p values, and mean +SEM is displayed. **p<0.01, ***p<0.001.
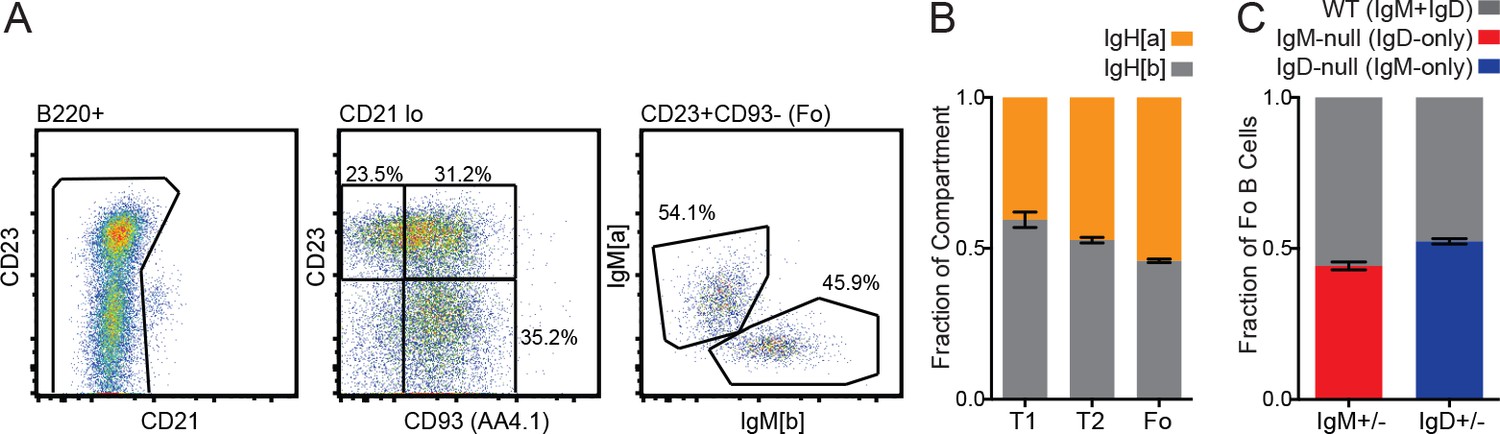
Figure 4 with 1 supplement
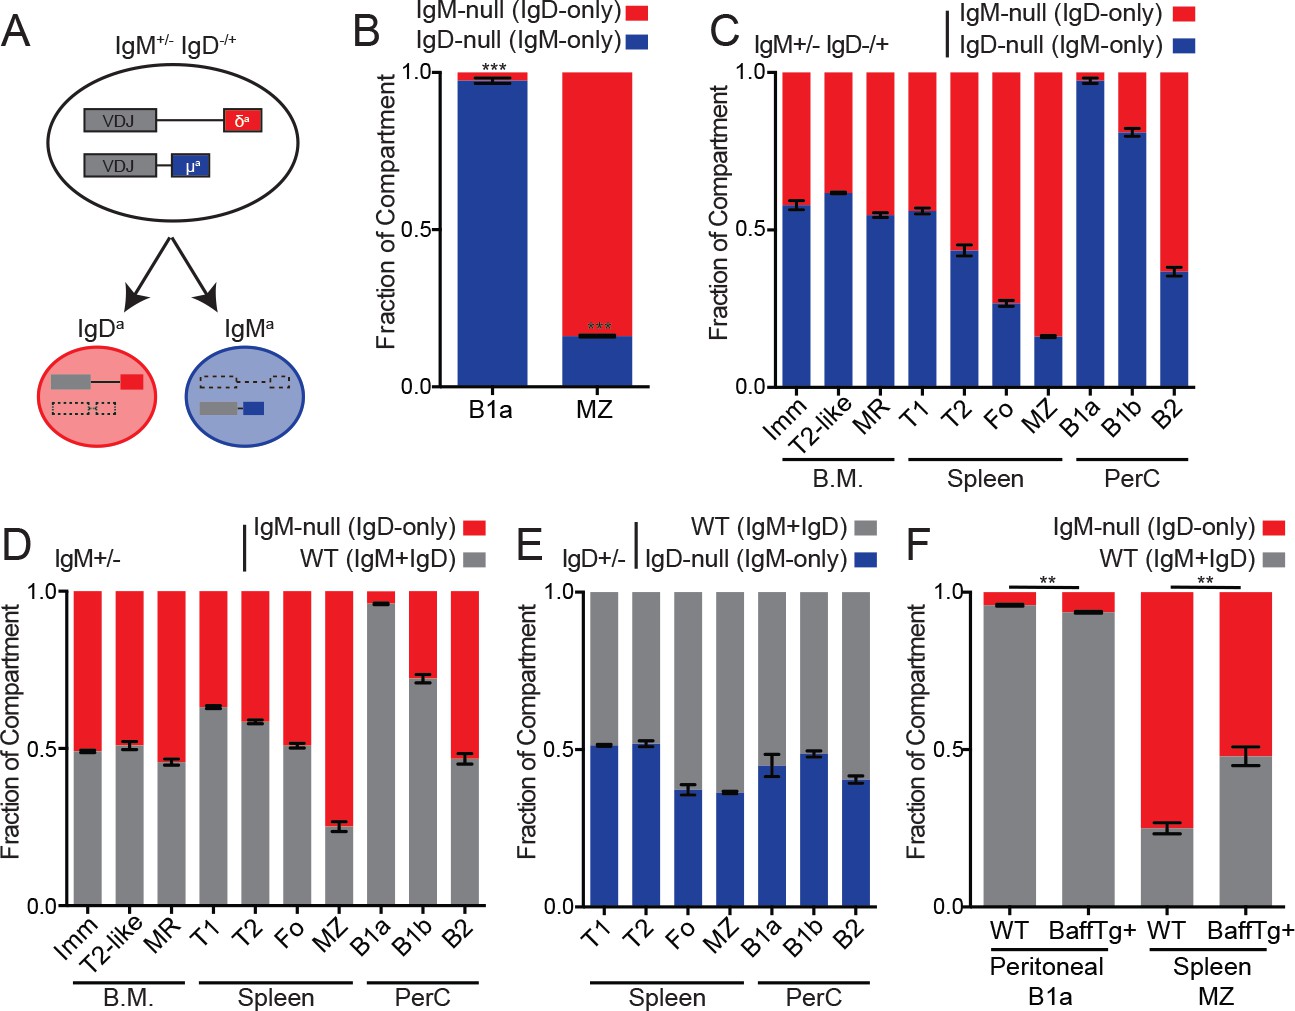
Cell-intrinsic skewing of B cell development by IgM and IgD BCRs.
(A) Allelic exclusion leads to a 1:1 mixture of IgM-only and IgD-only B cells in IgM+/− IgD−/+ mice. (B) Proportion of peritoneal B1a (CD19+CD5+CD23-) and splenic MZ (B220+CD21hiCD23lo) B cells originating from each Ig locus in IgM+/− IgD−/+ mice. (C) Relative competition between IgM+ and IgD+ B cells in IgM+/− IgD−/+ mice was calculated for bone marrow, splenic, and peritoneal B cell compartments. Results include data from (B) for reference. Immature (CD23-CD93+); T2-like (CD23+CD93+); mature recirculating (CD23+CD93-); T1 (CD93+CD23-); T2/3 (CD93+CD23+); Fo (CD93-CD23+); MZ (CD21hiCD23lo); B1a (CD5+CD23-); B1b (CD5-CD23-); B2 (CD5-CD23+). (D) Relative competition between WT (IgMb+) and IgM-null (IgDa+) B cells in IgM+/− mice was determined as in (C). (E) Relative competition between WT (IgMb+) and IgD-null (IgMa+) B cells in IgD+/− mice was determined for splenic and peritoneal compartments as described in (C). (F) Competition in peritoneal B1a and splenic MZ compartments in IgM+/− mice with or without a BAFF overexpression transgene. Results include data from (D) for reference. For (B) and (C), n = 3–5 mice were analyzed. For (D), n = 3–8 mice were analyzed. For (E), n = 5 mice were analyzed. For (F), n = 4–5 mice of each genotype were analyzed. Welch’s t test was used to calculate p values, and mean ±SEM is displayed. **p<0.01, ***p<0.001.
-
Figure 4—source data 1
Numerical data corresponding to competition between IgM-only, IgD-only and WT B cells in Figure 4B–F, and in Figure 4—figure supplement 1B-D
Numerical data corresponding to competition between IgM-only, IgD-only and WT B cells inFigures 4B-F.Numerical data corresponding to splenic and peritoneal B cell compartment sizes in Figure 4—figure supplement 1B–C. Numerical data corresponding to competition between IgHa and IgHb B cells in Figure 4—figure supplement 1D.
- https://doi.org/10.7554/eLife.35074.021
-
Figure 4—source data 2
Numerical data corresponding to competition between IgM-only, IgD-only and WT B cells in Figure 4B–E.
- https://doi.org/10.7554/eLife.35074.022
-
Figure 4—source data 3
Numerical data corresponding to competition between IgD-only and WT B cells in Figure 4F.
- https://doi.org/10.7554/eLife.35074.023
Figure 4—figure supplement 1
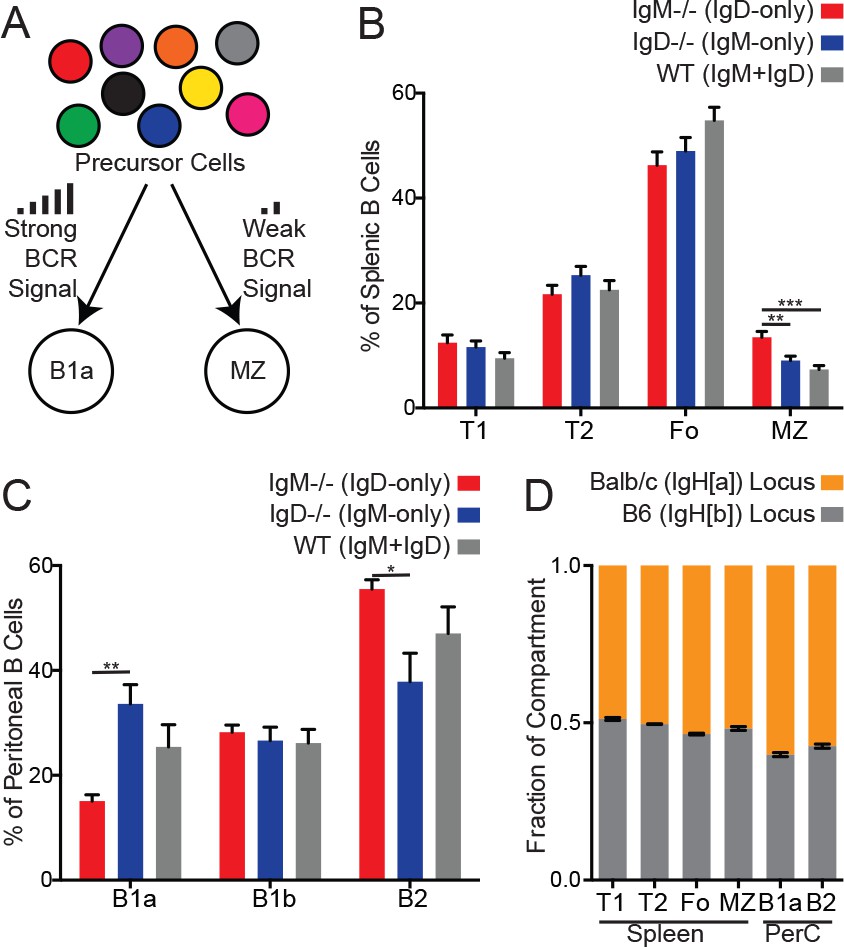
B cell subset development in IgM−/−, IgD−/−, WT, and IgHa/b mice.
(A) Signal strength model of B1a and MZ B cell development. While B1a and MZ cells originate from different precursor populations, their development is thought to be BCR signal strength-dependent. (B) B cell compartments as a percentage of total B220+ splenic B cells. T1 (CD93+CD23-); T2/3 (CD93+CD23+); Fo (CD93-CD23+); MZ (CD21hiCD23lo). (C) B cell compartments as a percentage of total CD19+ peritoneal B cells. B1a (CD5+CD23-); B1b (CD5-CD23-); B2 (CD5-CD23+). (D) Relative competition between IgMa+ and IgMb+ B cells in Balb/c-B6 F1 mice was calculated for splenic and peritoneal compartments described in (B–C). For (B), n = 10–12 mice of each genotype were analyzed. For (C), n = 6 mice of each genotype were analyzed. For (D), n = 3 mice were analyzed. Mice in (D) were 6–14 weeks old. One-way ANOVA with Tukey’s multiple comparisons test (B-C) was used to calculate p values, and mean ±SEM is displayed. *p<0.05, **p<0.01, ***p<0.001.
Figure 5 with 3 supplements

IgD can drive polyclonal activation and germinal center entry, but not anti-dsDNA IgG2a production, in Lyn−/− mice.
(A) Surface CD69 and CD86 expression on CD23+ splenic B cells from each Ig locus in IgM+/− mice on Lyn+/+ and Lyn−/− backgrounds. (B) Percentage of unswitched germinal center (CD19+ Fashi GL-7hi IgM/IgD+) B cells from each Ig locus in IgM+/− and IgD+/− mice on the Lyn−/− background. (C) Anti-dsDNA IgG2a titers from each Ig locus in IgM+/− Lyn−/− mice were calculated by ELISA using pooled IgHa/b autoimmune serum with high-titer autoantibodies from each locus as a reference (titer set at 1000). Each color represents a single mouse tracked over time. (D) Anti-dsDNA IgG2a titers in IgD+/− Lyn−/− mice were calculated as in (C). (E) Paired anti-dsDNA titers from each locus in individual IgM+/− Lyn−/− mice from (C) with additional mice from 24 weeks to 12 months. (F) Paired anti-dsDNA titers from each locus in IgD+/− Lyn−/− mice from (D). (G) Ratio of anti-dsDNA IgG2a[a] to IgG2a[b] from all samples in (E) and (F) with an anti-dsDNA IgG2a titer >250 from either locus; cutoff defined by titers in young WT mice. For (A), n = 4 IgM+/− Lyn−/− mice are compared to a reference IgM+/− Lyn+/+ mouse. Qualitatively similar results were obtained in two independent experiments. For (B) n = 5–6 mice of each genotype were analyzed. For (C) and (D), n = 9 and n = 12 mice were tracked. For (G), n = 36 IgM+/− Lyn−/− and n = 39 IgD+/− Lyn−/− anti-dsDNA IgG2a+ samples were compared. Welch’s t test was used to calculate p values, and mean ±SEM is displayed. **p<0.01.
-
Figure 5—source data 1
Numerical data corresponding to Figure 5A-G,Figure 5—figure supplement 1B-C, 3C-E.
Numerical data corresponding to germinal center composition in Figure 5B. Numerical data corresponding to autoantibody production in Figure 5C–G. Numerical data corresponding to cellular phenotypes of IgHa/b Lyn−/− mice in Figure 5—figure supplement 1A–B and Figure 5—figure supplement 3C. Numerical data corresponding to follicular B cell competition in Lyn-deficient IgM+/− and IgD+/− mice in Figure 5—figure supplement 1C. Numerical data corresponding to germinal center composition in Figure 5—figure supplement 3B-C. Numerical data corresponding to autoantibody production in Figure 5—figure supplement 3D–E.
- https://doi.org/10.7554/eLife.35074.028
Figure 5—figure supplement 1
Splenic B cell subsets in IgHa/b, IgM+/−, and IgD+/− Lyn−/− mice.
(A) Gating scheme for determining Ig locus of origin for splenic B cell subsets in 6-month-old IgHa/b Lyn−/− mice. (B) Quantification of compartments in (A). T1 (CD93+CD23-); T2/3 (CD93+CD23+); Fo (CD93-CD23+). (C) Percentage of Fo B cells originating from each Ig locus in IgM+/− and IgD+/− mice on the Lyn−/− background. Percentages in (A-C) were calculated using n = 5–6 mice of each genotype, and mean +SEM is displayed.
Figure 5—figure supplement 2
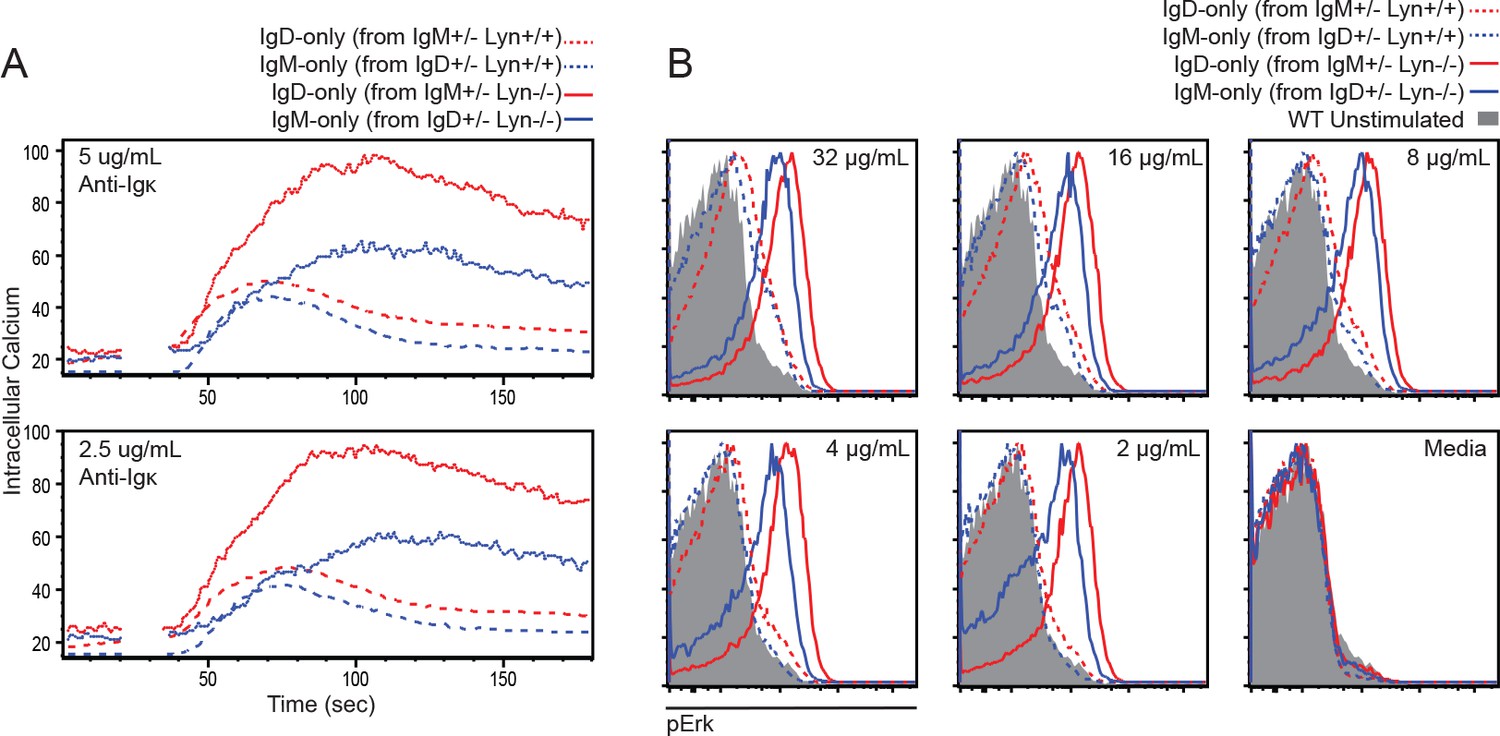
Signaling in IgM+/− and IgD+/− Lyn−/− B cells.
(A) Splenocytes from IgM+/− and IgD+/− mice on either Lyn+/+ or Lyn−/− backgrounds were loaded with Indo-1 and stimulated with anti-Igκ. WT (IgMb+) B cells were gated out to isolate IgM-null (IgD-only) and IgD-null (IgM-only) cells. CD19+CD23+ B cells are compared. (B) Intracellular Erk phosphorylation in splenic B220+CD23+ B cells from mice in (A) stimulated with varying doses of anti-Igκ for 5 min. Shaded histogram corresponds to IgMb+ cells from IgD+/− Lyn−/− mice incubated with medium alone for reference. (A) and (B) are representative of two independent experiments.
Figure 5—figure supplement 3
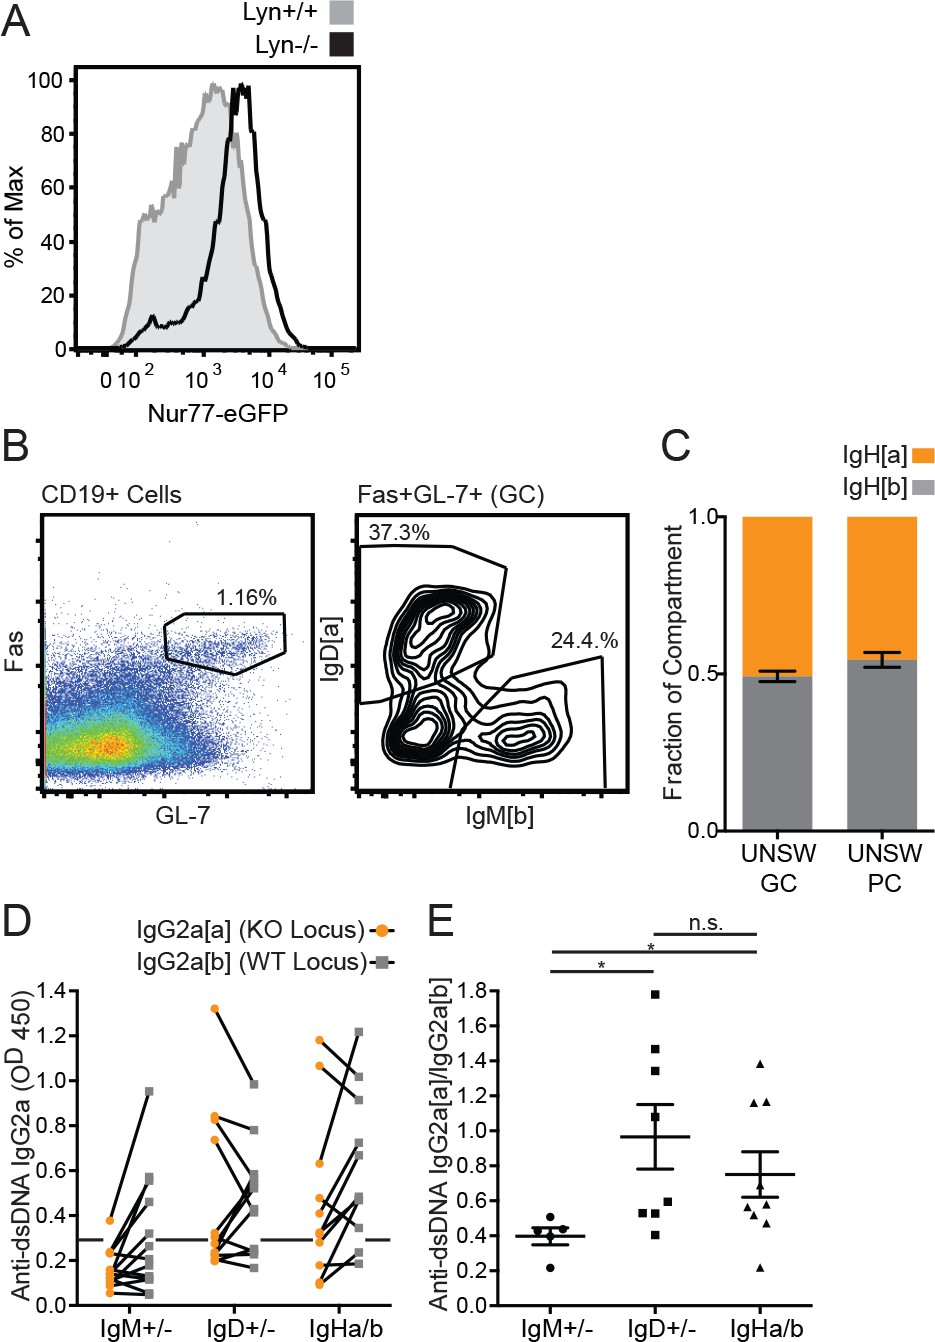
Nur77-eGFP in Lyn−/− B cells and the role of BCR allotype in Lyn−/− phenotypes.
(A) Nur77-eGFP expression in splenic mature Fo B cells from Lyn+/+ and Lyn−/− reporter mice. (B) Gating scheme for determining the Ig locus of origin for germinal center B cells in 6-month-old IgM+/− Lyn−/− mice. (C) Relative contribution of IgHa+ and IgHb+ B cells to the splenic unswitched GC (CD19+ Fas+ GL-7+ IgM+) and unswitched PC (CD138+IgM+) compartments of 6-month-old IgHa/b Lyn−/− mice. (D) Anti-dsDNA IgG2a from each Ig locus in 5–6 month old IgM+/−, IgD+/−, and IgHa/b mice on the Lyn−/− background was quantified by ELISA. (E) The OD ratio of knockout (allotype a) to WT (allotype b) anti-dsDNA IgG2a was calculated for all mice in (D) in which either locus produced an OD >0.3. Histograms in (A) are representative of at least n = 3 mice of each genotype. Percentages in (B-C) were calculated using n = 5–6 mice of each genotype, and mean ±SEM is displayed. For (D), n = 10–13 mice of each genotype were analyzed. For (E), n = 5–9 autoantibody-positive mice were analyzed. Welch’s t test (E) was used to calculate p values, and mean ±SEM is displayed. *p<0.05.
Figure 6 with 2 supplements
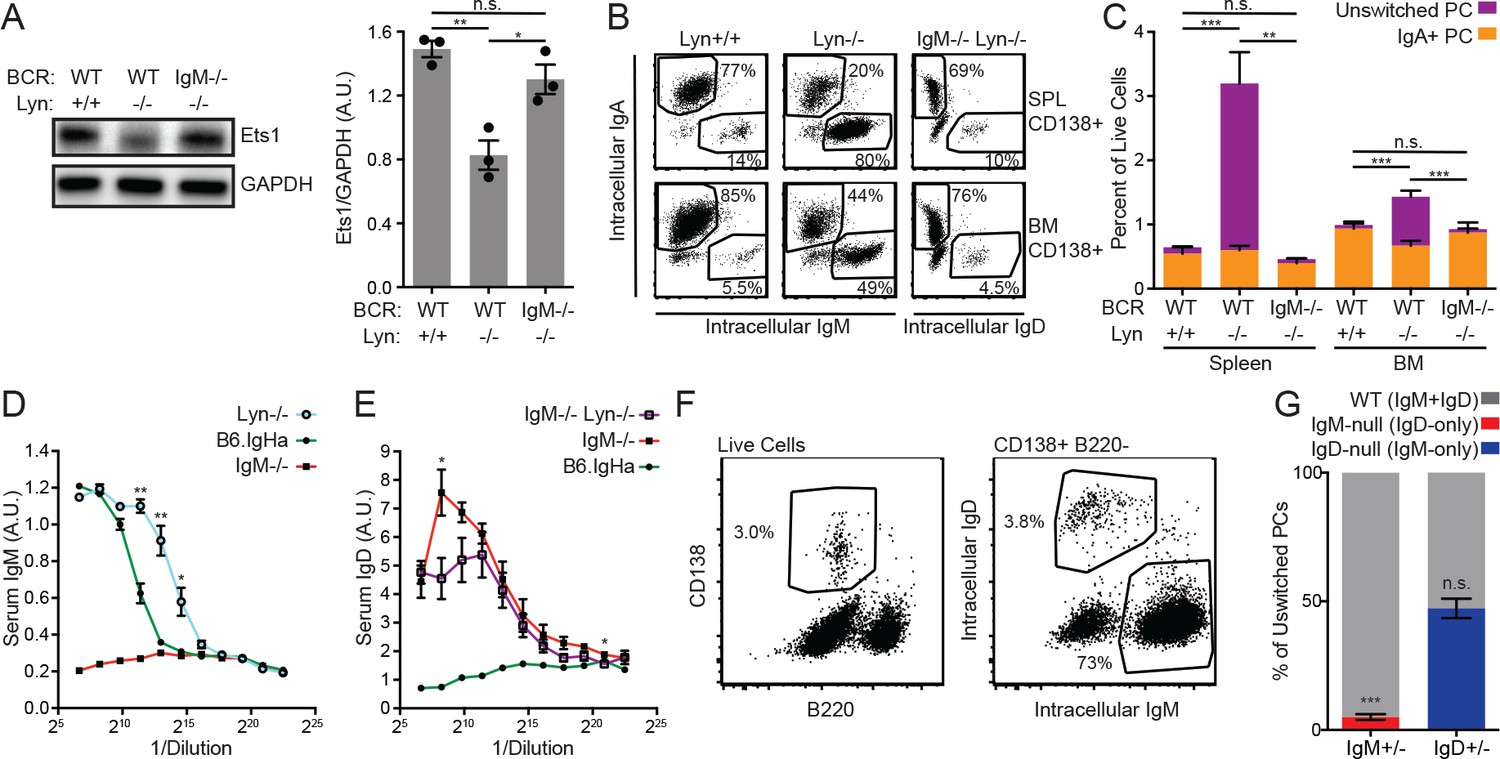
Cell-intrinsic IgM expression is required for unswitched plasma cell expansion in Lyn−/− mice.
(A) Representative blot and quantification of Ets1 and GAPDH protein in purified splenic B cells from WT, Lyn−/−, and IgM−/− Lyn−/− mice. (B) Composition of the CD138+ plasma cell compartments in the spleen and bone marrow of WT, Lyn−/−, and IgM−/− Lyn−/− mice was determined by intracellular staining of IgM, IgD, and IgA. (C) Percentages in (B) multiplied by the fraction of live cells positive for CD138 in each tissue. Unswitched cells are positive for either IgM or IgD. Statistics correspond to unswitched plasma cell percentages; differences in IgA+ cells were not significant. (D) Serum IgM in 16-week-old mice was quantified for B6.IgHa (WT) and Lyn−/− mice by ELISA. A sample from an IgM−/− mouse is shown for reference. (E) Serum IgD in 16-week-old mice was quantified for IgM−/− and IgM−/− Lyn−/− mice by ELISA. A sample from a WT mouse is shown for reference. (F) Gating scheme for quantifying the unswitched splenic plasma cell composition of IgM+/− Lyn−/− mice. (G) Percentage of unswitched splenic plasma cells (CD138+B220loIgM/IgD+) from each locus in IgM+/− and IgD+/− mice on the Lyn−/− background. For (B) and (C), figures are representative of n = 4–5 mice of each genotype. For (D), values from n = 3 WT and n = 4 Lyn−/− mice are averaged. For (E), values from n = 3 IgM−/− and n = 4 IgM−/− Lyn−/− mice are averaged. For (F) and (G), n = 4–5 mice of each genotype were used. Welch’s t test was used to calculate p values, and mean ±SEM is displayed. *p<0.05, **p<0.01, ***p<0.001.
-
Figure 6—source data 1
Numerical data corresponding to Ets1 expression, plasma cell compartments, and serum IgM and IgD titers in Figure 6A-G.
Numerical data corresponding to Ets1 expression in Figure 6A. Numerical data corresponding to plasma cell compartments in Figure 6B–C. Numerical data corresponding to serum IgM titers in Figure 6D. Numerical data corresponding to serum IgD titers in Figure 6E. - Numerical data corresponding to plasma cell competition in Figure 6F and G.
- https://doi.org/10.7554/eLife.35074.032
-
Figure 6—source data 2
Numerical data corresponding to Ets1 expression in splenic B cells in Figure 6A.
- https://doi.org/10.7554/eLife.35074.033
-
Figure 6—source data 3
Numerical data corresponding to plasma cell compartments in Figure 6B–C.
- https://doi.org/10.7554/eLife.35074.034
Figure 6—figure supplement 1
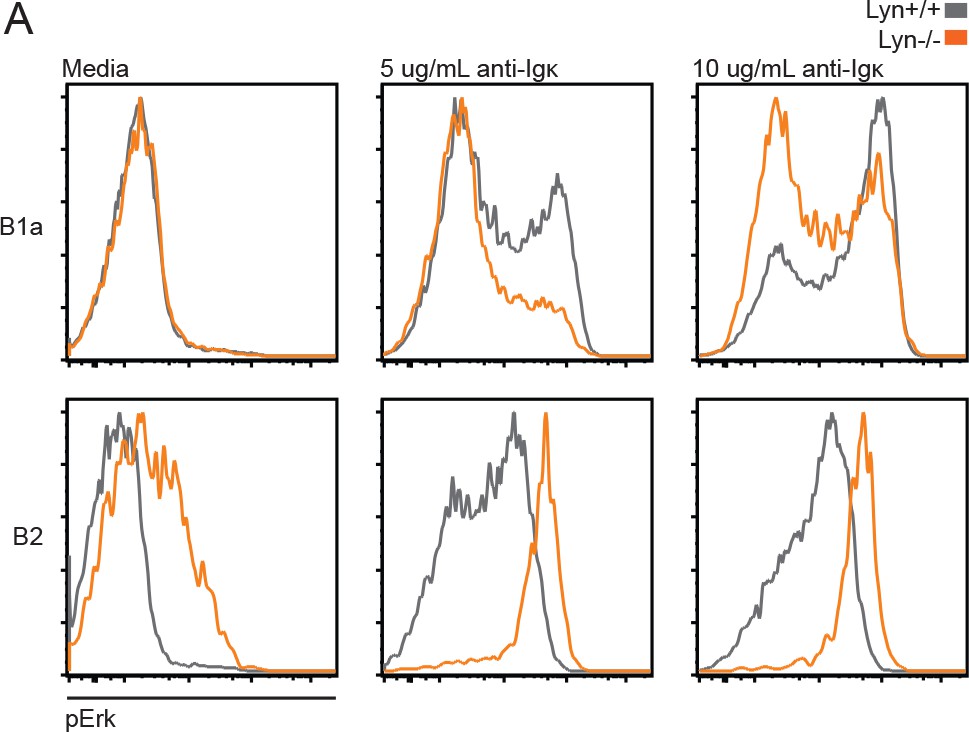
BCR signaling in Lyn−/− peritoneal B cell subsets.
(A) Intracellular Erk phosphorylation in peritoneal B220+ B cells stimulated with anti-Igκ for 5 min. B1a (CD5+CD23-); B2 (CD5-CD23+). Histograms in (A) are representative of cells from n = 2 WT and Lyn−/− mice.
Figure 6—figure supplement 2
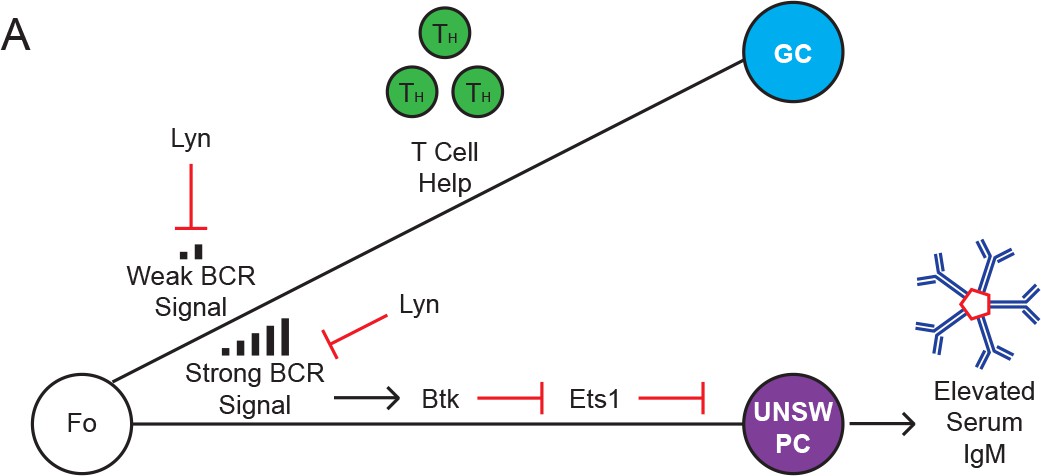
Lyn restrains unswitched plasma cell differentiation of follicular B cells.
(A) Model: Lyn restrains BCR signaling in Fo B cells. Loss of Lyn leads to Btk-dependent downregulation of Ets1 expression and consequent expansion of unswitched (IgM+) plasma cells.
Figure 7 with 2 supplements
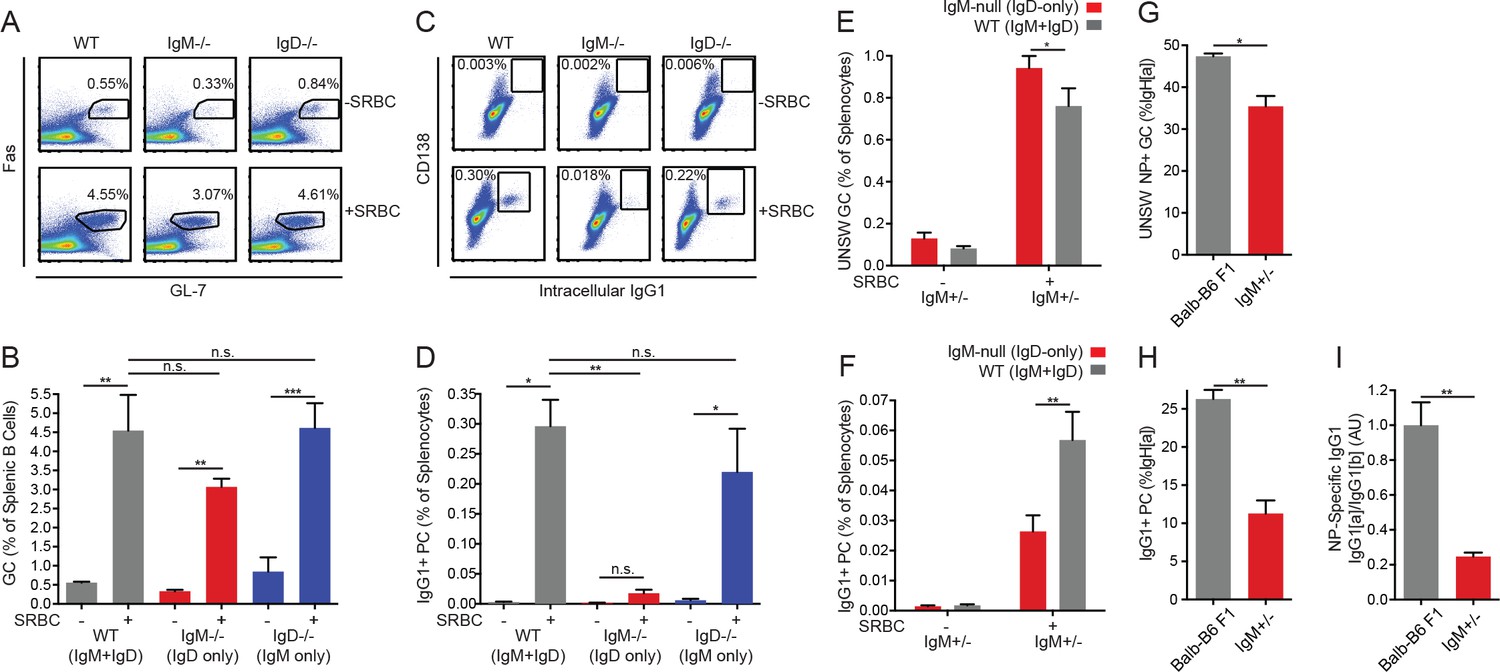
IgD-only cells have intact germinal center responses but impaired IgG1+ SLPC responses.
(A) Splenic (CD19+) B cells from WT, IgM−/−, and IgD−/− mice unimmunized or 5 days after i.p. immunization with 200 μL of 10% SRBCs. (B) Quantification of germinal center (Fashi GL-7hi) cells in (A). (C) Splenocytes from mice in (A). (D) Quantification of CD138+ IgG1+ plasma cells in (C). (E) WT (IgMb+) and IgM-null (IgDa+) germinal center B cells as a percentage of live splenocytes in unimmunized and IgM+/− mice 5 days after i.p. immunization with 200 μL of 10% SRBCs. (F) WT (IgG1b+) and IgM-null (IgG1a+) switched plasma cells (CD138 +IgG1+) as a percentage of live splenocytes in IgM+/− mice unimmunized or 5 days after i.p. immunization with 200 μL of 10% SRBCs. (G) Fraction of unswitched NP-specific germinal center cells (CD19+ Fashi GL-7hi IgM/IgD+) from the IgHa locus in the spleens of Balb/c-B6 F1 and IgM+/− mice 7–8 days after i.p. immunization with 100 μg NP-RSA. (H) Fraction of IgG1+CD138+ plasma cells from the IgHa locus in Balb/c-B6 F1 and IgM+/− mice 7–8 days after i.p. immunization with 100 μg NP-RSA. (I) NP-specific IgG1a and IgG1b titers at OD = 0.2 were calculated for the mice in (G–H) by ELISA. The IgG1a to IgG1b titer ratio was calculated for each mouse, and all ratios were normalized such that the average IgG1a/IgG1b ratio in Balb/c-B6 F1 samples = 1.0. For (A-D), statistics from n = 4 unimmunized mice of each genotype and n = 3 WT, n = 6 IgM−/−, and n = 7 IgD−/− immunized mice were pooled. For (E-F), n = 5 unimmunized and n = 5 immunized mice are shown. For (G-I), n = 5 Balb/c-B6 F1 mice and n = 3 IgM+/− mice are shown. One-way ANOVA with Tukey’s multiple comparisons test (B and D), a paired t test (E-F), and Welch’s t test (G-I) were used to calculate p values, and mean +SEM is displayed. *p<0.05, **p<0.01, ***p<0.001.
-
Figure 7—source data 1
Numerical data corresponding to germinal center and plasma cell responses in Figure 7B-I,Figure 7—figure supplement 1A–D
Numerical data corresponding to germinal center and plasma cell responses in Figure 7B-I, Figure 7—figure supplement 1A–B. Numerical data corresponding to unswitched plasma cell responses in Figure 7—figure supplement 1C–D.
- https://doi.org/10.7554/eLife.35074.038
Figure 7—figure supplement 1
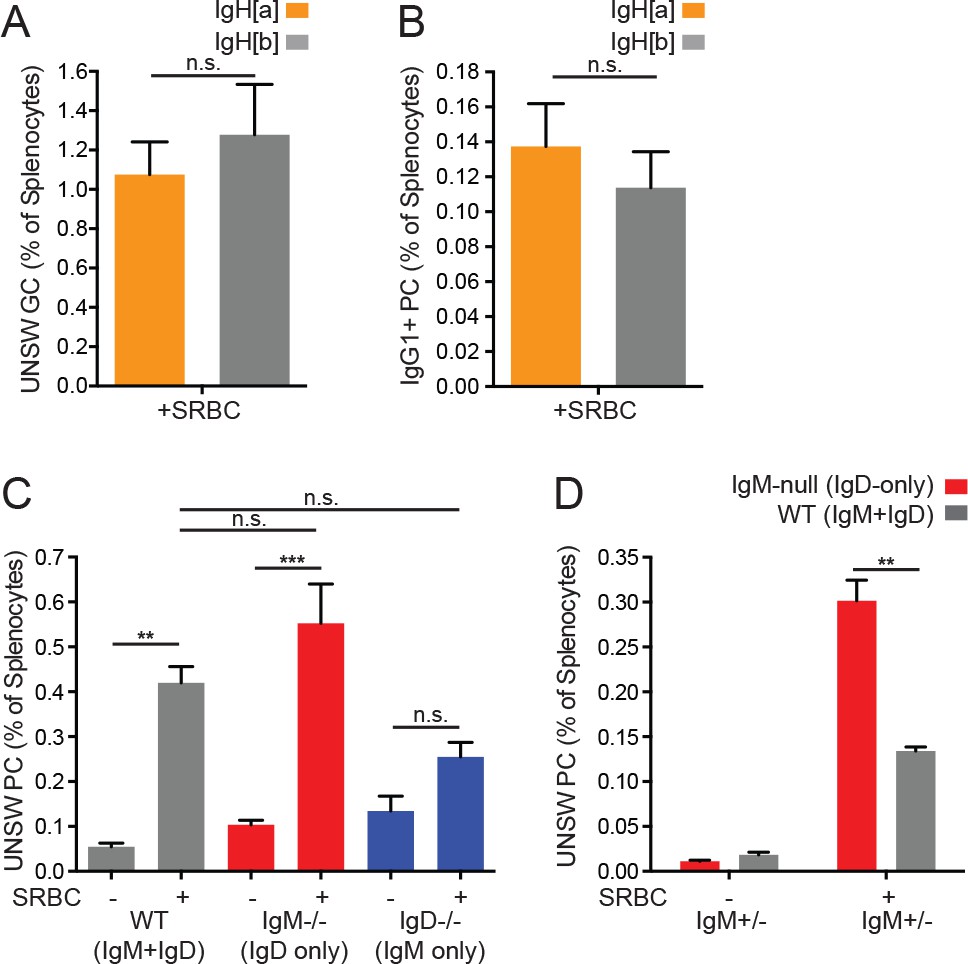
Role of BCR allotype and generation of unswitched plasma cells in SRBC-immunized mice.
(A) Quantification of IgMa+ and IgMb+ germinal center B cells (CD19+FashiGL-7hi) as a percentage of live splenocytes in IgHa/b mice 5 days after i.p. immunization with 200 μL of 10% SRBCs. (B) Quantification of IgMa+ and IgMb+ plasma cells (CD138+) as a percentage of live splenocytes in IgHa/b mice 5 days after i.p. immunization with 200 μL of 10% SRBCs. (C) Quantification of splenic unswitched (IgM +or IgD+) CD138+ plasma cells from WT, IgM−/−, and IgD−/− mice unimmunized or 5 days after i.p. immunization with 200 μL of 10% SRBCs. (D) WT (IgMb+) and IgM-null (IgDa+) unswitched plasma cells (CD138+) as a percentage of live splenocytes in IgM+/− mice unimmunized or 5 days after i.p. immunization with 200 μL of 10% SRBCs. For (A) and (B), n = 3 mice were analyzed. Paired t tests (A-B and D) and one-way ANOVA with Tukey’s multiple comparisons test were used to calculate p values, and mean +SEM is displayed. For (C), cell numbers from n = 4 umimmunized mice of each genotype and n = 3 WT, n = 6 IgM−/−, and n = 7 IgD−/− immunized mice were analyzed. For (D), n = 5 unimmunized and n = 5 immunized were analyzed. **p<0.01, ***p<0.001.
Figure 7—figure supplement 2
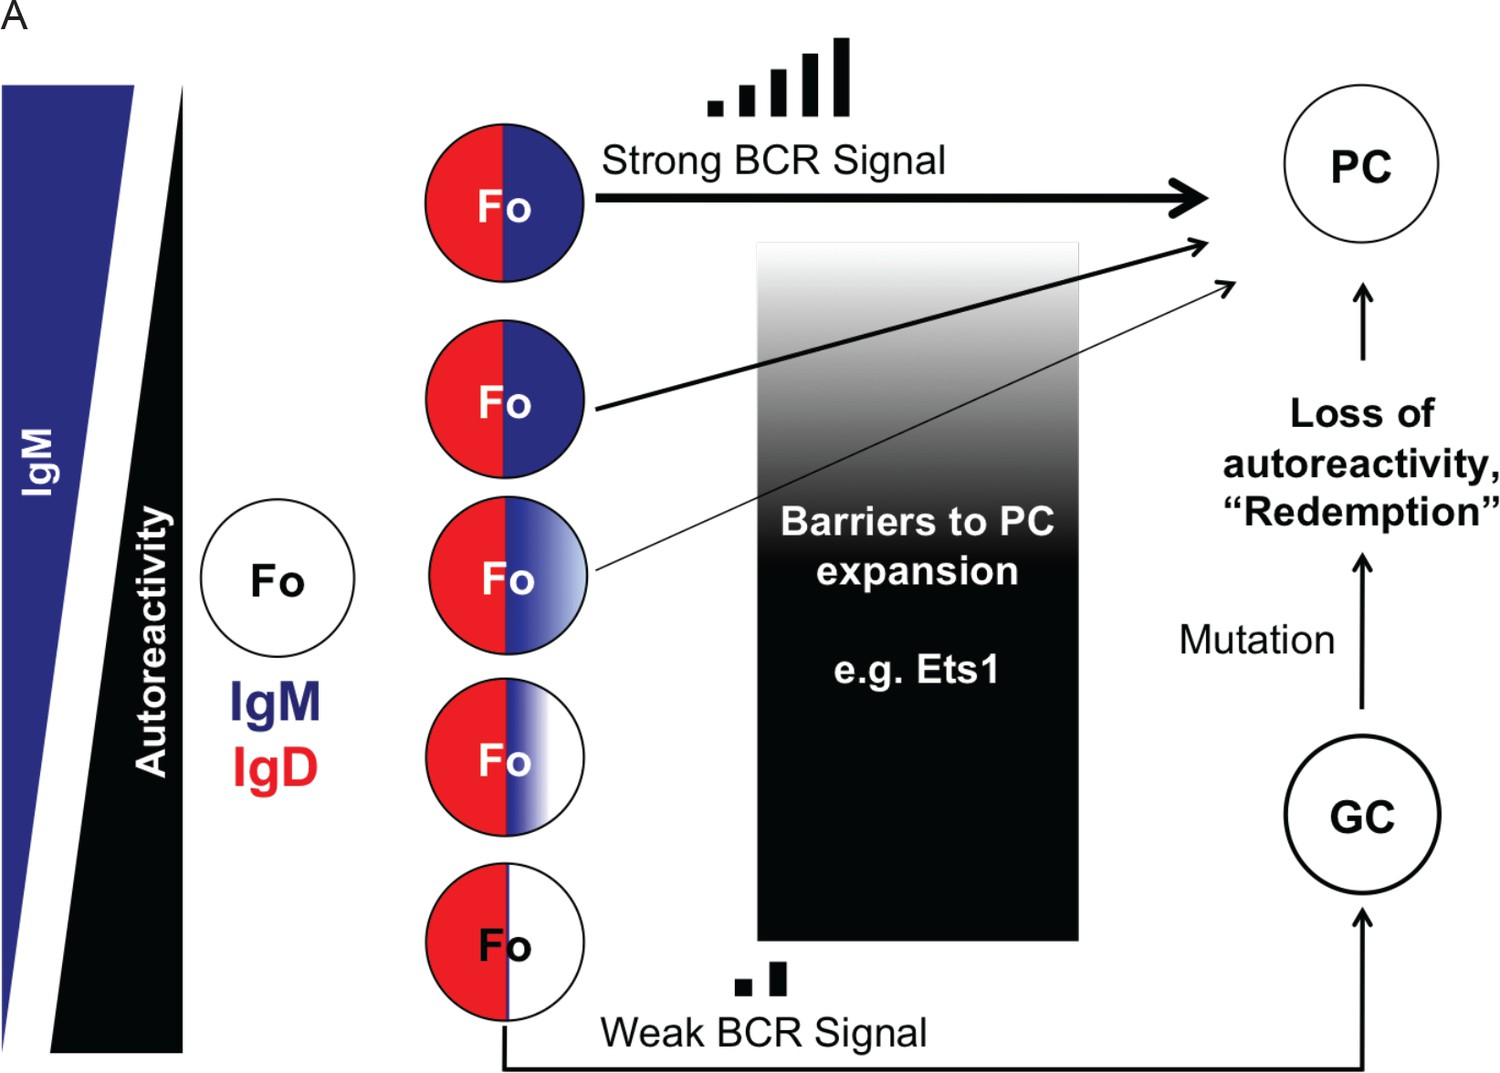
Role of IgM and IgD in regulating rapid antibody responses.
(A) Model: Control of peripheral B cell tolerance by IgM and IgD. Selective downregulation of IgM is a well-described feature of autoreactive B cells. This study demonstrates how loss of IgM could desensitize autoreactive B cells towards self-antigens. High and invariant IgD expression provides survival signals to allow these autoreactive cells to be maintained in the repertoire. Upon activation by foreign antigen, the least autoreactive cells receive strong signals through IgM and can quickly differentiate into plasma cells with little danger of autoimmunity. In contrast, the most autoreactive B cells are activated through IgD, which is less efficient at transducing signals in vivo. This weak signaling shunts IgDhi IgMlo cells into the germinal center where they can be ‘redeemed’ via somatic hypermutation, as proposed by Goodnow and colleagues. In this way, dual expression of IgM and IgD expression facilitates repertoire diversity and balances immune responsiveness with autoimmune potential.
Author response image 1

Antigen is necessary and sufficient for Nur77-eGFP expression in B cells; IgHEL-sHEL interaction drives higher Nur77-eGFP expression than the wild type BCR repertoire.
Panel (A) take from Manuscript Figure 1A. Panel (B) depicts quantification of mean Nur77-eGFP MFI -/- SEM in N=5 biological replicates.
Author response image 2

In vitro anti-IgM stimulation upregulates Nur77-eGFP expression in a stage-specific manner.
BM and splenic B cells from our Nur77-eGFP reporter mice (Zikherman et al., 2012) as well as independent reporter line (Moran et al. JEM 2011) were stimulated in vitro with media alone (shaded gray histogram) or 10μg/ml anti-IgM (solid black line) for 3 hours, and subsequently stained to detect subset markers as well as GFP.
Author response image 3
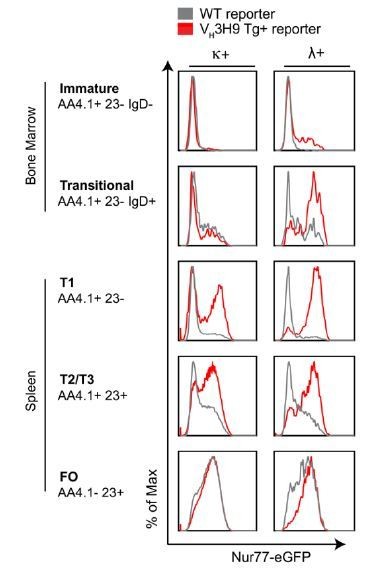
Self-reactive B cells upregulate Nur77-eGFP at early stages of B cell development.
Nur77-eGFP BAC Tg was crossed to the Vh3H9 HC site directed Tg. BM and splenic cells from these mice (red) and unrestricted repertoire reporter mice (gray) were harvested and stained ex vivo to identify B cell subsets as well as surface light chain expression. Histograms depicting GFP expression in K+ and L+ B cells subsets are representative of > 9 biological replicates.
Author response image 4
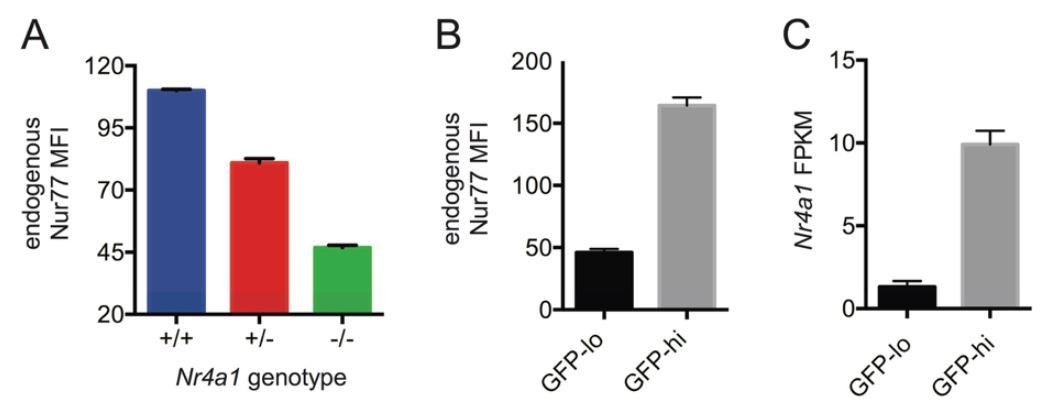
Endogenous Nr4a1 transcript and Nur77 protein correlate with Nur77-eGFP reporter expression in B cells.
(A) Intracellular staining of endogenous Nur77 protein in splenic B cells from Nr4a1+/+, -/-, and -/- mice. Graph depicts mean -/- SEM of N=3 mice / genotype. (B) Nur77-eGFP reporter B cells were stained to detect endogenous Nur77 protein intra-cellularly. Graph depicts mean MFI of endogenous Nur77 in splenic B cells with low or high GFP expression (15% lowest and 15% highest) -/- SEM of N=3 mice. (C) Mature naive reporter B cells were sorted for 3% highest and 3% lowest GFP expression and subjected to RNASeq. Graph depicts mean FPKM of Nr4a1 transcripts -/- SEM of N=3 biological replicates.
Author response image 5
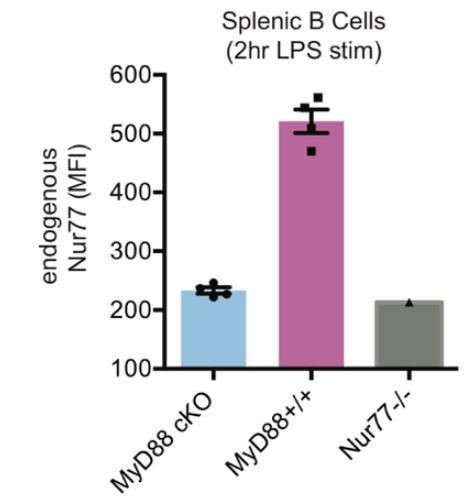
Efficient conditional deletion of MyD88 in MB1-Cre MyD88 fl/fl B cells (“MyD88 cKO”).
Splenocytes from MyD88 cKO or control mice were stimulated for 2 hours with LPS (333 ng/ml). Graph depicts mean MFI of Intracellular staining to detect Nur77 upregulation in splenic B cells -/- SEM in N=4 mice. Nur77-deficient mice are a staining control.
Author response image 6
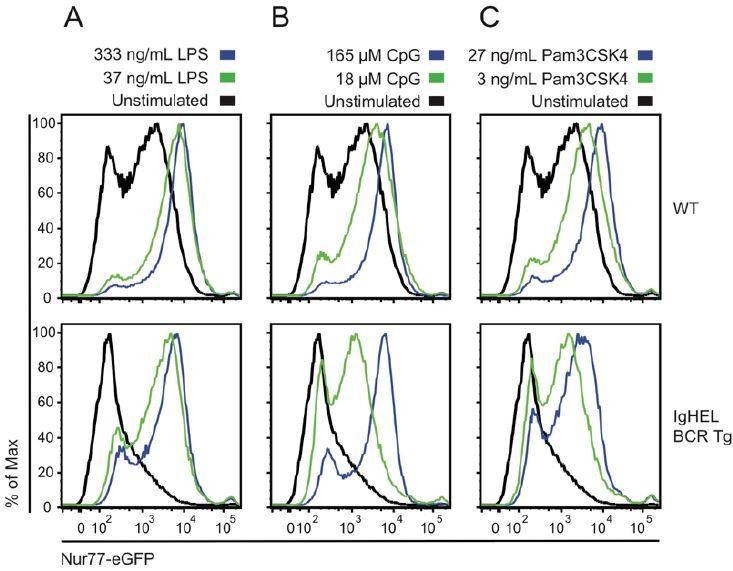
Naïve B cells are competent to upregulate Nur77-eGFP in response to canonical TLR ligands even in the absence of endogenous antigen.
Splenocytes from non-BCR Tg and IgHEL BCR Tg reporter mice were stimulated overnight with low and high doses of ligands for TLR4 / rp105 (A), TLR9 (B), and TLRs1/2 (C). Histograms depict GFP fluorescence in B220+ splenocytes. As previously reported, Nur77-eGFP expression is low in the absence of endogenous antigen (IgHEL BCR Tg), but these cells are nevertheless responsive to a broad range of TLR ligands.
Author response image 7
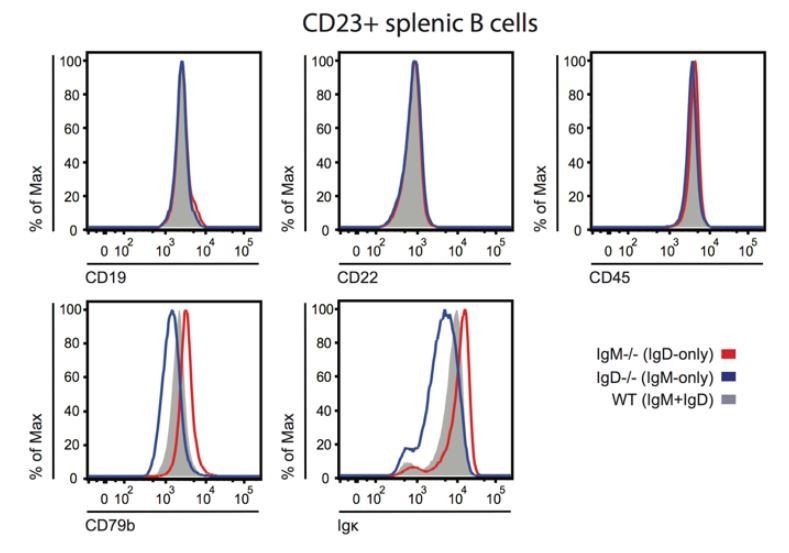
BCR, co-receptor and CD45 expression on IgM or IgD-deficient B cells.
Splenocytes from IgM-/-, IgD-/-, or WT ice were stained to detect surface expression of CD19, CD22, CD45, CD79b, and kappa light chain. Histograms depict CD23+ splenocyte gate. Differences in surface kappa expression between genotypes consistent with Figure 1D, Figure 1—figure supplement 2B, C.
Author response image 8
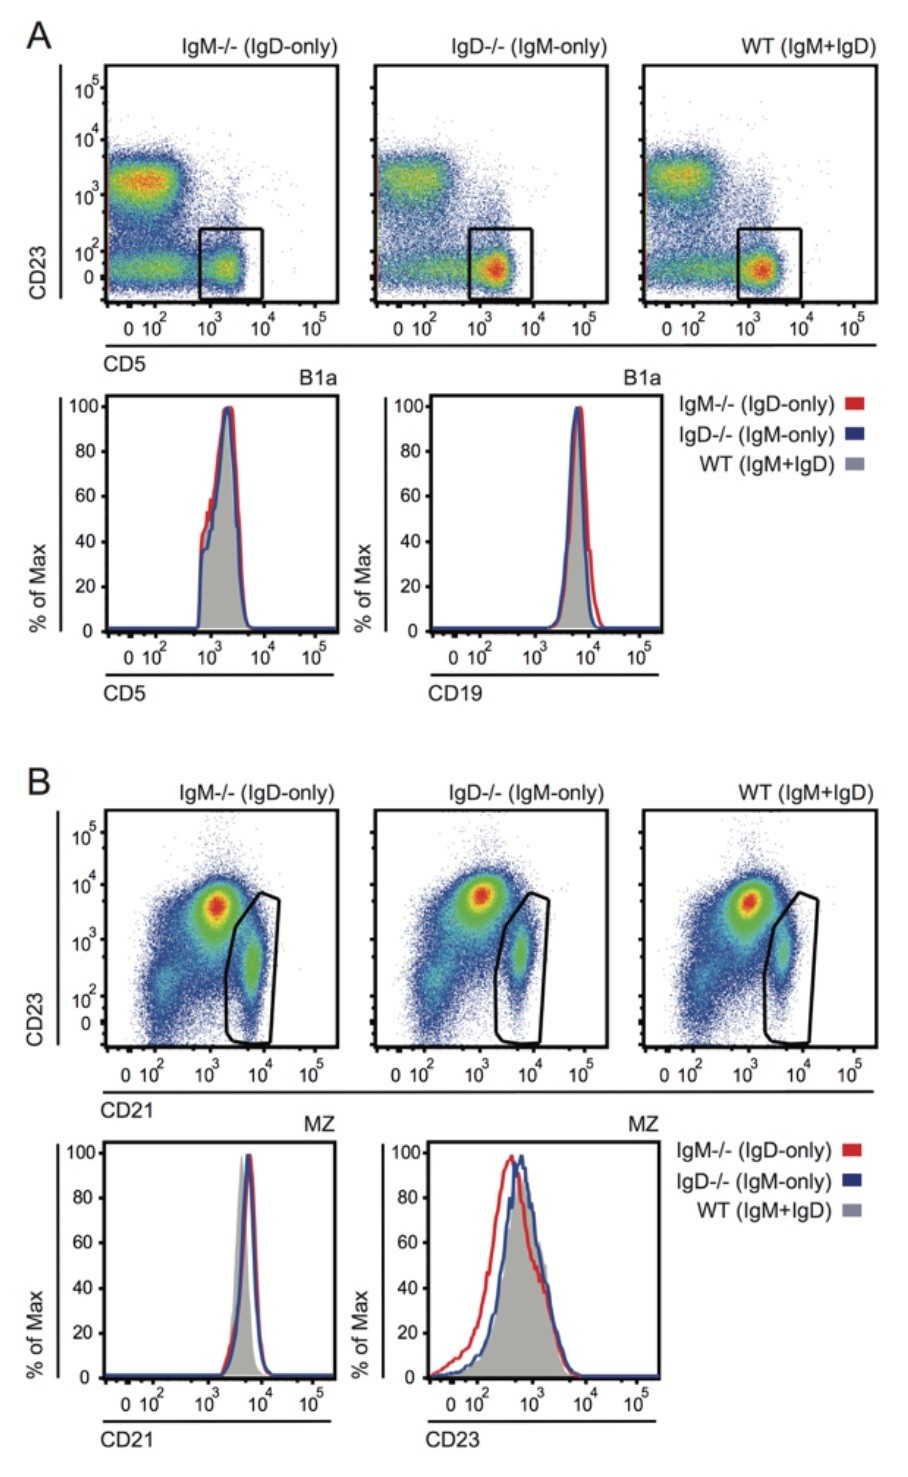
Grossly normal surface phenotype of B1a and MZ B cells in WT, IgM-/- and IgD-/- mice.
(A) Plots show CD19+ PerC cells gated to identify CD5+ B1a cells (reduced in IgM-/- as shown in Figure 4—figure supplement 1). Histograms depict CD5 and CD19 expression in B1a cells. (B) Plots show B220+ splenocytes gated to identify CD21hiCD23lo MZ B cells. Histograms depict CD21 and CD23 expression in MZ B cells.
Author response image 9
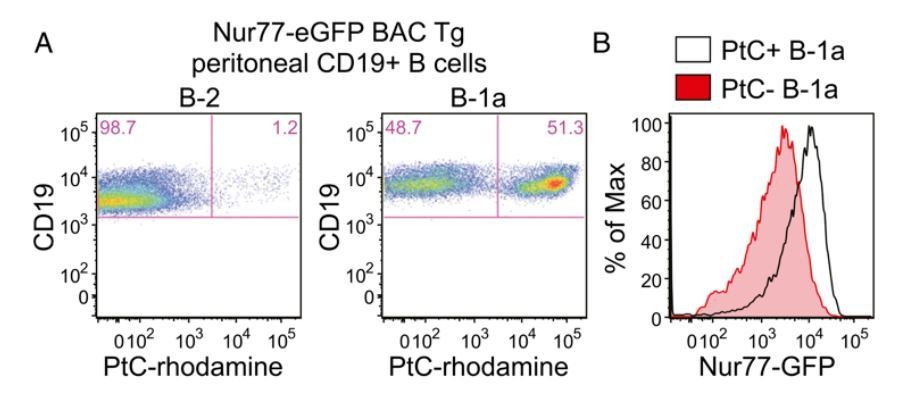
Nur77-eGFP expression identifies selfreactive PtC-specific B-1a cells in vivo.
(Figure 2A,B reproduced from Figure 2 of Huizar et al., 2017, Immunohorizons, published under the Creative Commons Attribution 4.0 International Public License (CC BY4.0; https://creativecommons.org/licenses/by/4.0/)). (A) PerC cells from Nur77-eGFP reporter mice were stained immediately ex vivo on ice with surfacemarkers and PtC-rhodamine liposomes to identify B cell subsets. Representativeplots show PtC+ cells in B-2 and B-1a PerC subsets. (B) Representative histogramsdepict GFPexpression in PtC+ and PtC- B-1a cells.
Author response image 10
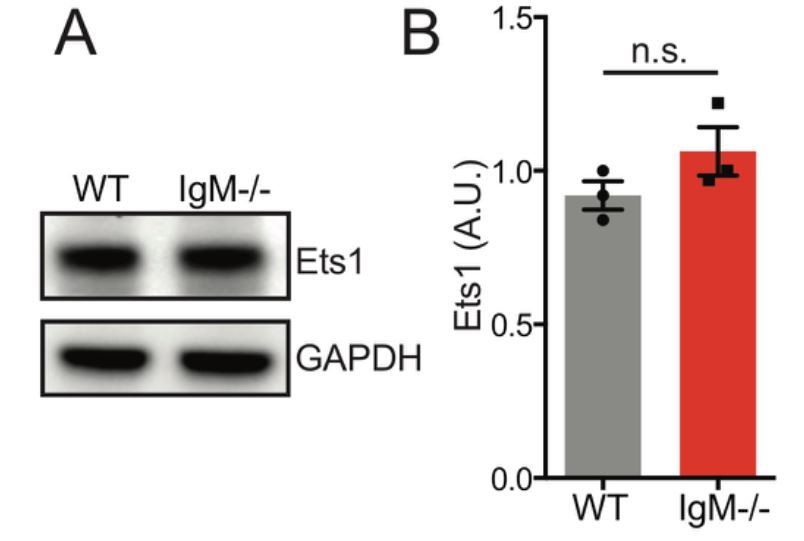
Ets1 protein expression is unaltered in splenic B cells the absence of IgD.
Representative western blot of splenic B cells probed for Ets1 on left. Graph depicts mean normalized protein expression -/- SEM of N=3 biological replicates.
Tables
Table 1
Nur77-eGFP is a specific reporter of antigen-dependent signaling in vivo.
https://doi.org/10.7554/eLife.35074.010| Conclusion | Stimulus/perturbation | Pathway | Readout | Cell type | References |
|---|---|---|---|---|---|
| Does not modulate Nur77 at steady state in vivo | CD40L-/- | CD40 | Nur77-eGFP | B cells | Manuscript Figure 1—figure supplement 1A |
| TLR7-/- | TLR7 | Nur77-eGFP | B cells | Manuscript Figure 1—figure supplement 1A | |
| Un93b13d/3d | TLR3/7/9 | Nur77-eGFP | B cells | Manuscript Figure 1—figure supplement 1A | |
| MyD88fl/fl MB1-Cre | MyD88 | Endog. Nur77 protein/transcript | PerC B1a cells/spleen | Manuscript Figure 1—figure supplement 1F,G | |
| Germ-free mice | MyD88/TRIF | Endog. Nur77 protein/transcript | Splenic B cells/spleen | Manuscript Figure 1—figure supplement 1D,E | |
| Const. act. STAT5 | Jak/Stat | Nur77-eGFP | Thymocytes | Moran et al. JEM 2011, Figure 8. | |
| Does not induce Nur77 in vitro | BAFF | BAFFR | Nur77-eGFP | B cells | Zikherman et al. (2012): Figure S1G |
| IL-4 | Jak/Stat | Nur77-eGFP | B cells | Manuscript Figure 1—figure supplement 1B | |
| IL-2, IL-15 | Jak/Stat | Nur77-eGFP | CD8 (IL-2, 15), CD4 (IL-2) | Au-Yeung et al. JI 2017, Figures S1A, 3C, 4A | |
| CXCL12/ SDF-1 | CXCR4 | Nur77-eGFP | B cells | Manuscript Figure 1—figure supplement 1C | |
| Induces Nur77 in vitro but does not require IgM or IgD specifically | LPS | TLR4, Rp150 | Nur77-eGFP | B cells | Zikherman et al. (2012): Figure S1G; Manuscript Figure 1—figure supplement 3A |
| CpG | TLR9 | Nur77-eGFP | B cells | Zikherman et al. (2012), Figure S1G; Manuscript Figure 1—figure supplement 3A | |
| Pam3CSK4 | TLR1/2 | Nur77-eGFP | B cells | Manuscript Figure 1—figure supplement 3A | |
| Anti-Igκ | BCR | Nur77-eGFP | B cells | Manuscript Figure 2F | |
| Modulates pathway at steady state in vivo | IgHEL Tg | Antigen/BCR | Nur77-eGFP | B cells | Zikherman et al. (2012), Figure 3B,C; Manuscript Figure 1A |
| IgHEL BCR Tg/sHEL Ag | Antigen/BCR | Nur77-eGFP | B cells | Zikherman et al. (2012), Figure 3B,C; Manuscript Figure 1A | |
| Lyn-/- | BCR via ITIMs | Nur77-eGFP | B cells | Manuscript Figure 5—figure supplement 3A | |
| CD45 allelic series | BCR via SFKs | Nur77-eGFP | B cells | Zikherman et al. (2012), Figure 3A,B |
Key resources table
| Reagent type (species) or resource | Designation | Source or reference | Identifiers | Additional information |
|---|---|---|---|---|
| Strain, strain background (Mus musculus) | C56BL/6 | The Jackson Laboratory; Taconic | JAX:000664; TAC:BCNTac | |
| Strain, strain background (M. musculus) | Balb/C | The Jackson Laboratory | JAX:000651 | |
| Strain, strain background (M. musculus) | Nur77-eGFP | MMRRC UC Davis | MMRRC:012015-UCD | Characterized in PMID:22902503 |
| Strain, strain background (M. musculus) | IgHEL | PMID:3261841 | MD-4 | |
| Strain, strain background (M. musculus) | sHEL | PMID:3261841 | ML-5 | |
| Strain, strain background (M. musculus) | IgM-/- | PMID:9655395 | ||
| Strain, strain background (M. musculus) | IgD-/- | PMID:8446604 | ||
| Strain, strain background (M. musculus) | CD40L-/- | PMID:7964465 | ||
| Strain, strain background (M. musculus) | Unc93b 3d/3d | PMID:16415873 | ||
| Strain, strain background (M. musculus) | TLR7-/- | PMID:15034168 | ||
| Strain, strain background (M. musculus) | BaffTg | MMRRC UC Davis | RRID:MMRRC_036508-UCD | Described in PMID:15972664 |
| Strain, strain background (M. musculus) | B6.IgHa | The Jackson Laboratory | JAX:001317 | B6.Cg-Gpi1a Thy1a Igha/J |
| Strain, strain background (M. musculus) | Lyn-/- | PMID:9252121 | ||
| Strain, strain background (M. musculus) | MB1-Cre | PMID:16940357 | ||
| Strain, strain background (M. musculus) | MyD88 fl/fl | PMCID:PMC2847796 | ||
| Strain, strain background (M. musculus) | Nr4a1-/- | PMID:7624775 | JAX:006187 | |
| Biological sample (Ovis aires) | Sheep Red Blood Cells | Rockland | R406-0050 | |
| Antibody | Anti-B220-A647 (rat monoclonal) | BD Pharmingen | 557683 | (1:200) |
| Antibody | Anti-B220-APC-e780 (rat monoclonal) | eBioscience | 47-0452-82 | (1:400) |
| Antibody | Anti-B220-FITC (rat monoclonal) | Tonbo | 35–0452 U100 | (1:200) |
| Antibody | Anti-B220-Pacific Blue (rat monoclonal) | Tonbo | 75–0452 U100 | (1:200) |
| Antibody | Anti-B220-PE (rat monoclonal) | BD Pharmingen | 553090 | (1:200) |
| Antibody | Anti-B220-PE-Cy7 (rat monoclonal) | BD Pharmingen | 552772 | (1:200) |
| Antibody | Anti-B220-PerCP-Cy5.5 (rat monoclonal) | Tonbo | 65–0452 U100 | (1:200) |
| Antibody | Anti-CD5-APC (rat monoclonal) | Tonbo | 20–0051 U100 | (1:100) |
| Antibody | Anti-CD19-PE-Cy7 (rat monoclonal) | Biolegend | 115520 | (1:150) |
| Antibody | Anti-CD19-PerCP-Cy5.5 (rat monoclonal) | BD Pharmingen | 551001 | (1:150) |
| Antibody | Anti-CD21-A647 (rat monoclonal) | Biolegend | 123424 | (1:100) |
| Antibody | Anti-CD21-Pacific Blue (rat monoclonal) | Biolegend | 123414 | (1:100) |
| Antibody | Anti-CD23-A647 (rat monoclonal) | Biolegend | 101612 | (1:200) |
| Antibody | Anti-CD23-FITC (rat monoclonal) | BD Pharmingen | 553138 | (1:200) |
| Antibody | Anti-CD23-Pacific Blue (rat monoclonal) | Biolegend | 101616 | (1:100) |
| Antibody | Anti-CD23-PE (rat monoclonal) | BD Pharmingen | 553139 | (1:200) |
| Antibody | Anti-CD23-PE-Cy7 (rat monoclonal) | eBioscience | 25-0232-82 | (1:200) |
| Antibody | Anti-CD69-APC (hamster monoclonal) | Biolegend | 104514 | (1:100) |
| Antibody | Anti-CD69-PE-Cy7 (hamster monoclonal) | Tonbo | 60–0691 U100 | (1:100) |
| Antibody | Anti-CD86-Pacific Blue (rat monoclonal) | Biolegend | 105022 | (1:100) |
| Antibody | Anti-CD93 (AA4.1)-PE-Cy7 (rat monoclonal) | Biolegend | 136506 | (1:100 |
| Antibody | Anti-CD138-PE (rat monoclonal) | Biolegend | 142504 | (1:100) |
| Antibody | Anti-CD138-PE-Cy7 (rat monoclonal) | Biolegend | 142513 | (1:100) |
| Antibody | Anti-CXCR4-Biotin (rat monoclonal) | BD Pharmingen | 551968 | (1:100) |
| Antibody | Anti-ETS1 (rabbit monoclonal) | Epitomics; abcam | EPI:3123–1; AB:109212 | (1:10,000); concentrated lot from L.A. Garrett-Sinha |
| Antibody | Anti-Fas-PE-Cy7 (hamster monoclonal) | BD Pharmingen | 557653 | (1:200) |
| Antibody | Anti-GAPDH (mouse monoclonal) | EMD Millipore | AB2302 | (1:2000) |
| Antibody | GL-7-A647 (rat monoclonal) | BD Biosciences | 561529 | (1:400) |
| Antibody | Anti-IgA-Biotin (rat monoclonal) | Biolegend | 407003 | (1:400) |
| Antibody | Anti-IgD (goat polyclonal serum) | MD Biosciences | 2057001 | (1:50-1:400) |
| Antibody | Anti-IgD[a]-Biotin (mouse monoclonal) | BD Pharmingen | 553506 | (1:300) |
| Antibody | Anti-IgD-APC-e780 (rat monoclonal) | eBioscience | 47-5993-80 | (1:500) |
| Antibody | Anti-IgD-HRP (rat monoclonal) | American Research Products | 09-1008-4 | (1:2000) |
| Antibody | Anti-IgD-Pacific Blue (rat monoclonal) | Biolegend | 405712 | (1:300) |
| Antibody | Anti-IgD-PE (rat monoclonal) | eBioscience | 12-5993-82 | (1:800) |
| Antibody | Anti-IgG1[a]-Biotin (mouse monoclonal) | BD Pharmingen | 553500 | (1:300) |
| Antibody | Anti-IgG1[b]-Biotin (mouse monoclonal) | BD Pharmingen | 553533 | (1:300) |
| Antibody | Anti-IgG2a[a]-Biotin (mouse monoclonal) | BD Biosciences | 553502 | (1:1000) |
| Antibody | Anti-IgG2a[b]-Biotin (mouse monoclonal) | BD Biosciences | 553504 | (1:1000) |
| Antibody | Anti-IgG2c-Biotin (goat polyclonal) | SouthernBiotech | 1079–08 | (1:1000) |
| Antibody | Anti-Igκ (goat polyclonal) | SouthernBiotech | 1050–01 | 1–20 μg/mL |
| Antibody | Anti-Igκ-F(ab')2 (goat polyclonal) | SouthernBiotech | 1052–01 | 1–20 μg/mL |
| Antibody | Anti-Igκ-FITC (goat polyclonal) | SouthernBiotech | 1050–02 | (1:300) |
| Antibody | Anti-Igκ-FITC (rat monoclonal) | BD Pharmingen | 550003 | (1:300) |
| Antibody | Anti-Igk-PerCP-Cy5.5 (rat monoclonal) | BD Pharmingen | 560668 | (1:300) |
| Antibody | Anti-Igλ-FITC (rat monoclonal) | BD Pharmingen | 553434 | (1:300) |
| Antibody | Anti-Igλ-PE (rat monoclonal) | Biolegend | 407307 | (1:300) |
| Antibody | Anti-IgM-F(ab')2 (goat polyclonal) | Jackson ImmunoResearch | 115-006-020 | 1–20 μg/mL |
| Antibody | Anti-IgM-HRP (goat polyclonal) | SouthernBiotech | 1020–05 | (1:2000); secondary for ELISA |
| Antibody | Anti-IgM[a]-Biotin (mouse monoclonal) | Biolegend | 408603 | (1:100) |
| Antibody | Anti-IgM[a]-FITC (mouse monoclonal) | Biolegend | 408606 | (1:100); (1:400) for plasma cell |
| Antibody | Anti-IgM[a]-PE (mouse monoclonal) | BD Pharmingen | 553517 | (1:100); (1:400) for plasma cell |
| Antibody | Anti-IgM[b]-Biotin (mouse monoclonal) | Biolegend | 406204 | (1:100) |
| Antibody | Anti-IgM[b]-PE (mouse monoclonal) | Biolegend | 406208 | (1:100); (1:400) for plasma cell |
| Antibody | Anti-IgM-APC (rat monoclonal) | eBioscience | 17-5790-82 | (1:100) |
| Antibody | Anti-MHC-2-APC (rat monoclonal) | Tonbo | 20–5321 U100 | (1:1000) |
| Antibody | Anti-Mouse-IgG(H + L)-HRP (goat polyclonal) | SouthernBiotech | 1031–05 | (1:5000); secondary for western blots |
| Antibody | Anti-Nur77-PE (mouse monoclonal) | eBioscience | 12-5965-80 | (1:100) |
| Antibody | Anti-pERK (rabbit monoclonal) | Cell Signaling Technology | 4377S | (1:80) |
| Antibody | Anti-pS6 (rabbit monoclonal) | Cell Signaling Technology | 4856S | (1:100) |
| Antibody | Anti-Rabbit-IgG-APC (donkey polyclonal) | Jackson ImmunoResearch | 711-136-152 | (1:100); secondary for pERK/pS6 |
| Antibody | Anti-Rabbit-IgG(H + L)-HRP (goat polyclonal) | SouthernBiotech | 4050–05 | (1:5000); secondary for western blots |
| Sequence-based reagent | Nr4a1 forward primer | Elim Biopharm | gcctagcactgccaaattg | |
| Sequence-based reagent | Nr4a1 reverse primer | Elim Biopharm | ggaaccagagagcaagtcat | |
| Sequence-based reagent | GAPDH forward primer | Elim Biopharm | aggtcggtgtgaacggatttg | |
| Sequence-based reagent | GAPDH reverse primer | Elim Biopharm | tgtagaccatgtagttgaggtca | |
| Peptide, recombinant protein | NP-RSA | Biosearch | N-5054–100 | Conj. ratio: 10 |
| Peptide, recombinant protein | NP-BSA | Biosearch | N-5050H-100 | Conj. ratio: 23 |
| Peptide, recombinant protein | Streptavidin-HRP | SouthernBiotech | 7100–05 | (1:5000) |
| Peptide, recombinant protein | Streptavidin-APC | Tonbo | 20–4317 U500 | (1:100-1:400) |
| Peptide, recombinant protein | Streptavidin-Pacific Blue | Life Technologies | S11222 | (1:200) |
| Peptide, recombinant protein | Streptavidin-PerCP-Cy5.5 | BD Pharmingen | 551419 | (1:400) |
| Peptide, recombinant protein | Streptavidin-FITC | Biolegend | 405202 | (1:100-1:200) |
| Peptide, recombinant protein | CXCL12 | Peprotech | 300-28A | |
| Peptide, recombinant protein | NP-PE | Biosearch | N-5070–1 | (1:400) |
| Chemical compound, drug | Poly-L-Lysine | Sigma | P2636-100MG | 100 μg/mL in 0.1 M Tris-HCl pH7.3 |
| Chemical compound, drug | Poly dA-dT | Sigma | P0883-50UN | 0.2 U/mL in 0.1 M Tris-HCl pH7.3 |
| Chemical compound, drug | LPS | Sigma | L8274 | |
| Chemical compound, drug | CpG | InvivoGen | tlrl-1826b | |
| Chemical compound, drug | Pam3CSK4 | InvivoGen | tlrl-pms | |
| Commercial assay, kit | Indo-1, AM | Life Technologies | I-1223 | (1:1000) |
| Commercial assay, kit | Live/Dead Fixable Near-IR Dead Cell Stain Kit | Invitrogen | L10119 | (1:1000) |
| Commercial assay, kit | ECL Luminol; Oxidizer Reagents | Perkin Elmer | 0RT2751; 0RT2651 | |
| Commercial assay, kit | 3,3',5,5'-Tetramethylbenzidine, Slow Kinetic Form | Sigma | T4319-100ML | ELISA substrate |
| Software, algorithm | FlowJo | FlowJo LLC | Version 9.9.4 | |
| Software, algorithm | Prism | GraphPad | Version 7.0b | |
| Software, algorithm | Canopy | Enthought | Version 1.4.1.1975 | |
| Software, algorithm | Binning program in Figure 1F | Other | Source code provided in this publication | |
| Other | BD Microtainer Capillary Blood Collector | Fisher | 365967 | |
| Other | PtC-Rhodamine (DOPC/CHOL Liposomes) | FormuMax | F60103F-R | (1:1000); used in PtC-specific B1a staining |
| Other | NuPAGE 4–12% Bis-Tris Protein Gels | Invitrogen | NP0335BOX | |
| Other | Immobilon-P PVDF Membrane | EMD Millipore | IPVH00010 | |
| Other | Assay Plate, 96 Well, No Lid, Vinyl | Costar | 2595 | Used for ELISA |
Additional files
-
Transparent reporting form
- https://doi.org/10.7554/eLife.35074.039
Download links
A two-part list of links to download the article, or parts of the article, in various formats.
Downloads (link to download the article as PDF)
Open citations (links to open the citations from this article in various online reference manager services)
Cite this article (links to download the citations from this article in formats compatible with various reference manager tools)
IgM and IgD B cell receptors differentially respond to endogenous antigens and control B cell fate
eLife 7:e35074.
https://doi.org/10.7554/eLife.35074


