Changes in global and thalamic brain connectivity in LSD-induced altered states of consciousness are attributable to the 5-HT2A receptor
- University Hospital for Psychiatry Zurich, Switzerland
- Yale University School of Medicine, United States
- Yale University, United States
- University of Ljubljana, Slovenia
Figures
Figure 1 with 3 supplements
Effect of drug condition on global brain connectivity and subjective drug effects.
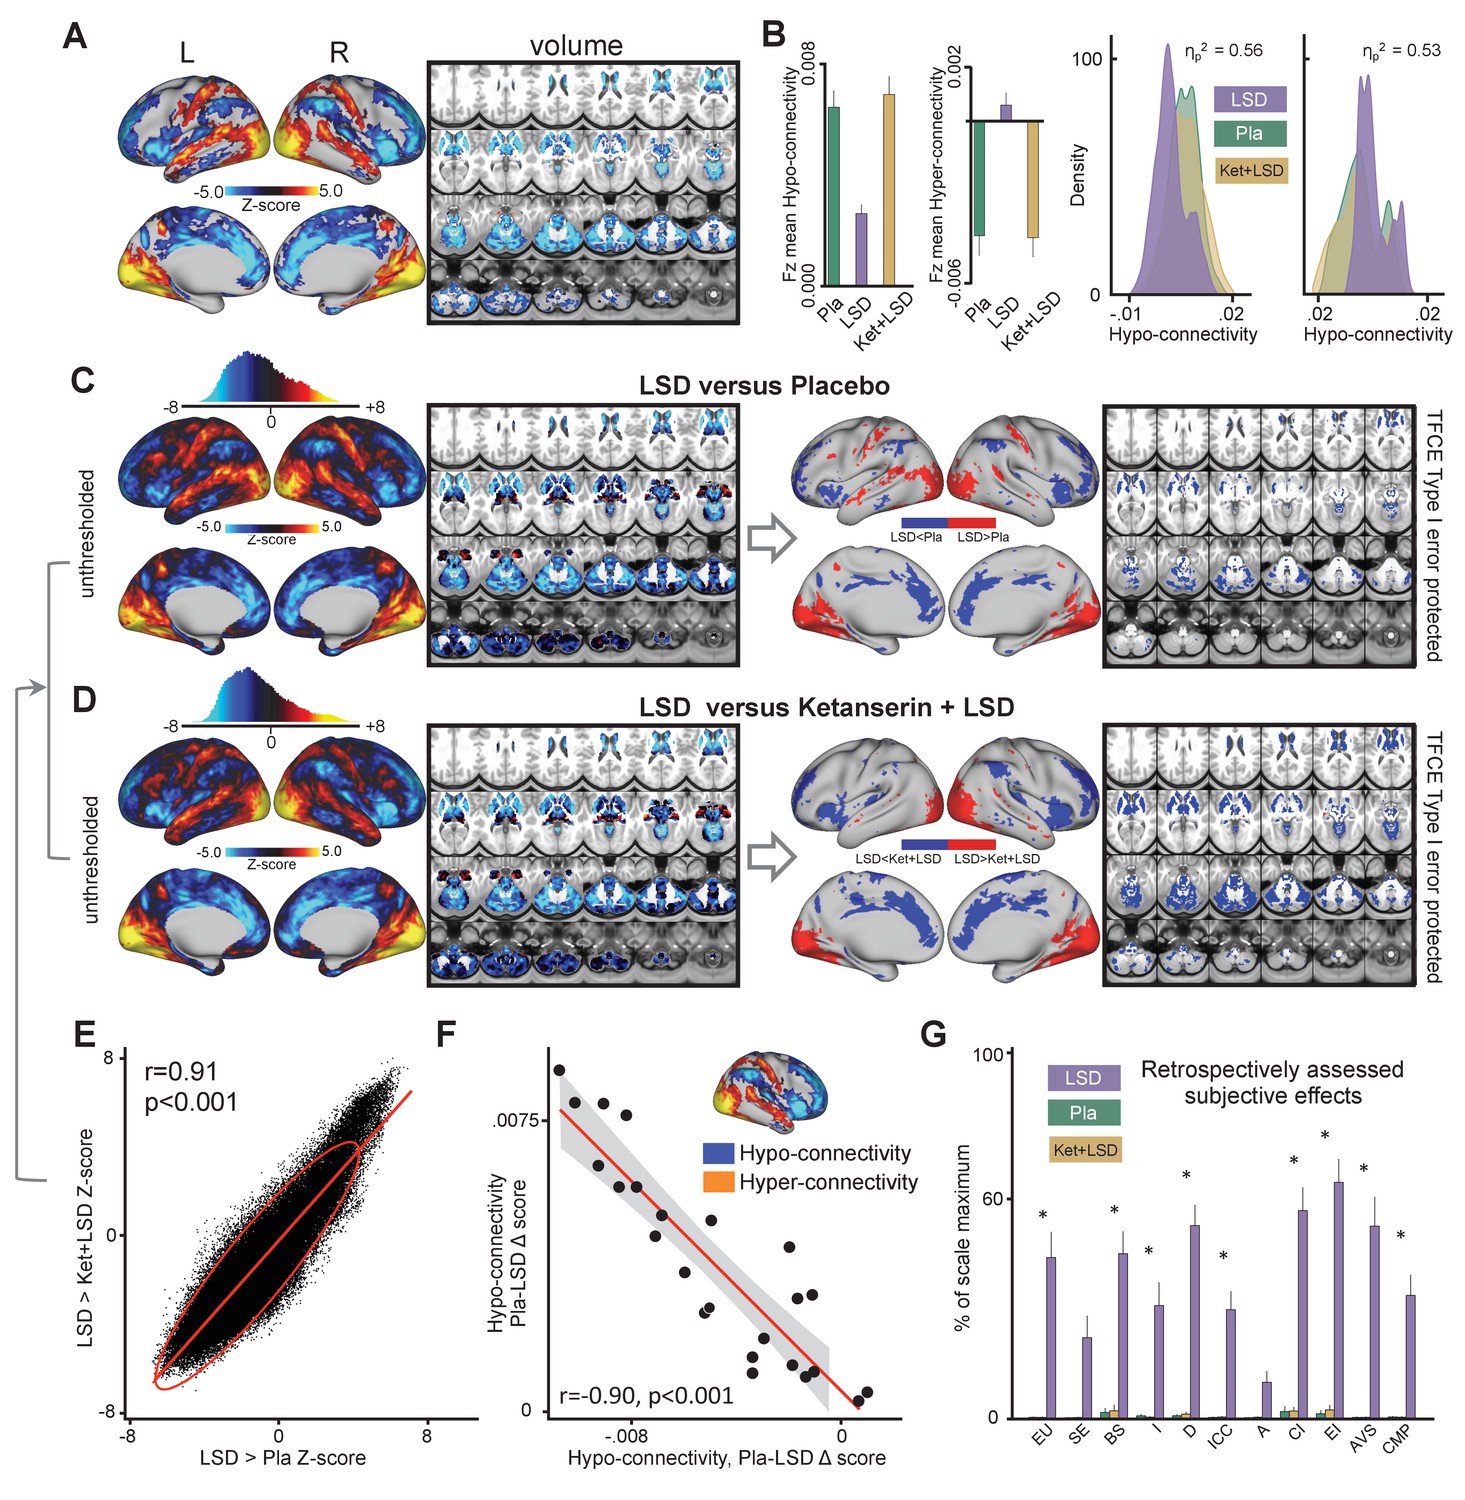
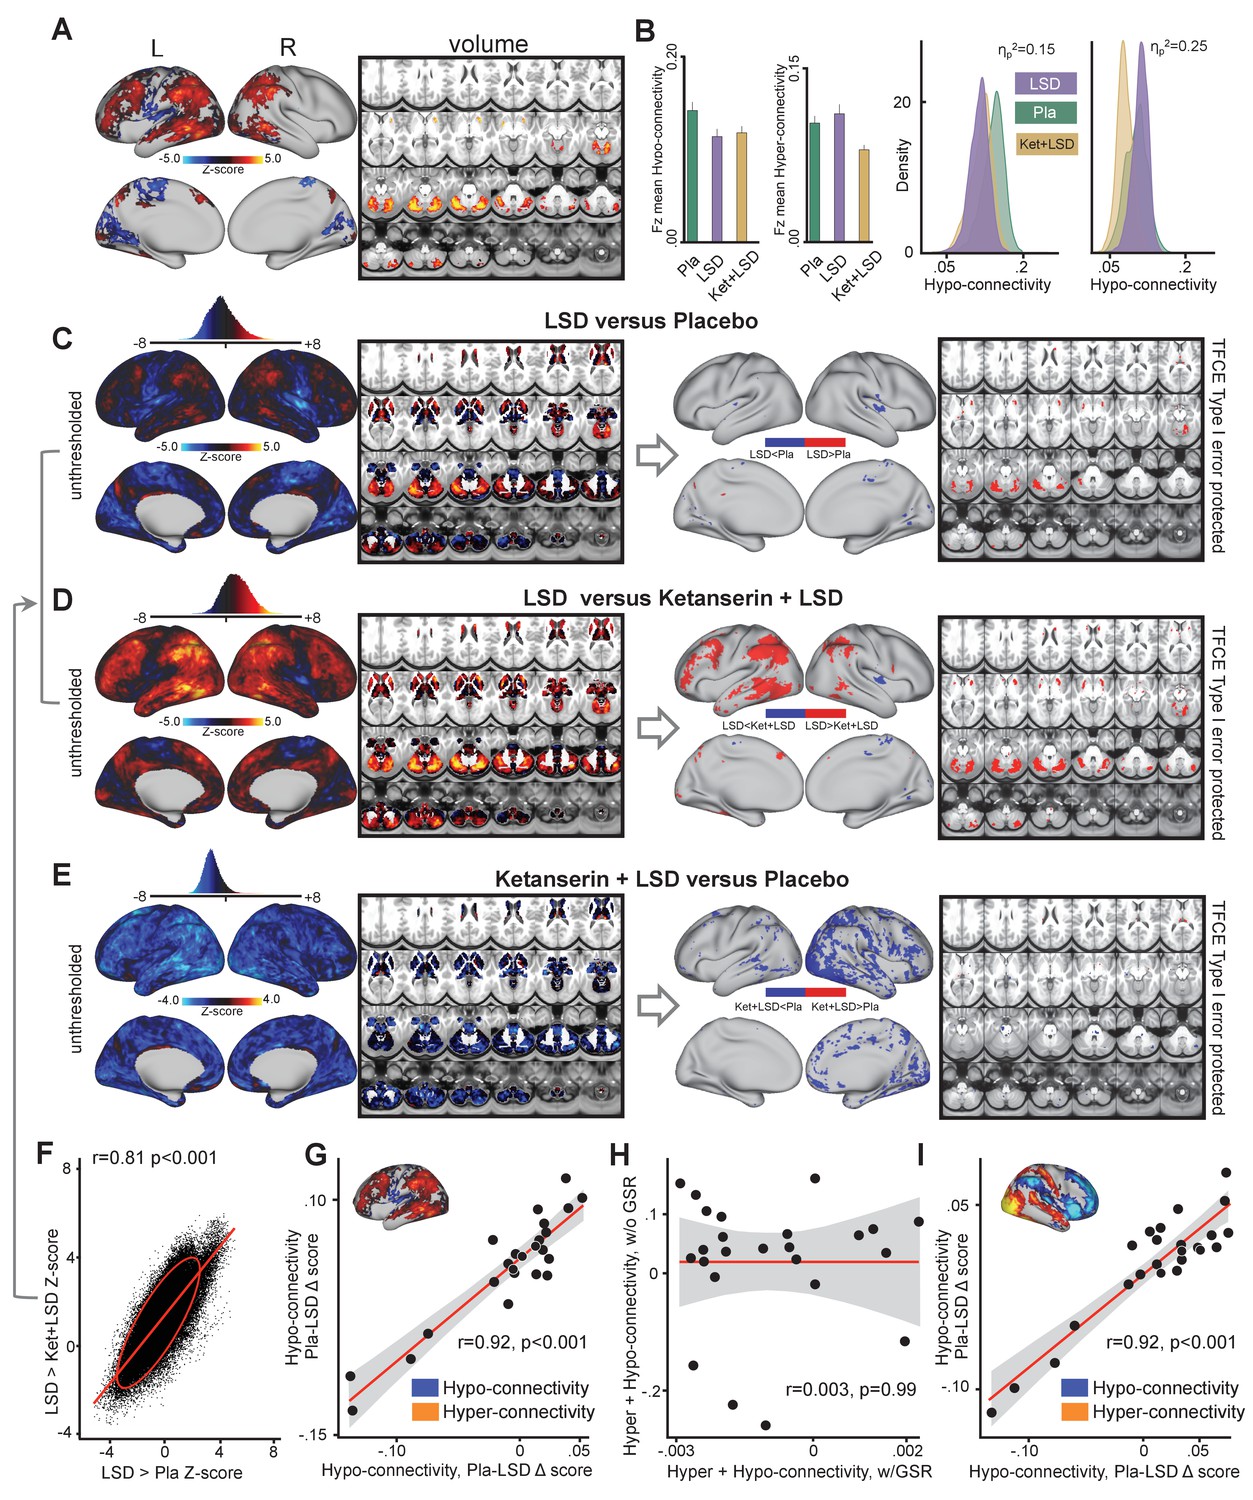
(A) Z-score map for the effect of LSD condition vs. (Ket+LSD)+Pla condition within areas showing a significant main effect of drug (TFCE type I error protected). Red/orange areas indicate regions where participants exhibited stronger GBC in the LDS condition, whereas blue areas indicate regions where participants exhibited reduced GBC condition, compared with (Ket+LSD)+Pla conditions. (B) Bar plots show mean connectivity strength (Fz) values for hyper- and hypo-connected areas averaged across grayordinates showing a significant main effect of drug. Distribution plots show distribution of Fz values within grayordinates showing significant hyper- and hypo-connectivity for LSD compared to (Ket+LSD)+Pla conditions. (C) Right panel displays significant (TFCE type I error protected) areas showing increased (red) and decreased (blue) GBC in the LSD condition compared to Pla. Left panel shows the corresponding unthresholded Z-score map. Red/orange areas indicate regions where participants exhibited stronger GBC in the LSD condition, whereas blue areas indicate regions where participants exhibited reduced GBC in the LSD condition, compared with Pla condition. The histogram above the map shows the distribution of Z-scores. (D) Right panel displays significant (TFCE type I error protected) areas showing increased (red) and decreased (blue) GBC in the LSD condition compared to Ket+LSD. Left panel shows the corresponding unthresholded Z-score map. Red/orange areas indicate regions where participants exhibited stronger GBC in the LSD condition, whereas blue areas indicate regions where participants exhibited reduced GBC in the LSD condition, compared with Ket+LSD condition. The histogram above the map shows the distribution of Z-scores. (E) Scatterplot showing a positive relationship between drug condition differences in GBC. Plotted are Z-scores for all grayordinates for the LSD>Placebo comparison (see panel C, X-axis) and LSD >Ket+LSD comparison (see panel D, Y-axis). Ellipse marks the 95% confidence interval. (F) Scatterplot showing significant negative relationship evident between averaged hyper- and hypo- connected grayordinates (based on the LSD vs. (Ket+LSD)+Pla contrast, see Figure 1A and inlet) across subjects (black data points) for Pla–LSD condition change scores. Grey background indicates the 95% confidence interval. (G) Retrospectively assessed (720 min after second drug administration) subjective drug-induced effects. Effects were assessed with the Five Dimension Altered States of Consciousness Questionnaire. EU: Experience of Unity; SE: Spiritual Experience; BS: Blissful State; I: Insightfulness; D: Disembodiment; ICC: Impaired Control and Cognition; A: Anxiety; CI: Complex Imagery; EI: Elementary Imagery; AVS: Audio-Visual Synesthesia; CMP: Changed Meaning of Percepts. N = 24. * indicates significant difference between LSD and Pla, and LSD and Ket+LSD drug conditions, p<0.05, Bonferroni corrected.
Figure 1—figure supplement 1
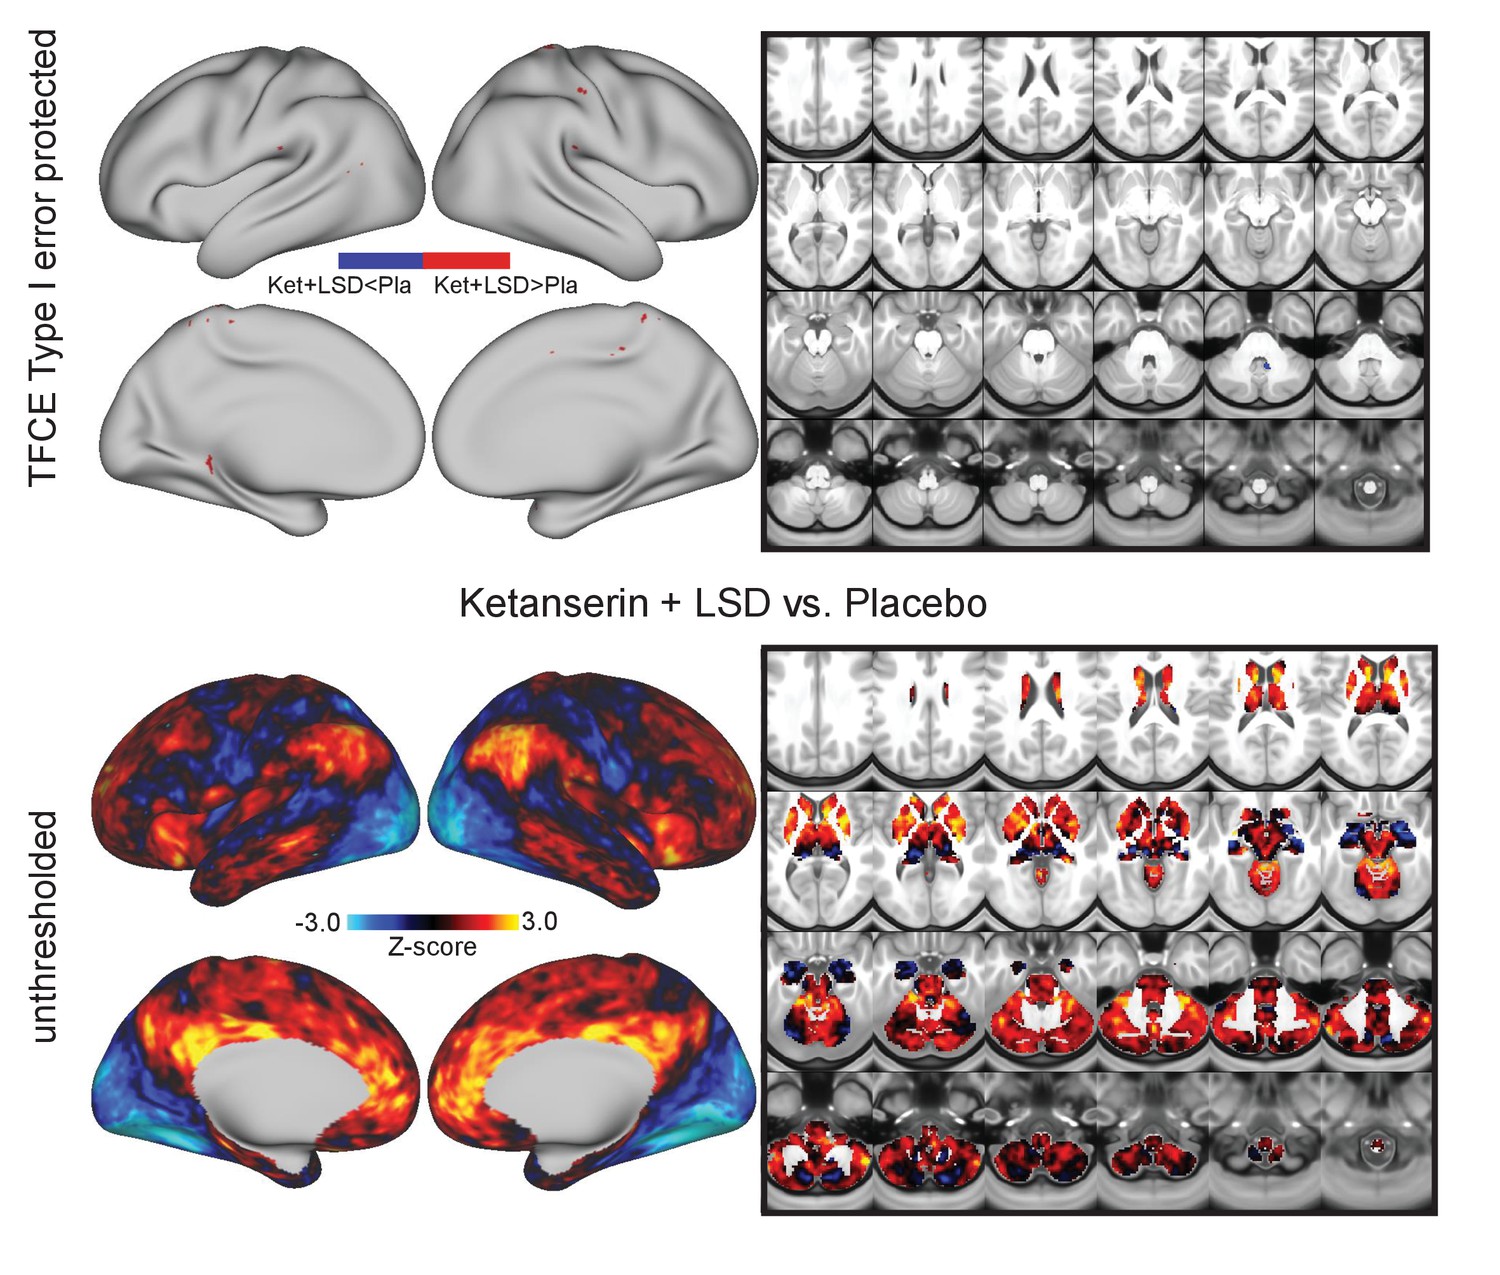
Effect of Ket+LSD vs. Pla on global brain connectitiy.
Top panel displays significant (TFCE type I error protected) areas showing increased (red) and decreased (blue) GBC in the Ket+LSD condition compared to Pla, which were trivial. Lower panel shows the corresponding unthresholded Z-score map. Red/orange areas indicate regions where participants exhibited stronger GBC in the Ket+LSD condition, whereas blue areas indicate regions where participants exhibited reduced GBC in the Ket+LSD condition, compared with the Pla condition.
Figure 1—figure supplement 2
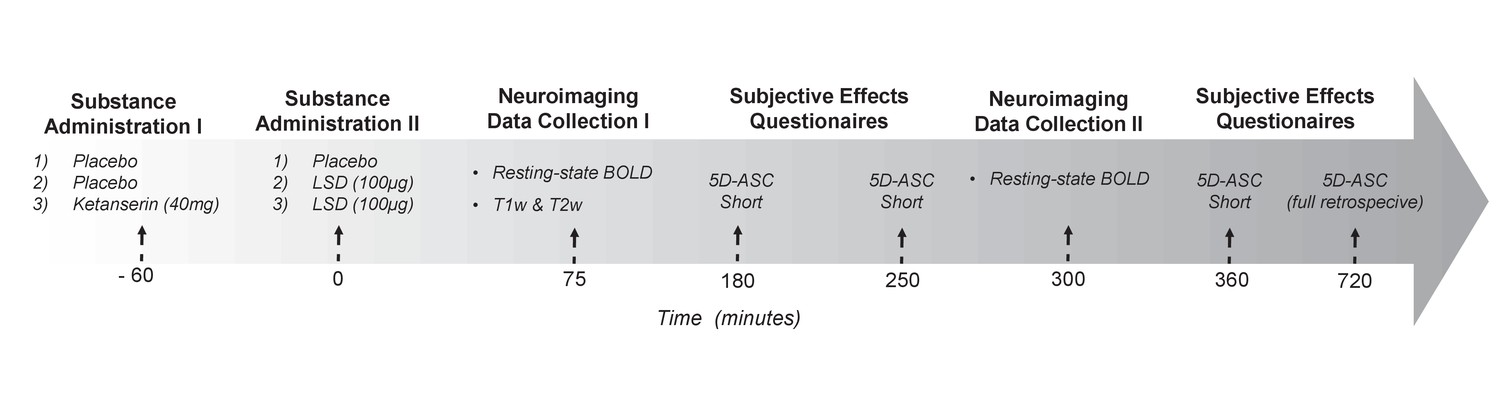
Study Design.
The study employed a fully double-blind, randomized, within-subject cross-over design. 25 total participants received either: (1) placebo +placebo (Pla) condition: placebo (179 mg Mannitol and Aerosil 1 mg po) after pretreatment with placebo (179 mg Mannitol and Aerosil 1 mg po); (2) Pla+LSD (LSD) condition: LSD (100 µg po) after pretreatment with placebo (179 mg Mannitol and Aerosil 1 mg po), or (3) Ketanserin+LSD (Ket+LSD) condition: LSD (100 µg po) after pretreatment with the 5-HT2A antagonist Ket (40 mg po) in a randomized balanced order at three different occasions two weeks apart.
Figure 1—figure supplement 3
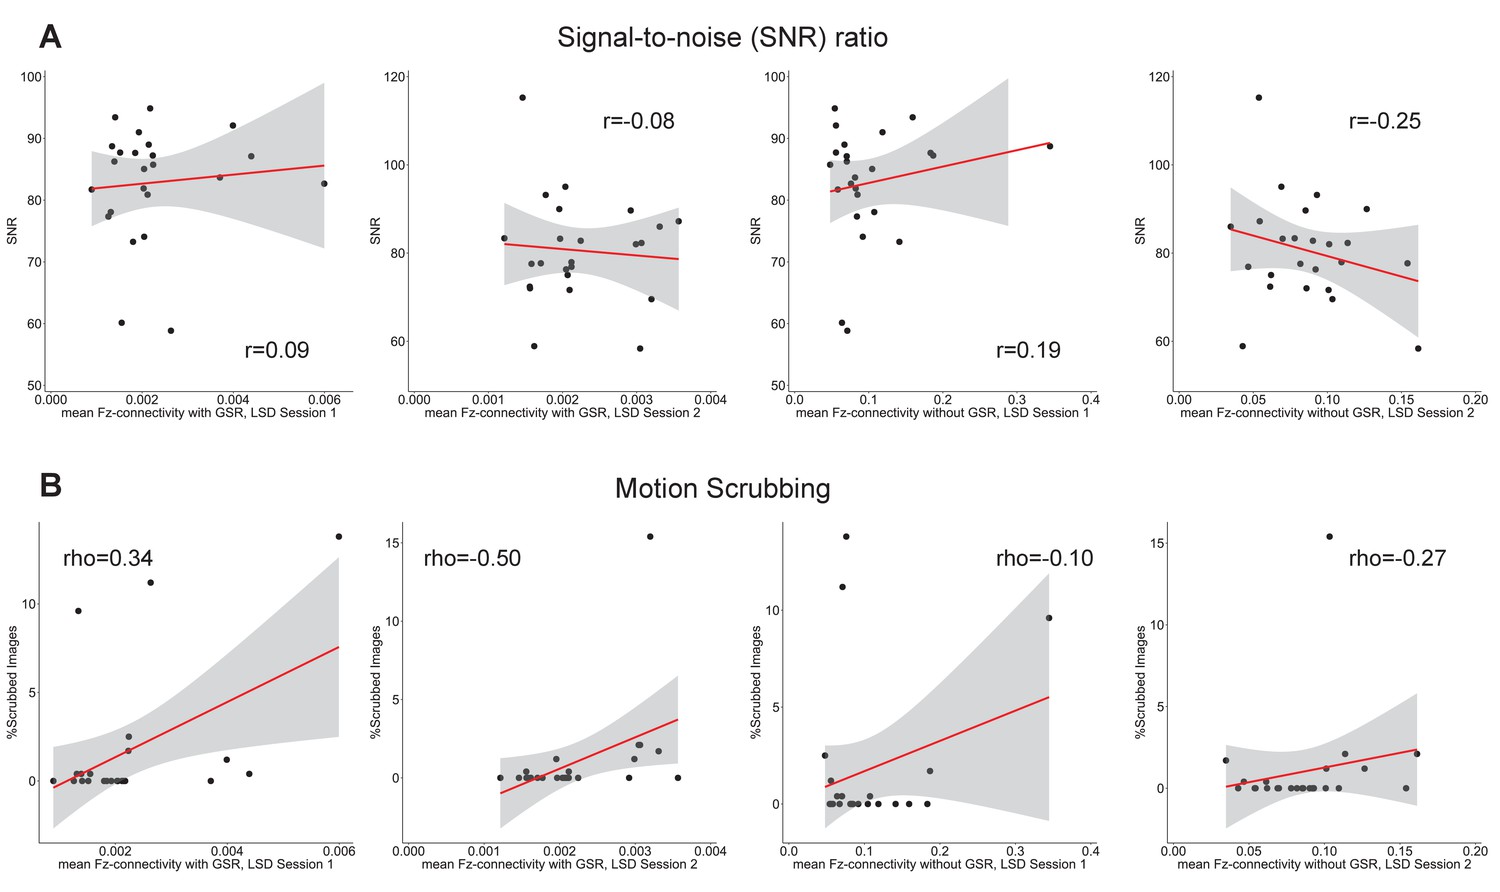
Quality Control (QC) measures do not correlate with mean global brain connecticity.
We computed the relationship between QC measures and the mean GBC for various conditions across subjects. (A) Signal-to-noise ratio (defined as mean signal over the entire BOLD time series for a given grayordinate divided by its standard deviation). (B) The percentage of ‘scrubbed’ images. Here we used the following criterion to compute a percentage of frames flagged for high head motion: First, frames in which sum of the displacement across all six rigid-body movement correction parameters >0.5 mm (assuming 50 mm cortical sphere radius) were identified. Secondly, root mean square (RMS) of differences in intensity between the current and preceding frame was computed across all grayordinates and divided by mean intensity. Frames in which normalized RMS exceeded the value of 3 were identified. The frames flagged by either criterion were marked for exclusion, as well as the one preceding and two frames following the flagged frame. Subjects with >50% frames flagged were completely excluded from analyses. We quantified these QC measures in relation to mean Fz connectivity with and without GSR for the first and second session in the LSD condition. None of the correlations were significant indicating that changes in GBC induced by LSD are not attributable to motion and image arts.
Figure 2
Effect of drug condition on global brain connectivity without global signal regression.
(A) Z-score map for the effect of LSD condition vs. (Ket+LSD)+Pla condition within areas showing a significant main effect of drug (TFCE type I error protected). Red/orange areas indicate regions where participants exhibited stronger GBC in the LSD condition, whereas blue areas indicate regions where participants exhibited reduced GBC condition, compared with (Ket+LSD)+Pla conditions. (B) Bar plots show mean connectivity strength (Fz) values for hyper- and hypo-connected areas averaged across grayordinates showing a significant main effect of drug. Distribution plots show distribution of Fz values within grayordinates showing significant hyper- and hypo-connectivity for LSD compared to (Ket+LSD)+Pla conditions. (C) Right panel displays significant (TFCE type I error protected) areas showing increased (red) and decreased (blue) GBC in the LSD condition compared to Pla. Left panel shows the corresponding unthresholded Z-score map. Red/orange areas indicate regions where participants exhibited stronger GBC in the LSD condition, whereas blue areas indicate regions where participants exhibited reduced GBC in the LSD condition, compared with Pla condition. The histogram above the map shows the distribution of Z-scores. (D) Right panel displays significant (TFCE type I error protected) areas showing increased (red) and decreased (blue) GBC in the LSD condition compared to Ket+LSD. Left panel shows the corresponding unthresholded Z-score map. Red/orange areas indicate regions where participants exhibited stronger GBC in the LSD condition, whereas blue areas indicate regions where participants exhibited reduced GBC in the LSD condition, compared with Ket+LSD condition. The histogram above the map shows the distribution of Z-scores. (E) Right panel displays significant (TFCE type I error protected) areas showing increased (red) and decreased (blue) GBC in the Ket+LSD condition compared to Pla. Left panel shows the corresponding unthresholded Z-score map. Red/orange areas indicate regions where participants exhibited stronger GBC in the Ket+LSD condition, whereas blue areas indicate regions where participants exhibited reduced GBC in the Ket+LSD condition, compared with Pla condition. The histogram above the map shows the distribution of Z-scores. (F) Scatterplot showing a positive relationship between drug condition differences in GBC. Plotted are Z-scores for all grayordinates for the LSD>Pla comparison (see panel C, X-axis) and LSD>Ket+LSD comparison (see panel D, Y-axis). Ellipse marks the 95% confidence interval. (G) Scatterplot showing significant positive relationship evident between averaged hyper- and hypo-connected grayordinates (based on the LSD vs. (Ket+LSD)+Pla contrast without GSR, see inlet) across subjects (black data points) for Pla–LSD condition change scores without GSR. Grey background indicates the 95% confidence interval. (H) Scatterplot showing no significant relationship between Hyper+Hypo connected Fz values with GSR and Hyper+Hypo connected Fz values without GSR. Grey shading indicates the 95% confidence interval. (I) Scatterplot showing significant positive relationship evident between averaged hyper- and hypo- connected grayordinates (based on the LSD vs. (Ket+LSD)+Pla contrast with GSR, see inlet) across subjects (black data points) for Pla–LSD condition change scores without GSR. Grey background indicates the 95% confidence interval. N = 24. p<0.05, Bonferroni corrected.
Figure 3 with 1 supplement
Beta map of the global signal for the LSD>Pla contrast.
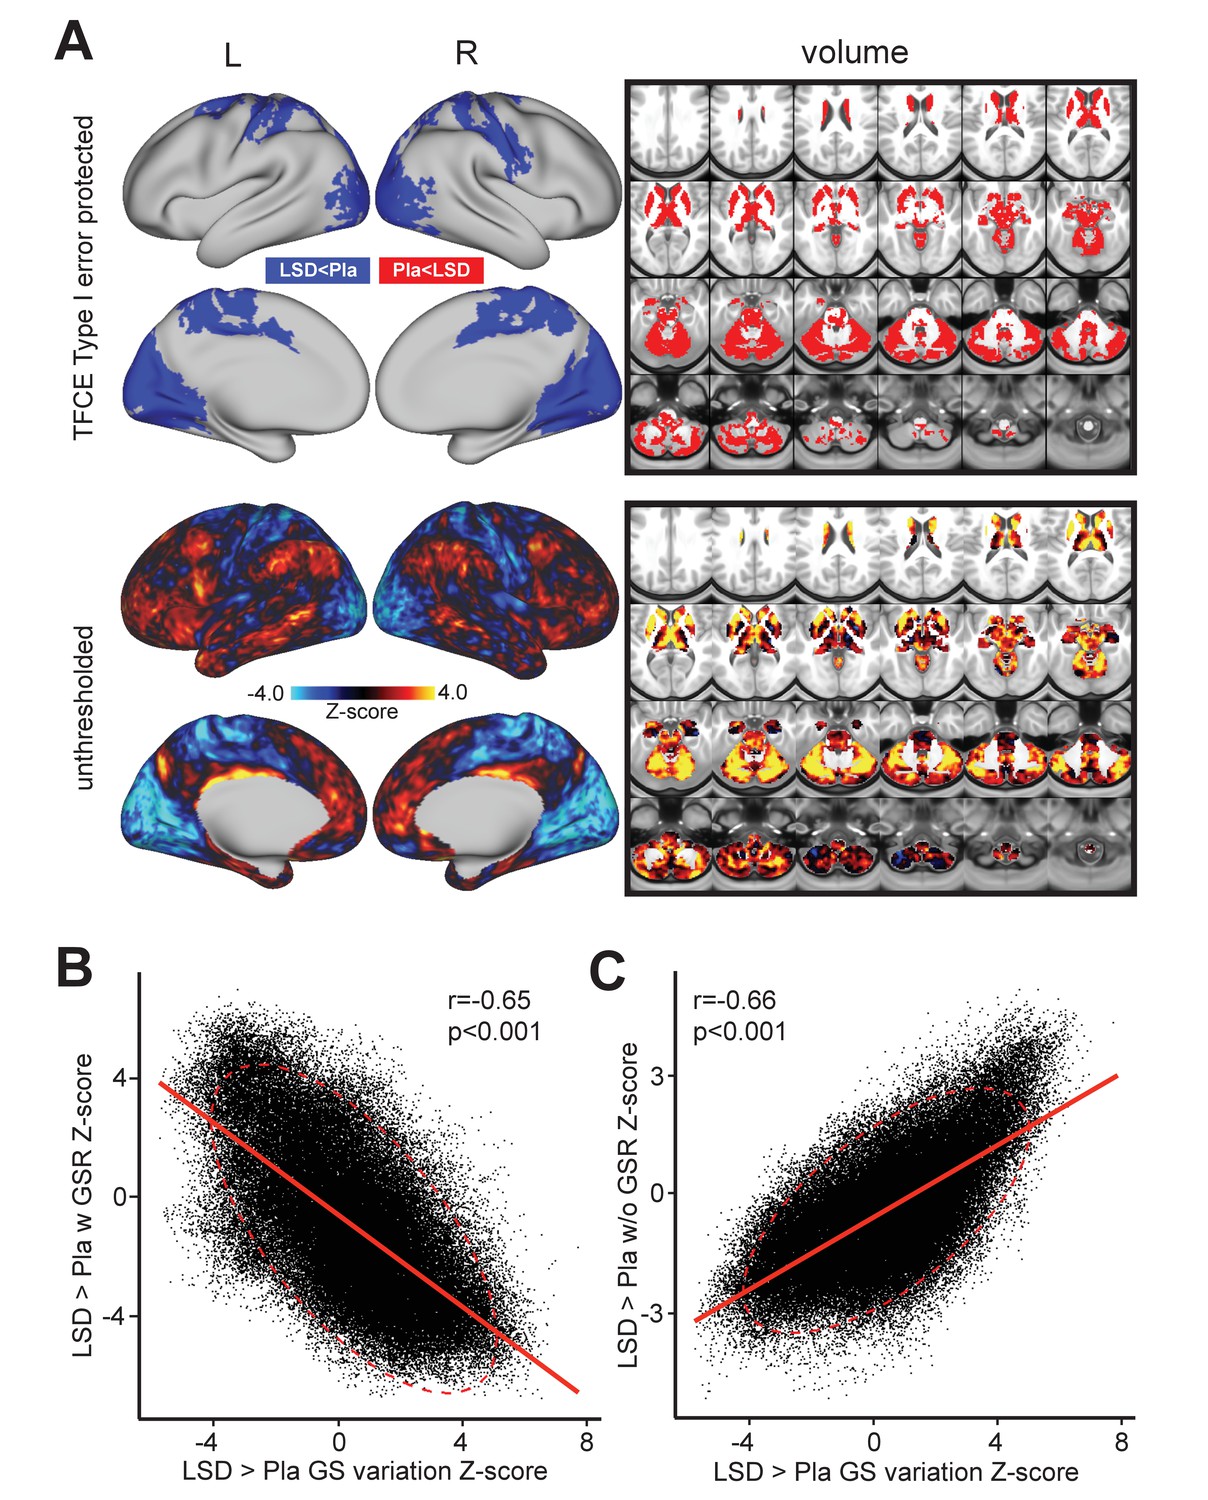
(A) The top panel displays significant (TFCE type I error protected) areas showing increased (red) and decreased (blue) covariance with the GS in the LSD condition compared to Pla. The Z map in the lower panel illustrates the unthresholded contrast between LSD vs. Pla for the GS beta map computed for each subject. Specifically, we calculated the GS (computed as mean grey matter signal) for each frame in the BOLD time course. This mean GS was then used as a regressor in a subject-specific general linear model (GLM). The resulting beta map indicates which areas are maximally co-varying with the mean GS for each subject under LSD or Pla. This ‘GS beta map’ was then entered into a 2nd level analysis as done for the connectivity dependent measures. This comparison tests the hypnosis that the spatial contribution to the GS is altered under LSD vs. Pla. The result shows LSD>Pla in warm colors and LSD<Pla in cool colors. (B) Negative correlation between Beta map of the GS for the LSD>Pla contrast and LSD>Pla GBC Z-score map after GSR and (C) positive correlation before GSR. N=24.
Figure 3—figure supplement 1
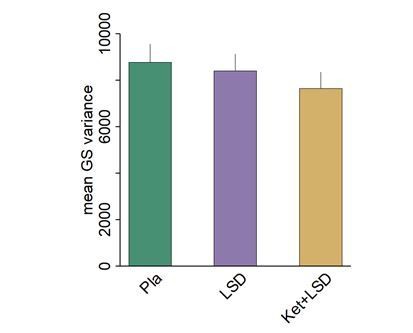
Z-map of change in local voxel-wise variance under LSD vs. Pla.
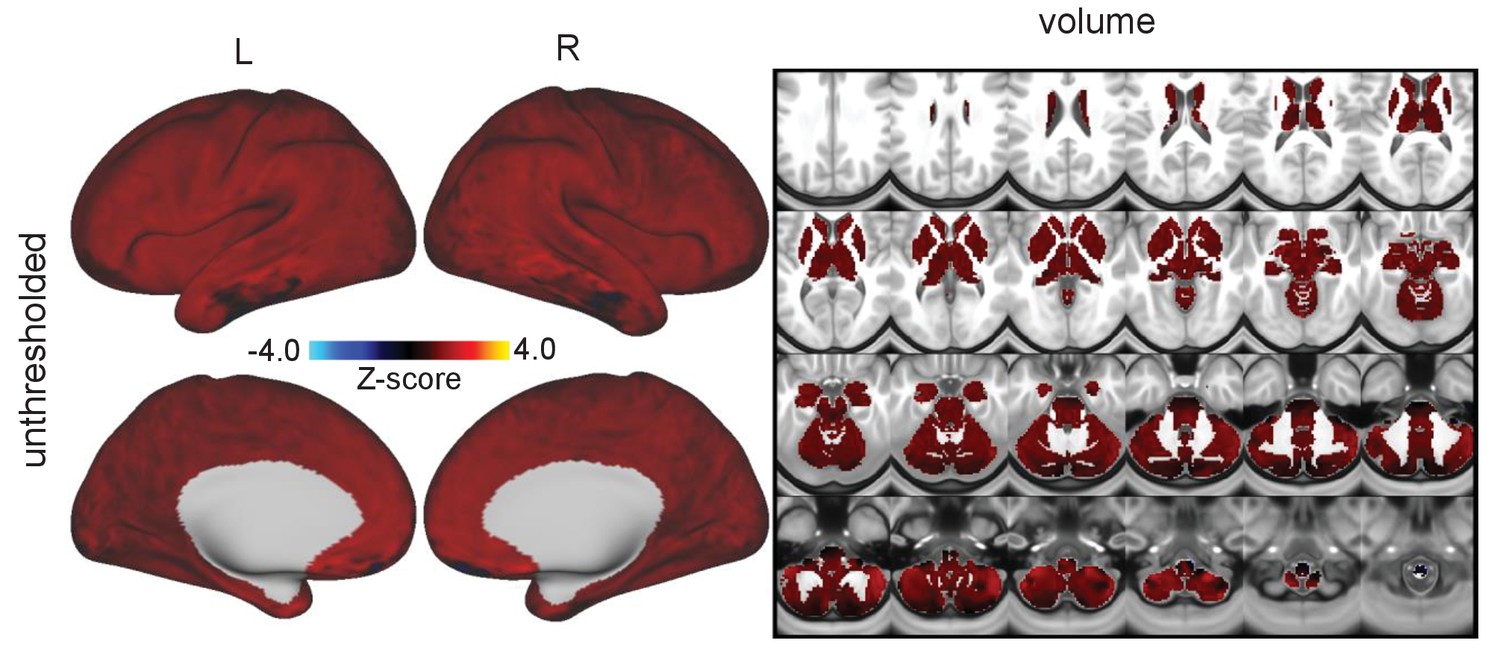
The effect illustrates a very weak alteration in local variance (min/max Z = -1.54/+2.28). No effects survived whole-brain correction. This result in not consistent with the hypothesis that LSD markedly alters voxel-wise amplitudes/variance relative to Pla.
Figure 4 with 3 supplements
Evaluation of influence of global signal regression informed by seed-based thalamus connectivity.
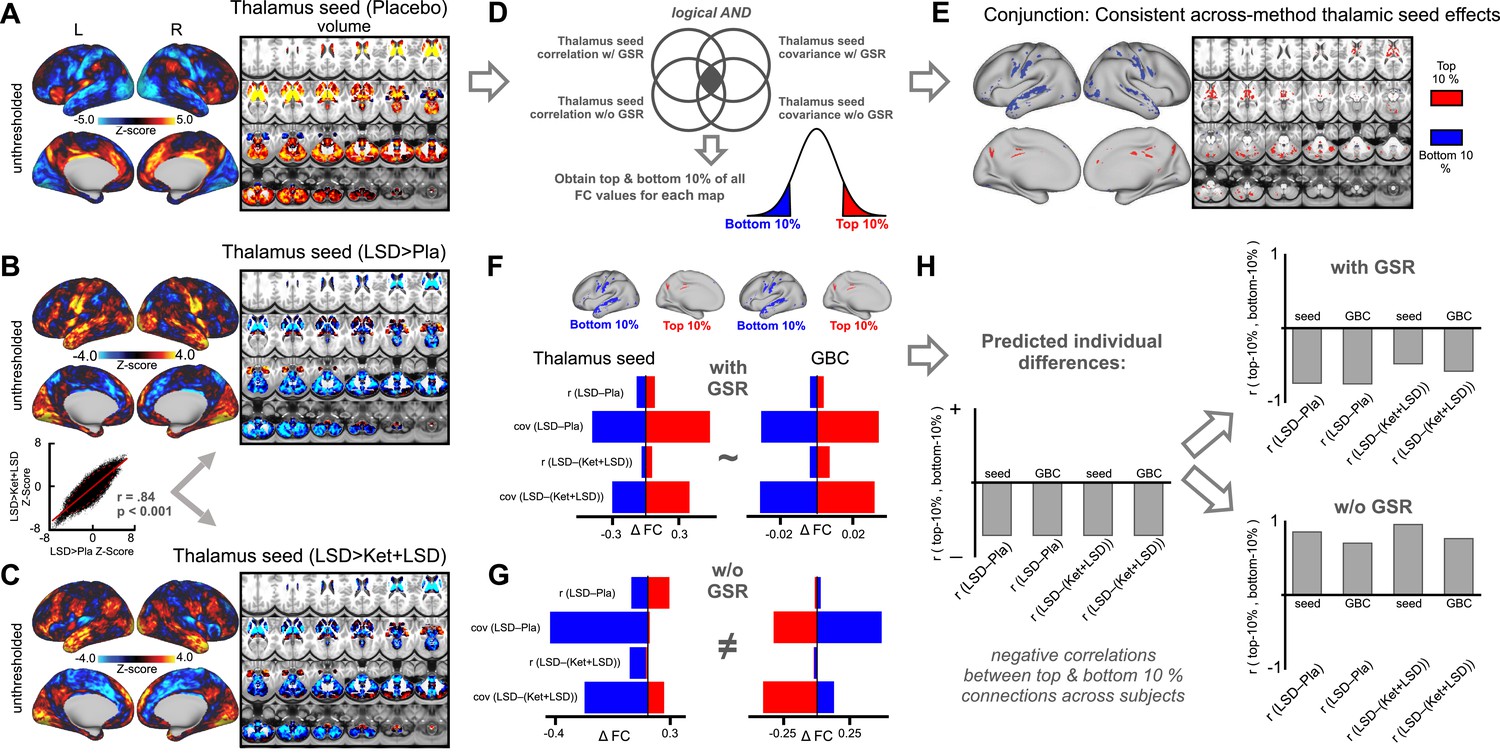
(A) The Z map illustrates the mean thalamus coupling with all grayordinates in the Pla condition. Warm colors indicate positive connections with the thalamus. Cool colors indicate negative connections with the thalamus. (B) The Z-map shows thalamus seed-based connectivity for the LSD>Pla contrast. Warm colors indicate increased thalamus connectivity in the LSD condition. Cool colors indicate decreased thalamus connectivity in the LSD condition. The scatterplot shows the correlation between Z-maps displayed in D and E. (C) The Z-map shows thalamus seed-based connectivity for the LSD>Ket+LSD contrast. Warm colors indicate increased thalamus connectivity in the LSD condition. Cool colors indicate decreased thalamus connectivity in the LSD condition. (D) Schematic illustrating the conjunction analysis. The top/bottom 10% of all connections were extracted from the mean connectivity (correlation and covariance) maps in the Pla condition before and after GSR and used to compute a conjunction map providing the strongest and weakest thalamic connections irrespective of analysis method. (E) Result of conjunction analysis used as mask to extract values in the following analyses. (F) Mean differences between drug conditions within top and bottom regions revealed by the conjunction analysis before GSR for thalamus seed connectivity (correlation and covariance) and GBC (correlation and covariance). (G) Mean differences between drug conditions within top and bottom regions revealed by the conjunction analysis after GSR for thalamus seed connectivity (correlation and covariance) and GBC (correlation and covariance). (H) The right bar graph illustrates that correlation coefficients between top and bottom area vales across participants are expected to be negative. The upper right panel shows the correlation coefficients between top and bottom connections revealed by the conjunction analysis after GSR. The lower right panel shows the correlation coefficients between top and bottom connections revealed by the conjunction analysis before GSR. r: correlation; cov: covariance, N = 24.
Figure 4—figure supplement 1
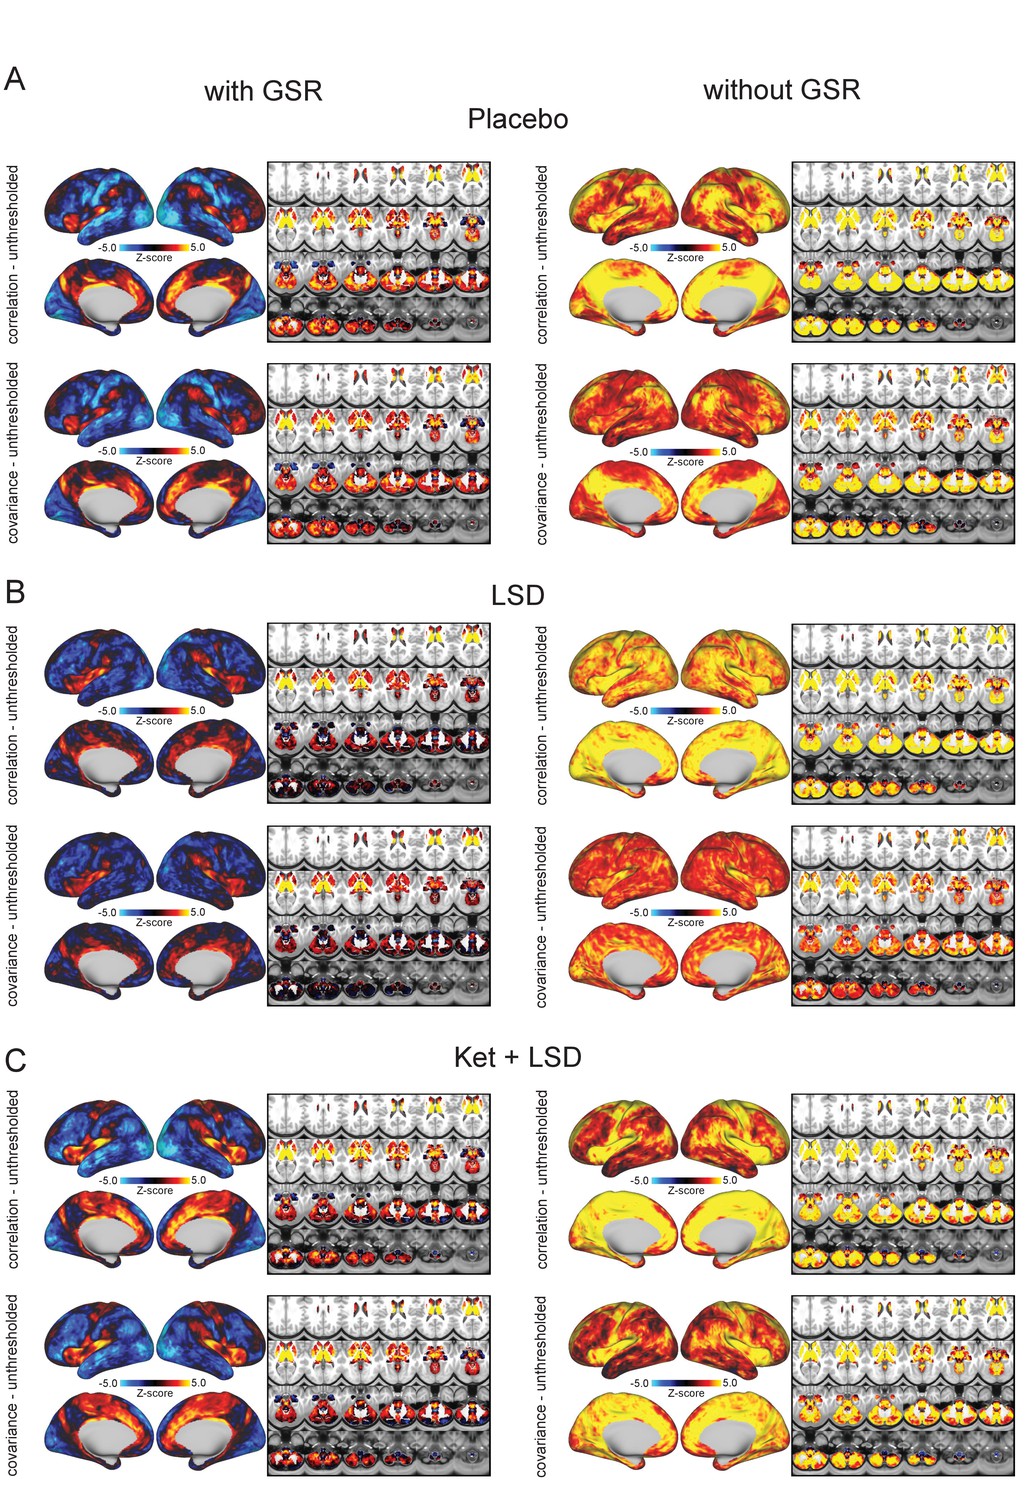
Thalamus seed-based connectivity.
Mean Z-maps for thalamus coupling with all grayordinates in the brain in session 1 of all drug conditions (A-C). Correlation (upper panels) and covariance maps (lower panels) were computed before (right panels) and after GSR (left panels). Warm colors indicate positive connections with the thalamus. Cool colors indicate negative connections with the thalamus. N = 24.
Figure 4—figure supplement 2
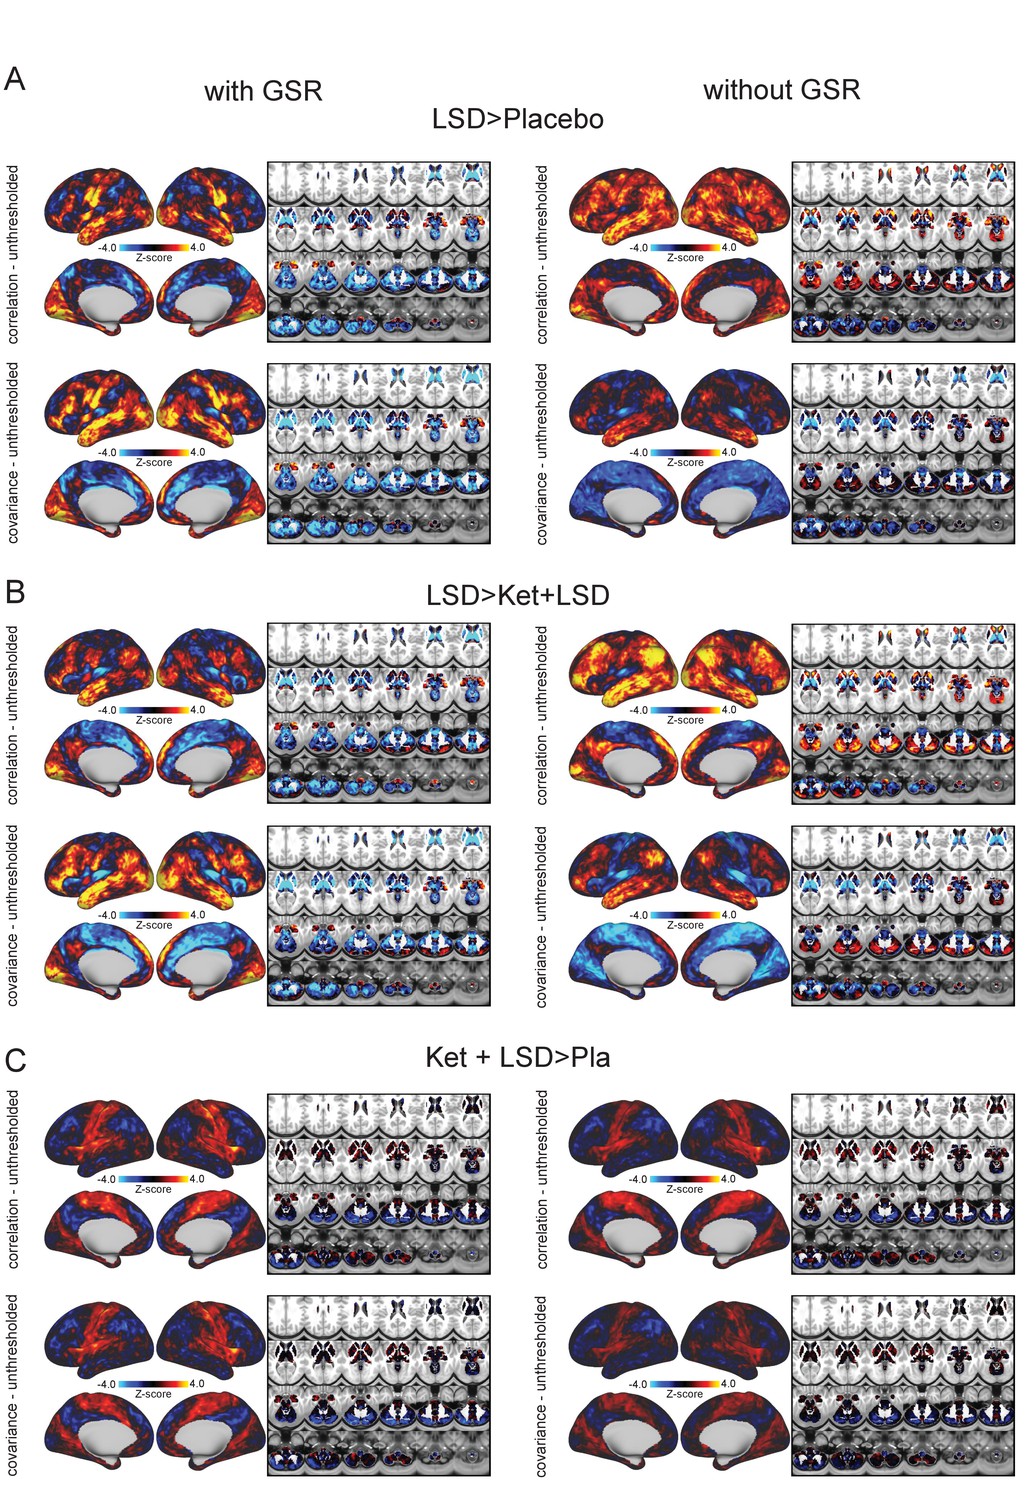
Thalamus seed-based connectivity contrast maps.
Contrast Z-maps for thalamus coupling with all grayordinates in the brain in session one comparing drug conditions (A-C). Correlation (upper panels) and covariance maps (lower panels) were computed before (right panels) and after GSR (left panels). Warm colors indicate increased thalamus connectivity. Cool colors indicate decreased thalamus connectivity. N = 24.
Figure 4—figure supplement 3
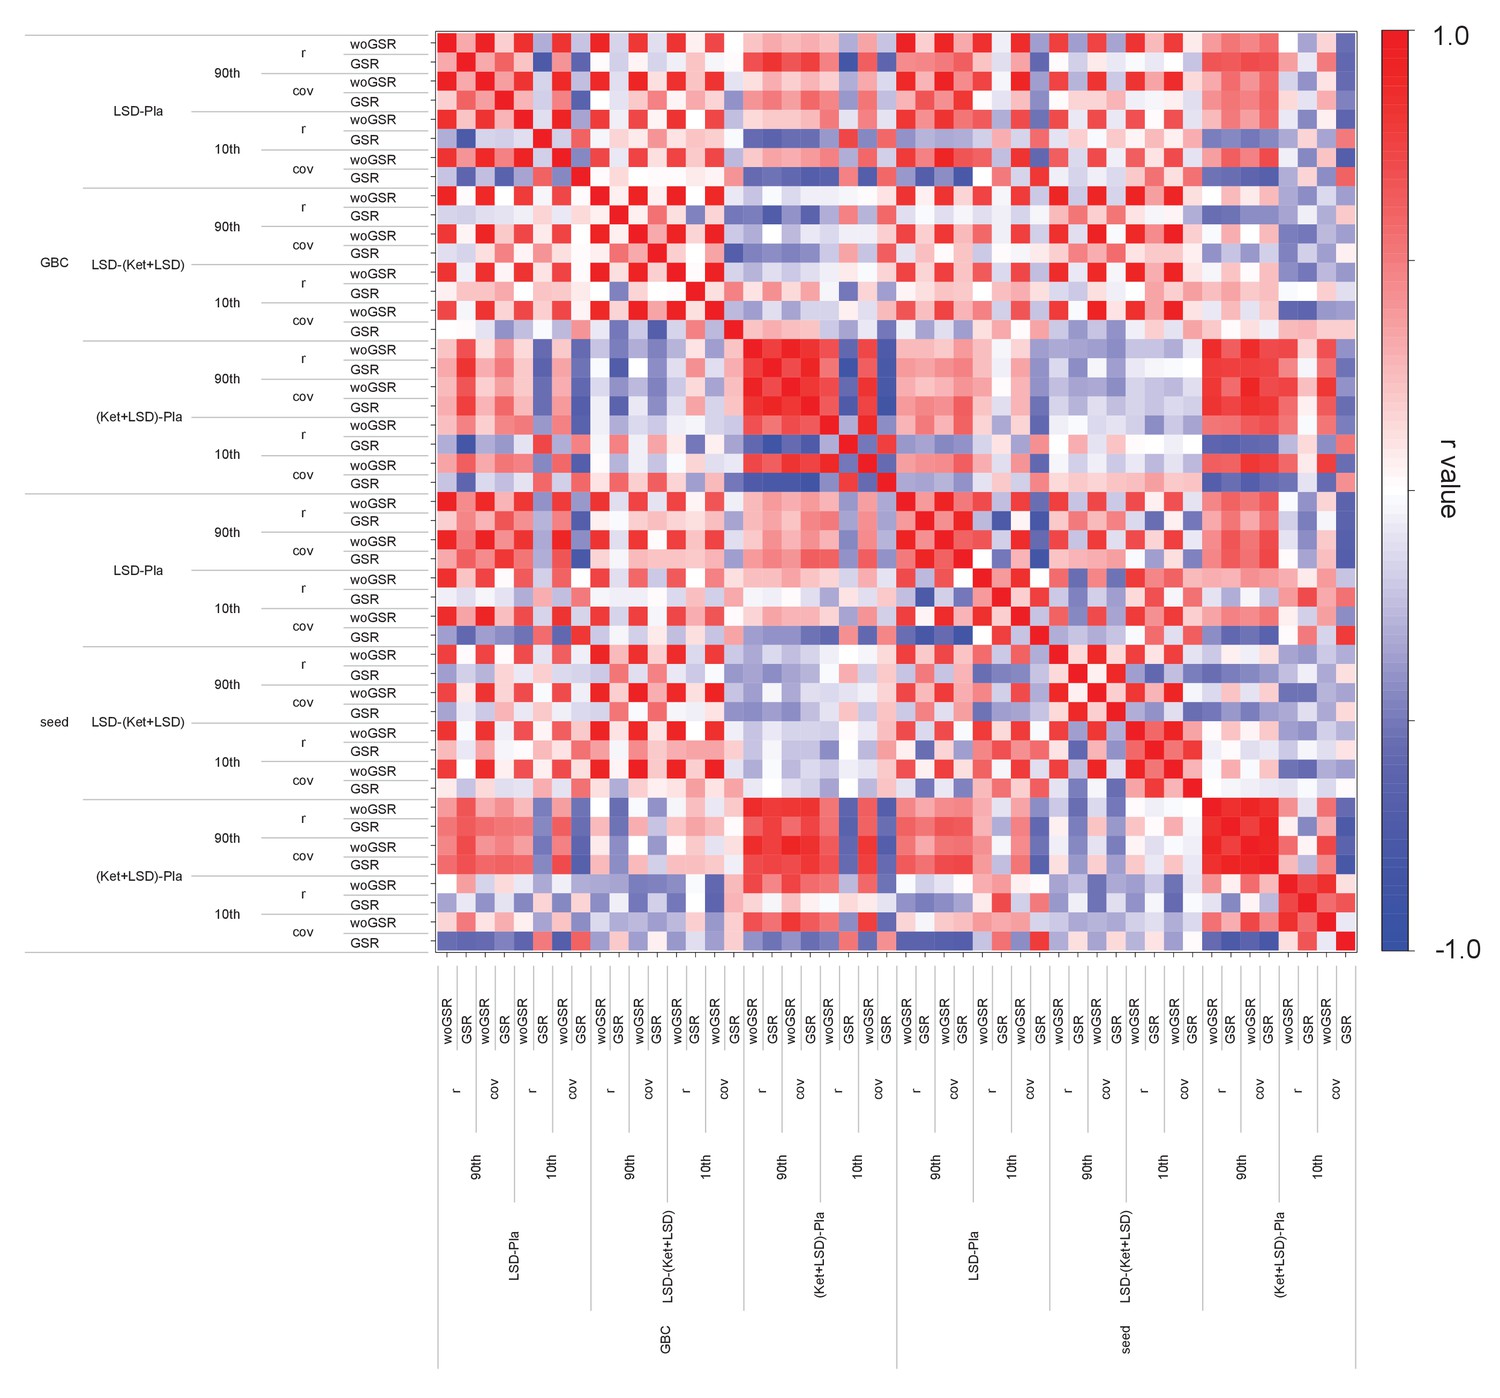
Across-subject correlation matrix between top and bottom connections and different analysis methods.
The matrix shows the correlation coefficients (Pearson’s r) between contrasts between drug conditions obtained using thalamic seed connectivity (seed) and GBC with and without GSR and calculated as correlation (r) and covariance (cov). Values were extracted for the top and bottom connections based on a conjunction analysis in the Pla condition depicted in Figure 4. N = 24.
Figure 5 with 1 supplement

Time course of subjective drug effects.
Five Dimension Altered States of Consciousness Questionnaire short version scores assessed at 180, 250, and 300 min after second drug administration for the means across scales, and scale scores for Pla, LSD, and Ket+LSD conditions. Scores are expressed as percent of the scale maximum. Data are expressed as means ± the standard error of the mean (SEM). BS: Blissful State; CMP: Changed Meaning of Percepts; D: Disembodiment; EI: Elementary Imagery; SE: Spiritual Experience. N = 23.
-
Figure 5—source data 1
Five Dimension Altered States of Consciousness Questionnaire short version
- https://cdn.elifesciences.org/articles/35082/elife-35082-fig5-data1-v2.xlsx
Figure 5—figure supplement 1
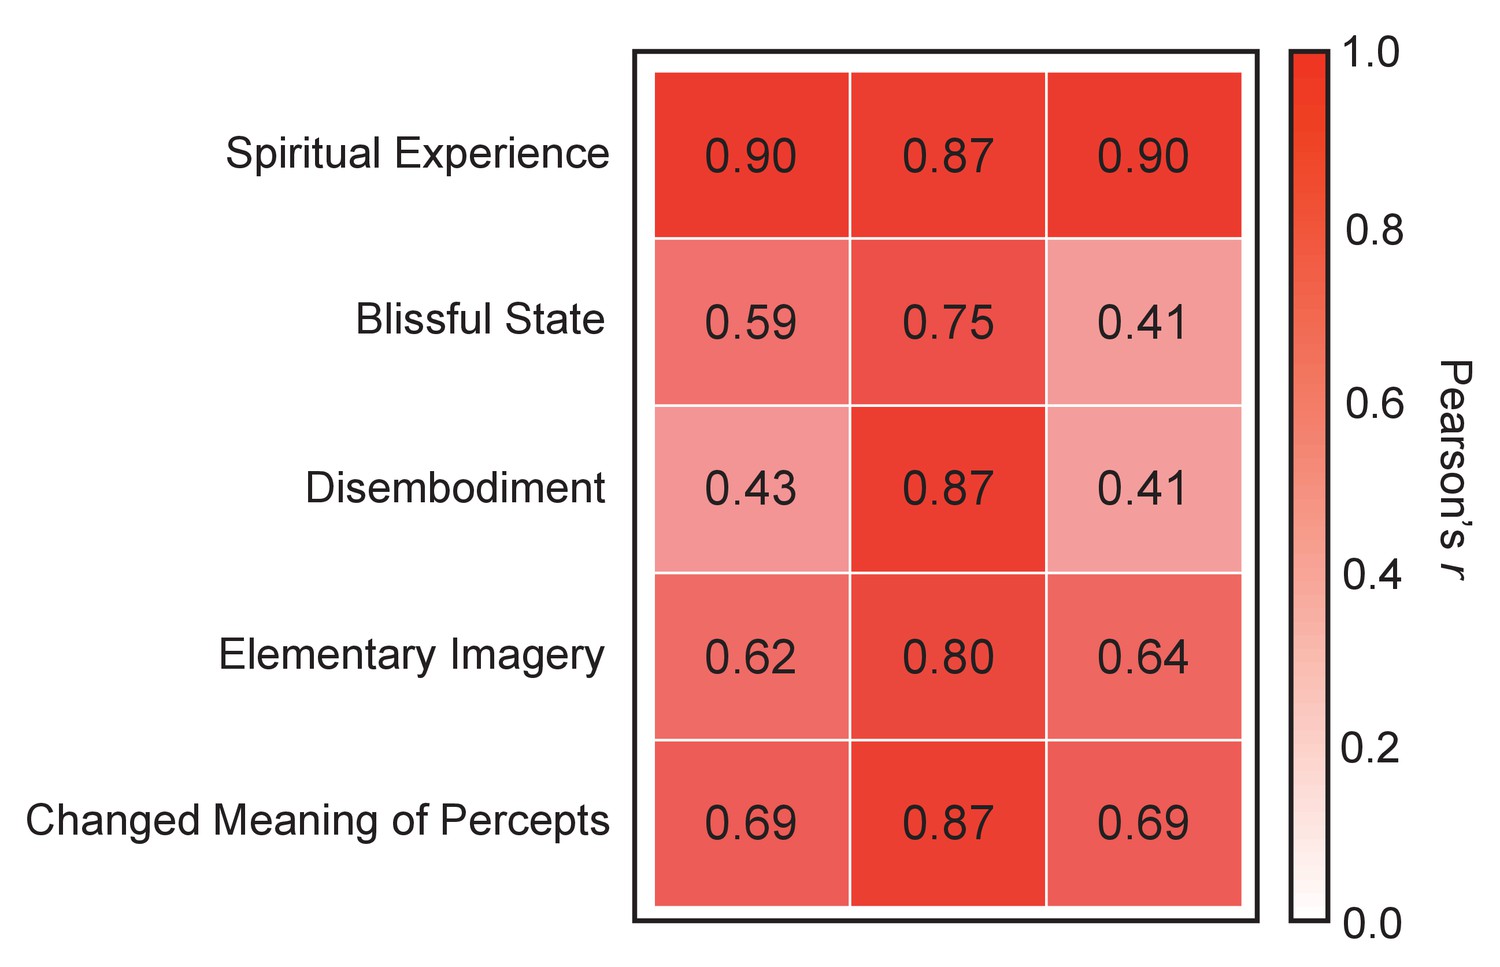
Across-subject correlation.
(Pearson’s r) between Five Dimension Altered States of Consciousness Questionnaire short version scores assessed at three time points (T1 = 180 min, T2 = 250 min, and T3 = 300 min) in the LSD condition. First column displays correlation between T1 and T2, second column displays correlation between T2 and T3, and third column displays correlation between T1 and T3. N = 23.
Figure 6 with 1 supplement

Effect of session on global brain connectivity in the Ketanserin+LSD condition.
(A) Top panel displays significant (TFCE type I error protected) areas showing increased (red) and decreased (blue) GBC in session 1 (75 minutes after second drug administration) compared to session 2 (300 minutes after second drug administration). Lower panel shows the corresponding unthresholded Z-score map. Red/orange areas indicate regions where participants exhibited stronger GBC in session 1, whereas blue areas indicate regions where participants exhibited reduced GBC in session 2. (B) Bar plots show mean connectivity strength (Fz) values for hyper- and hypo-connected areas (significant for the LSD vs. (Ket+LSD)+Pla contrast) for session 1 and session two in the Ket+LSD condition. Distribution plots show distribution of connectivity strength (Fz) values within grayordinates showing hyper- and hypo-connectivity (significant for the LSD vs. (Ket+LSD)+Pla contrast) for session 1 and session two in the Ket+LSD condition. N = 24.
Figure 6—figure supplement 1
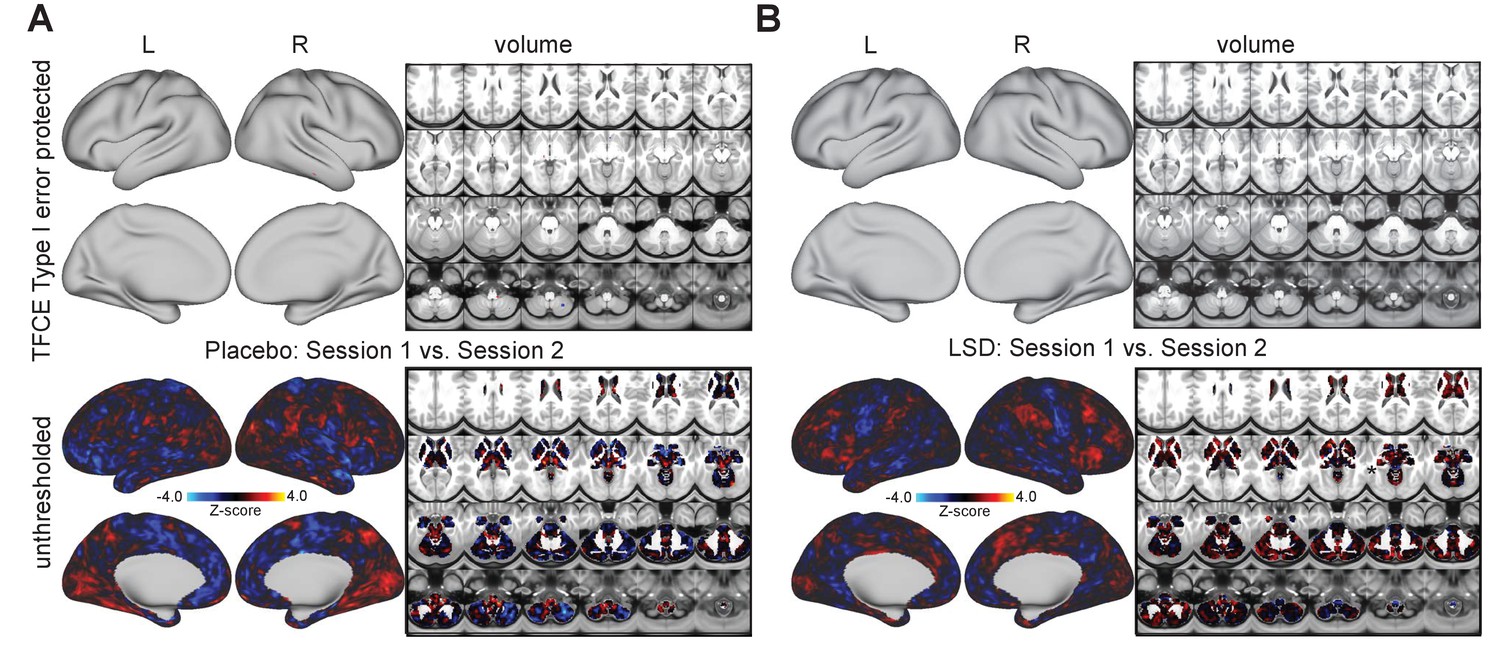
Effect of session on global brain connectivity.
Animal studies suggest distinct temporal phases of LSD pharmacology, with an early phase mediated by 5-HT2A and a later phase mediated by D2 receptor stimulation (Marona-Lewicka et al., 2005; Marona-Lewicka and Nichols, 2007). However, temporal differences in receptor contributions to the effects of LSD have not been investigated in humans. Therefore, the current study quantified GBC, with two independent scans, at two distinct time points (75 and 300 min after administration) in a sample of 24 participants who each underwent three drug treatment conditions: 1) placebo after pretreatment with placebo (Pla), 2) LSD after pretreatment with placebo (LSD), and 3) LSD after pretreatment with ketanserin (Ket+LSD). (A) Pla condition. (B) LSD condition. Top panel displays no significant (TFCE type I error protected) areas showing increased or decreased GBC in session 1 (75 minutes after second drug administration) compared to session 2 (300 minutes after second drug administration). Lower panel shows the corresponding unthresholded Z-score map. Red/orange areas indicate regions where participants exhibited stronger GBC in session 1, whereas blue areas indicate regions where participants exhibited reduced GBC in session 2.
Figure 7

Effect of drug condition, session, and globals signal regression on global brain connectivity in functional networks (A–G).
Brain maps illustrate lateral, medial, and subcortical view of functional networks. Bar plots show mean connectivity strength (Fz) values for grayordinateswithin functional networks for Pla, LSD, and Ket+LSD conditions, for session 1 and session two respectively, as well as with and without GSR. Distribution plots show distribution of connectivity strength (Fz) values for grayordinates within functional networks for Pla, LSD, and Ket+LSD conditions, for session 1 and session 2 respectively, as well as with and without GSR. N = 24.
Figure 8
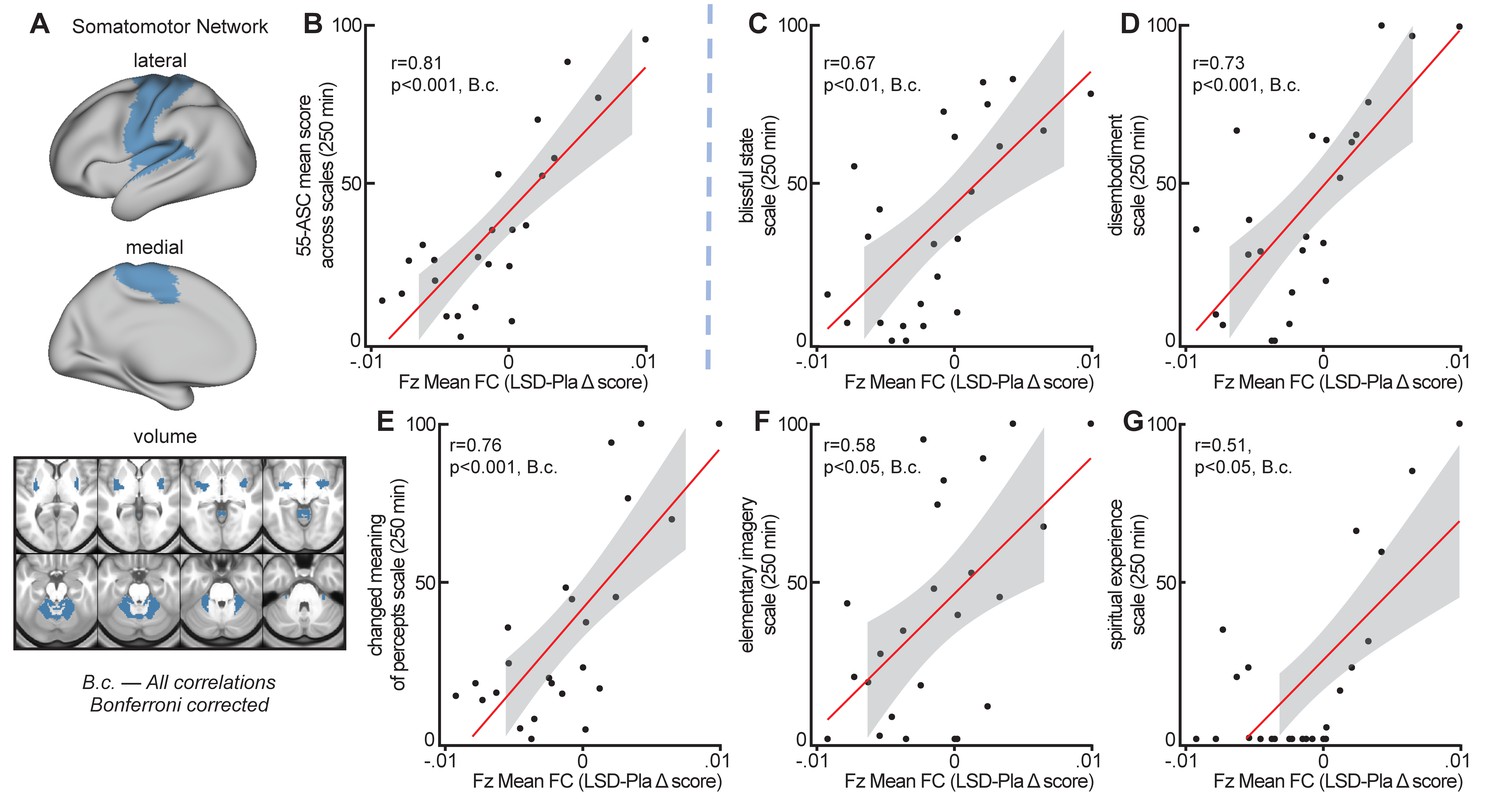
Correlation between global crain connectivity and subjective effects.
(A) The brain map illustrates lateral, medial, and subcortical view of the somatomotor network. (B) The scatterplot shows the significant positive correlation between Fz mean connectivity change (LSD–Pla condition, session 2, with GSR) in the somatomotor network and the mean 5-DASC short version score at 250 mins. (C-G) Scatterplots show the positive correlation between Fz mean connectivity change (LSD–Pla condition, session 2, with GSR) in the somatomotor network and the five subscales of the 5-DASC short version score at 250 mins: blissful state, disembodiment, changed meaning of percepts, elementary imagery, spiritual experience. B.c.: Bonferroni corrected. Grey background indicates the 95% confidence interval. N = 24.
Figure 9 with 1 supplement
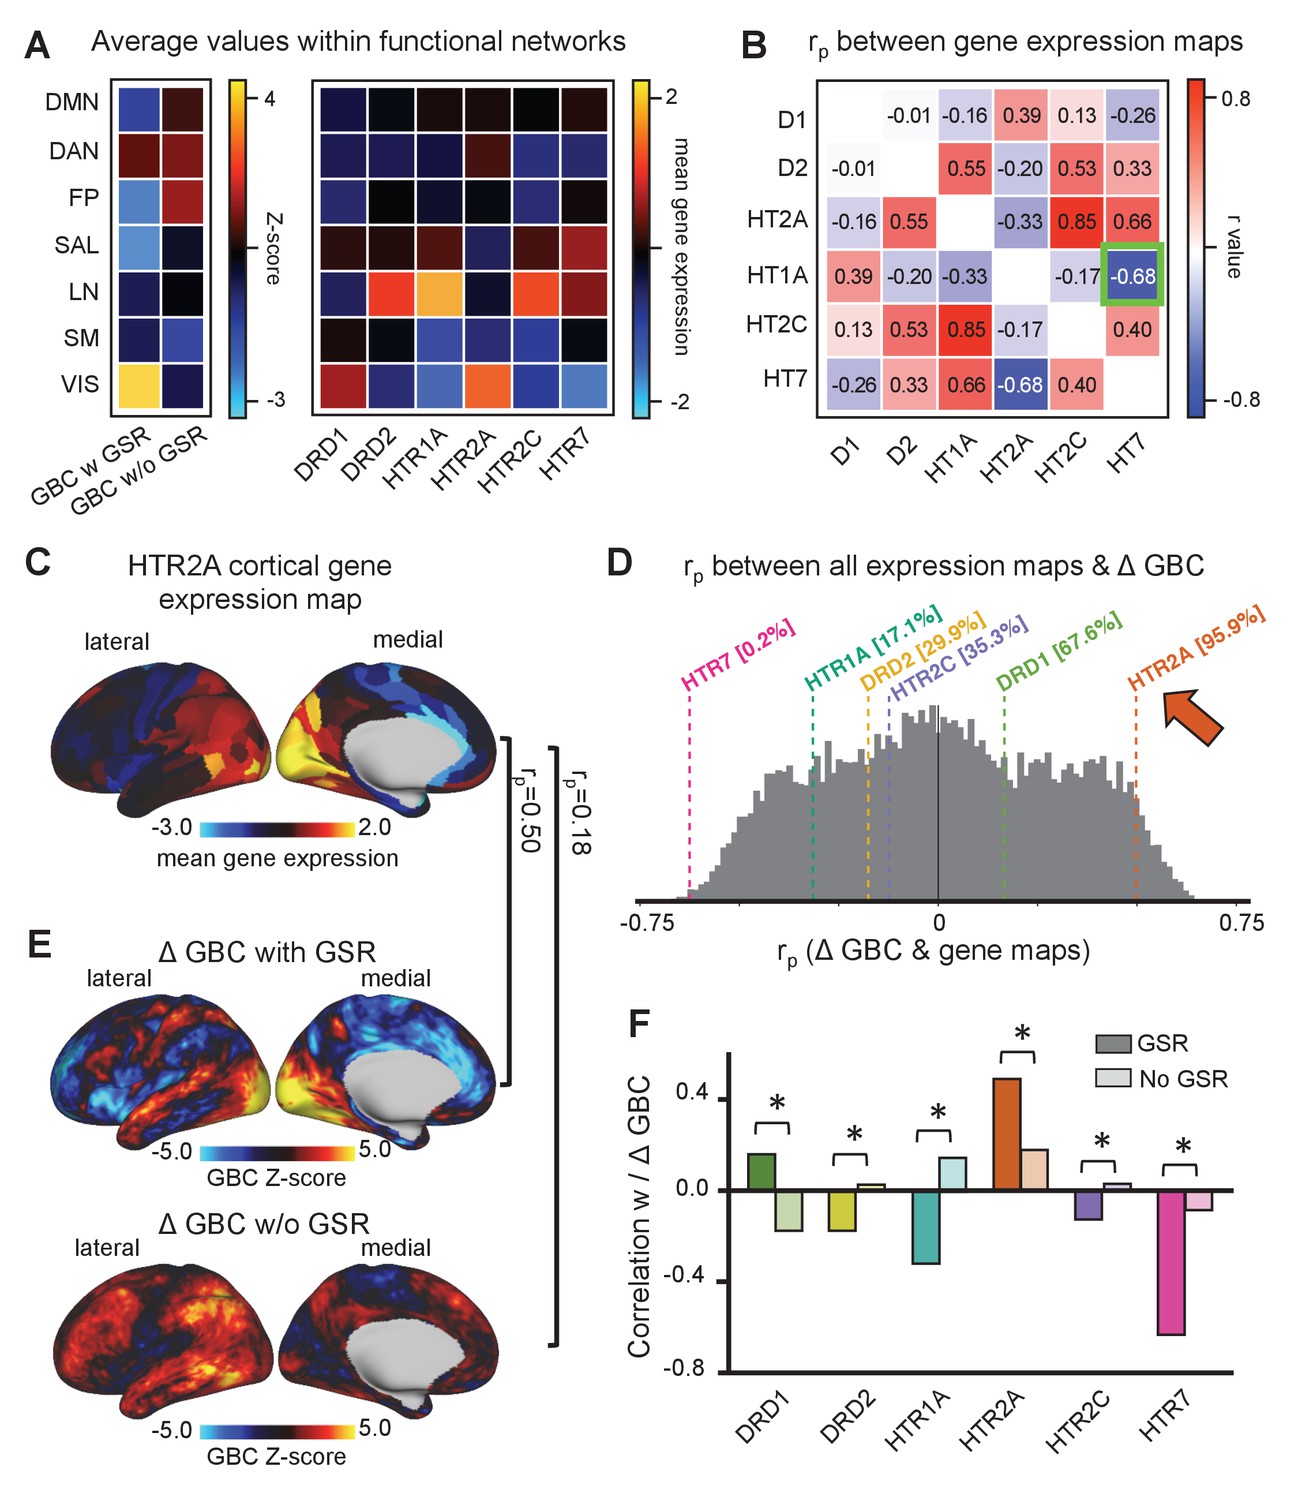
Correlation between global brain connectivity and cortical gene expression maps.
(A) The top left panel shows the average GBC Z-score (LSD condition vs. (Ket+LSD)+Pla condition) with and without GSR and mean gene expression value within functional networks. (B) The top right panel shows the correlation (Pearson’s r) between the gene expression maps, highlighting (green) the negative correlation between the expression maps of HTR2A and HTR7. (C) The brain map illustrates the cortical expression levels (Z-score) of HTR2A in the left hemisphere (lateral and medial view). (D) The histogram depicts the correlation between all gene expression maps and the unthresholded Z-score map for LSD condition vs. (Ket+LSD)+Pla condition with GSR. The colored lines highlight the gene expression maps of interest. (E) Unthresholded Z-score map for LSD condition vs. (Ket+LSD)+Pla with (top) and without (bottom) GSR. Red/orange areas indicate regions where participants exhibited stronger GBC in the LSD condition, whereas blue areas indicate regions where participants exhibited reduced GBC in the LSD condition, compared with (Ket+LSD)+Pla. rp values are the respective correlation coefficients between Z-score maps and HTR2A gene expression map. (F) The bar graph shows the correlation coefficients (Pearson’s r) between each gene expression map of interest and Z-score maps for LSD condition vs. (Ket+LSD)+Pla condition with and without GSR. * indicates significant difference between correlations between Z-score map with and without GSR and gene expression map, p<0.05, Bonferroni corrected.
Figure 9—figure supplement 1
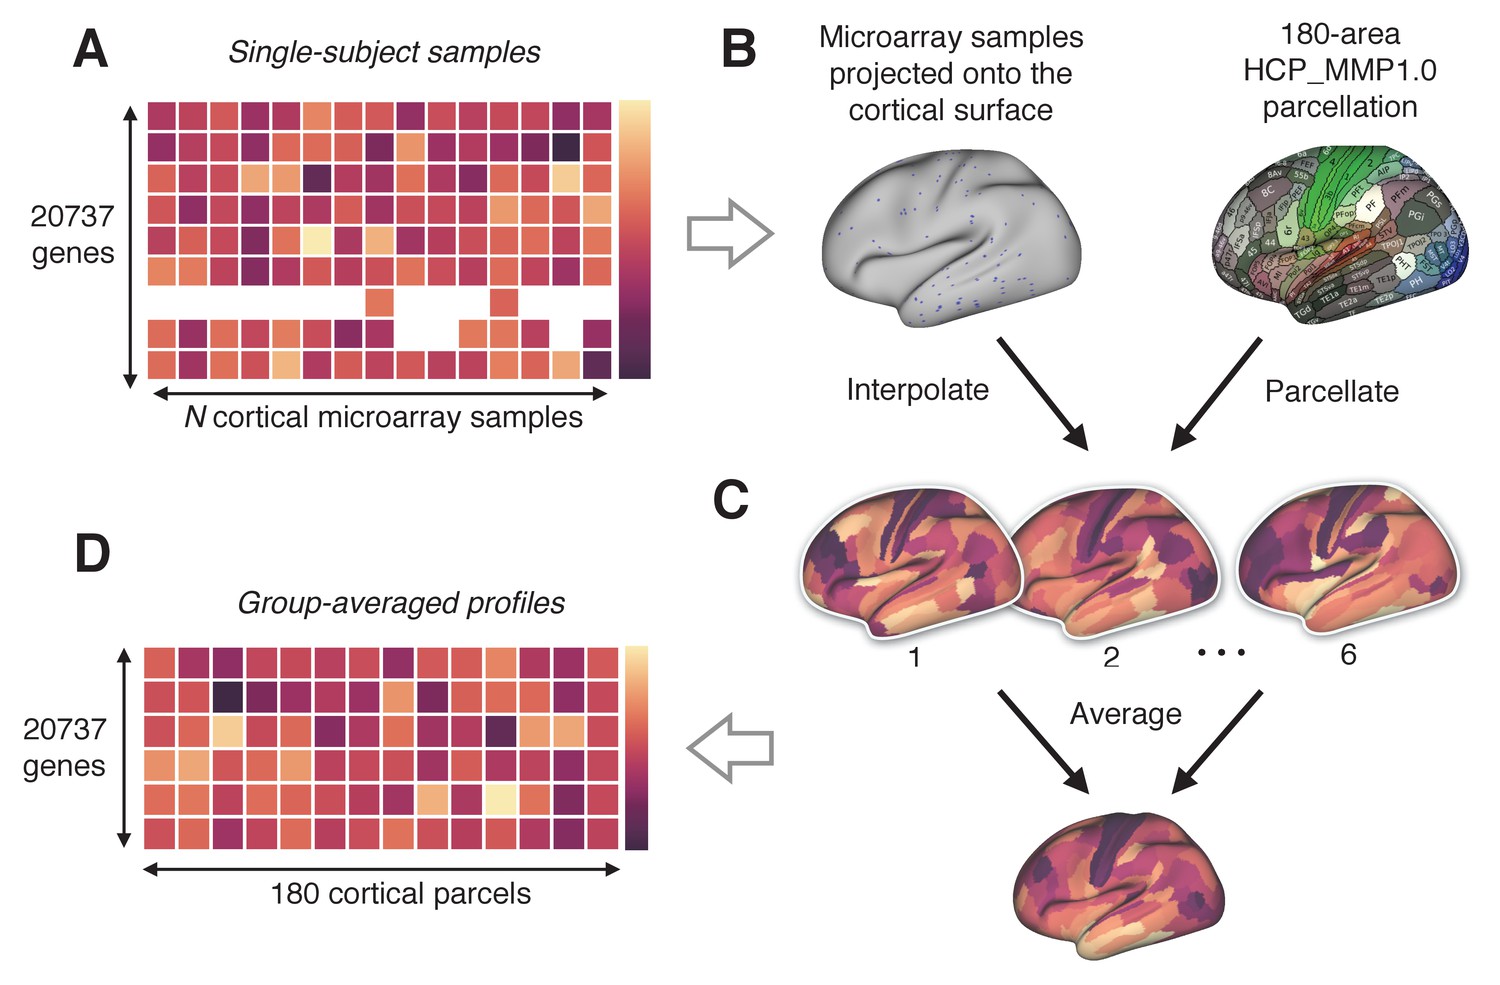
Schematic illustrating the process of generating cortical gene expression maps from the Allen Human Brain Atlas (AHBA).
Author response image 1
Additional files
Download links
A two-part list of links to download the article, or parts of the article, in various formats.
Downloads (link to download the article as PDF)
Open citations (links to open the citations from this article in various online reference manager services)
Cite this article (links to download the citations from this article in formats compatible with various reference manager tools)
Changes in global and thalamic brain connectivity in LSD-induced altered states of consciousness are attributable to the 5-HT2A receptor
eLife 7:e35082.
https://doi.org/10.7554/eLife.35082


