Alpha protocadherins and Pyk2 kinase regulate cortical neuron migration and cytoskeletal dynamics via Rac1 GTPase and WAVE complex in mice
- Shanghai Jiao Tong University, China
- Renji Hospital affiliated to Shanghai Jiao Tong University Medical School, China
- Shanghai Jiao Tong University Medical School, China
Figures
Figure 1 with 1 supplement

Pcdhα is required for cortical neuron migration.
(A) Schematics of the mouse Pcdhα organization. Var, variable region; Con, constant region; EC, ectodomain; VCD, variable cytoplasmic domain; αCD, Pcdhα constant domain. (B) GFP and F-actin immunostaining of cortical coronal sections from E12.5, E15.5, and P0 PcdhαGFP mouse brain. Nuclei are counterstained with DAPI. Upper left inset shows the PcdhαGFP mouse line construction. (C) Immunostaining with an antibody specific for PcdhαCD of cortical coronal sections from E15.5 wild-type mouse brains. Nuclei were counterstained with DAPI. (D) Cortical coronal sections of E19.5 mouse brain which were electroporated at E15.5 with control (SCR: scrambled) or αKD (α shRNA1 or α shRNA2) plasmids. Nuclei were counterstained with DAPI. Quantification of GFP+ cell distribution across the cortex (divided into ten equal bins) is shown on the right. n = 6 brains for each group. Statistical significance was assessed using one-way ANOVA, followed by a post-hoc Tukey’s multiple comparisons test. (E) Representative multipolar neurons and their lucida drawings in the red boxes shown in (D). Asterisks indicate multipolar cells. (F) Embryonic brains were electroporated at E15.5 and organotypic slices were prepared from brains at E17.5. Representative frames from a 10 hr time-lapse imaging experiment are shown. Asterisks indicate one migrating cell. See also Video 1. (G and H) Typical migration traces (G) and migration velocity (H) of control and αKD neurons in a time-lapse experiment shown in (F). n = 15 cells for each group. Student’s t test. (I) Cortical coronal sections of E15.5 embryos electroporated at E12.5 with control or αKD plasmids. Nuclei were counterstained with DAPI. (J) Quantification of E15.5 control and αKD GFP+ cells in CP, IZ, and VZ. n = 5 brains for SCR, n = 4 brains for αKD. Student’s t test. Data as mean ± SEM. ****p<0.0001. *p<0.05. See Figure 1—source data 1. Scale bar, 20 μm for (F) and (G); 50 μm for (E); 100 μm for all other panels. MZ, marginal zone; CP, cortical plate; IZ, intermediate zone; SVZ, subventricular zone; VZ, ventricular zone.
-
Figure 1—source data 1
Quantification source data for Figure 1.
- https://doi.org/10.7554/eLife.35242.005
Figure 1—figure supplement 1
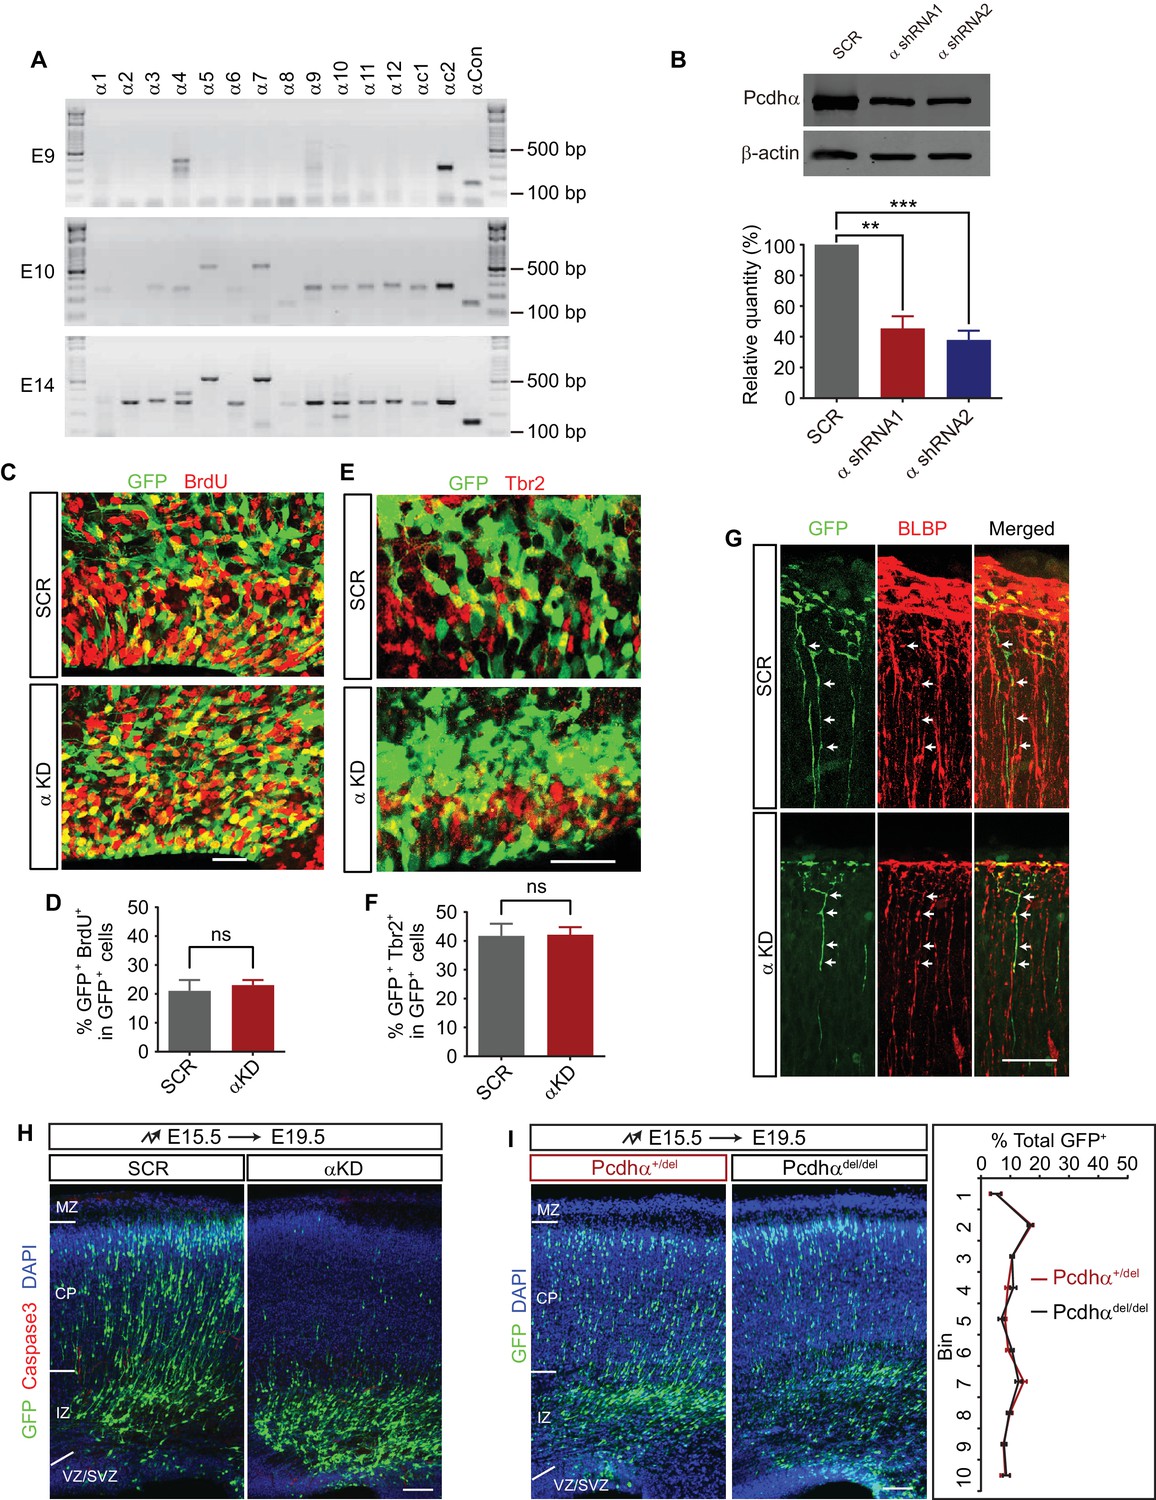
Additional control data for Pcdhα function in cortical neuron migration.
(A) RT-PCR of members of the Pcdhα family in E9, E10, and E14 embryonic mouse brain. (B) Western blot and its quantification of lysates of 293 T cells transfected with control or αKD plasmids. n = 3 experiments for each group. Statistical significance was assessed using one-way ANOVA, followed by a post hoc Tukey’s multiple comparisons test. (C) The VZ/SVZ region of E17.5 cortical coronal sections immunostained with a BrdU antibody. Embryonic mice were electroporated with control or αKD plasmids at E15.5, injected with BrdU at E16.5, and sectioned at E17.5. (D) Percentage of GFP+ and BrdU+ cells among GFP+ cells in the VZ/SVZ region shown in (C). n = 5 brains for each group. Student’s t test. (E) The VZ/SVZ region of E17.5 cortical coronal sections immunostained with Tbr2 antibody. Embryonic mice were electroporated with control or αKD plasmids at E15.5. (F) Percentage of GFP+ and BrdU+intermediate progenitor cells (IPCs) in GFP+ cells in the VZ/SVZ region shown in (E). n = 3 brains for each group. Student’s t test. (G) The CP region of E17.5 cortical coronal sections immunostained with an anti-brain lipid binding protein (BLBP) antibody of embryonic brains electroporated at E15.5. Arrows, BLBP-labeled radial glia cells. (H) E19.5 cortical coronal sections immunostaining for activated Caspase3 of embryonic brains electroporated at E15.5. Nuclei were counterstained with DAPI. (I) Cortical coronal sections of E19.5 Pcdhα knockout mouse brains which were in utero electroporated at E15.5 with GFP plasmids. Slides were counterstained with DAPI. Quantification of GFP+ cell distribution across the cortex is shown on the right. n = 6 brains for each group. Data as mean ±SEM. **p<0.01; ***p<0.001; ns, not significant. See Figure 1—figure supplement 1—source data 1. Scale bar, 25 μm for (C) and (E), 100 μm for (G, H,) and (I). MZ, marginal zone; CP, cortical plate; IZ, intermediate zone, VZ, ventricular zone; SVZ, subventricular zone.
-
Figure 1—figure supplement 1—source data 1
Quantification source data for Figure 1—figure supplement 1.
- https://doi.org/10.7554/eLife.35242.006
Figure 2 with 1 supplement
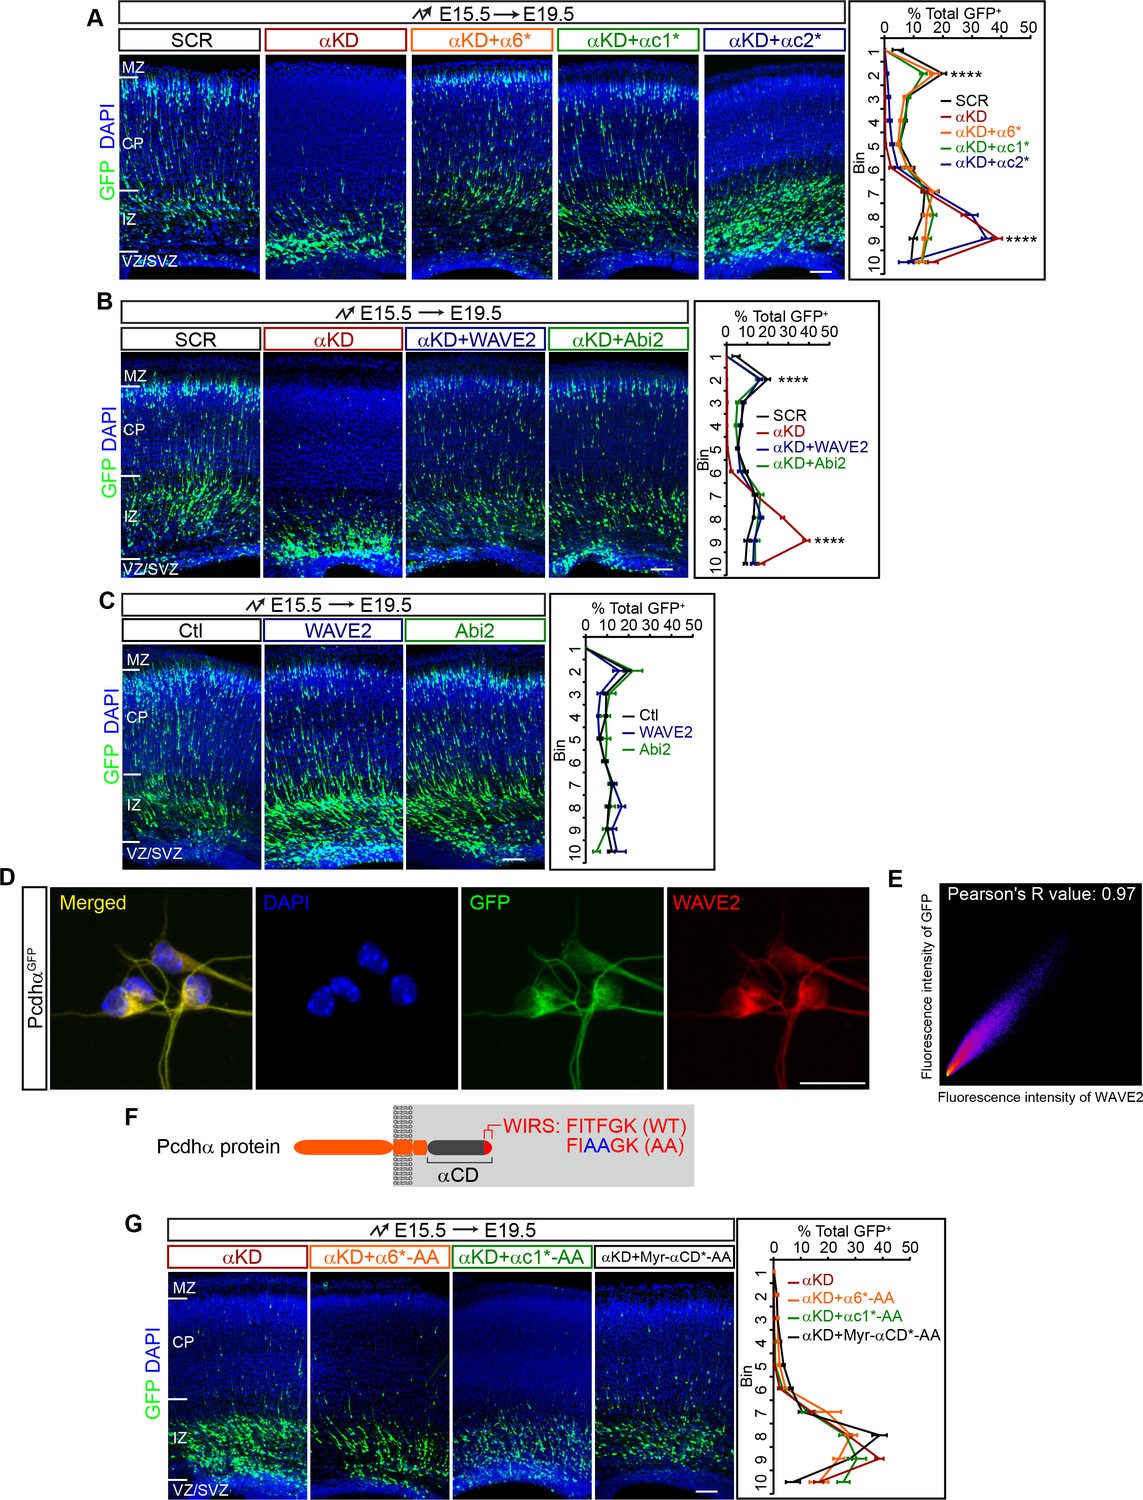
Pcdhα regulates cortical neuron migration through the WAVE complex.
(A–C) Cortical coronal sections of E19.5 embryonic brains electroporated at E15.5. Nuclei were counterstained with DAPI. Quantification of GFP+ cell distribution is shown on the right. n = 6 brains for each group. (D) Immunostaining for GFP and WAVE2 in primary cultured cortical neurons from E17.5 PcdhαGFP mice. Nuclei were counterstained with DAPI. (E) Two dimensional histogram of Pcdhα and WAVE2 fluorescence intensity in (D). Pearson's R value is analyzed with the ImageJ software. (F) Schematics of Pcdhα protein structure with the AA mutation of the WIRS motif. (G) Cortical coronal sections of E19.5 embryonic brains electroporated at E15.5. Nuclei were counterstained with DAPI. Quantification of GFP+ cell distribution is shown on the right. n = 6 brains for each group. Data as mean ± SEM. Statistical significance was assessed using one-way ANOVA, followed by a post hoc Tukey’s multiple comparisons test. ****p<0.0001. See Figure 2—source data 1. Scale bar, 50 μm for (D); 100 μm for all other panels. MZ, marginal zone; CP, cortical plate; IZ, intermediate zone; SVZ, subventricular zone; VZ, ventricular zone.
-
Figure 2—source data 1
Quantification source data for Figure 2.
- https://doi.org/10.7554/eLife.35242.010
Figure 2—figure supplement 1
Additional data for Pcdhα function in cortical neuron migration.
(A) Schematics of the Pcdhα isoforms, their Myr-ICDs, and Myr-αCD. ICD, intracellular domain; VCD, variable cytoplasmic domain; αCD, Pcdhα constant domain. Asterisk indicates shRNA-resistant. (B–D) E19.5 cortical coronal sections of embryonic brains electroporated at E15.5. Nuclei were counterstained with DAPI. Quantification of GFP+ cell distribution is shown on the right. n = 6 brains for each group. (E) Multiple sequence alignment of the variable cytoplasmic domain of members of Pcdhα family proteins. (F) Primary cultured cortical neurons, which were electroporated at E15.5 with both WIRS AA mutant and wild-type α6*, αc1* and Myr-αCD* plasmids and in-vitro cultured at E17.5 for 24 hr, were immunostained with an anti-Myc antibody. Neurons were counterstained with DAPI. Scale bar, 10 μm. Data as mean ± SEM. See Figure 2—figure supplement 1—source data 1. Scale bar, 100 μm. MZ, marginal zone; CP, cortical plate; IZ, intermediate zone, VZ, ventricular zone; SVZ, subventricular zone.
-
Figure 2—figure supplement 1—source data 1
Quantification source data for Figure 2—figure supplement 1.
- https://doi.org/10.7554/eLife.35242.011
Figure 3 with 1 supplement
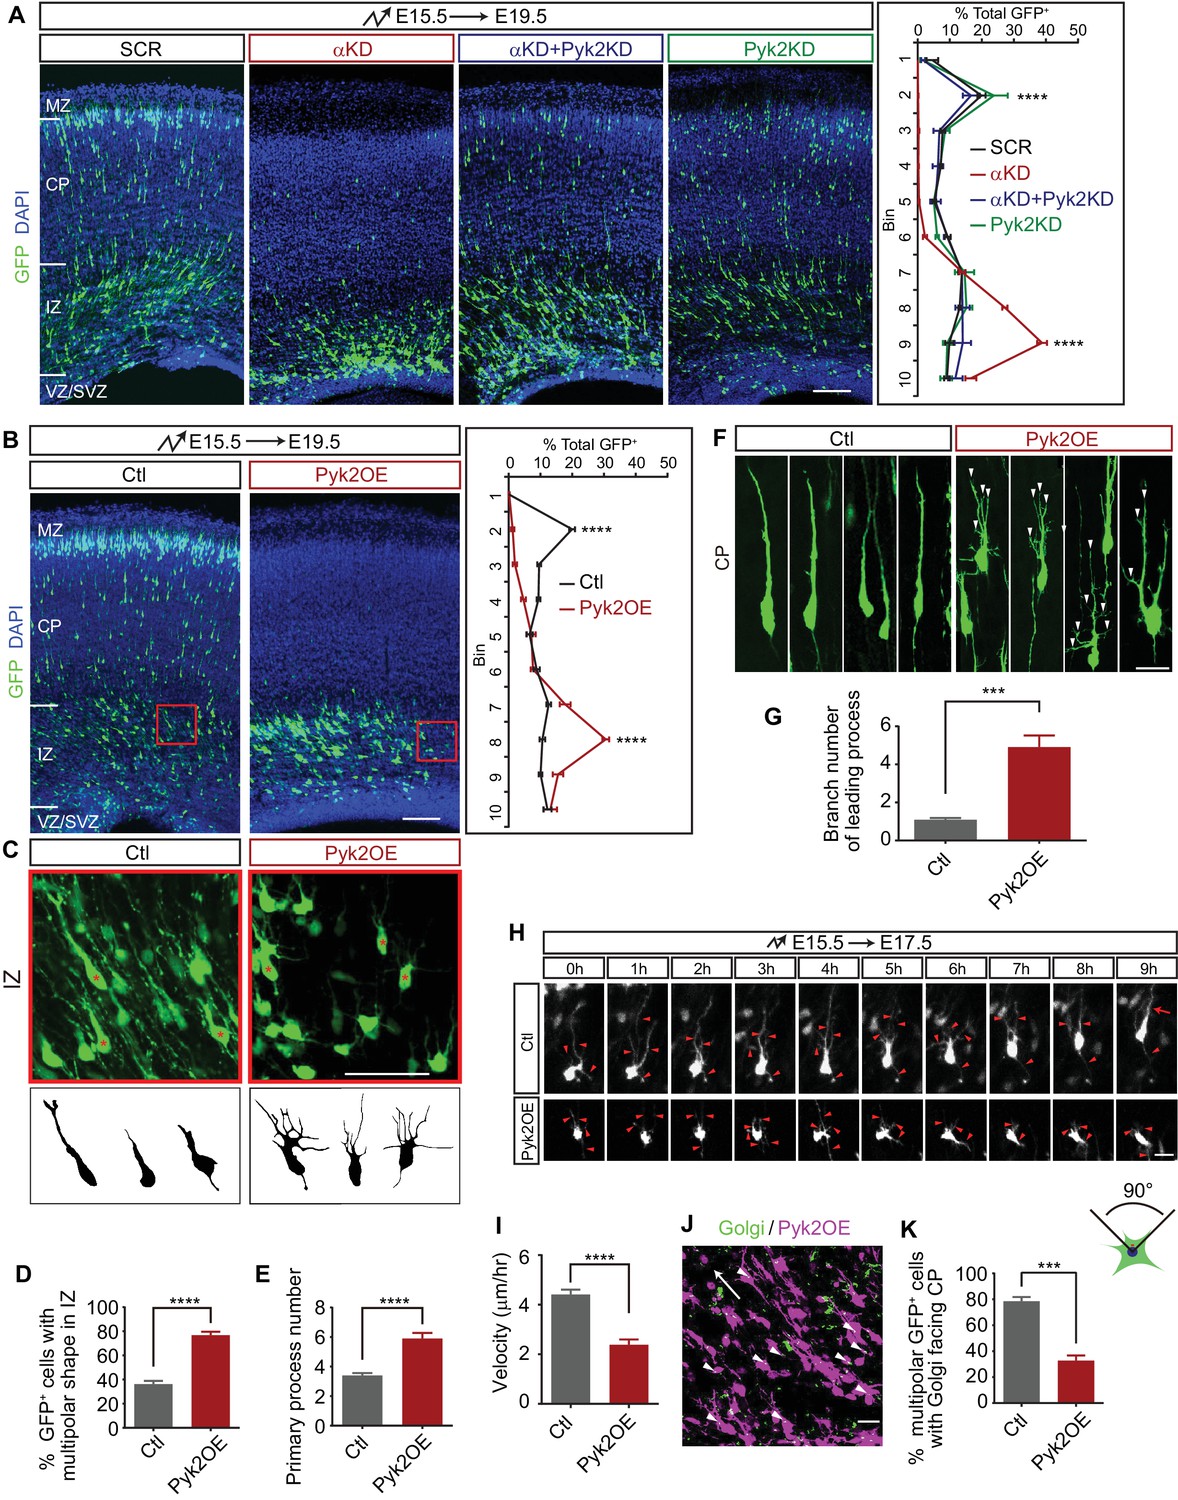
Pyk2 regulates cortical neuron migration.
(A) Cortical coronal sections of E19.5 embryonic brains electroporated at E15.5. Nuclei were counterstained with DAPI. Quantification of GFP+ cell distribution is shown on the right. n = 6 brains for each group. Statistical significance was assessed using one-way ANOVA, followed by a post hoc Tukey’s multiple comparisons test. (B) Cortical coronal sections of E19.5 embryonic brains electroporated at E15.5 with control or Pyk2-overexpressing (Pyk2OE) plasmids. Nuclei were counterstained with DAPI. Quantification of GFP+ cell distribution is shown on the right. n = 6 brains for each group. (C) High magnification of cortical neurons in the red boxes shown in (B). Lucida drawings are shown in the lower panels. (D) Percentage of GFP+ cells with multipolar morphology in IZ of control and Pyk2OE groups shown in (B). n = 6 brains for each group. (E) Primary process number per cell in IZ of control and Pyk2OE groups shown in (B). n = 10 cells for each group. (F) Typical cortical plate neuron morphology of control and Pyk2OE groups shown in (B). Arrowheads, aberrant branching leading processes. (G) Branch number of leading processes per cortical plate neuron of control and Pyk2OE groups shown in (F). n = 11 cells for each group. (H) Embryonic brains were electroporated in utero with control or Pyk2OE plasmids at E15.5. The organotypic slices are cut at E17.5. Representative frames from a 9 hr time-lapse are shown. Arrowheads, neurites; Arrow, leading process. See also Video 2. (I) Quantification of the migration velocity of control and Pyk2OE neurons. n = 19 cells for each group. (J) Golgi staining (green, arrowheads) of Pyk2OE neurons (magenta) in IZ at E19.5. Arrow indicates the orientation to CP. (K) Percentage of cells with Golgi facing the CP of control and Pyk2OE groups. n = 3 sections for each group. Data as mean ± SEM. Student’s t test for (B), (D), (E), (G), (I), (K); ***p<0.001; ****p<0.0001. See Figure 3—source data 1. Scale bar, 100 μm for (A, B); 50 μm for (C); 20 μm for all other panels. MZ, marginal zone; CP, cortical plate; IZ, intermediate zone; SVZ, subventricular zone; VZ, ventricular zone.
-
Figure 3—source data 1
Quantification source data for Figure 3.
- https://doi.org/10.7554/eLife.35242.014
Figure 3—figure supplement 1
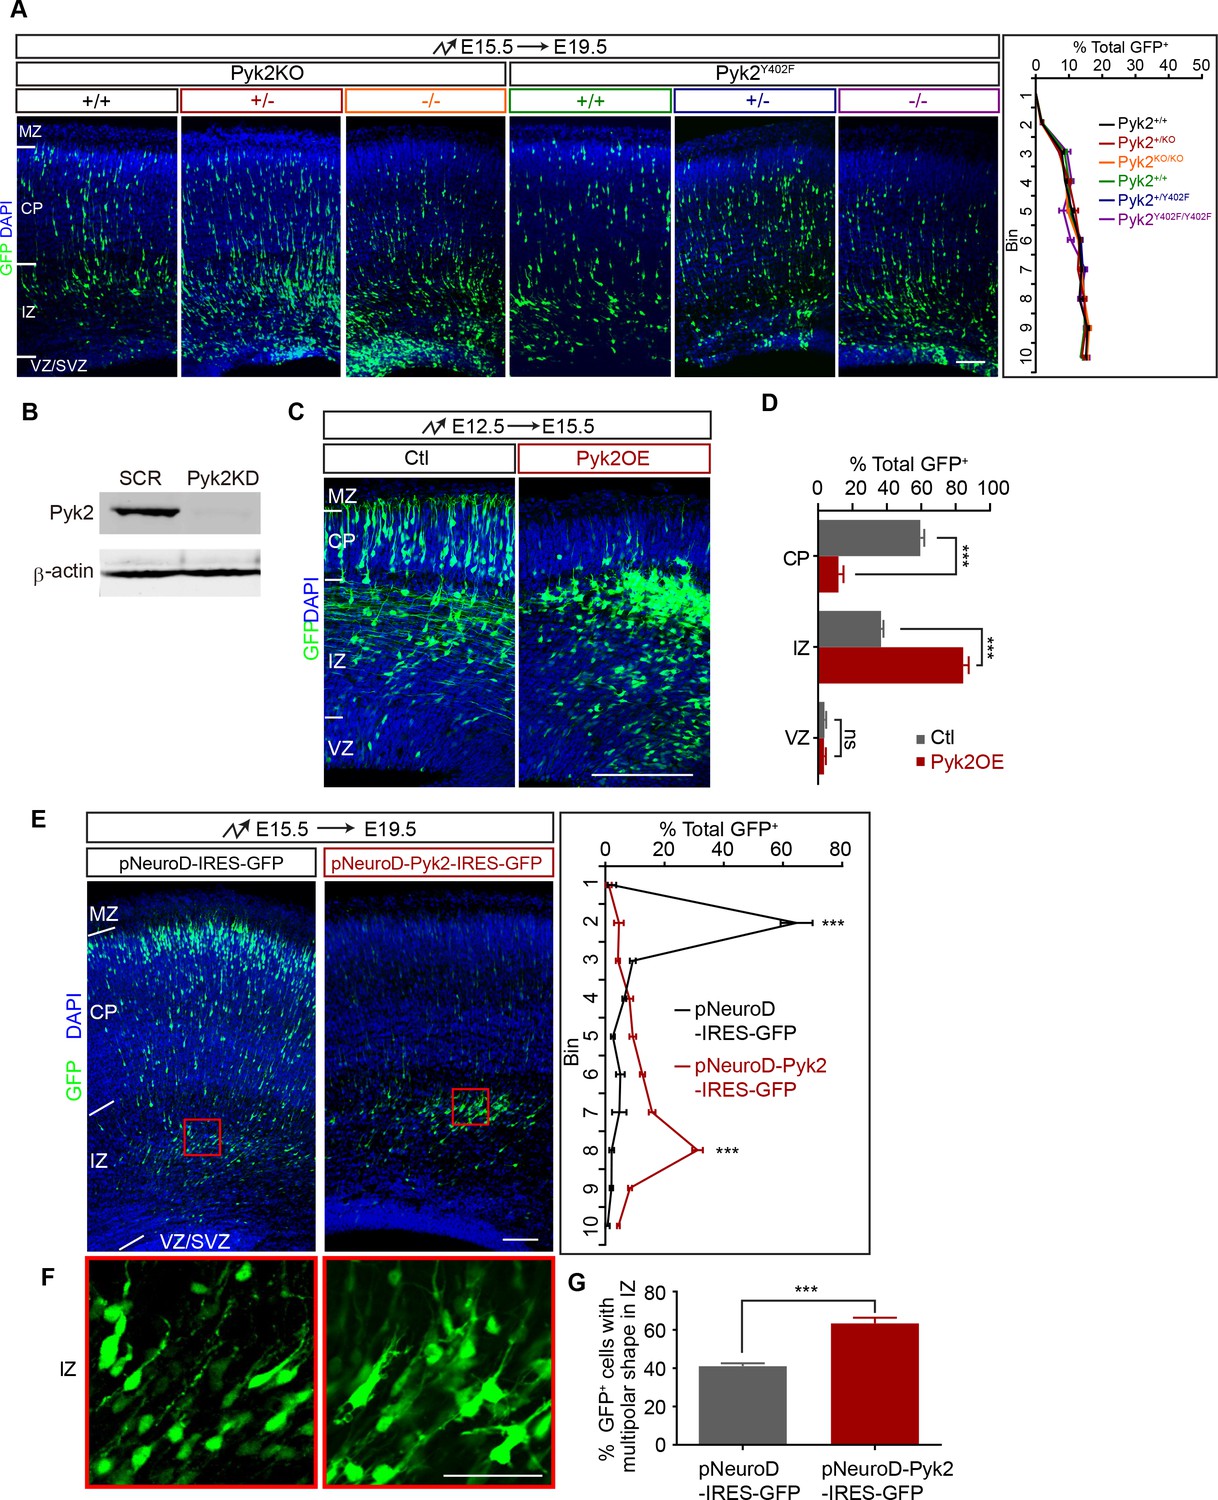
Additional data for Pyk2 function in cortical neuron migration.
(A) E19.5 cortical coronal sections of embryonic brains (electroporated at E15.5 with GFP) of the Pyk2KO and Pyk2Y402F mouse lines generated by CRISPR. Nuclei were counterstained with DAPI. Quantification of GFP+ cell distribution is shown on the right. n = 6 brains for each group. (B) Western blot and its quantification of lysates of 293 T cells transfected with control or Pyk2KD plasmids. (C) Cortical coronal sections of E15.5 embryonic brains electroporated at E12.5 with control or Pyk2OE plasmids. Nuclei were counterstained with DAPI. (D) Quantification of GFP+ cell distribution in the CP, IZ, and VZ regions shown in C). n = 3 brains for each group. (E) Cortical coronal sections of E19.5 embryonic brains electroporated at E15.5 with plasmids under the control of the NeuroD promoter. Sections were immunostained with GFP and nuclei were counterstained with DAPI. Quantification of GFP+ cell distribution is shown on the right. n = 6 brains for each group. (F) High magnification of cortical neurons in the red boxes shown in (E). (G) Percentage of multipolar neurons in the IZ region. n = 6 brains for each group. Data as mean ± SEM. Student’s t test; ns, not significant; ***p<0.001. See Figure 3—figure supplement 1—source data 1. Scale bar, 100 μm. MZ, marginal zone; CP, cortical plate; IZ, intermediate zone, VZ, ventricular zone; SVZ, subventricular zone.
-
Figure 3—figure supplement 1—source data 1
Quantification source data for Figure 3—figure supplement 1.
- https://doi.org/10.7554/eLife.35242.015
Figure 4 with 1 supplement
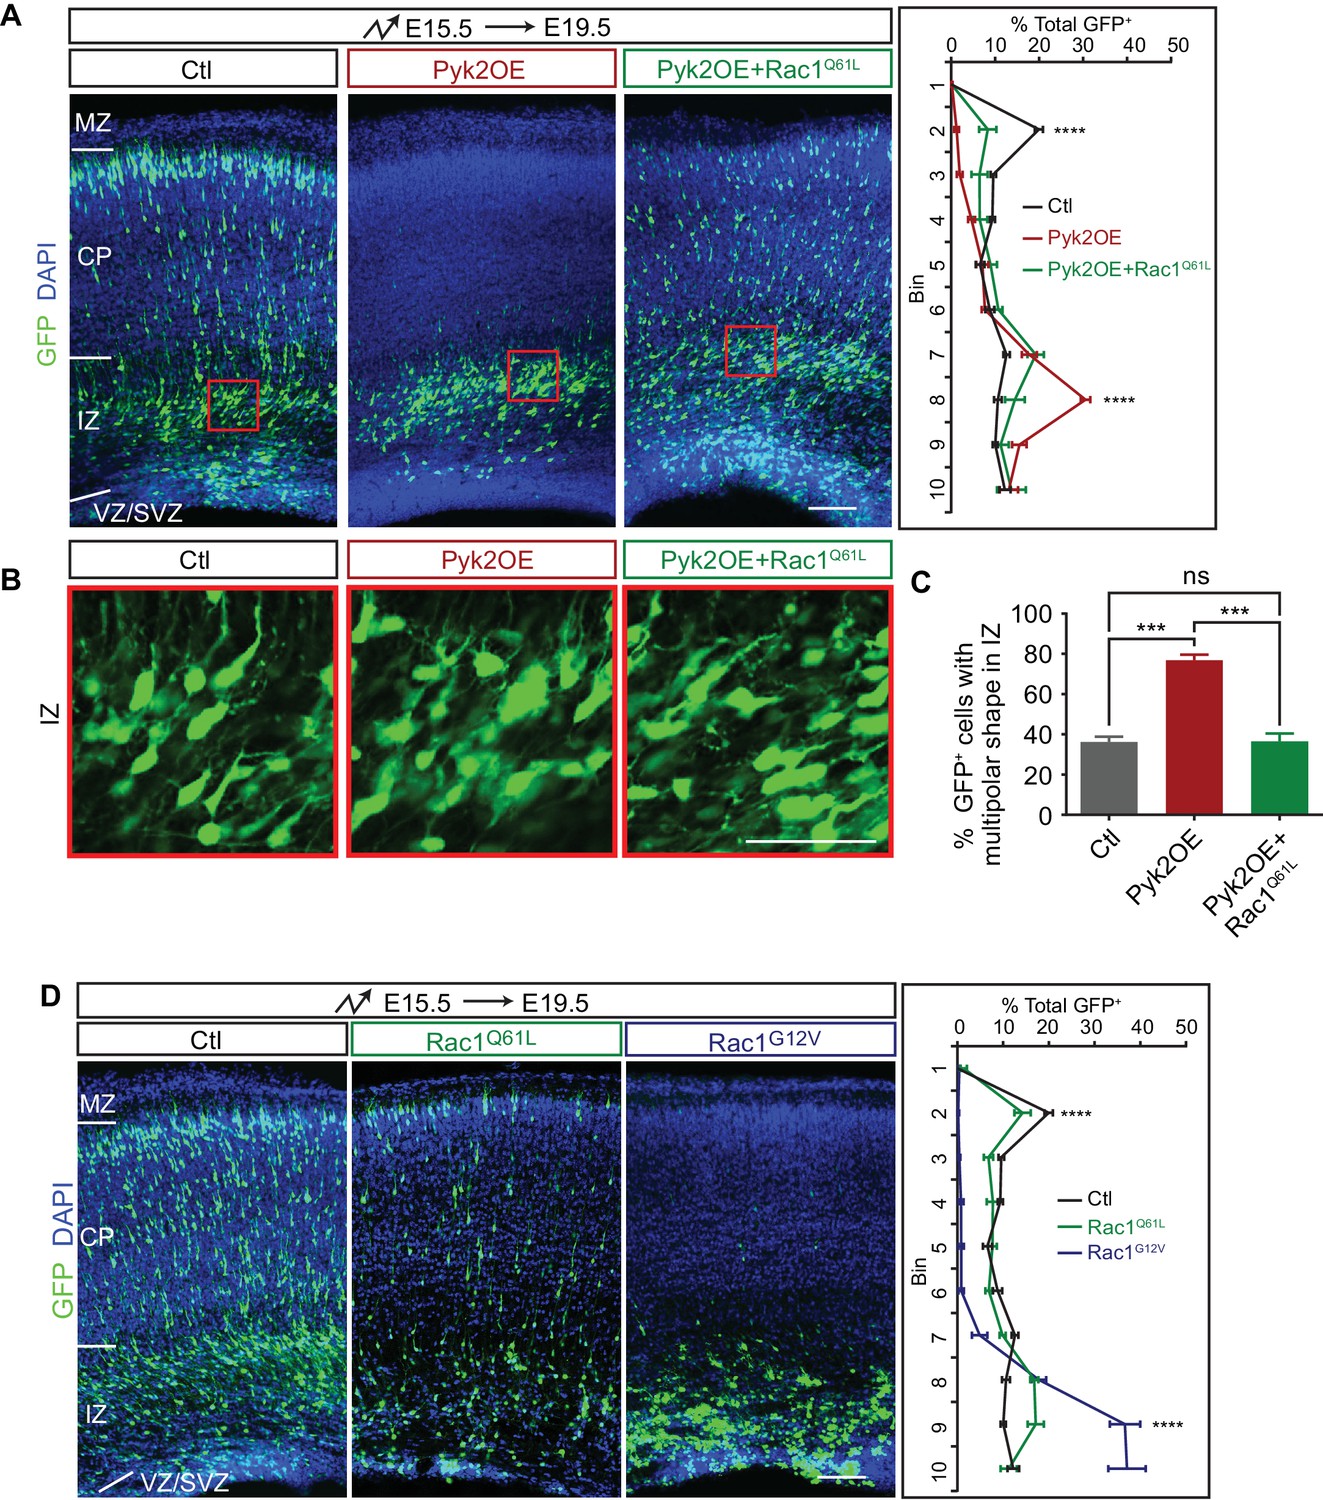
Pyk2 regulates cortical neuron migration through Rac1 inhibition.
(A) Cortical coronal sections of E19.5 embryonic brains electroporated in utero at E15.5. Nuclei were counterstained with DAPI. Quantification of GFP+ cell distribution is shown on the right. n = 6 brains for each group. (B) High magnification of cortical neurons in the red boxes shown in (A). (C) Percentage of multipolar neurons in the IZ region. n = 6 brains for each group. (D) Cortical coronal sections of E19.5 embryos electroporated at E15.5. Nuclei were counterstained with DAPI. Quantification of GFP+ cell distribution is shown on the right. n = 6 brains for each group. Data as mean ± SEM. Statistical significance was assessed using one-way ANOVA, followed by a post hoc Tukey’s multiple comparisons test. ns, not significant; ***p<0.001; ****p<0.0001. See Figure 4—source data 1. Scale bar, 50 μm for (B); 100 μm for other panels. MZ, marginal zone; CP, cortical plate; IZ, intermediate zone; SVZ, subventricular zone; VZ, ventricular zone.
-
Figure 4—source data 1
Quantification source data for Figure 4.
- https://doi.org/10.7554/eLife.35242.019
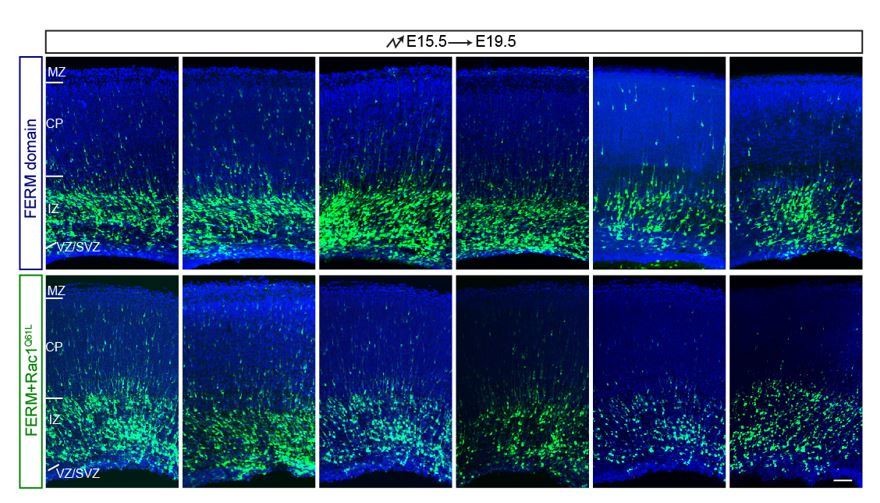
Figure 4—figure supplement 1
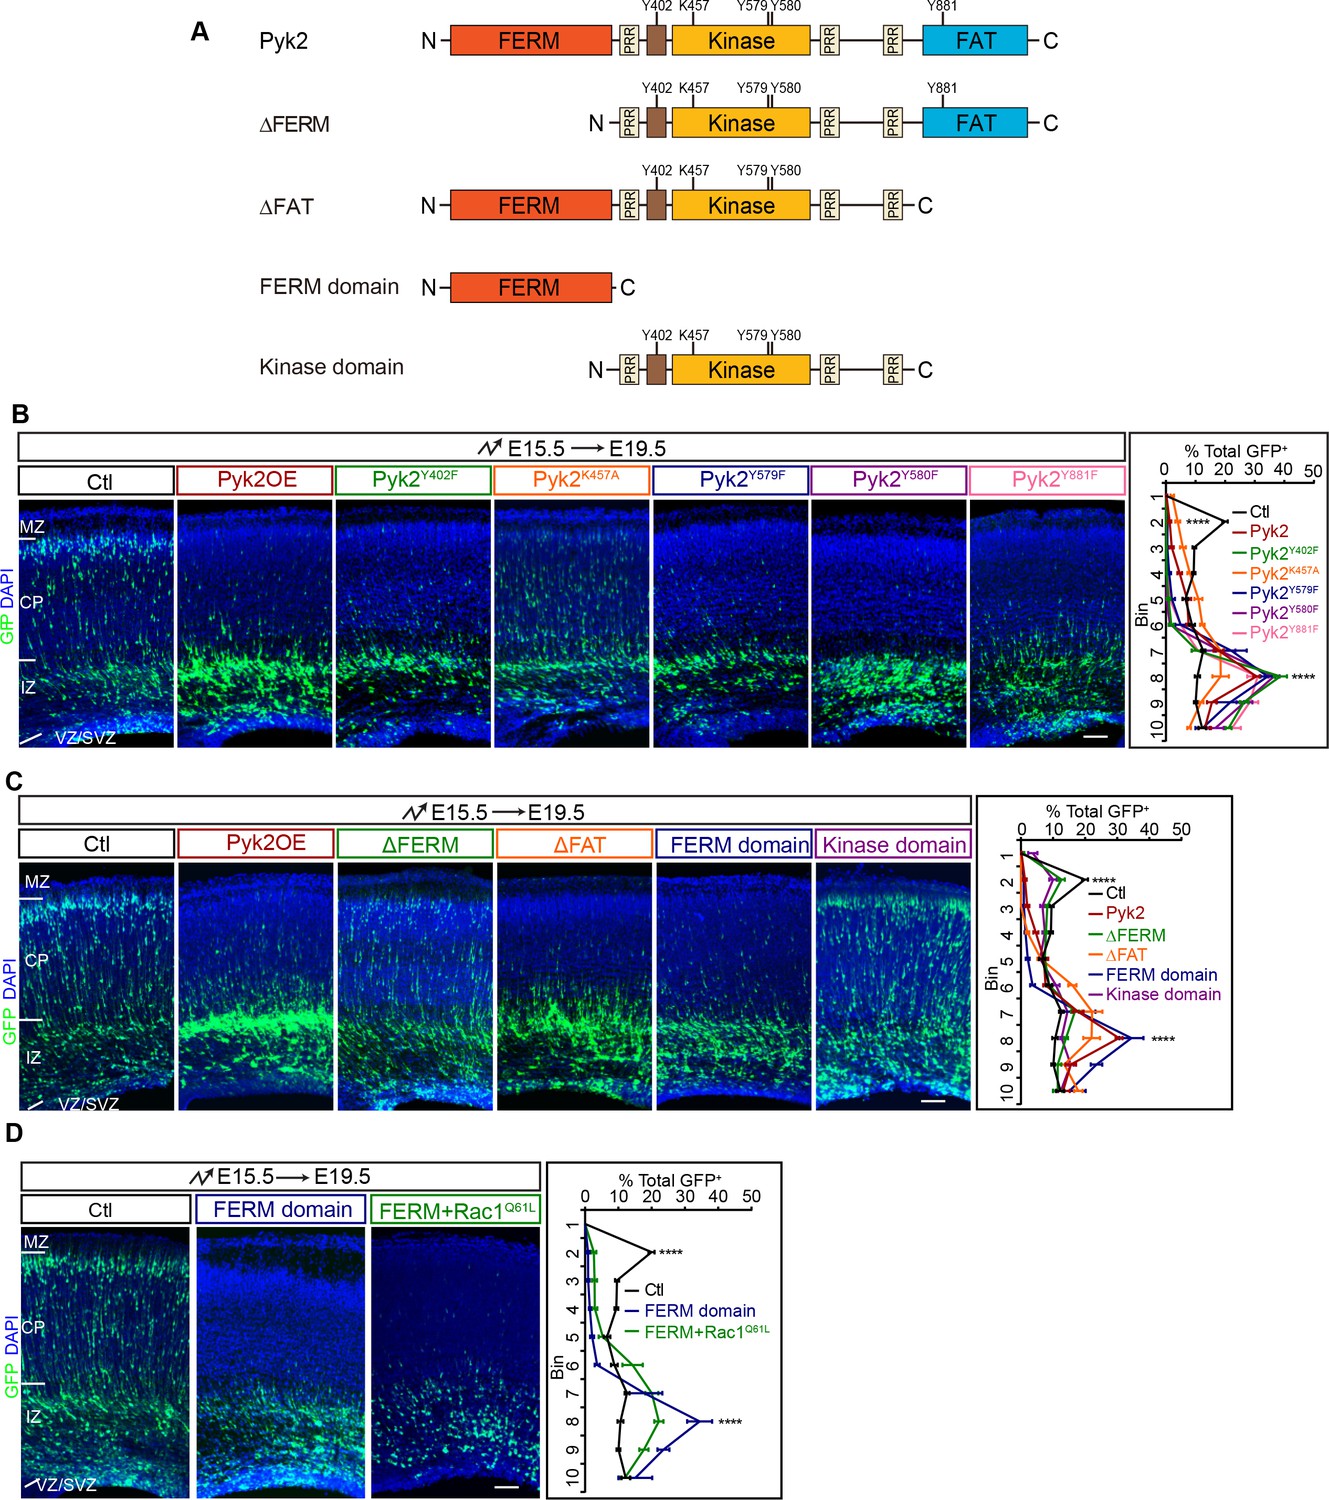
Analyses of Pyk2-domain requirement in cortical neuron migration.
(A) Schematics of Pyk2 domain structure and its mutants: ΔFERM, ΔFAT, FERM domain and Kinase domain. Y402, K457, Y579, Y580, and Y881 amino acid residues are indicated. PRR, proline-rich region. (B–D) Cortical coronal sections of E19.5 embryonic brains electroporated at E15.5. Nuclei were counterstained with DAPI. Quantification of GFP+ cell distribution is shown on the right. n = 6 brains for each group. Data as mean ± SEM. Student’s t test; ****p<0.0001. See Figure 4—figure supplement 1—source data 1. Scale bar, 100 μm. MZ, marginal zone; CP, cortical plate; IZ, intermediate zone, VZ, ventricular zone; SVZ, subventricular zone.
-
Figure 4—figure supplement 1—source data 1
Quantification source data for Figure 4—figure supplement 1.
- https://doi.org/10.7554/eLife.35242.020
Figure 5 with 1 supplement
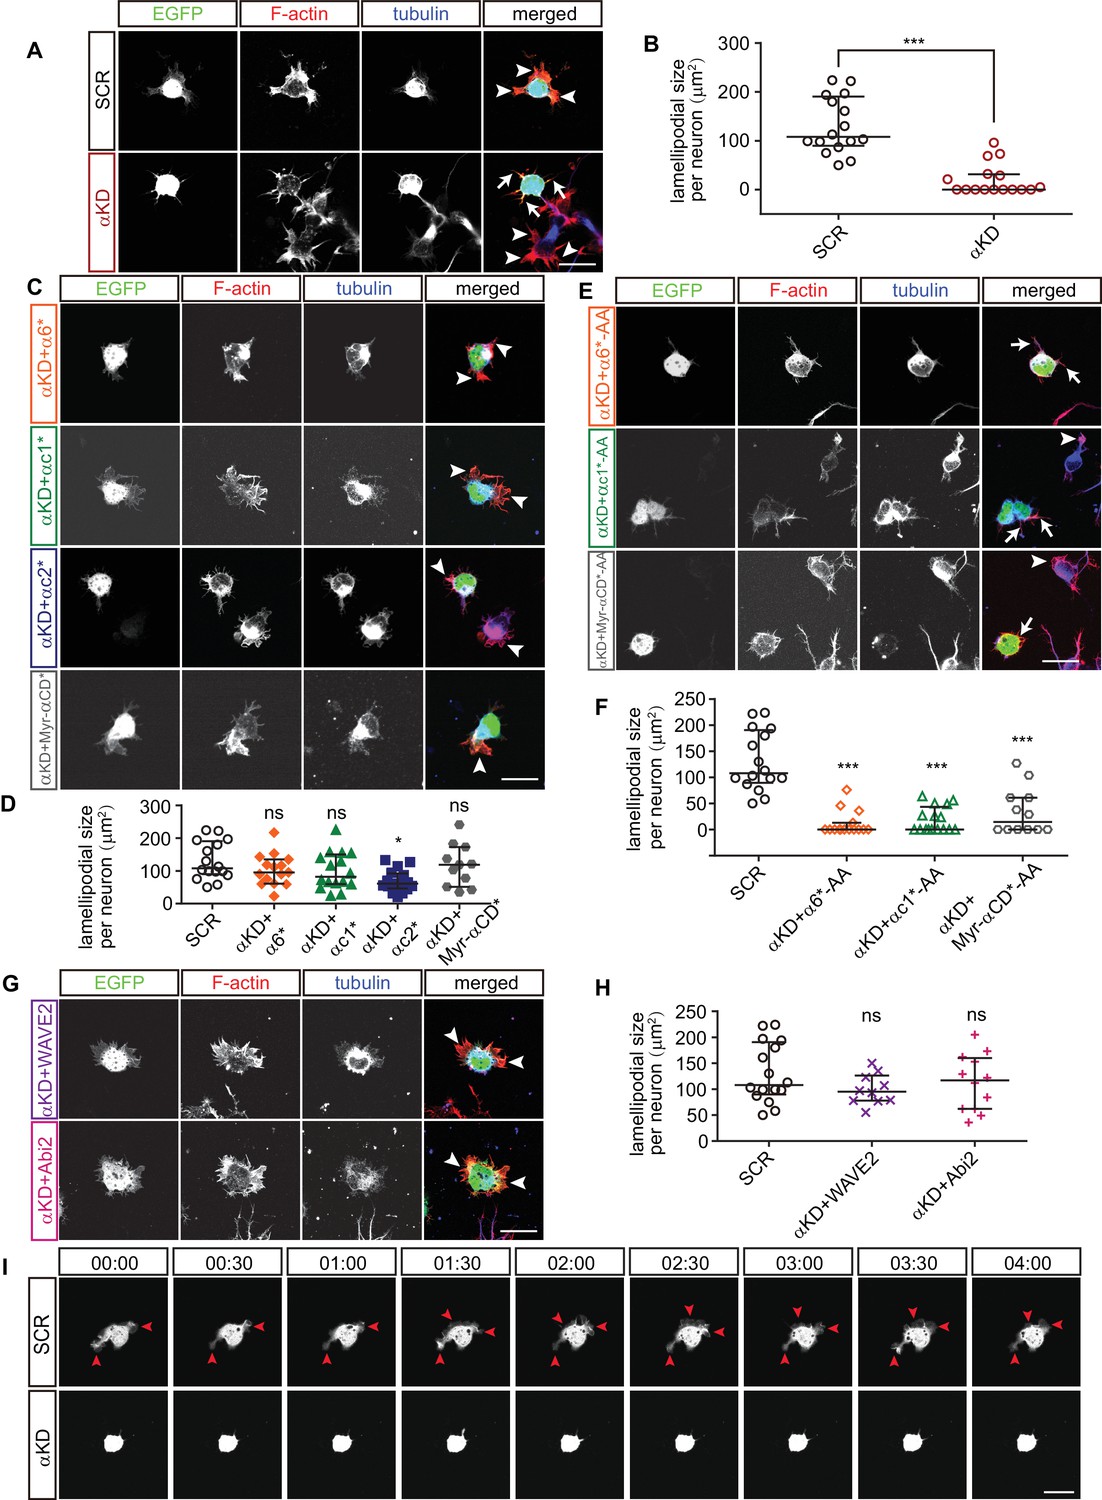
Pcdhα regulates lamellipodial dynamics.
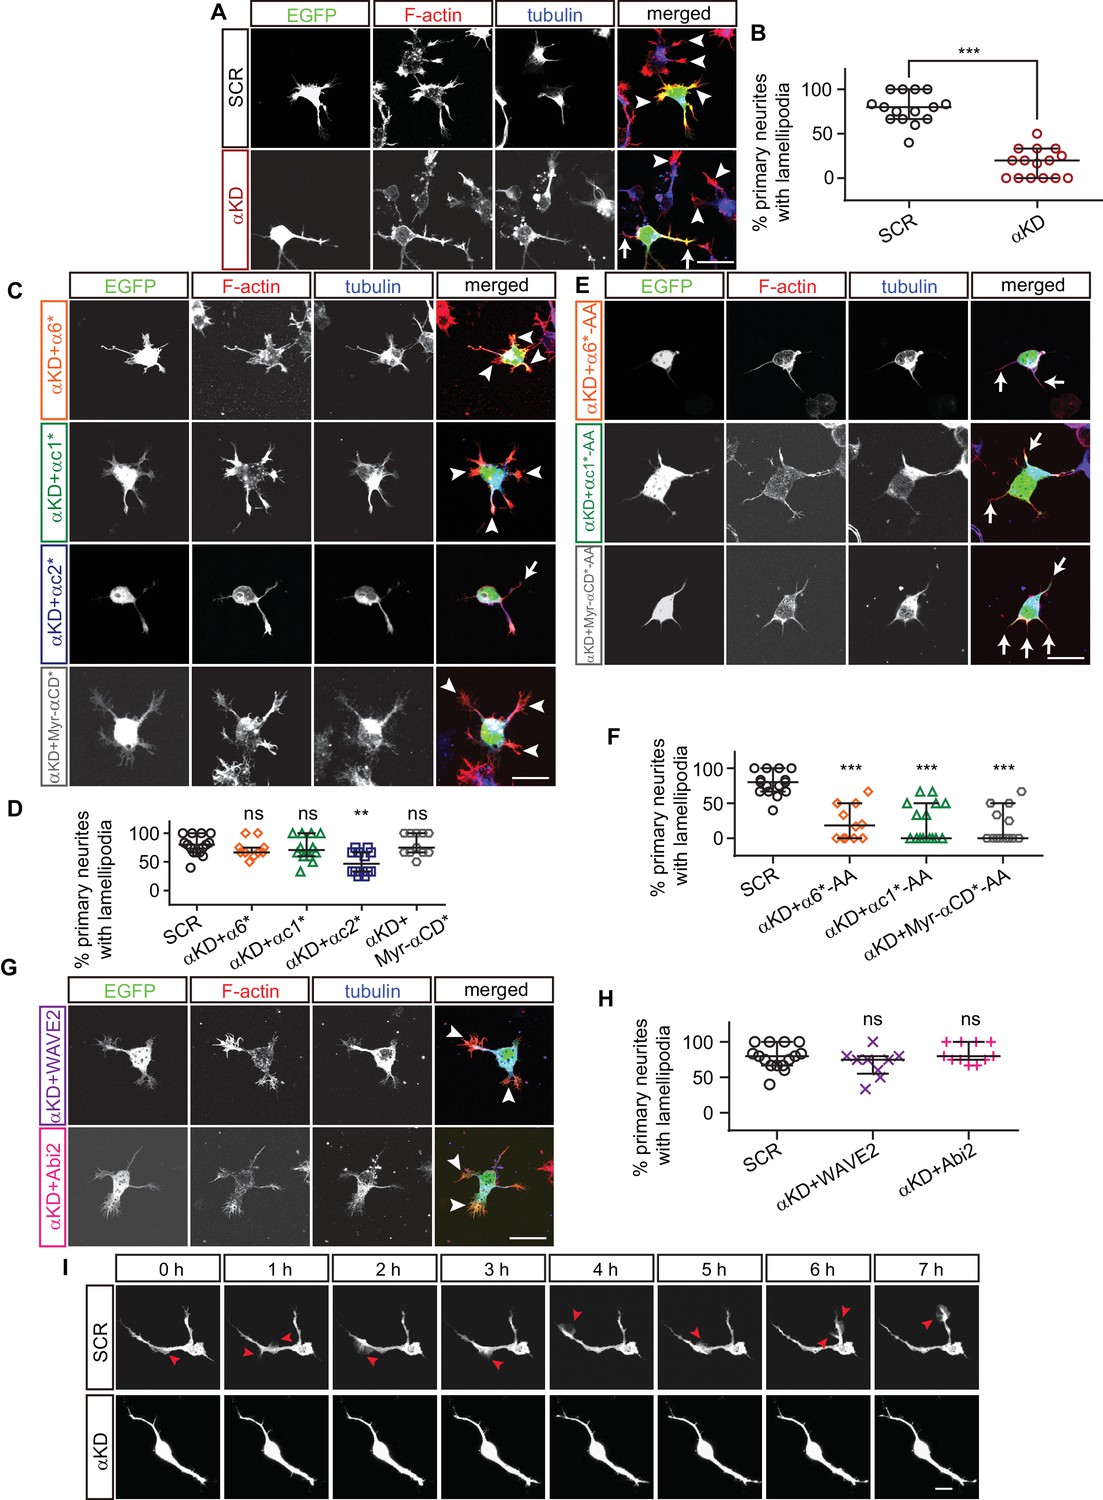
(A, C, E, G) Primary cultured cortical neurons from E17.5 embryonic cortices, electroporated at E15.5, were in-vitro cultured for 24 hr, immunostained by Tuj1 antibody for tubulin and counterstained with phalloidin for F-actin. Arrowheads, lamellipodia; Arrows, defective lamellipodia. (B, D, F, H) Quantification of lamellipodial size per neuron shown in (A), (C), (E), (G). n = 16 cells for SCR, αKD, αKD+αc1*, αKD+αc1*-AA, and αKD+αc2*; n = 15 cells for αKD+α6*, αKD+α6*-AA; n = 12 cells for αKD + Myr-αCD*-AA, αKD + Abi2; n = 11 cells for αKD + Myr-αCD*; n = 10 cells for αKD + WAVE2. (I) Representative frames from time-lapse imaging of primary cortical neurons cultured in vitro for 24 hr. See also Video 3. Arrowheads, lamellipodia. All data are presented as a scatter-dot plot. The median is shown as a line with the interquartile range. Student’s t test for (A). For (D), (F), (H), statistical significance was assessed using one-way ANOVA, followed by a post hoc Tukey’s multiple comparisons test. ***p<0.001; ns, not significant. See Figure 5—source data 1. Scale bar, 10 μm.
-
Figure 5—source data 1
Quantification source data for Figure 5.
- https://doi.org/10.7554/eLife.35242.023
Figure 5—figure supplement 1
Pcdhα is required for lamellipodial formation in stage 2 primary cultured cortical neurons.
(A, C, E, G) Primary cultured cortical neurons from E17.5 embryonic cortices electroporated at E15.5 were in-vitro cultured for 24 hr, immunostained by Tuj1 antibody for tubulin and counterstained with phalloidin for F-actin. Arrowheads, lamellipodia; Arrows, defective lamellipodia. (B, D, F, H) Percentage of primary neurites with lamellipodia per stage 2 neuron. n = 15 cells for SCR, aKD, αKD+αc1*-AA; n = 12 cells for αKD+α6*, αKD+α6*-AA, αKD+αc1* and αKD+αc2*; n = 11 cells for αKD + Myr-αCD, αKD + Abi2; n = 14 cells for αKD + Myr-αCD*-AA; n = 9 cells for αKD + WAVE2. (I) Representative frames from time-lapse imaging of primary cultured cortical neurons, which were from the embryonic brain electroporated with control or αKD plasmids at E15.5, dissected at E17.5 and in vitro cultured for 24 hr. Arrowheads, lamellipodia. See also Video 4. All data are presented as a scatter-dot plot. The median is shown as a line with the interquartile range. Student’s t test for (B). For (D), (F), (H), statistical significance was assessed using one-way ANOVA, followed by a post hoc Tukey’s multiple comparisons test. ***p<0.001; ns, not significant. See Figure 5—figure supplement 1—source data 1. Scale bar, 10 μm.
-
Figure 5—figure supplement 1—source data 1
Quantification source data for Figure 5—figure supplement 1.
- https://doi.org/10.7554/eLife.35242.024
Figure 6 with 1 supplement
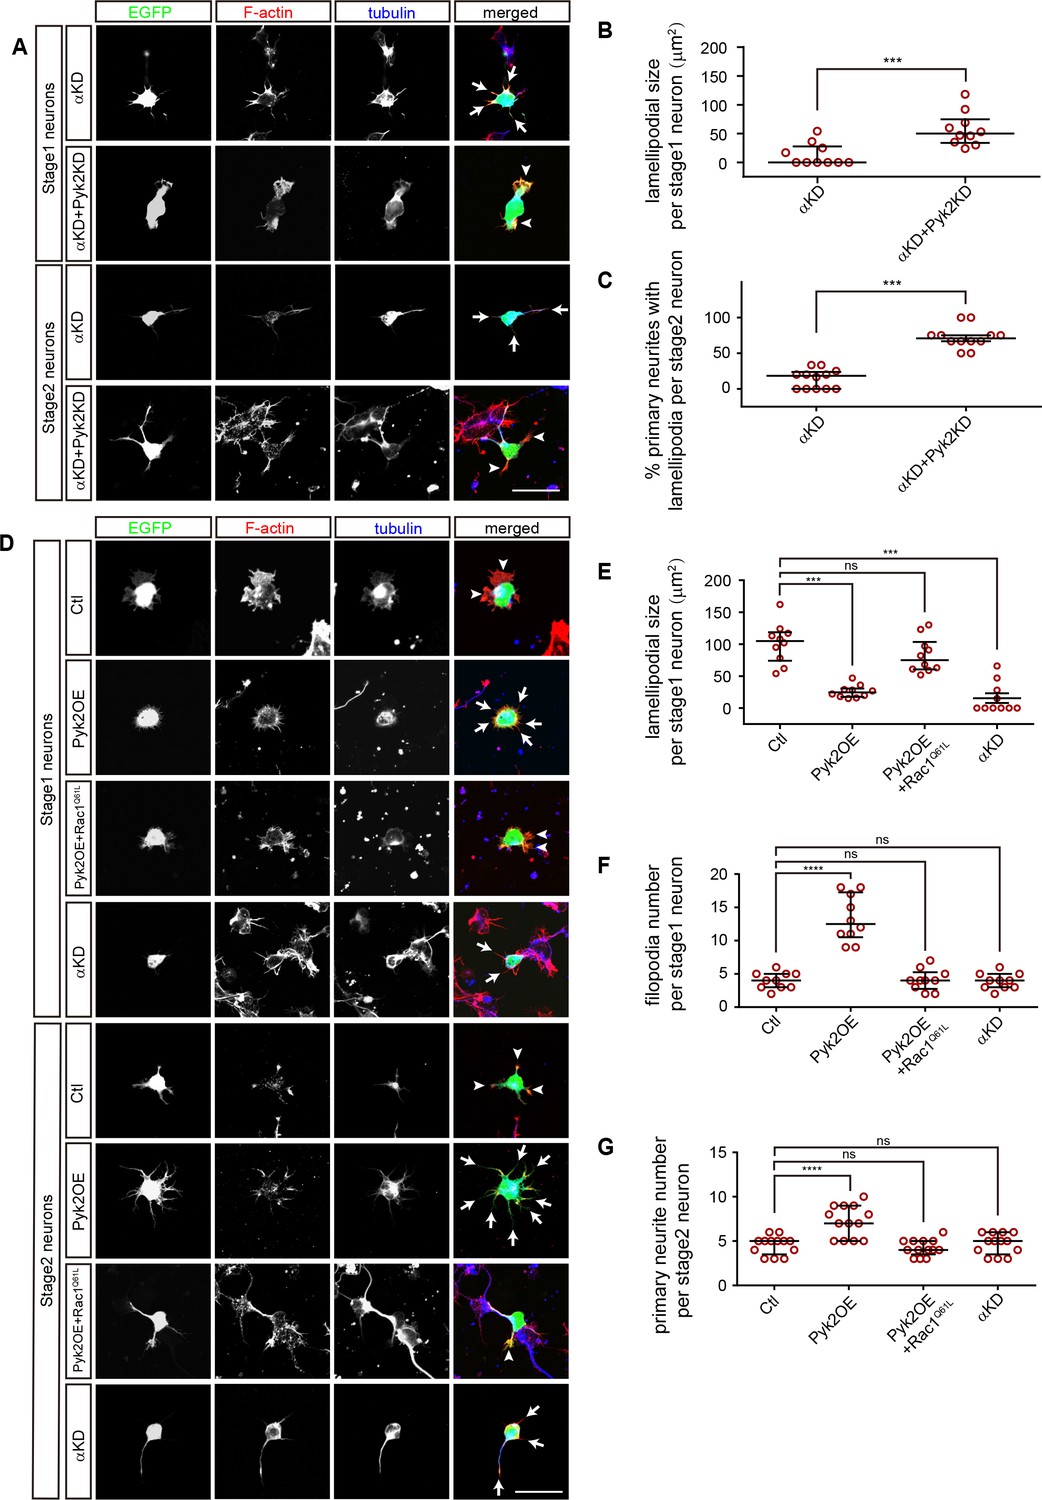
A comparison between PcdhαKD and Pyk2OE in cytoskeletal dynamics.
(A) Primary cultured cortical neurons, derived from E17.5 embryonic cortices which were electroporated at E15.5 with αKD or αKD + Pyk2 KD plasmids, were in-vitro cultured for 24 hr and immunostained by a Tuj1 antibody for tubulin, counterstained with phalloidin for F-actin. Arrowheads, lamellipodia; Arrows, defective lamellipodia. (B) Quantification of lamellipodial size per stage 1 neuron shown in A). Student’s t test; n = 10 cells for both groups. (C) Percentage of primary neurites with lamellipodia per stage 2 neuron. Student’s t test; n = 12 cells for both groups. (D) Primary cultured cortical neurons, derived from E17.5 embryonic cortices which were electroporated at E15.5 with indicated plasmids, were in-vitro cultured for 24 hr and immunostained by a Tuj1 antibody for tubulin, counterstained with phalloidin for F-actin. Arrowheads, lamellipodia; Arrows, filopodia. (E) Quantification of lamellipodial size per stage1 neuron shown in (D). Statistical significance was assessed using one-way ANOVA, followed by a post hoc Tukey’s multiple comparisons test. n = 10 cells for each group. (F) Quantification of filopodial number per stage 1 neuron shown in (D). Statistical significance was assessed using one-way ANOVA, followed by a post hoc Tukey’s multiple comparisons test. n = 10 cells for each group. (G) Quantification of primary neurite number per stage 2 neuron shown in (D). Statistical significance was assessed using one-way ANOVA, followed by a post hoc Tukey’s multiple comparisons test. n = 13 cells for each group. All data are presented as a scatter-dot plot. The median is shown as a line with the interquartile range. ****p<0.0001; ***p<0.001; ns, not significant. See Figure 6—source data 1. Scale bar, 10 μm.
-
Figure 6—source data 1
Quantification source data for Figure 6.
- https://doi.org/10.7554/eLife.35242.029
Figure 6—figure supplement 1
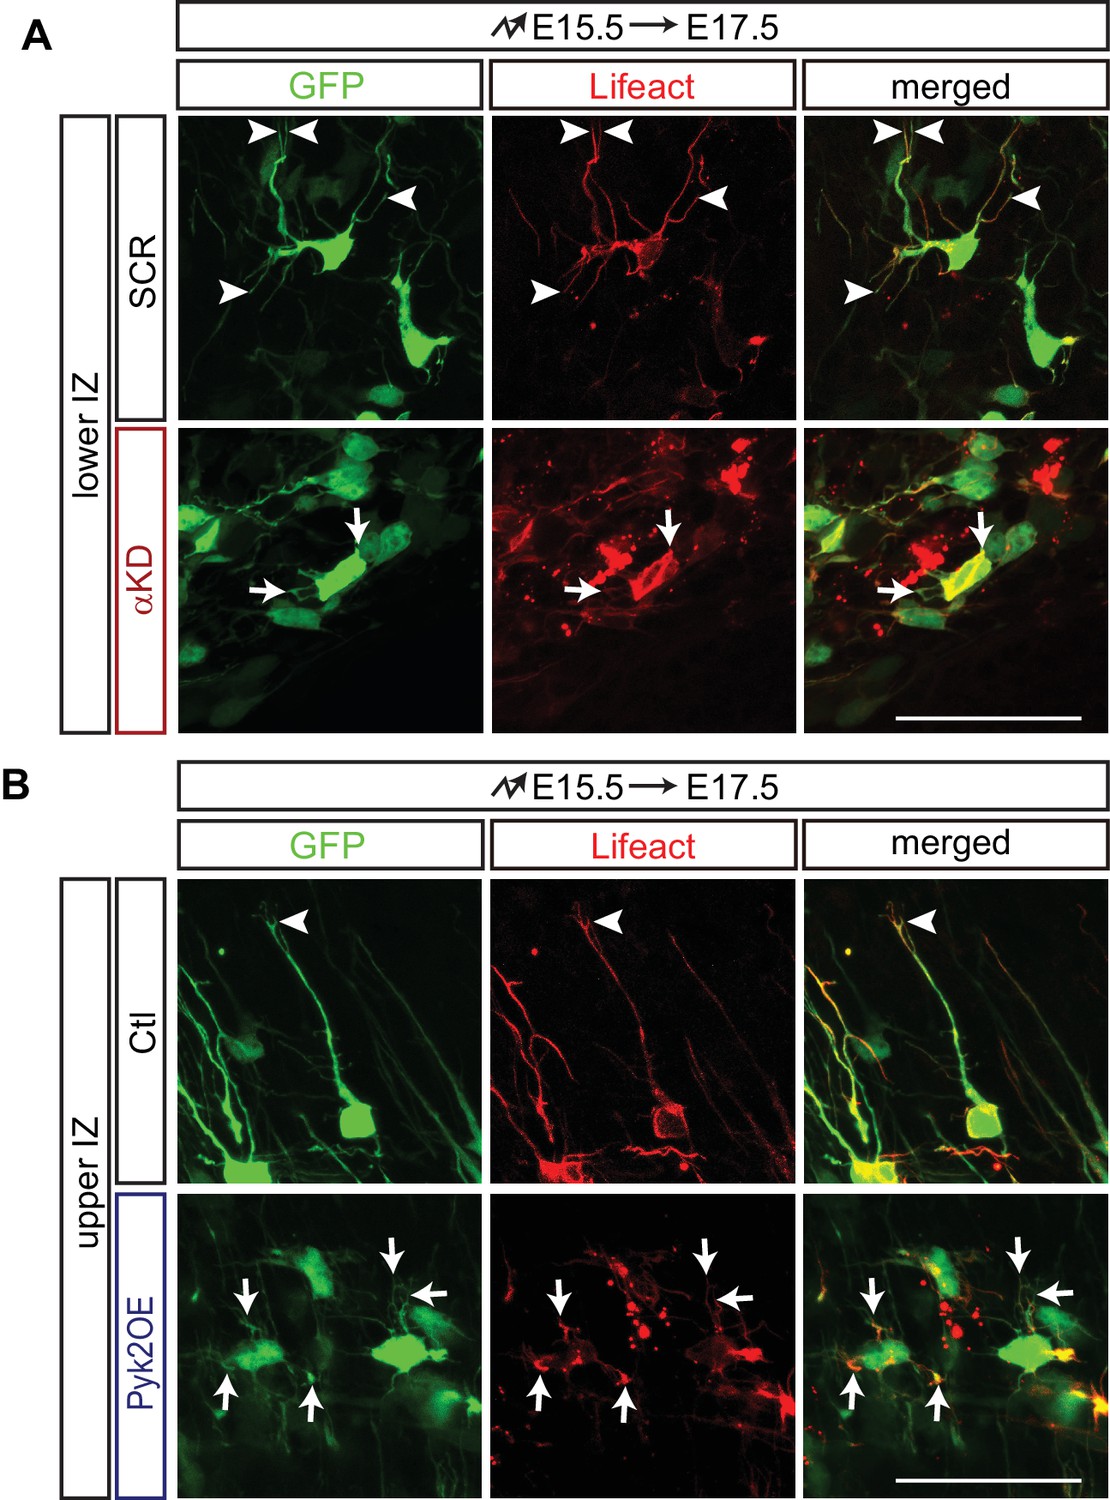
Lifeact-labeled actin cytoskeletal structures in vivo.
(A) Lower IZ region of cortical coronal sections from E17.5 embryos electroporated at E15.5 with SCR or αKD plasmids, pCAG-Lifeact-mCherry plasmids were co-electroporated to label the F-actin cytoskeletal structures. (B) Upper IZ region of cortical coronal sections from E17.5 embryos electroporated at E15.5 with control or Pyk2OE plasmids, pCAG-Lifeact-mCherry plasmids were co-electroporated to label the F-actin cytoskeletal structures. Scale bar, 50 μm.
Figure 7 with 1 supplement

A working model of WAVE clustering by protocadherins for actin cytoskeletal dynamics and cortical neuron migration as well as dendrite morphogenesis.
On the neuron surface, Pcdhα family proteins recruit WAVE complex to the plasma membrane via the WIRS motif in the Pcdhα constant domain. In addition, Pcdhα proteins also bind to the Pyk2 kinase and inactivate it, thus disinhibits the small GTPase Rac1. The disinhibited Rac1 activates the WAVE complex by inducing a conformation change to release the VCA domains, which are required to activate actin-nucleation by the Arp2/3 complex, leading to actin filament branching as well as lamellipodial and filopodial formation. Finally, this protocadherin Pyk2/Rac1/WAVE axis is central for actin cytoskeletal dynamics and cortical neuron migration. The distinct variable cytoplasmic domain of Pcdhαc2 may cause it non-functional for cortical neuron migration. This WAVE clustering model may be a general mechanism for diverse functions of alpha protocadherins in dendrite self-avoidance and neuronal self/nonself recognition as well as dendrite morphogenesis as demonstrated by Sholl analyses (Figure 7—figure supplement 1).
Figure 7—figure supplement 1
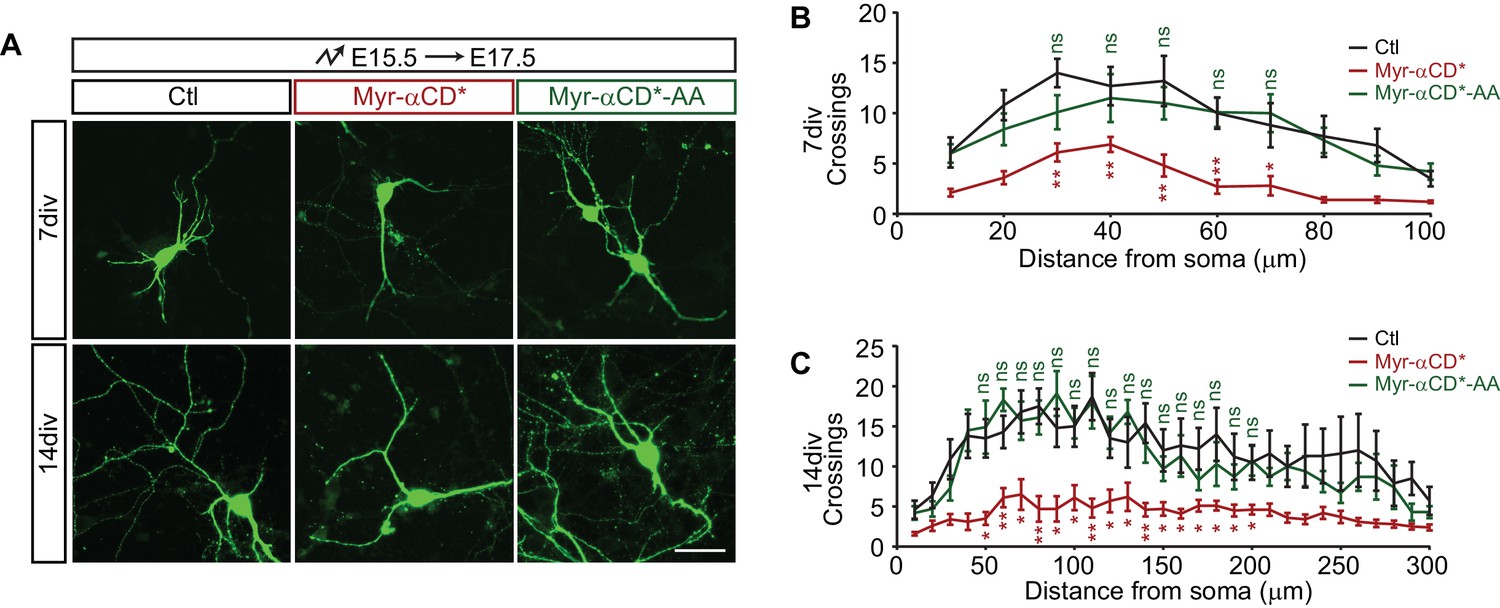
Sholl analysis for protocadherin WAVE-interacting sequence motif in dendrite morphogenesis.
(A) Primary cultured cortical neurons, electroporated at E15.5 with Control (Ctl), Myr-αCD*, or Myr-αCD*-AA plasmids, were in-vitro cultured at E17.5 for 7 days and 14 days. Scale bar, 50 μm. (B–C) Sholl analysis of 7-div (days in vitro) and 14-div cultured neurons. Statistical significance was assessed using one-way ANOVA, followed by a post hoc Tukey’s multiple comparisons test. Data as mean ± SEM. n = 10 cells for each group; **p<0.01; *p<0.1; ns, not significant. See Figure 7—figure supplement 1—source data 1.
-
Figure 7—figure supplement 1—source data 1
Quantification source data for Sholl analyses.
- https://doi.org/10.7554/eLife.35242.032
Author response image 1
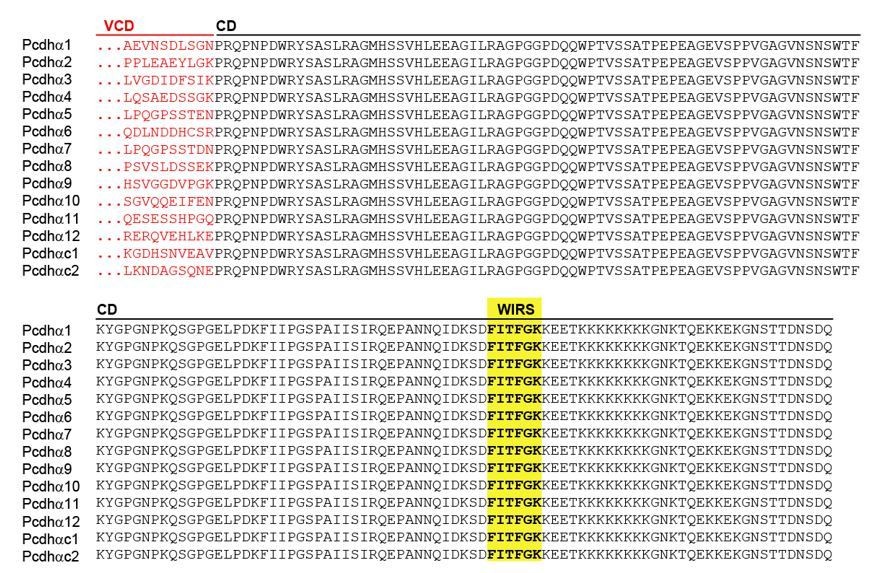
The WIRS motif is in the common cytoplasmic constant domain (CD) of Pcdhα proteins.
https://doi.org/10.7554/eLife.35242.036
Author response image 2
Rac1Q61L cannot rescue the blocking activity of FERM domain.
https://doi.org/10.7554/eLife.35242.037
Author response image 3
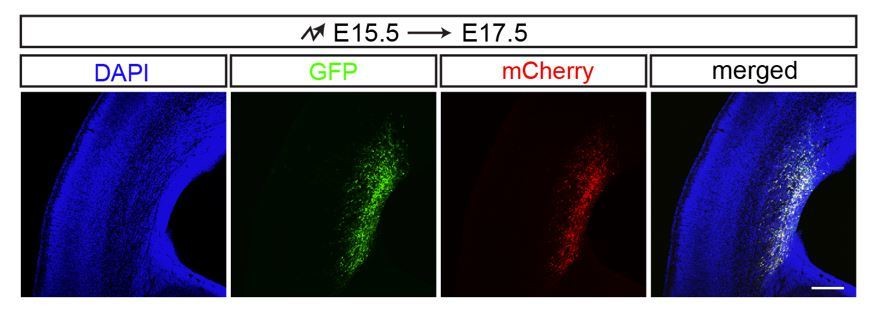
GFP and mCherry co-electroporation.
https://doi.org/10.7554/eLife.35242.038
Author response image 4
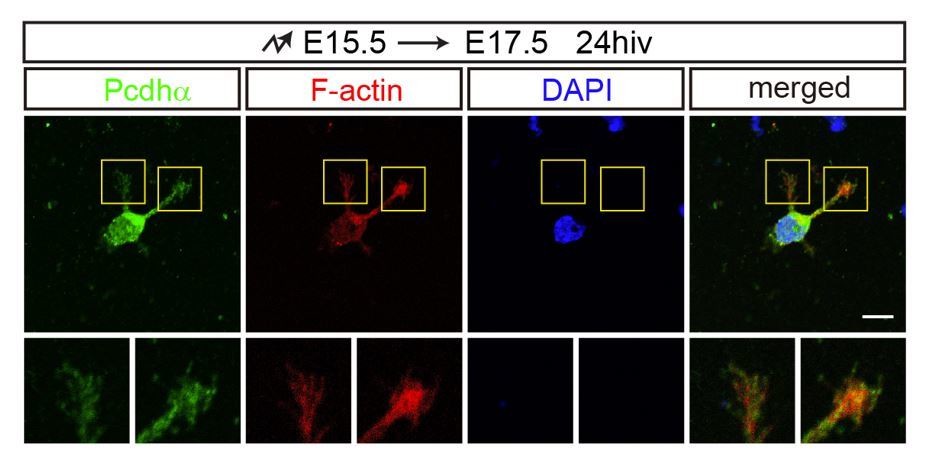
The localization of endogenous Pcdhα proteins with F-actin in growth cones.
https://doi.org/10.7554/eLife.35242.039
Author response image 5

Deletion of Pcdhα VCDs results in the abolishment of rescue of αKD defects.
https://doi.org/10.7554/eLife.35242.040
Author response image 6
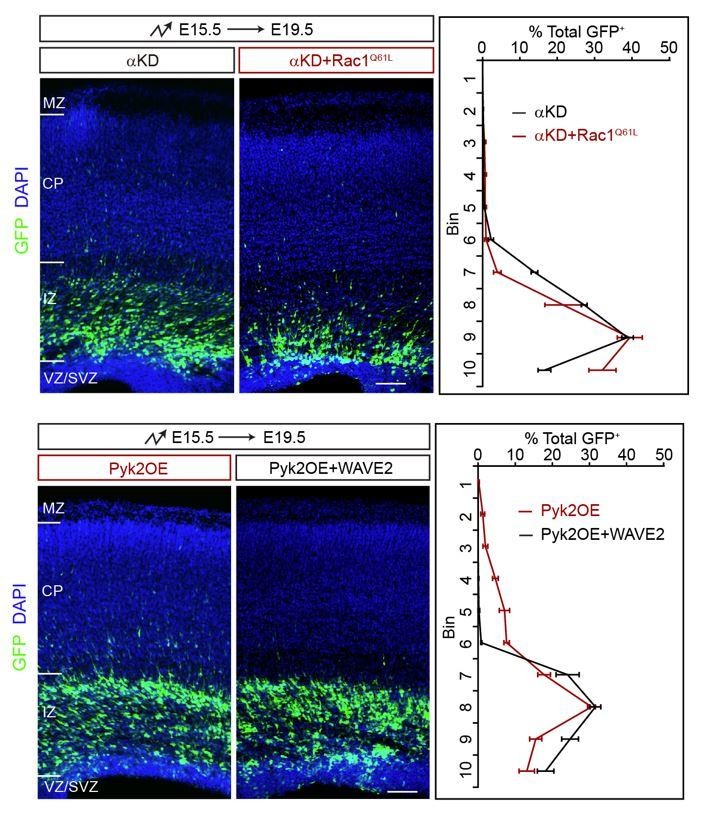
Rescue experiments of αKD+Rac1Q61L and Pyk2OE+WAVE2.
https://doi.org/10.7554/eLife.35242.041
Author response image 7
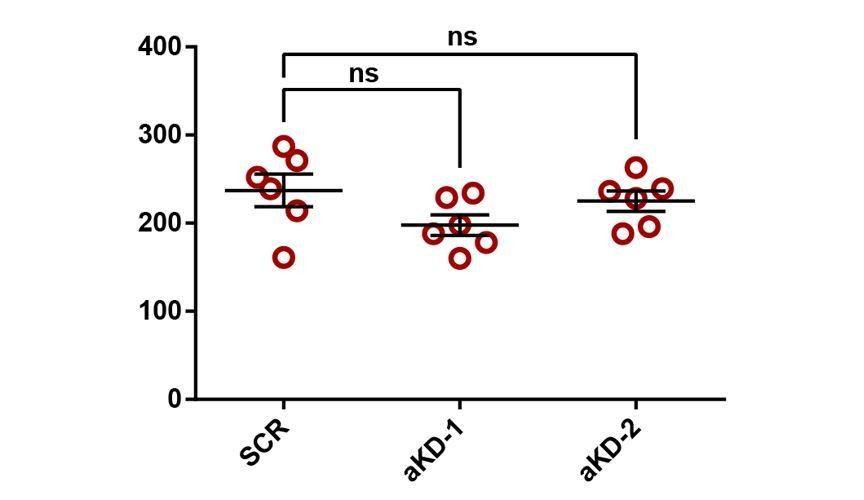
Quantification of the numbers of GFP labeled cells in each IUE manipulation.
One-way ANOVA, ns, not significant.
Videos
Video 1
Movement of multipolar neurons of control and αKD electroporated cortices.
One frame per 15 min. Playback speed seven frames/s. Scale bar, 50 μm.
Video 2
Movement of bipolar neurons of control and Pyk2OE electroporated cortices.
One frame per 15 min. Playback speed seven frames/s. Scale bar, 10 μm
Video 3
Dynamics of stage1 control and αKD primary cultured cortical neurons.
One frame per 5 min. Playback speed seven frames/s. Scale bar, 20 μm
Video 4
Dynamics of stage2 control and αKD primary cultured cortical neurons.
One frame per 5 min. Playback speed seven frames/s. Scale bar, 40 μm
Tables
Key resources table
| Reagent type (species) or resource | Designation | Source or reference | Identifiers | Additional information |
|---|---|---|---|---|
| Gene (Mus musculus) | Pcdha6 | GenBank | GenBank: NM_007767.3 | N/A |
| Gene (Mus musculus) | Pcdhac1 | GenBank | GenBank: NM_001003671.1 | N/A |
| Gene (Mus musculus) | Pcdhac2 | GenBank | GenBank: NM_001003672.1 | N/A |
| Gene (Mus musculus) | Ptk2b (Pyk2) | GenBank | GenBank: NM_001162366.1 | N/A |
| Gene (Mus musculus) | Wasf2 (WAVE2) | GenBank | GenBank: AY135643.1 | N/A |
| Gene (Mus musculus) | Abi2 | GenBank | GenBank: NM_198127.2 | N/A |
| Gene (Mus musculus) | Rac1 | GenBank | GenBank: NM_009007.2 | N/A |
| Strain (Mus musculus) | Pcdhαdel/del | doi:10.1038/ng2060 | N/A | N/A |
| Strain (Mus musculus) | PcdhαGFP | doi:10.1038/ng2060 | N/A | N/A |
| Strain (Mus musculus) | Pyk2KO | doi:https://doi.org/10.1101/216770 | N/A | N/A |
| Strain (Mus musculus) | Pyk2Y402F | doi:https://doi.org/10.1101/216770 | N/A | N/A |
| Cell line (Homo sapiens) | HEK293T/17 | ATCC | Cat# CRL-11268 | N/A |
| Antibody | anti-beta-actin (mouse monoclonal) | Proteintech | Cat# 60009–1-Ig, RRID:AB_2687938 | N/A |
| Antibody | anti-Myc (mouse monoclonal) | Millipore | Cat# 05–724, RRID:AB_309938 | N/A |
| Antibody | anti-WAVE2 (rabbit polyclonal) | Millipore | Cat# 07–410, RRID:AB_310593 | N/A |
| Antibody | anti-Pyk2 (rabbit polyclonal) | Abcam | Cat# ab32571, RRID:AB_777566 | N/A |
| Antibody | anti-Tbr2 (rabbit polyclonal) | Abcam | Cat# ab23345, RRID:AB_778267 | N/A |
| Antibody | anti-Tuj1 (mouse monoclonal) | Covance | Cat# MMS-435P, RRID:AB_2313773 | N/A |
| Antibody | anti-Pcdhα (rabbit polyclonal) | Synaptic Systems | Cat# 190003 | N/A |
| Antibody | anti-GFP (rabbit polyclonal) | Invitrogen | Cat# A-31852, RRID:AB_162553 | N/A |
| Cat# | anti-BLBP (rabbit polyclonal) | Millipore | Cat# ABN14, RRID:AB_10000325 | N/A |
| Antibody | anti-GM130 (mouse monoclonal) | BD Bioscience | Cat# 610822, RRID:AB_398141 | N/A |
| Antibody | anti-BrdU (mouse monoclonal) | Bio-Rad | Cat# MCA2483, RRID:AB_808349 | N/A |
| Antibody | anti-activated caspase 3 (rabbit polyclonal) | Cell Signaling Technology | Cat# 9661, RRID:AB_2341188 | N/A |
| Software, algorithm | Prism | GraphPad (La Jolla, CA) | RRID:SCR_002798 | N/A |
| Software, algorithm | Fiji | doi: 10.1038/nmeth.2019 | RRID:SCR_002285 | N/A |
| Software, algorithm | Clustal X2 | doi: 10.1093/bioinformatics/btm404 | RRID:SCR_002909 | N/A |
| Recombinant DNA reagent | pCAG-EGFP (plasmid) | doi: 10.1523/JNEUROSCI.6096–09.2010 | N/A | N/A |
| Recombinant DNA reagent | pLKO.1-TRC cloning vector (plasmid) | Addgene | plasmid #10878 | N/A |
| Recombinant DNA reagent | pNeuroD-ires-GFP (plasmid) | doi: 10.1038/nn.2816 | N/A | N/A |
| Recombinant DNA reagent | pCAG-Pcdhα6 (plasmid) | This paper | N/A | vector: pCAG; cDNA fragment: mouse Pcdha6 |
| Recombinant DNA reagent | pCAG-Pcdhαc1 (plasmid) | This paper | N/A | vector: pCAG; cDNA fragment: mouse Pcdhac1 |
| Recombinant DNA reagent | pCAG-Pcdhαc2 (plasmid) | This paper | N/A | vector: pCAG; cDNA fragment: mouse Pcdhac2 |
| Recombinant DNA reagent | pCAG-Pyk2 (plasmid) | This paper | N/A | vector: pCAG; cDNA fragment: mouse Pyk2 |
| Recombinant DNA reagent | pCAG-WAVE2 (plasmid) | This paper | N/A | vector: pCAG; cDNA fragment: mouse WAVE2 |
| Recombinant DNA reagent | pCAG-Abi2 (plasmid) | This paper | N/A | vector: pCAG; cDNA fragment: mouse Abi2 |
| Recombinant DNA reagent | pCAG-Rac1 (plasmid) | This paper | N/A | vector: pCAG; cDNA fragment: mouse Rac1 |
| Recombinant DNA reagent | pNeuroD-Pyk2-ires-GFP (plasmid) | This paper | N/A | vector: pNeuroD-ires-GFP; cDNA fragment: mouse Pyk2 |
| Recombinant DNA reagent | pLKO.1-Pcdhα shRNA1 (plasmid) | This paper | N/A | vector: pLKO.1-TRC; target: aacagtatccagtgcaacacc |
| Recombinant DNA reagent | pLKO.1-Pcdhα shRNA2 (plasmid) | This paper | N/A | vector: pLKO.1-TRC; target: aattcattatcccaggatctc |
Additional files
-
Supplementary file 1
Oligonucleotides used in this study.
- https://doi.org/10.7554/eLife.35242.033
-
Transparent reporting form
- https://doi.org/10.7554/eLife.35242.034
Download links
A two-part list of links to download the article, or parts of the article, in various formats.
Downloads (link to download the article as PDF)
Open citations (links to open the citations from this article in various online reference manager services)
Cite this article (links to download the citations from this article in formats compatible with various reference manager tools)
Alpha protocadherins and Pyk2 kinase regulate cortical neuron migration and cytoskeletal dynamics via Rac1 GTPase and WAVE complex in mice
eLife 7:e35242.
https://doi.org/10.7554/eLife.35242


