The newly-arisen Devil facial tumour disease 2 (DFT2) reveals a mechanism for the emergence of a contagious cancer
- University of Southampton, United Kingdom
- University of Tasmania, Australia
- University of Cambridge, United Kingdom
- University of Southern Denmark, Denmark
- Faculty of Medicine, University of Southampton, United Kingdom
Figures
Figure 1
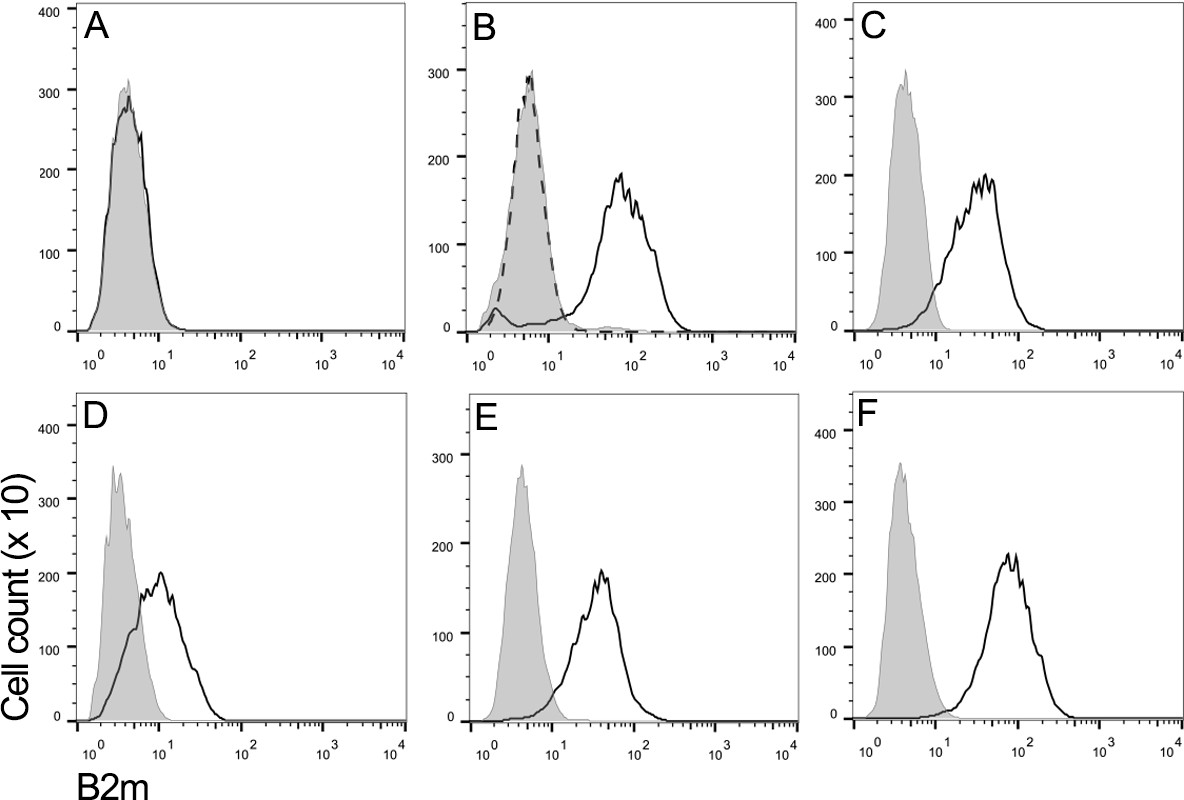
DFT2 cells express β2m in vitro.
Flow cytometry to compare β2m expression shows (A) DFT1_4906, (B) DFT1_4906 + IFNγ, (C) DFT2_RV, (D) DFT2_SN, (E) DFT2_TD549 and (F) Fibroblast_Salem cells stained with α-β2m (solid line) and secondary only control (shaded peak). DFT1_4906 + IFNγ (B) stained with blocked α-β2m antibody is also shown (dashed line). Fluorescence intensity for α-β2m on x-axis and cell counts on y-axis.
Figure 2 with 1 supplement
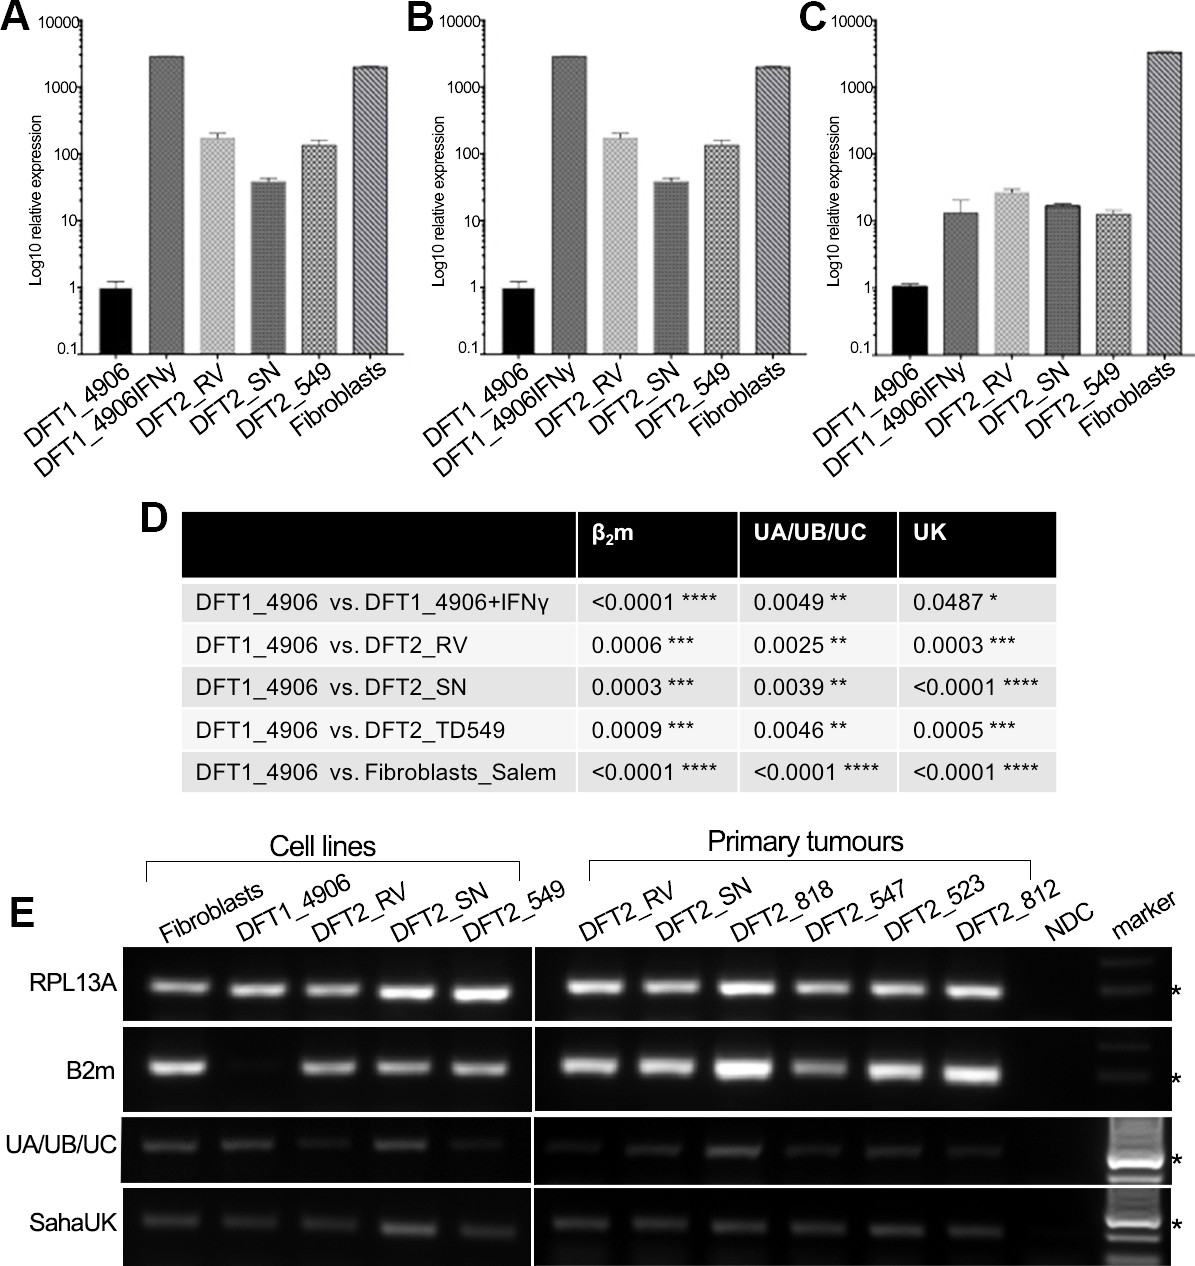
DFT2 cells in vitro and in vivo express mRNA for β2m, Saha-UK, Saha-UA, UB and UC.
RT-qPCR of (A) β2m, (B) Saha-UA, -UB and -UC and (C) Saha-UK mRNA expression by DFT2 cell lines (DFT2_RV, DFT2_SN, DFT2_TD549), fibroblast cells (Fibroblasts_Salem) and DFT1 cells treated with IFNγ (DFT1_4906 + IFNγ) relative to DFT1_4906 cells. Gene expression levels are normalized against RPL13A as a housekeeping gene. Data are represented as mean ± S.E.M of three technical replicates. (D) An unpaired T-test was performed to test for statistical significance. (E) RT-PCR on DFT2 cell lines and DFT2 primary tumours for β2m, Saha-UA, -UB and -UC and Saha-UK. RPL13A was used as a loading control. A no DNA control (NDC) is included for each RT-PCR. A marker at 300 base pairs is indicated by an asterisk.
Figure 2—figure supplement 1
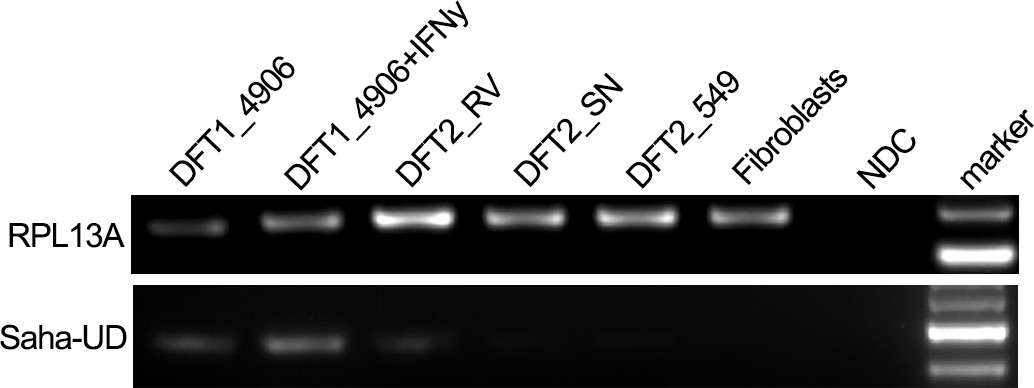
RT-PCR amplification of RPL13A and Saha-UD from DFT1, DFT2 and Fibroblast cells.
mRNA from DFT1_4906, DFT1_4906 + IFNγ, DFT2_RV-CL, DFT2_SN-CL, DFT2_TD549-CL and Fibroblast_Salem cell lines was used. A no cDNA negative control was included in each experiment.
Figure 3 with 3 supplements

DFT2 tumours express variable levels of classical MHC class I (Saha-UA, -UB and -UC) and non-classical MHC class I (Saha-UK) in vivo.
IHC staining of DFT2 tumours (DFT2_RVT1, DFT2_SNT2, DFT2_818T1, DFT2_547T1, DFT2_523 DFT2_812) with α-UA/UB/UC_15-25-18 against Saha-UA, -UB and -UC and α-UK_15-29-1 against Saha-UK. Arrows indicate tumour cells for each biopsy; arrow heads indicate stroma separating nests of tumour cells where present. Isotype and secondary antibody controls can be found in Figure 3—figure supplement 2. Boxed insets are at 600 x magnification and are taken from areas indicated by arrows. Scale bars represent 50 μm. Positive cells for each marker are stained brown, nuclei are stained blue.
-
Figure 3—source data 1
Nucleotide sequences for the pET22B + SahaUC and pET22B + SahaUK constructs used to test the specificity of the MHC class I antibodies (a- UA/UB/UC 15-25-18 and a- UK 15-29-1) described in Figure 3.
- https://doi.org/10.7554/eLife.35314.010
Figure 3—figure supplement 1
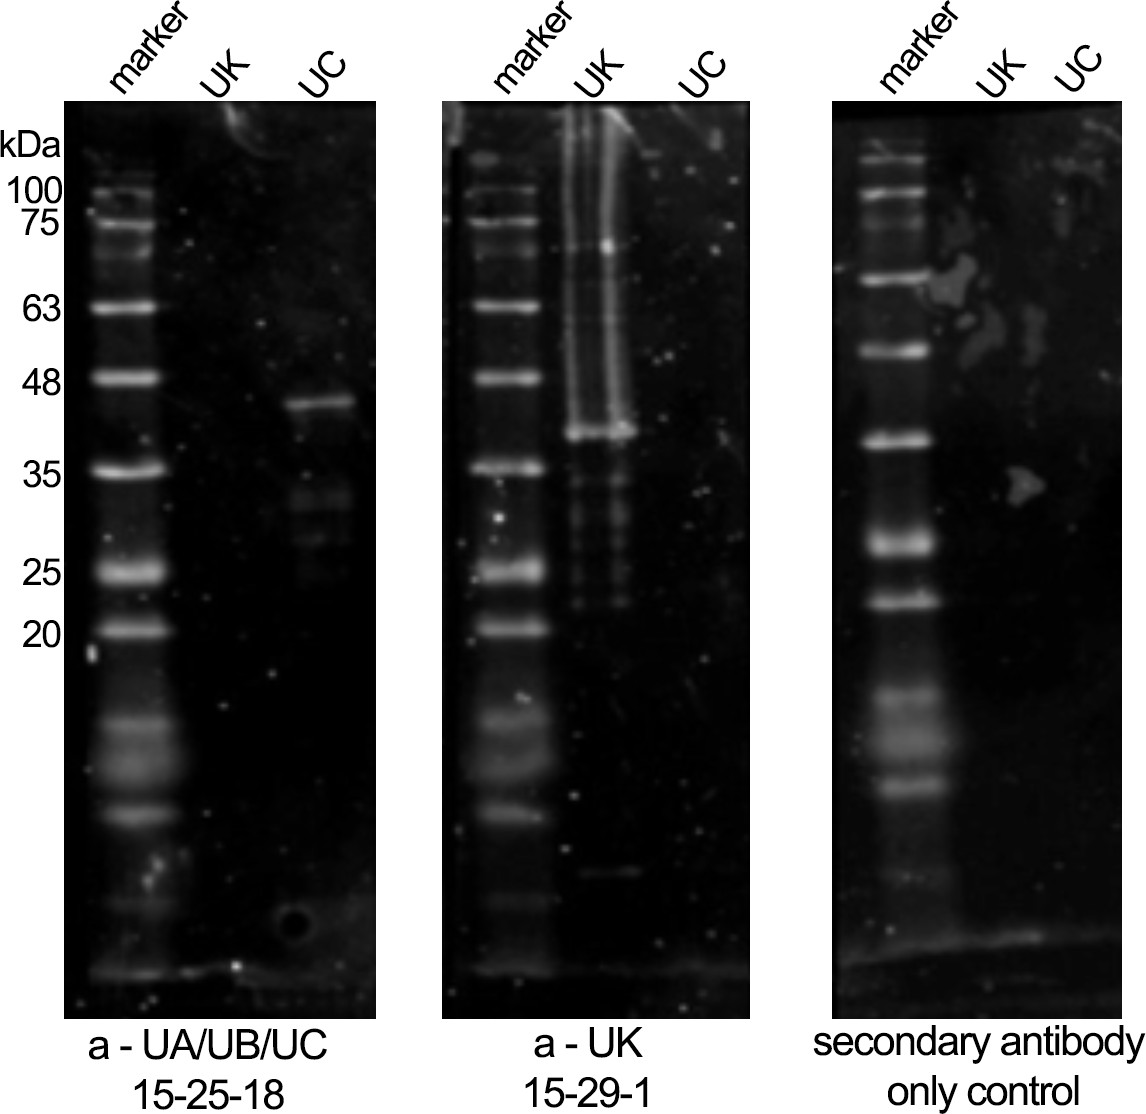
Western blots illustrating specificity of the MHC class I heavy-chain monoclonal antibodies.
Western blot on classical MHC class I protein (Saha-UC) (38 kDa) and non-classical MHC class I protein (Saha-UK) (39 kDa) with MHC class I heavy-chain specific antibodies.
Figure 3—figure supplement 2
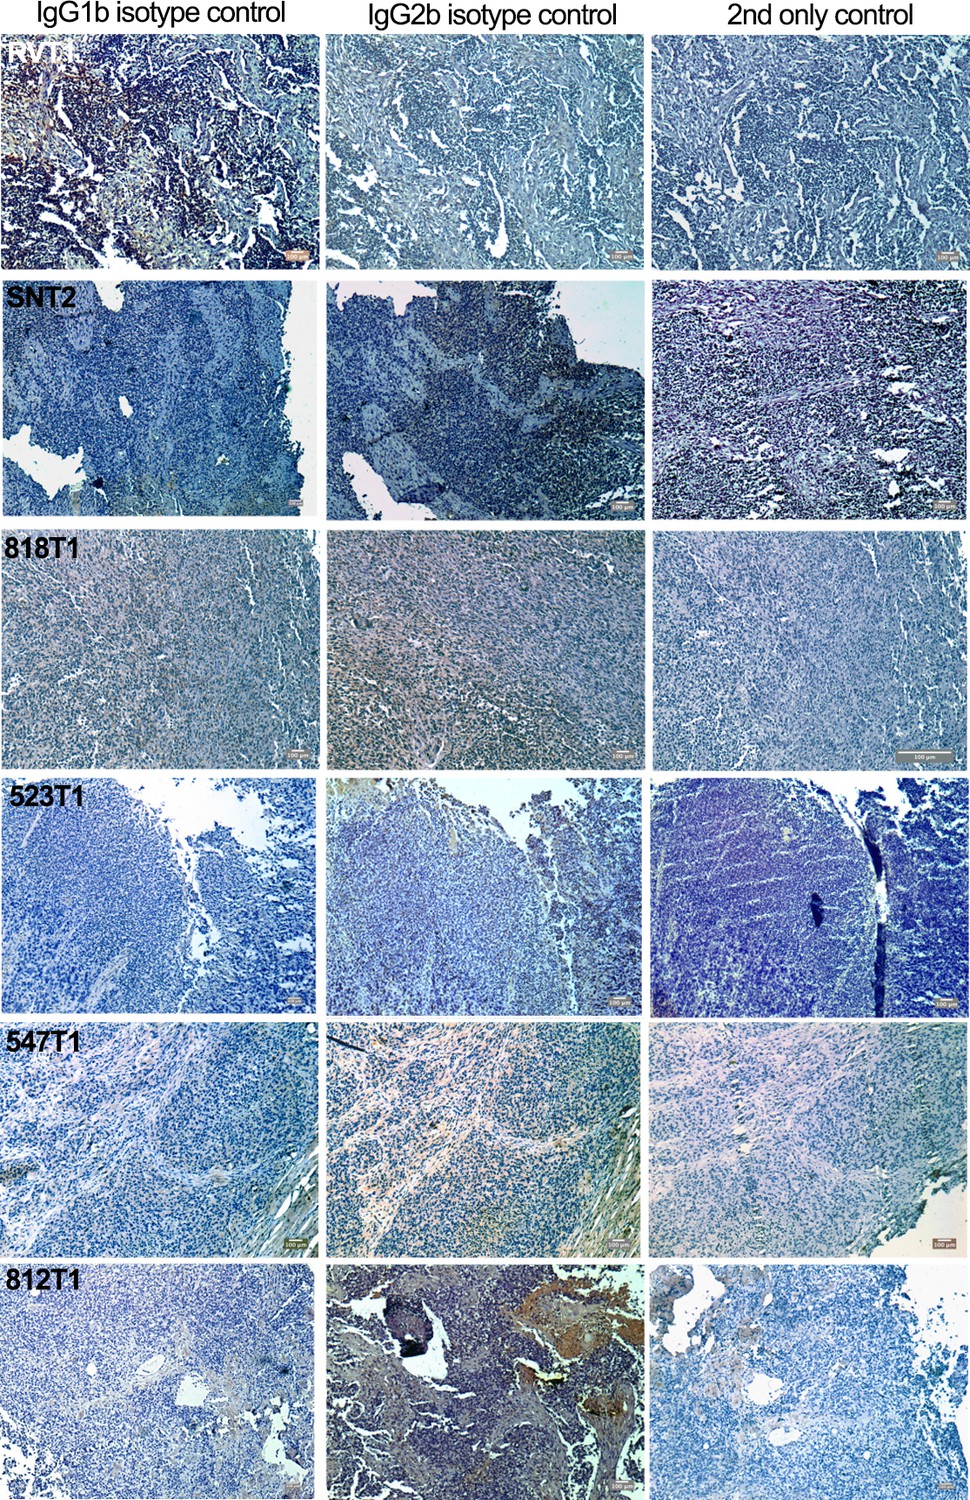
Isotype controls (IgG1b – anti-SahaUA/UB/UC and IgG2b – anti-SahaUK) and secondary antibody only controls for the immunohistochemistry presented in Figure 3.
All images are 100 x magnification with scale bars represent 100 μm.
Figure 3—figure supplement 3
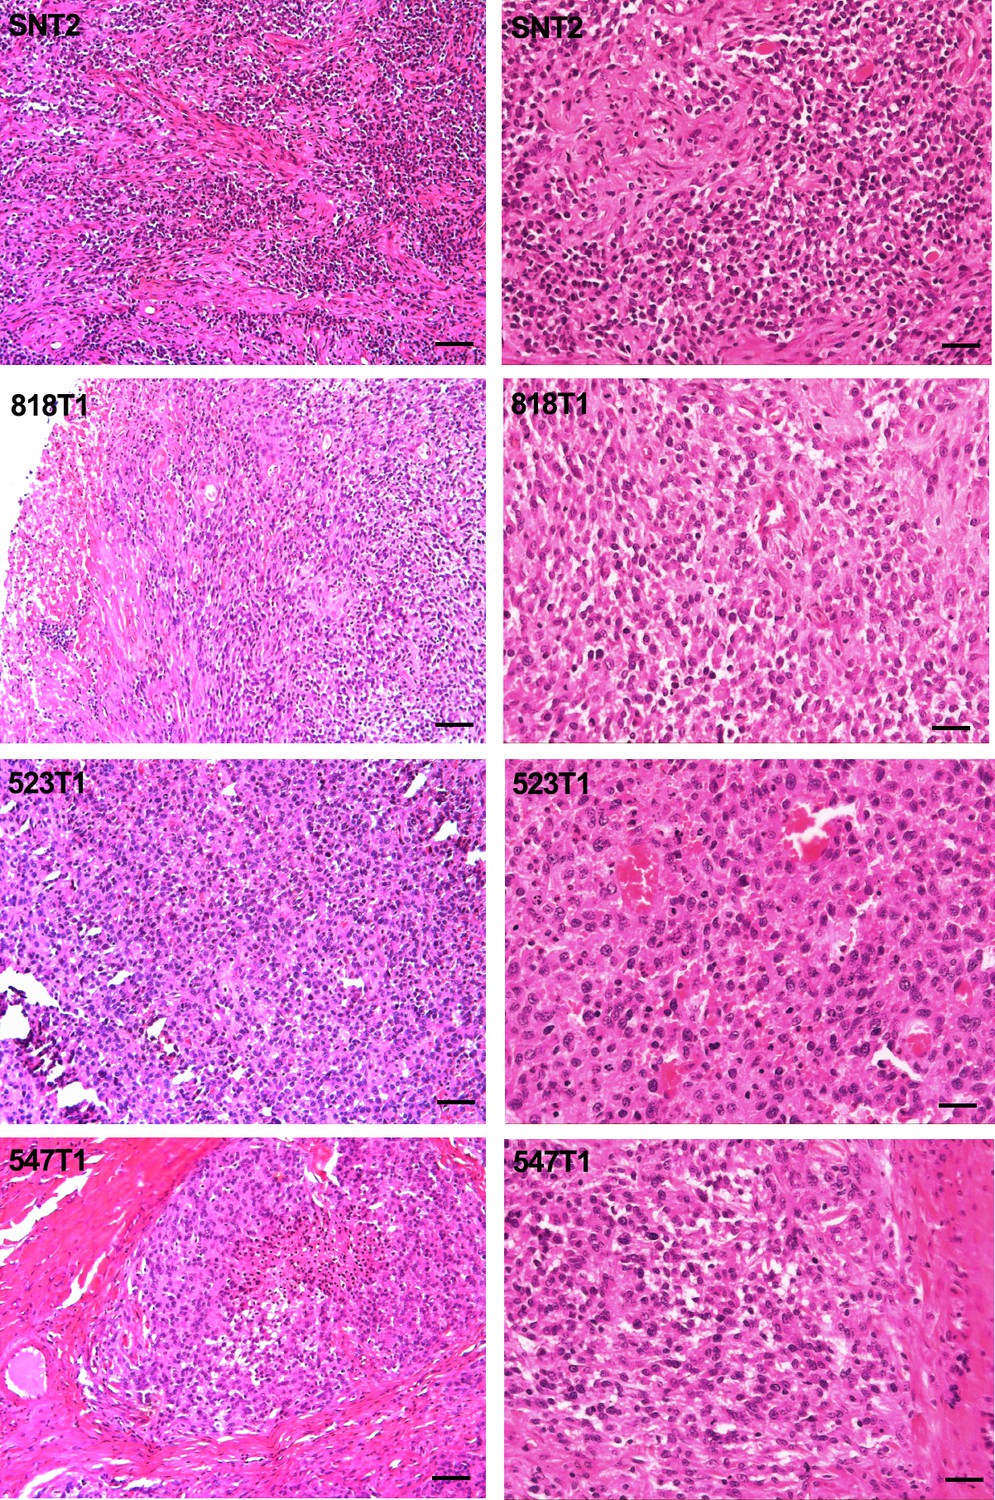
DFT2 tumours have different growth patterns.
H and E staining of four DFT2 tumours representing different growth patterns. Scale bars represent 100 μm.
Figure 4
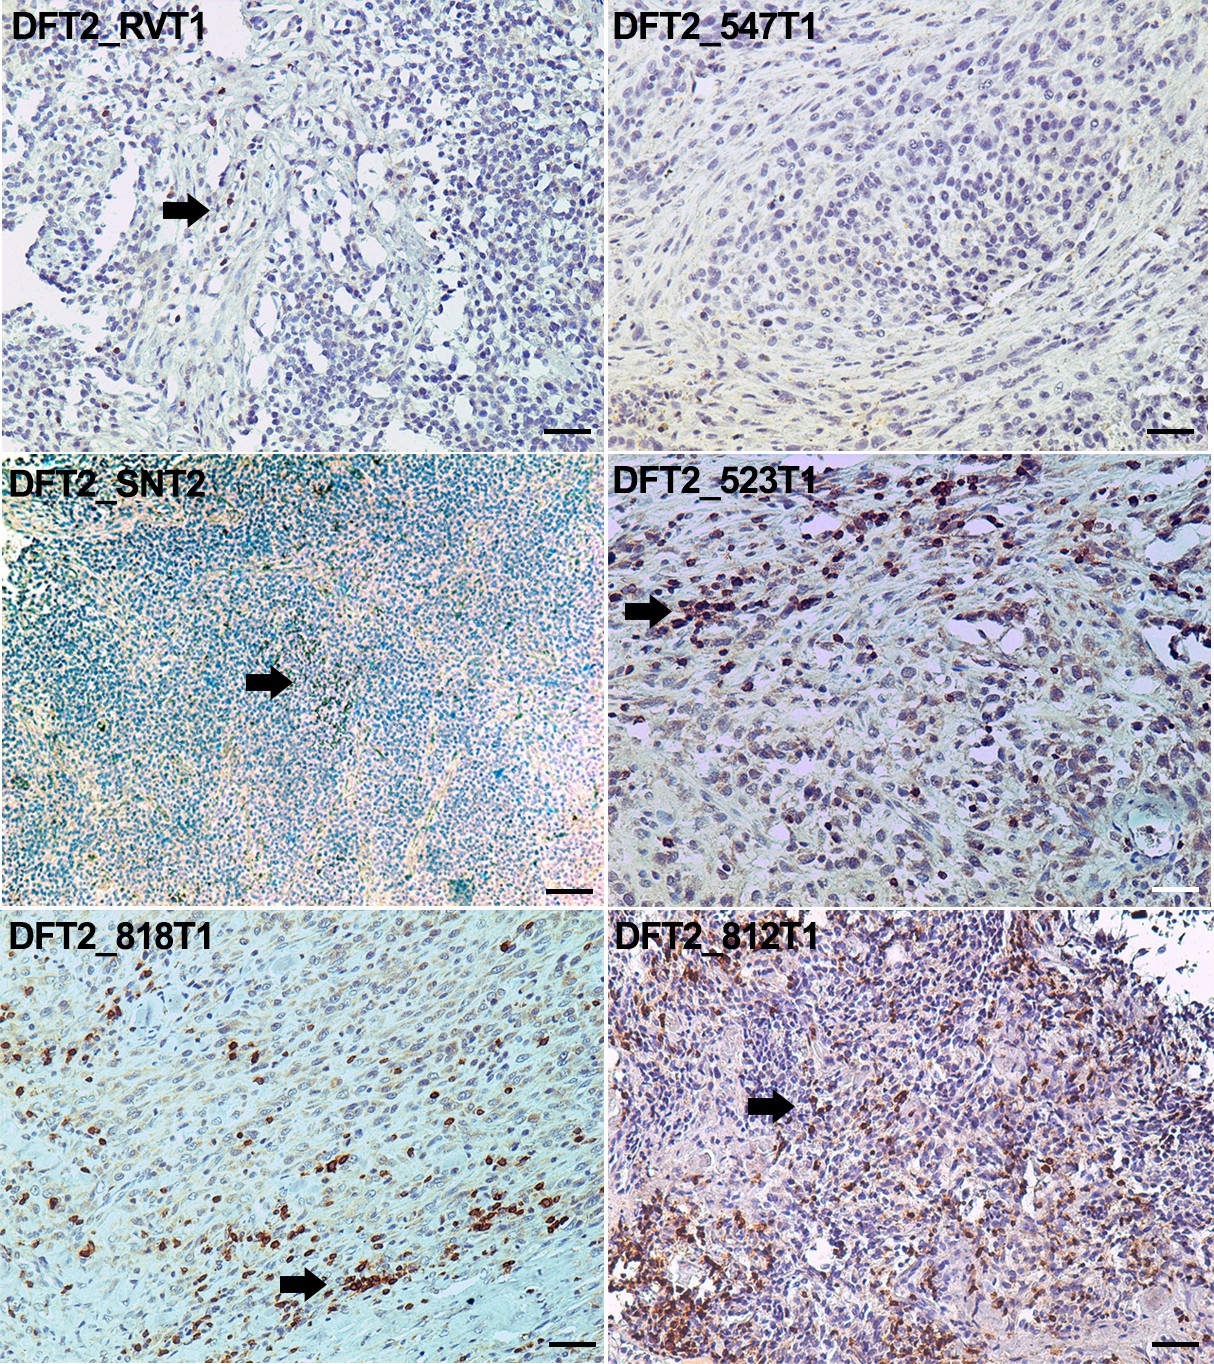
CD3 staining of DFT2 tumours.
CD3 staining of DFT2_RVT1, DFT2_SNT2 DFT2_818T1, DFT2_TD547T1, DFT2_523T2 and DFT2_812 tumours. CD3 positive cells are indicated by arrows. DFT2_SNT2, and DFT2_547 are CD3 negative. Scale bars represent 50 μm. Positive cells for each marker are stained brown, nuclei are stained blue.
Figure 5 with 1 supplement
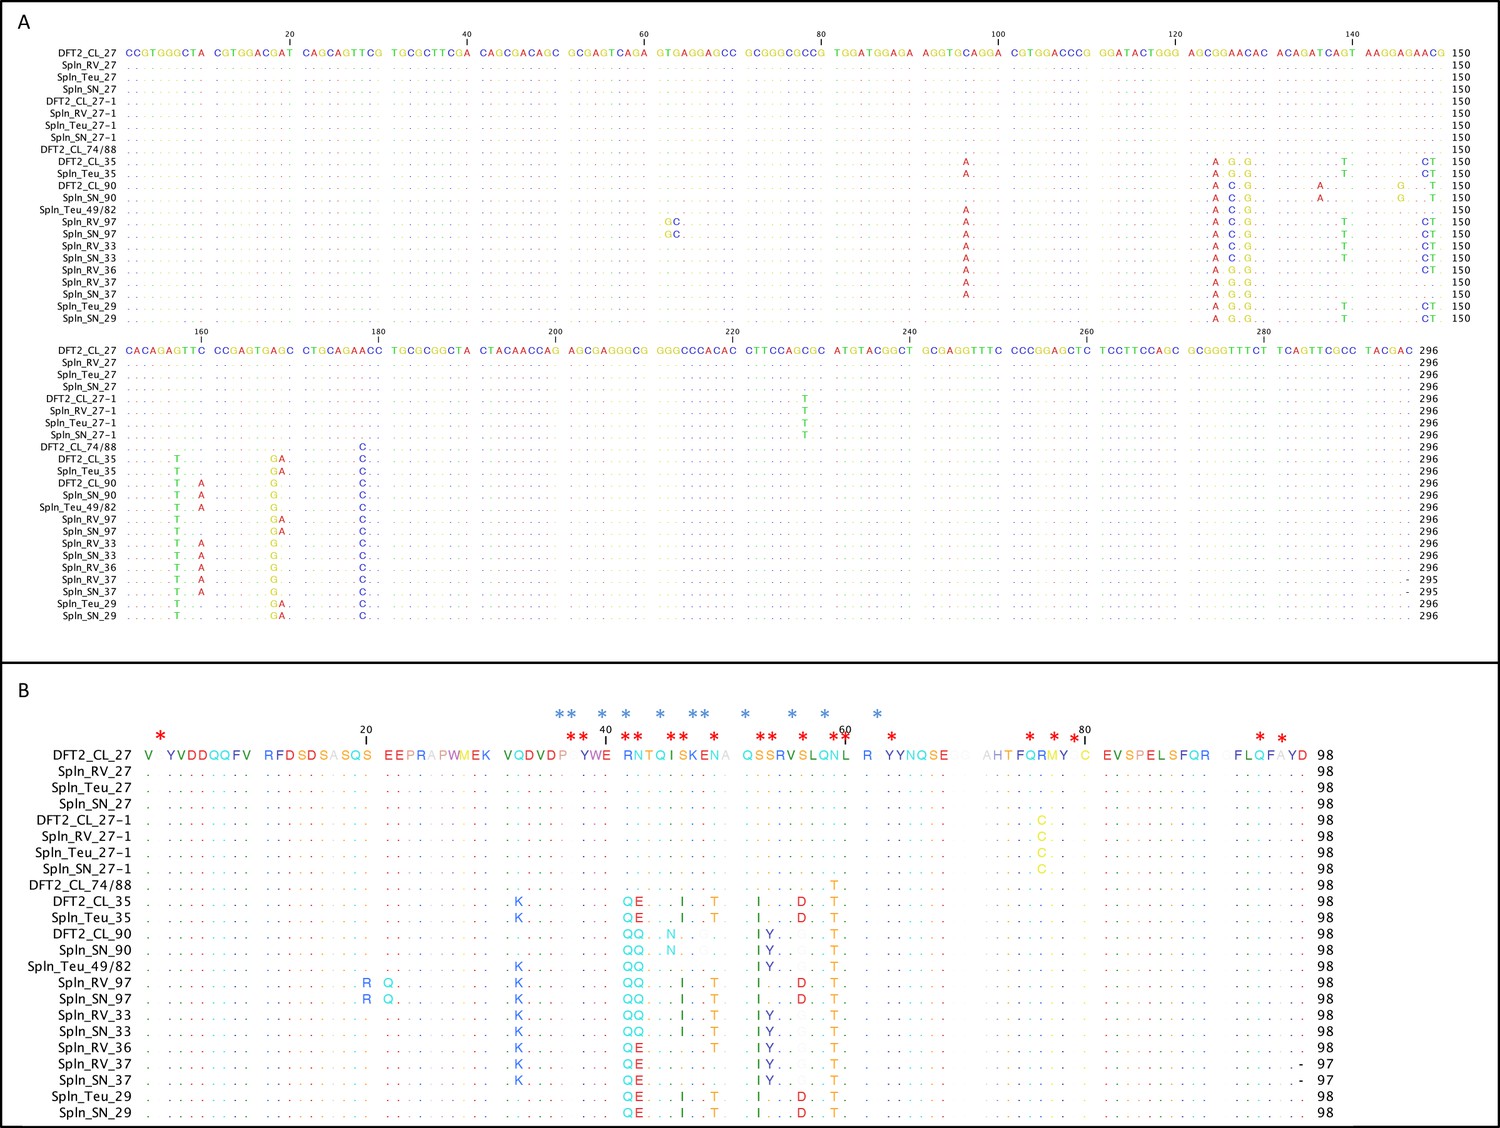
DFT2 shares classical MHC class I alleles with its hosts.
Alignment of the MHC class I sequences cloned from the mRNA from DFT2 cell lines (DFT2_CL) and host devils (TD_RV, TD_SN and TD_818 (Teu)). Nucleotide alignment in (A) and amino acid alignment in (B). Red asterisks indicate residues postulated to interact with peptides and blue asterisks indicate residues predicted to interact with TCRs (Bjorkman et al., 1987).
Figure 5—figure supplement 1
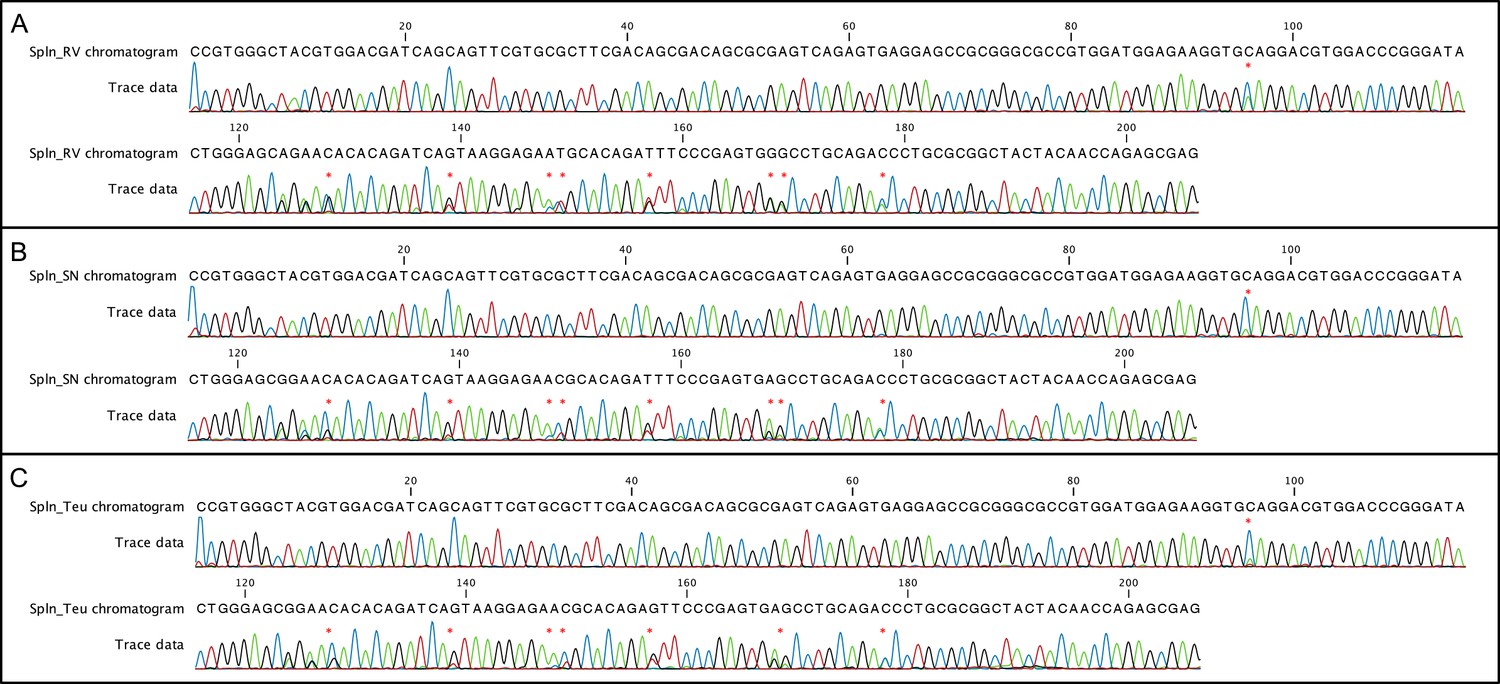
Chromatograms of α2-domian of MHC class I from spleen samples from RV, SN and 818/Teu.
Spln_RV, Spln_SN and Spln_818/Teu host tissues share the same polymorphic sites in the MHC class I α2-domian. Chromatograms of α2-domian of MHC class I (Saha-UA, -UB and –UC) from spleen samples from RV, SN and 818/Teu from PCR amplification and sequencing using the reverse primer Saha91. Polymorphic sites are indicated by an asterisk.
Tables
Table 1
MHC class I alleles expressed by DFT2 cell lines and host animals.
The classical and non-classical MHC class I alleles expressed by DFT1, DFT2, TD_RV, TD_818 and TD_SN. Grey boxes indicate the alleles identified in each sample. Numbers in the boxes indicate the number of clones identified for each allele. SahaI*32(UD) and SahaI*UK were amplified with gene specific primers.
| NCBI allele name | DFT1 | DFT2 | TD_RV | TD_818 | TD_SN |
|---|---|---|---|---|---|
| SahaI*46 | |||||
| SahaI*27 | 22 | 22 | 14 | 2 | |
| SahaI*27–1 | 13 | 25 | 13 | ||
| SahaI*74/88 | 9 | ||||
| SahaI*35 | 13 | 10 | |||
| SahaI*90 | 4 | 1 | |||
| SahaI*49/82 | 7 | ||||
| SahaI*97 | 6 | 2 | |||
| SahaI*33 | 6 | 2 | |||
| SahaI*36 | 2 | ||||
| SahaI*37 | 5 | 1 | |||
| SahaI*29 | 2 | 2 | |||
| SahaI*32(UD) | |||||
| SahaI*UK |
-
Table 1–source data 1
MHC class I transcripts expressed in DFT2 and host devils that were used to generate Table 1 and Figure 5.
- https://doi.org/10.7554/eLife.35314.015
Key resources table
| Reagent type (species) or resource | Designation | Source or reference | Identifiers | Additional information |
|---|---|---|---|---|
| Gene (Sarcophilus harrisii) | Saha-UK | Murchison et al. (2012) | ensembl: ENSSHAG00000002942 | Devil_ref v7.0 |
| Gene (S. harrisii) | Saha-UC | Murchison et al. (2012) | ensembl: ENSSHAG00000000117 | Devil_ref v7.0 |
| Gene (S. harrisii) | Saha-UD | Murchison et al. (2012) | ensembl: ENSSHAG00000010776 | Devil_ref v7.0 |
| Cell line (S. harrisii) | DFT1_4906 | Siddle et al. (2013) and Murchison et al. (2012) | RRID:CVCL_LB78; DFTD 4906; 86T | Devil Facial Tumour 1; Supplementary file 1 |
| Cell line (S. harrisii) | DFT2_RV | Pye et al. (2016b) | DFT2_202T1 | Devil Facial Tumour 2; Supplementary file 1 |
| Cell line (S. harrisii) | DFT2_SN | Pye et al. (2016b) | DFT2_203T3 | Devil Facial Tumour 2; Supplementary file 1 |
| Cell line (S. harrisii) | DFT2_549 | This paper | Devil Facial Tumour 2; Supplementary file 1 | |
| Cell line (S. harrisii) (Female) | Fibroblasts_Salem | Murchison et al. (2012) | 91 H | Tasmanian devil fibroblasts |
| Cell line (Cricetulus griseus) | CHO_SahaIFNy | Siddle et al. (2013) | Chinese Hamster Ovary (CHO) cell line transfected with pcDNA3_SahaIFNy | |
| Biological sample (S. harrisii) | DFT2_RV | Pye et al. (2016b) | DFT2_202T1 | Devil Facial Tumour 2; Supplementary file 1 |
| Biological sample (S. harrisii) | DFT2_SN | Pye et al. (2016b) | DFT2_203T2 | Devil Facial Tumour 2; Supplementary file 1 |
| Biological sample (S. harrisii) | DFT2_818 | Stammnitz et al. (2018) | Devil Facial Tumour 2; Supplementary file 1 | |
| Biological sample (S. harrisii) | DFT2_547 | Stammnitz et al. (2018) | 807T1 | Devil Facial Tumour 2; Supplementary file 1 |
| Biological sample (S. harrisii) | DFT2_523 | Stammnitz et al. (2018) | 638T1 | Devil Facial Tumour 2; Supplementary file 1 |
| Biological sample (S. harrisii) | DFT2_812 | Stammnitz et al. (2018) | Devil Facial Tumour 2; Supplementary file 1 | |
| Biological sample (S. harrisii) | TD_RV | Stammnitz et al. (2018) | 202H1 | Tasmanian devil spleen biopsy |
| Biological sample (S. harrisii) | TD_SN | Stammnitz et al. (2018) | 203 H | Tasmanian devil kidney biopsy |
| Biological sample (S. harrisii) | TD_818 | Stammnitz et al. (2018) | 818 | Tasmanian deil spleen biopsy |
| Antibody | α-UA/UB/UC_15-25-18; Classical MHC class I Saha-UA, -UB and -UC | This paper | UA/UB/UC_15-25-18 | Antibody recognising MHC class I molecules,SahaUA, UB and UC. Generated using a peptide immunogen (WMEKVQDVDPGYWE). Supernatant from hybridoma used neat. |
| Antibody | α-UK_15-29-1; Non-classical MHC class I Saha-UK | This paper | α-UK_15-29-1 | Antibody recognising MHC class I molecule,Saha-UK. Generated using a peptide immunogen (RITHRTHPDGKVTL). Supernatant from hybridoma used neat. |
| Antibody | IgG1 Isotype control | Sigma Aldrich | clone: MOPC-21; cat number: M5284 | 0.5 mg/ml |
| Antibody | IgG2b Isotype control | Sigma Aldrich | clone: MOPC-141; cat number: M5534 | 0.5 mg/ml |
| Antibody | a-B2m | Siddle et al. (2013) | SahaB2m-13-34-48 | supernatant used neat; B2-microglogulin |
| Antibody | a-CD3 | Dako/Agilent | cat number: A0452 | 1:50 |
| Recombinant DNA reagent | pET22B+-SahaUC | This paper | SahaI*UC (SahaI*27) amplified using primer Saha349 and Saha350 (Supplementary file 2). | |
| Recombinant DNA reagent | pET22B+-SahaUK | This paper | Saha-UK in Pet22B + using primer Saha335 and Saha351 (Supplementary file 2). |
Additional files
-
Supplementary file 1
Biological samples used in this study.
Details of the tumour and host tissue samples, the date the samples were collected from the animal and the location of the animal when it was trapped. *As described previously (Pye et al., 2016b).
- https://doi.org/10.7554/eLife.35314.016
-
Supplementary file 2
Primers used in this study with amplicon size and optimised annealing temperature.
- https://doi.org/10.7554/eLife.35314.017
-
Supplementary file 3
Antibodies used in this study.
- https://doi.org/10.7554/eLife.35314.018
-
Supplementary file 4
PCR conditions for the primers used in this study.
- https://doi.org/10.7554/eLife.35314.019
-
Transparent reporting form
- https://doi.org/10.7554/eLife.35314.020
Download links
A two-part list of links to download the article, or parts of the article, in various formats.
Downloads (link to download the article as PDF)
Open citations (links to open the citations from this article in various online reference manager services)
Cite this article (links to download the citations from this article in formats compatible with various reference manager tools)
The newly-arisen Devil facial tumour disease 2 (DFT2) reveals a mechanism for the emergence of a contagious cancer
eLife 7:e35314.
https://doi.org/10.7554/eLife.35314


