Normal mitochondrial function in Saccharomyces cerevisiae has become dependent on inefficient splicing
- Mediterranean Institute for Life Sciences, Croatia
- Universitätsmedizin Göttingen, Germany
- Rudjer Boškovic Institute, Bijenička, Croatia
- MRC London Institute of Medical Sciences, United Kingdom
- Imperial College London, United Kingdom
Figures
Figure 1 with 4 supplements
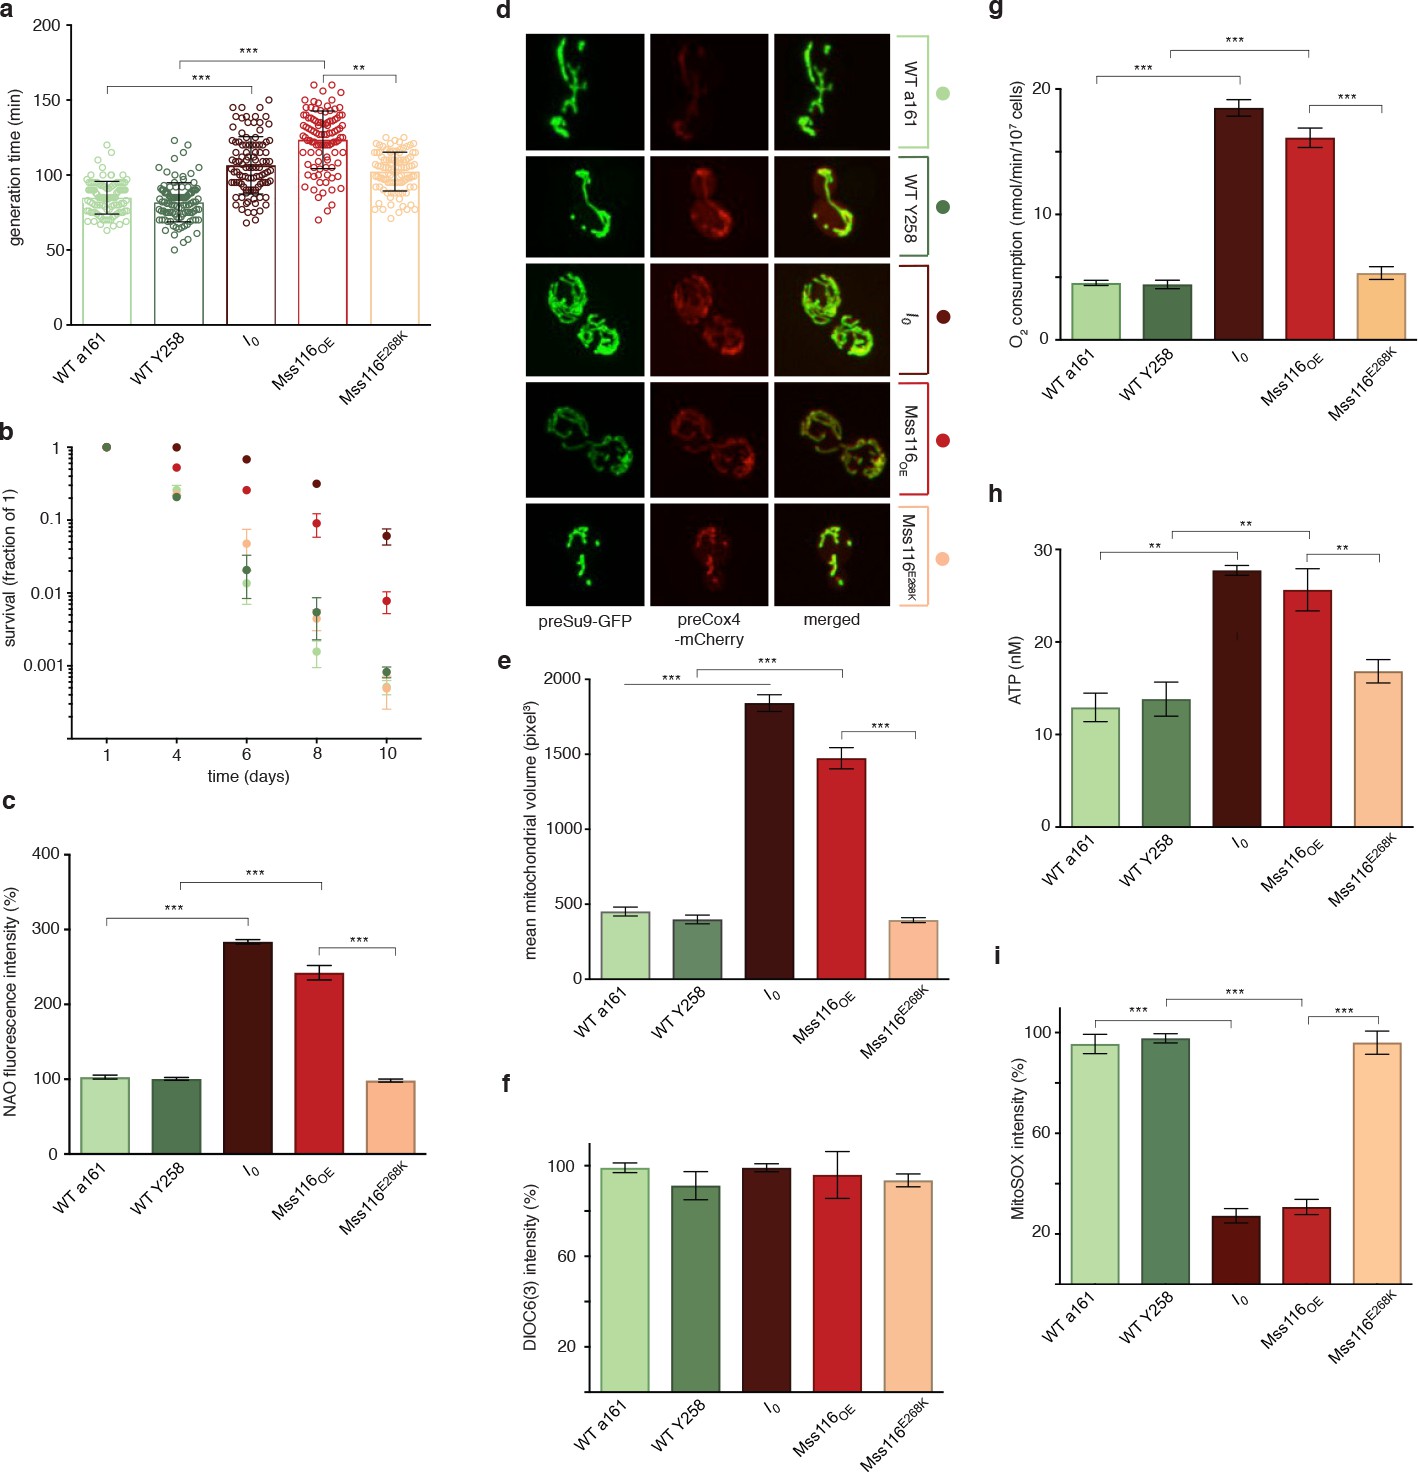
Phenotypic effects of deleting all self-splicing introns from the S. cerevisiae mitochondrial genome.
Deletion of mitochondrial introns (I0) or overexpression of Mss116 (Mss116OE) (a) reduces growth rates, (b) extends chronological lifespan, (c) increases mitochondrial mass, measured as NAO fluorescence, (d,e) increases mitochondrial volume, (g) oxygen consumption, and (h) ATP levels but (i) decreases superoxide levels, measured as MitoSOX fluorescence. (f) Mitochondrial inner membrane potential does not differ significantly between strains. WT a161 and WT Y258 are control strains for I0 and Mss116OE, respectively, as described in the text. The Mss116E268K strain harbours a mutant version of Mss116 that lacks ATPase activity. As a visual guide, strains are colored consistently throughout. Bar heights display the mean of three biological replicates, each calculated as the mean of three technical replicates. Error bars are standard errors of the mean. ***p<0.001; **p<0.01; *p<0.05 (ANOVA plus post hoc).
Figure 1—figure supplement 1

Competitive fitness is decreased in I0 (competed against WT a161) and Mss116OE (competed against the empty vector control WT Y258).
Bar height represents the mean of three biological replicates. Error bars are standard error of the mean. ***p<0.001; **p<0.01; *p<0.05 (ANOVA plus post hoc). See Materials and methods for details of how competitions were carried out and relative fitness determined.
Figure 1—figure supplement 2
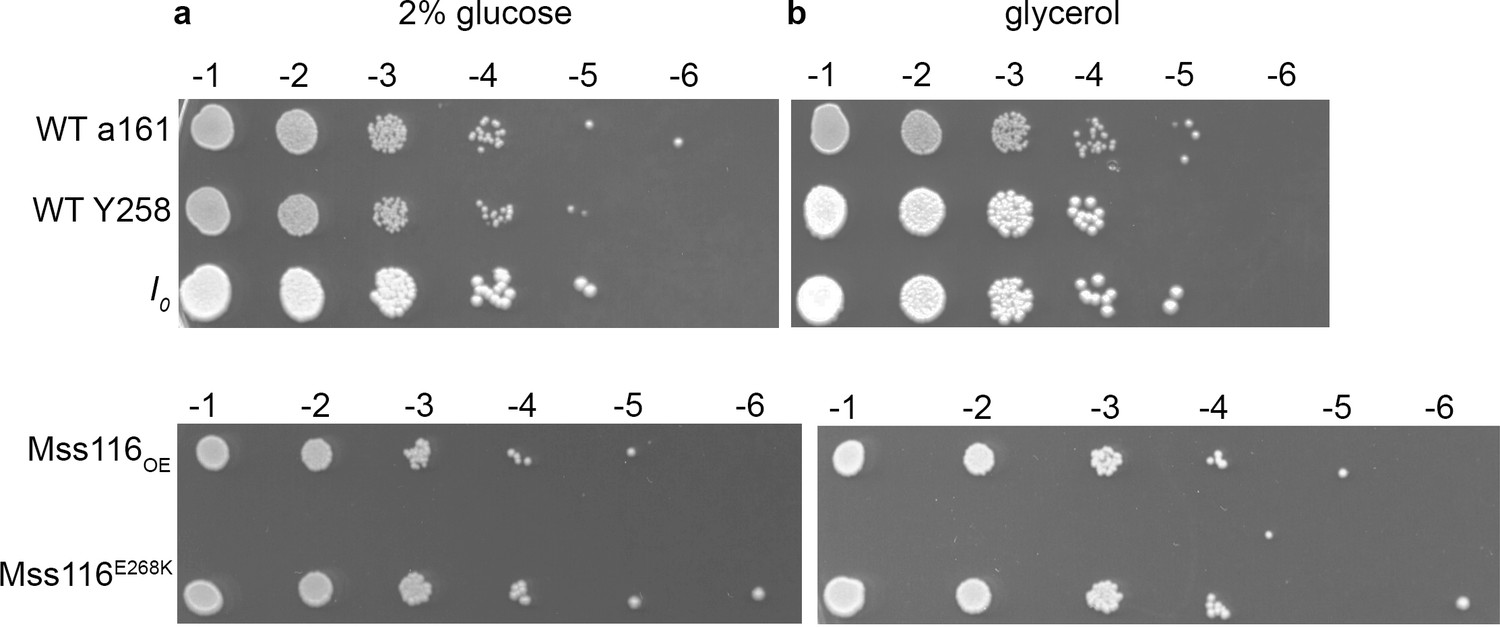
I0 and Mss116OE show no qualitative difference in growth on (a) glucose and (b) glycerol.
Numbers on top of each panel represent the decimal dilution of the stationary culture that is plated as a spot of 5 µl.
Figure 1—figure supplement 3

Mss116 expression level is 2.5-fold increased in the Mss116OE strain.
(a) GFP-tagged Mss116 localizes to mitochondria, whether expressed at endogenous levels (left image) or upon overexpression in the Y258 background (right image). (b) The expression level of Mss116 increases approximately 2.5-fold in the Mss116OE strain, as measured by flow cytometry. Bar heights display the mean of three biological replicates, each of them representing mean of three technical replicates. Error bars are standard error of the mean. ***p<0.001; **p<0.01; *p<0.05 (ANOVA plus post hoc).
Figure 1—figure supplement 4

Median and maximum replicative lifespan of Mss116OE is extended compared to the empty vector control and Mss116E268K.
The total number of monitored mother cells is as follows: 90 cells for the empty vector control, 86 cells for Mss116OE, and 91 cells for Mss116E268K. Measurements were pooled across three independent experiments.
Figure 2 with 4 supplements
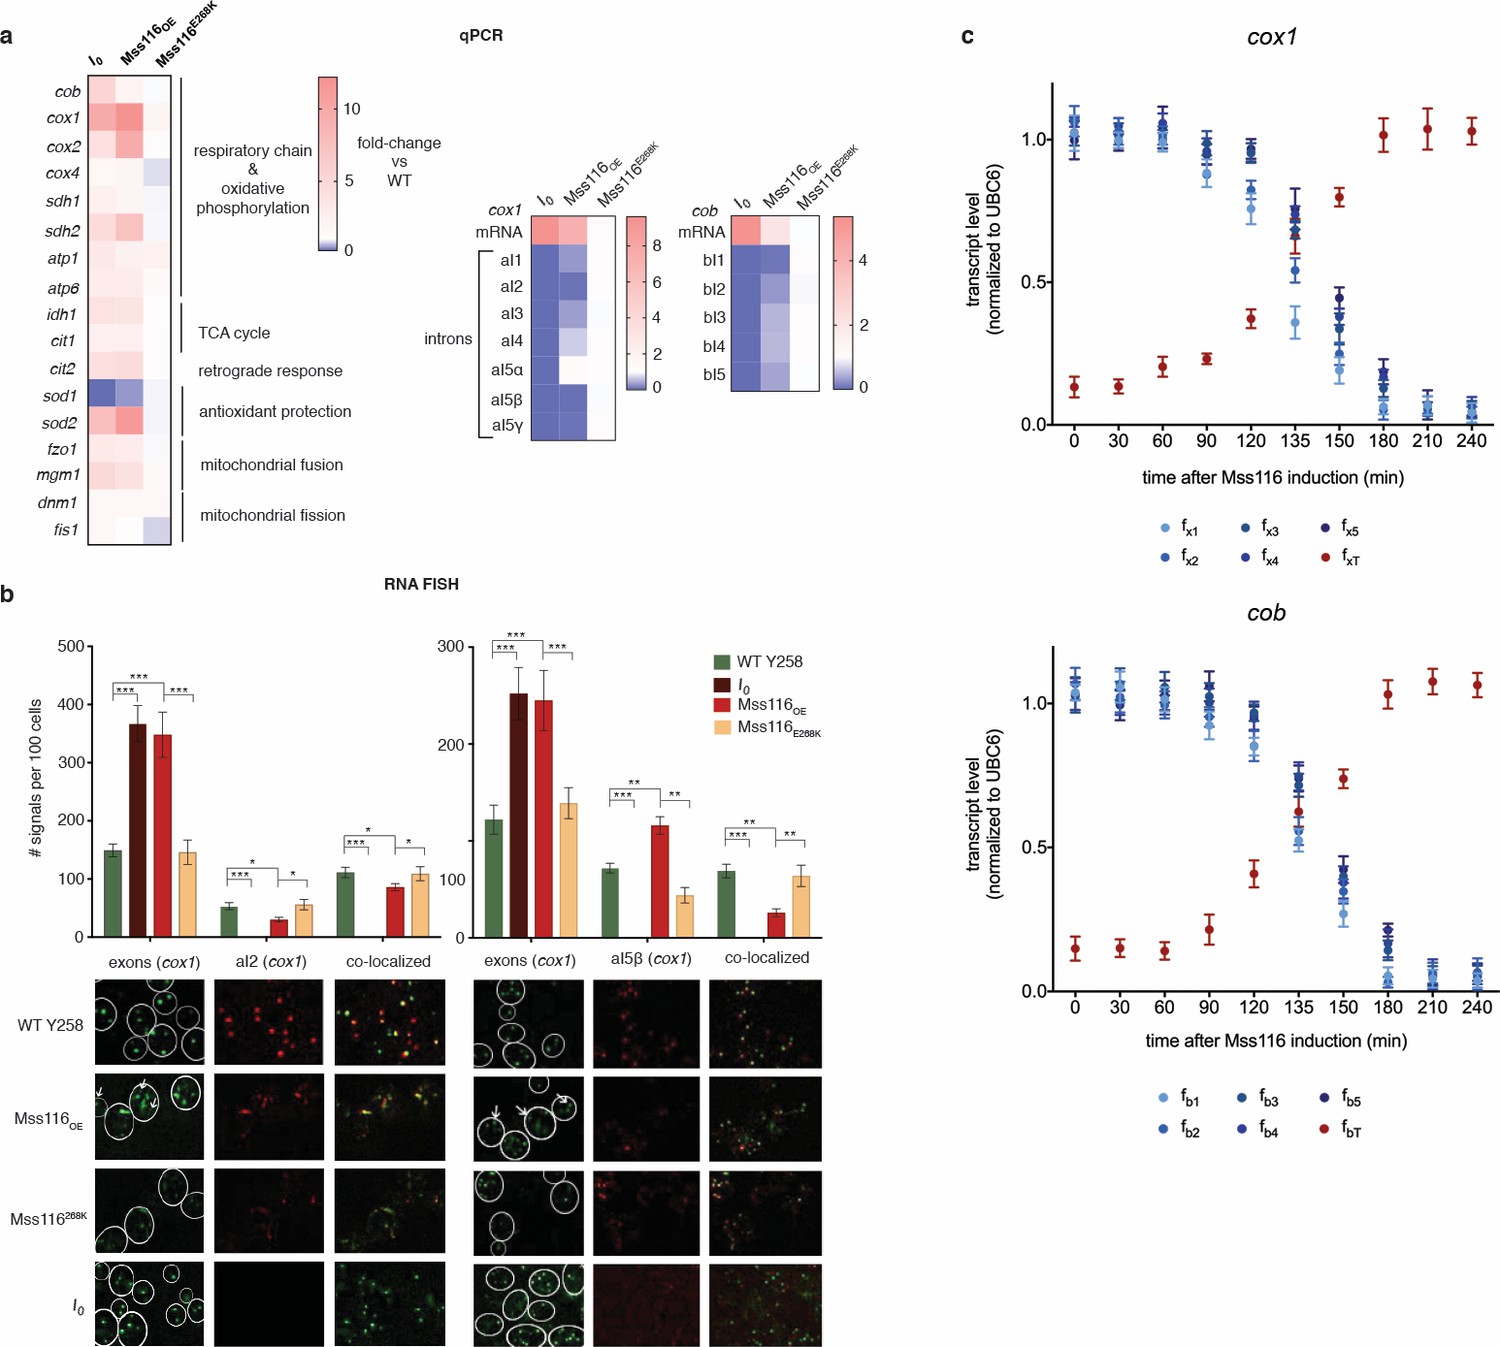
RNA abundance changes associated with intron removal.
(a) qPCR measurements of selected genes, comparing focal strains (I0, Mss116OE, Mss116E268K) to their isogenic control strains (left panel). For both cox1 (central panel) and cob (right panel), intron levels are specifically reduced upon overexpression of Mss116OE but not Mss116E268K, while mature mRNA levels increase. Heat maps display mean values of log-fold changes observed across three biological replicates (each averaged over three technical replicates). UBC6 was used for normalization. (b) RNA-FISH confirms elimination/reduction of introns aI2 and aI5β from the cox1 transcript pool. Exon (green), intron (red) and co-localized (green/red) puncta were counted in more than 300 cells. The bar chart shows the number of signals per 100 cells. Bar heights display the mean of three biological replicates (each averaged over three technical replicates). Error bars are standard error of the mean. ***p<0.001; **p<0.01; *p<0.05 (ANOVA plus post hoc). White lines mark cell boundaries. White arrows mark examples of exonic puncta that do not co-localize with intronic puncta. (c) qPCR time series of pre-mRNA and mature mRNA levels following induction of Mss116. Mature mRNA for cox1 and cob was quantified using primer pairs (fxT, fbT) overlapping the terminal exon-exon junctions. Pre-mRNA was quantified using a series of primer pairs (fx1-5, fb1-5). For each pair, one primer is located in exonic, the other in intronic sequence, as detailed in Figure 2—figure supplement 4. Each circle (shades of blue for the pre-mRNA and red for the mature transcript) represents the mean value from three biological replicates (each averaged over three technical replicates). UBC6 was used for normalization.
Figure 2—figure supplement 1
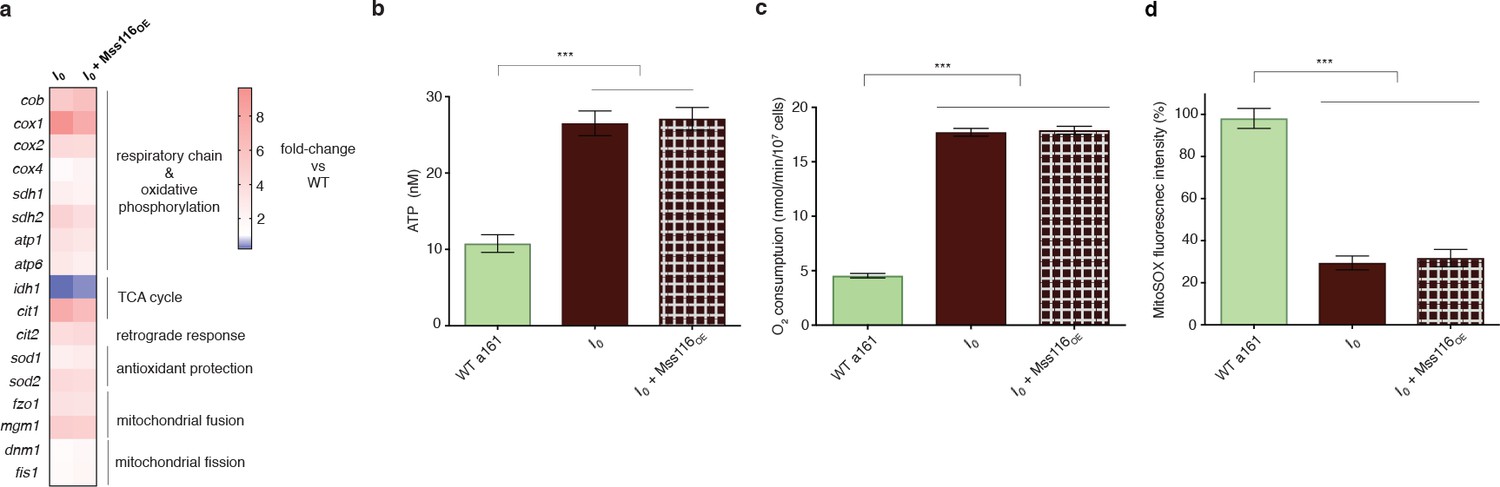
Mss116 overexpression does not affect mitochondrial function in the I0 strain.
(a) Comparison of qPCR measurements in I0 and I0 overexpressing Mss116. Heat maps display mean values of log-fold changes observed across three biological replicates (each averaged over three technical replicates). UBC6 was used for normalization. (b) ATP level, (c) oxygen consumption and (d) ROS level do not change upon overexpression of Mss116 in the I0 genetic background (I0 + Mss116 OE) compared to I0.
Figure 2—figure supplement 2
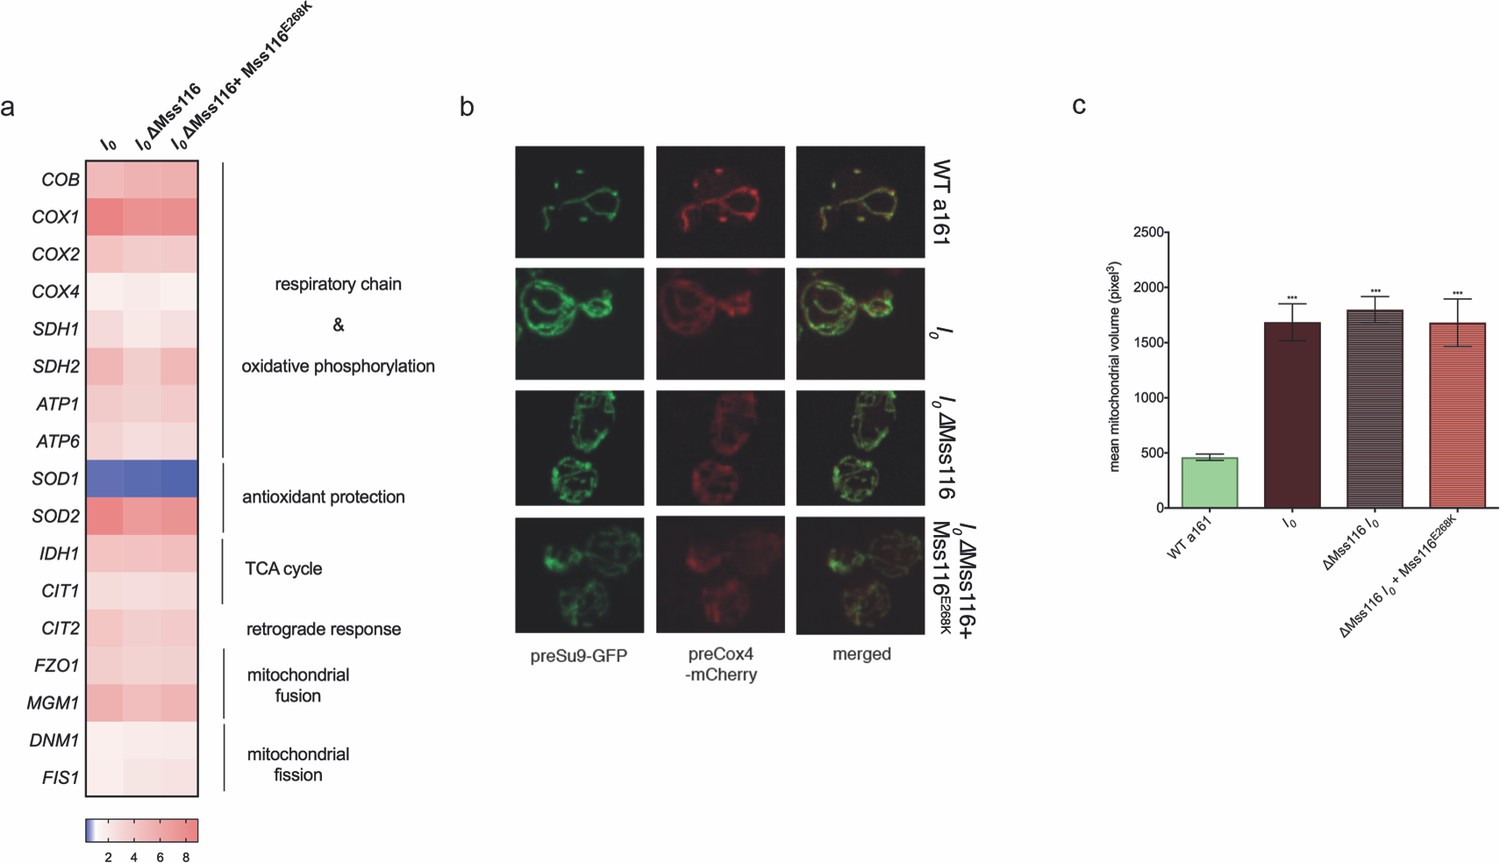
Mss116 deletion does not affect I0 phenotypes, highlighted by (a) the transcript levels (measured by qPCR) of relevant genes, (b) mitochondrial morphology, and (c) mitochondrial volume.
The heat map displays mean values of log-fold changes observed across three biological replicates (each averaged over three technical replicates). UBC6 was used for normalization. In panel (c), bar heights display the mean of three biological replicates (each averaged over three technical replicates). Error bars are standard error of the mean. ***p<0.001; **p<0.01; *p<0.05 (ANOVA plus post hoc).
Figure 2—figure supplement 3

Expression level of Mss116 following induction using 2% galactose.
Circles represent the mean value of three biological replicates (each performed as technical replicate). Error bars are standard error of the mean.
Figure 2—figure supplement 4
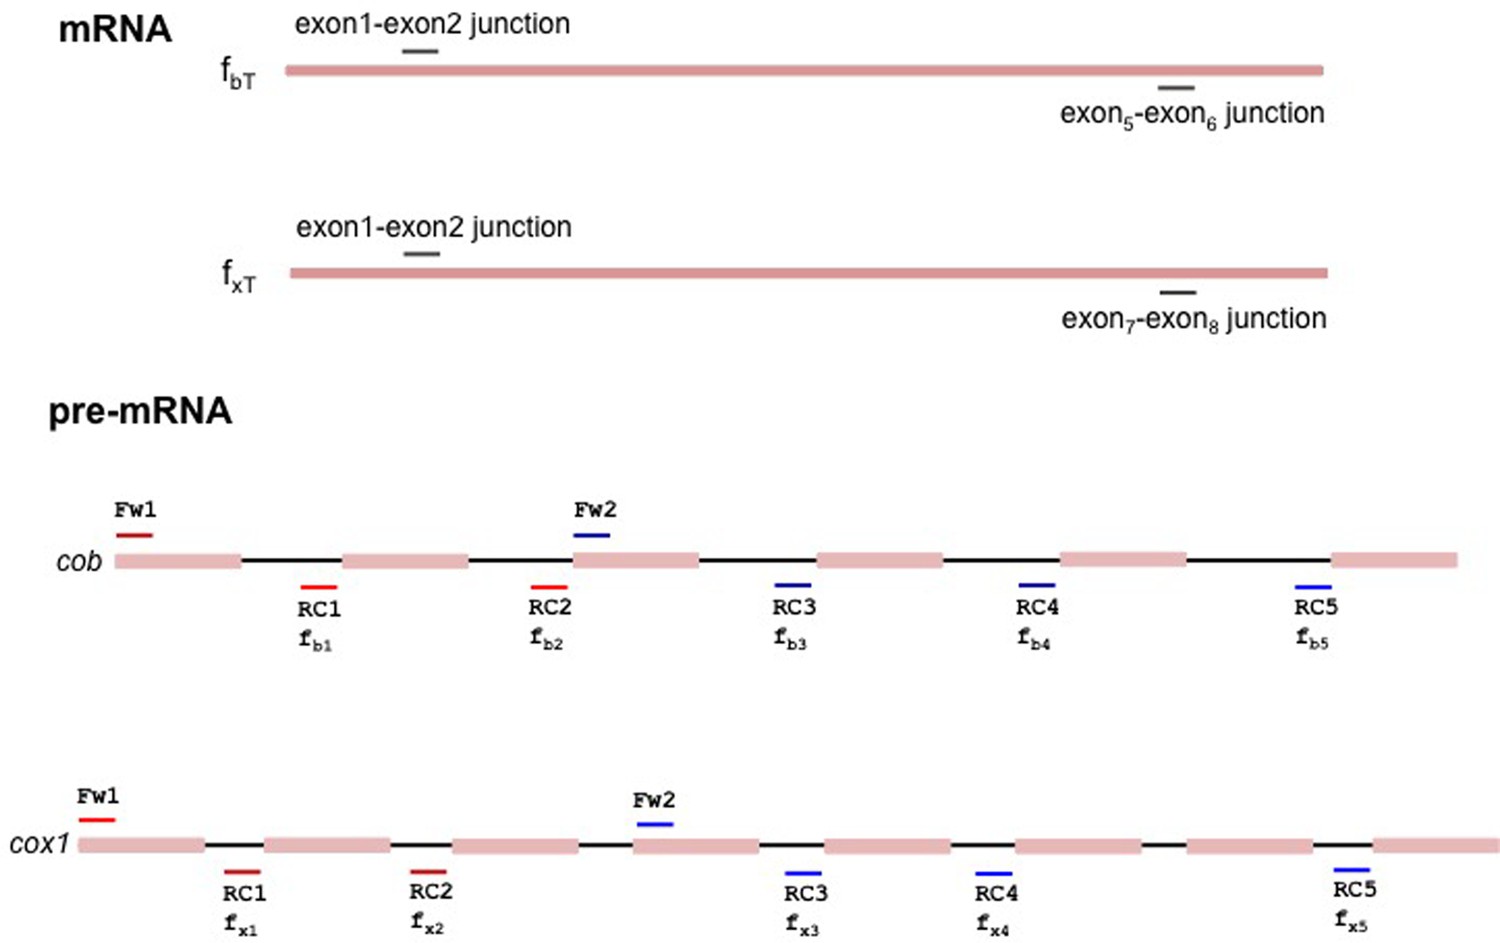
Schematic representation of the fragments of cox1 and cob amplified to determine the pre-mRNA and mature mRNA levels.
https://doi.org/10.7554/eLife.35330.011
Figure 3
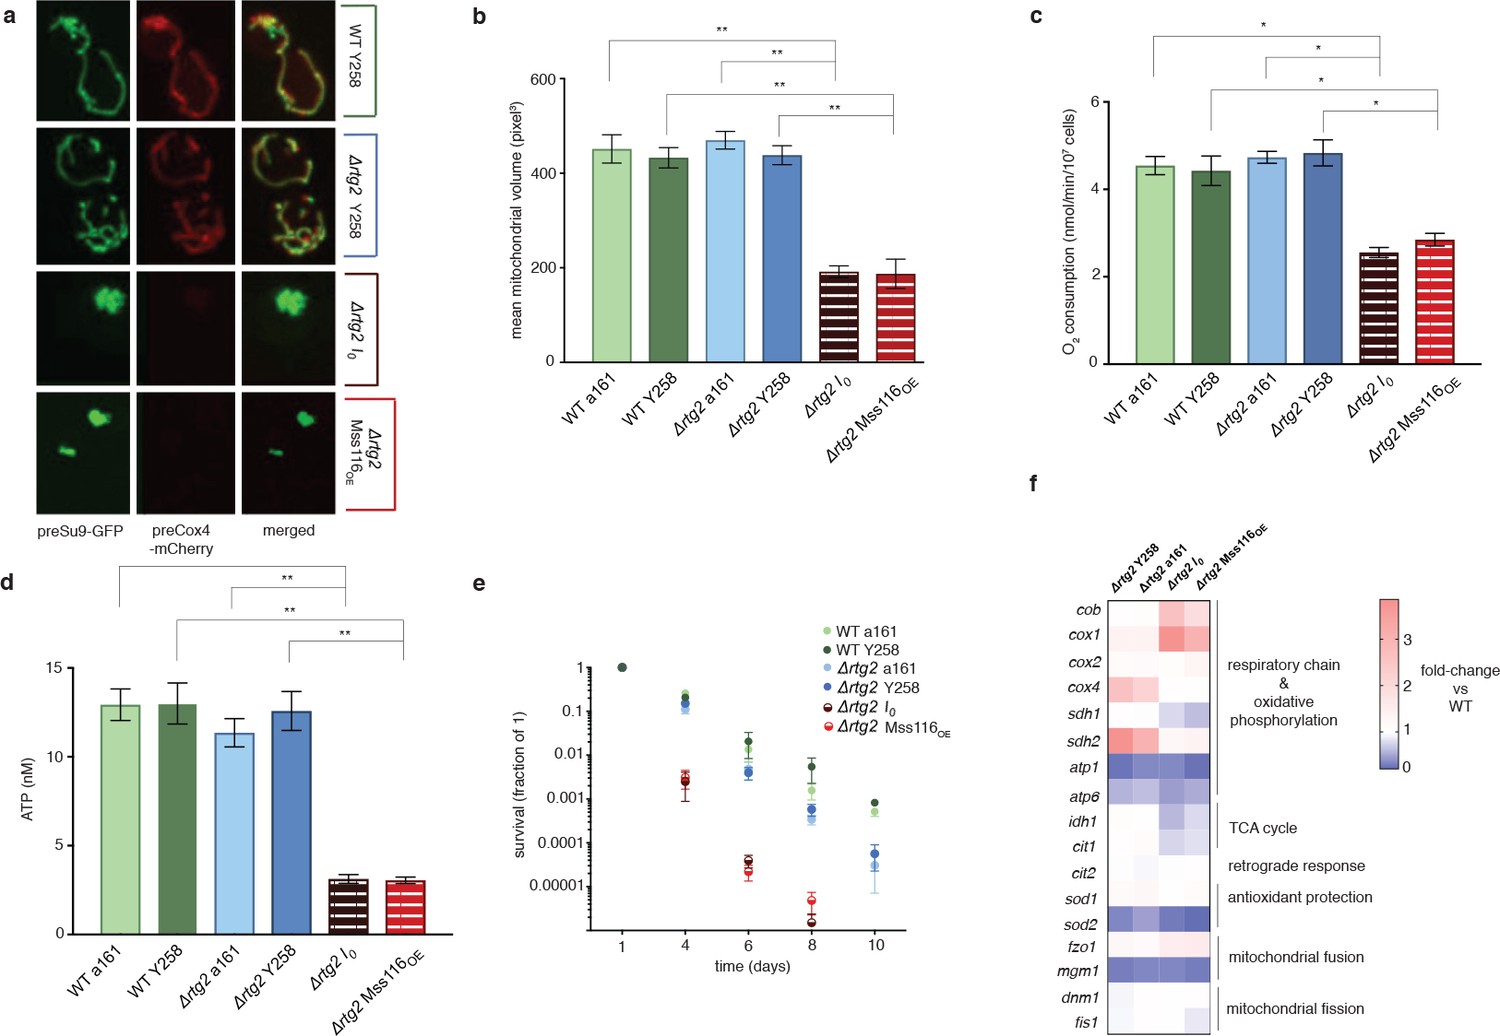
The intronless phenotype requires a functional retrograde response.
(a) Mitochondrial morphology is altered and (b) mitochondrial volume, (c) oxygen consumption, (d) ATP levels, and (e) chronological lifespan are reduced when rtg2 is deleted in the I0 or Mss116OE background. This contrasts sharply with I0 and Mss116OE where rtg2 is intact (see Figure 1). Bar heights display the mean of three biological replicates (each averaged over three technical replicates). Error bars are standard error of the mean. ***p<0.001; **p<0.01; *p<0.05 (ANOVA plus post hoc). (f) Transcriptional responses in different strains where rtg2 has been deleted, as measured by qPCR. Heat maps display mean values of log-fold changes observed across three biological replicates (each averaged over three technical replicates). UBC6 was used for normalization.
Figure 4
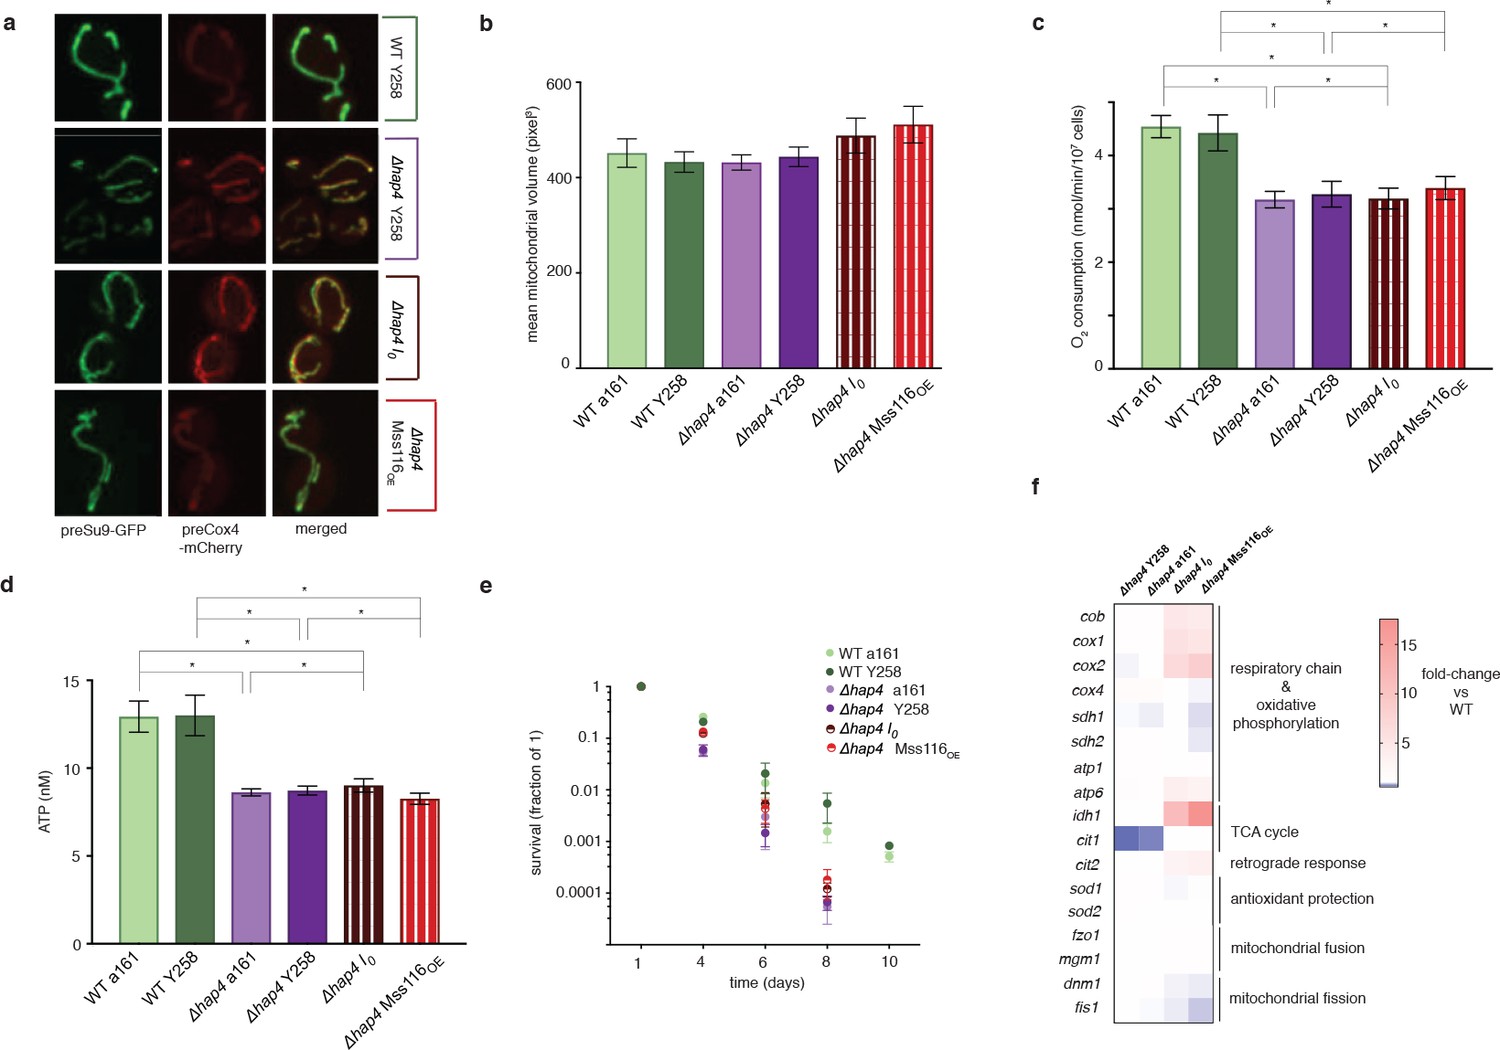
Hap4 is required for the intronless phenotype.
(a) Mitochondrial morphology, (b) mitochondrial volume, (c) oxygen consumption, (d) ATP levels, and (e) chronological lifespan do not differ between I0/Mss116OE and their corresponding control strains if hap4 has been deleted. Bar heights display the mean of three biological replicates (each averaged over three technical replicates). Error bars are standard error of the mean. ***p<0.001; **p<0.01; *p<0.05 (ANOVA plus post hoc). (f) Transcriptional responses in different strains where hap4 has been deleted, as measured by qPCR. Heat maps display mean values of log-fold changes observed across three biological replicates (each averaged over three technical replicates). UBC6 was used for normalization.
Figure 5 with 1 supplement
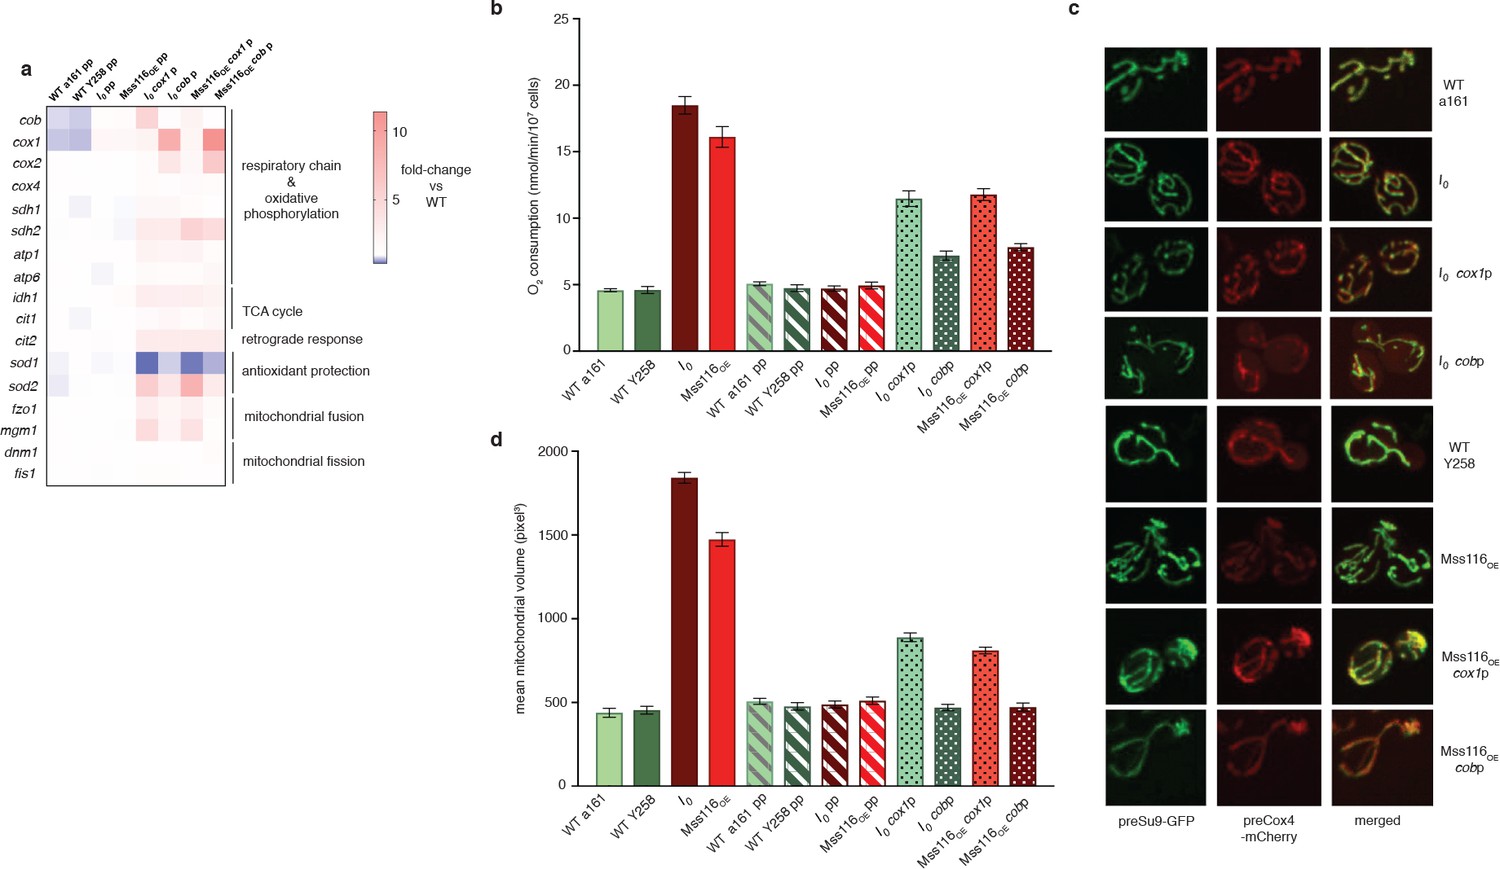
Dampening RNA levels of cox1 and cob by reducing promoter activity partially rescues the intronless phenotype.
(a) qPCR measurements in strains where either the cob promoter (cobp), the cox1 promoter (cox1p) or both (pp) have been attenuated via targeted mutations. Heat maps display mean values of log-fold changes observed across three biological replicates (each averaged over three technical replicates). UBC6 was used for normalization. (b) Oxygen consumption and (c) mitochondrial morphology and (d) volume in response to promoter attenuation. Bar heights display the mean of three biological replicates (each averaged over three technical replicates). Error bars are standard error of the mean. Asterisks to indicate statistical significance are omitted for clarity. All comparisons between single- and double-promoter mutants and the corresponding parent strains are significant at p<0.001 (ANOVA plus post hoc).
Figure 5—figure supplement 1

Schematic representation of mutated positions in the promoter regions of cox1 and cob.
https://doi.org/10.7554/eLife.35330.015Additional files
-
Supplementary file 1
Compiled list of oligonucleotide sequences used in this study.
The file consist of lists of qPCR and cloning primers, as well as sequences of RNA FISH probes, as separate tabs.
- https://doi.org/10.7554/eLife.35330.016
-
Transparent reporting form
- https://doi.org/10.7554/eLife.35330.017
Download links
A two-part list of links to download the article, or parts of the article, in various formats.
Downloads (link to download the article as PDF)
Open citations (links to open the citations from this article in various online reference manager services)
Cite this article (links to download the citations from this article in formats compatible with various reference manager tools)
Normal mitochondrial function in Saccharomyces cerevisiae has become dependent on inefficient splicing
eLife 7:e35330.
https://doi.org/10.7554/eLife.35330


