cisTEM, user-friendly software for single-particle image processing
- Howard Hughes Medical Institute, United States
Figures
Figure 1
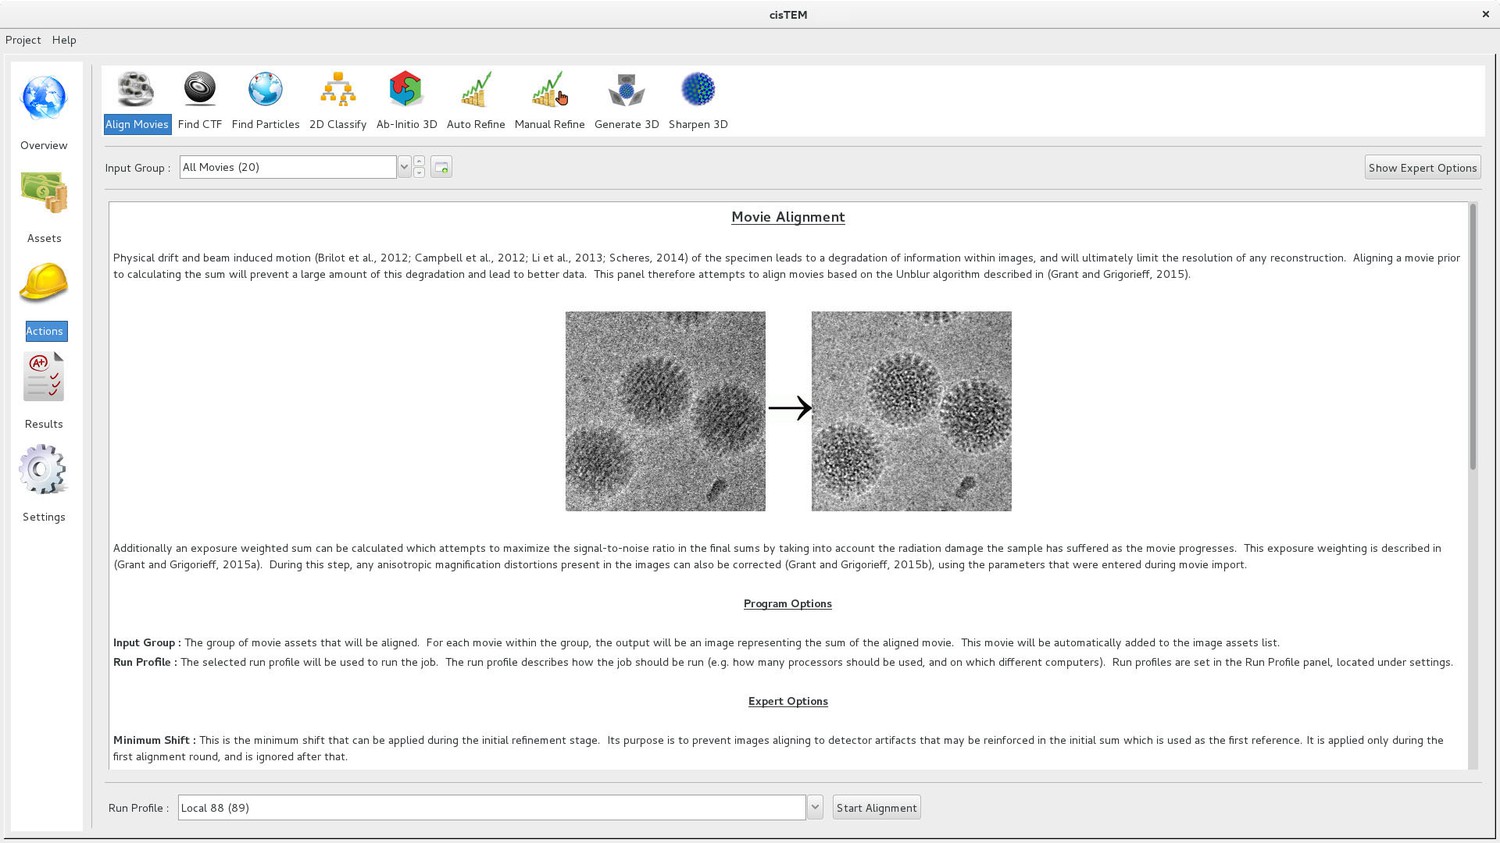
Movie alignment panel of the cisTEM GUI.
All Action panels provide background information on the operation they control, as well as a section with detailed explanations of all user-accessible parameters. All Action panels also have an Expert Options section that exposes additional parameters.
Figure 2

Thon ring pattern calculated for micrograph ‘0000’ of the high-resolution dataset of β-galactosidase (Bartesaghi et al., 2015) used to benchmark cisTEM.
The left pattern was calculated from the average of non-exposure filtered and aligned frames while the right pattern was calculated using the original movie with 3-frame sub-averages. The pattern calculated using the movie shows significantly stronger rings compared to the other pattern.
Figure 3
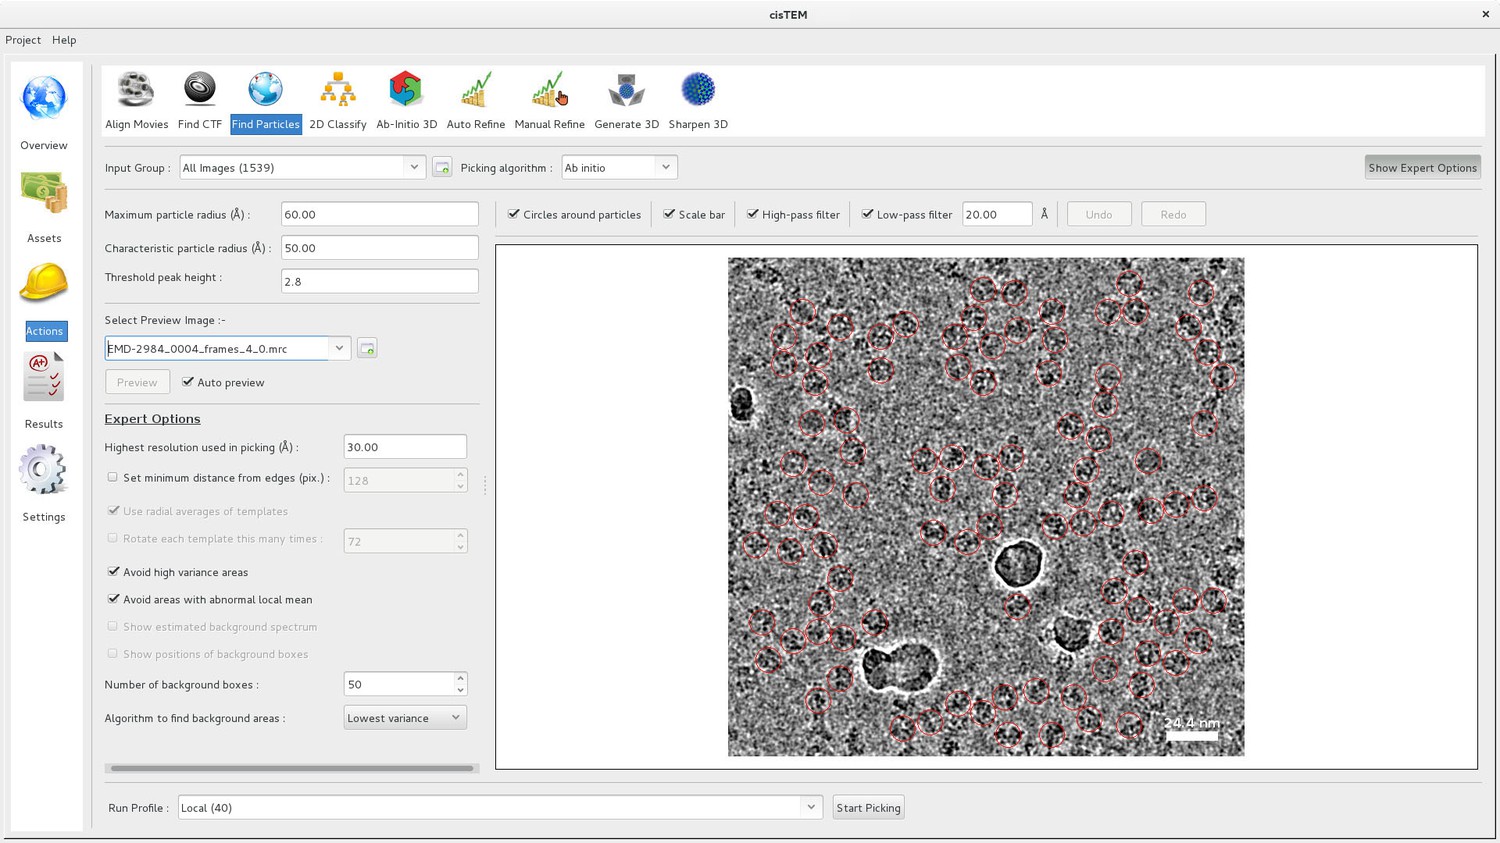
Particle picking panel of the cisTEM GUI.
The panel shows the preview mode, which allows interactive tuning of the picking parameters for optimal picking. The red circles overlaying the image of the sample indicate candidate particles. The picking algorithm avoids areas of high variance, such as the ice contamination visible in the image.
Figure 4
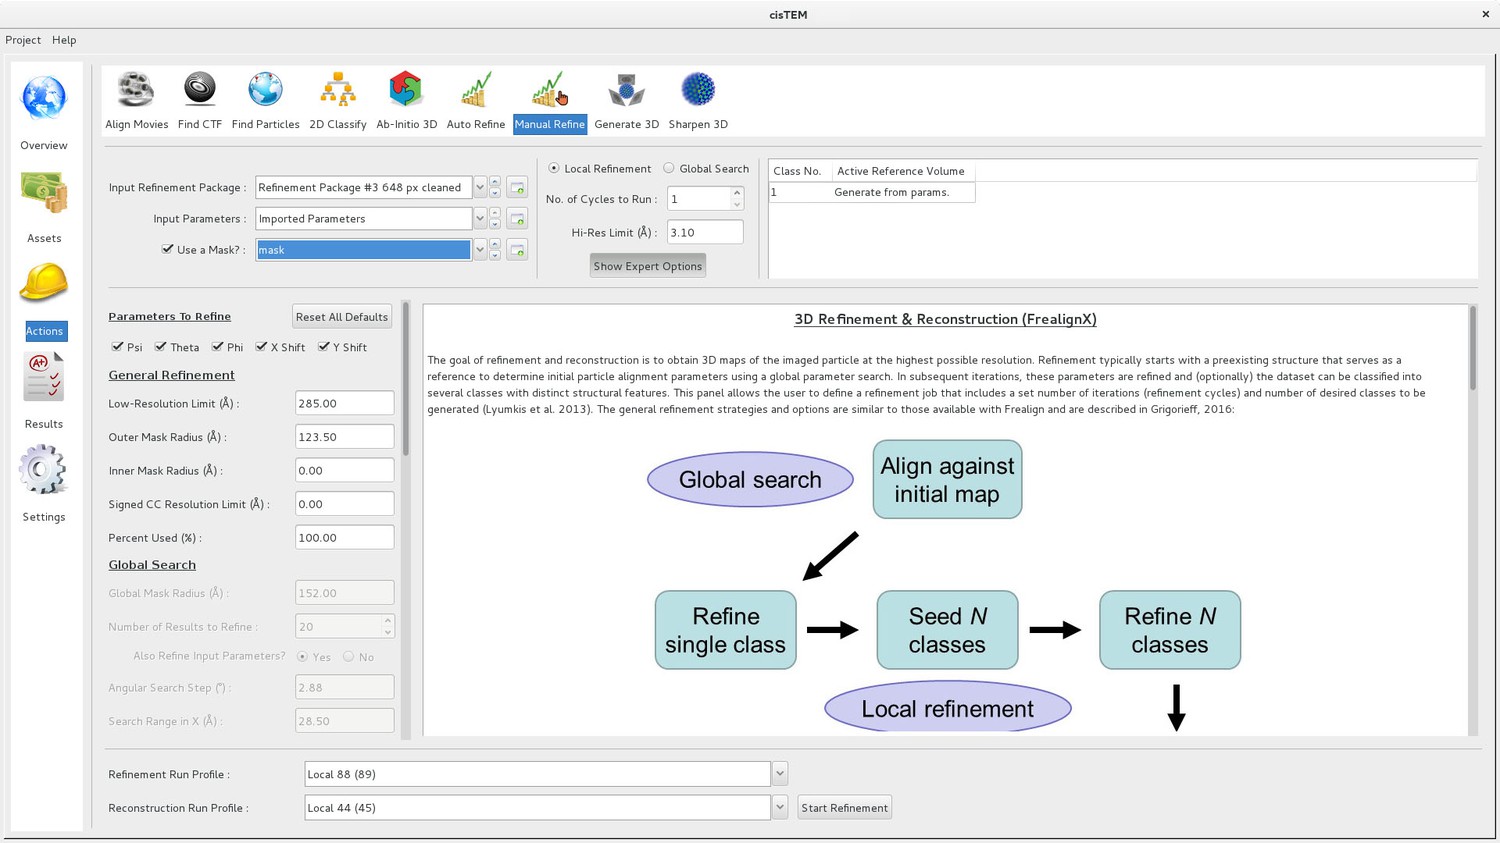
Manual refinement panel with Expert Options exposed.
Most of the parameters needed to run FrealignX can be accessed on this panel. The panel also allows application of a 3D mask, which can be imported as a Volume Asset.
Figure 5
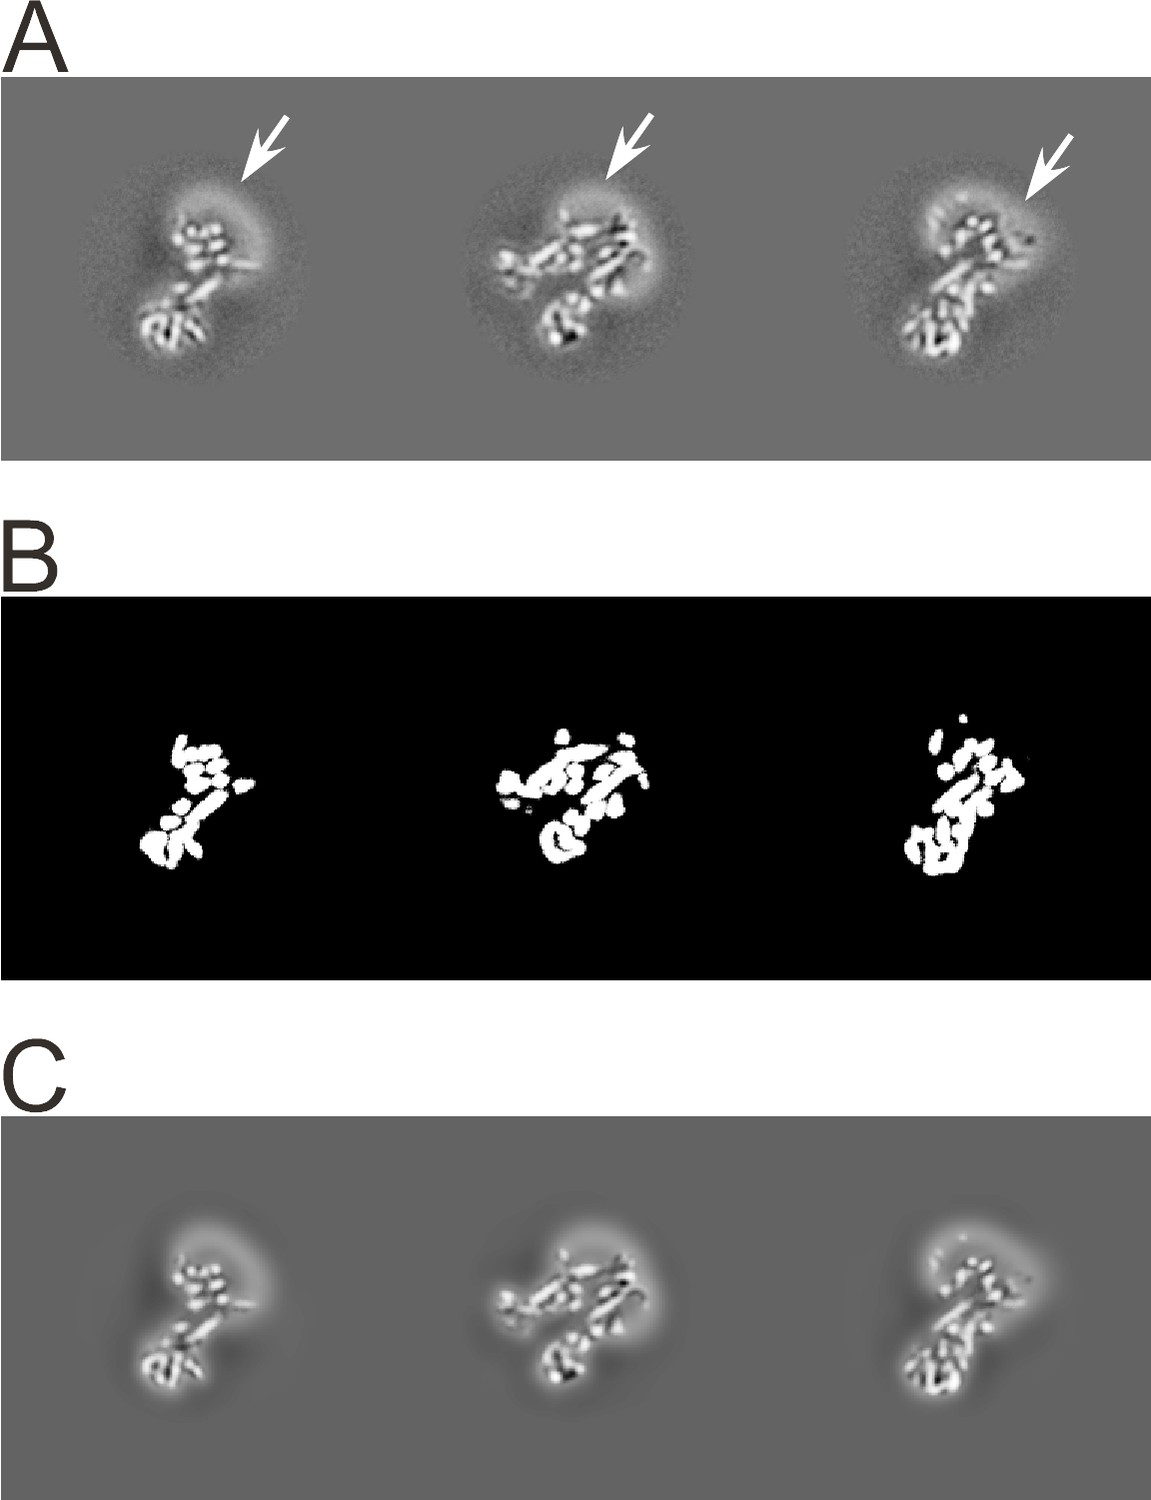
3D masking with low-pass filtering outside the mask.
(A) Orthogonal sections through the 3D reconstruction of the transporter associated with antigen processing (TAP), an ABC transporter (Oldham et al., 2016). Density corresponding to the protein, as well as the detergent micelle (n-Dodecyl b-D-maltoside; highlighted with arrows), is visible. (B) Orthogonal sections through a 3D mask corresponding to the sections shown in A). The sharp edges of this mask are smoothed before the mask is applied to the map. (C) Orthogonal sections through the masked 3D reconstruction. The regions outside the mask are low-pass filtered at 30 Å resolution to remove high-resolution noise from the disordered detergent micelle, but keeping its low-resolution signal to help particle alignment.
Figure 6
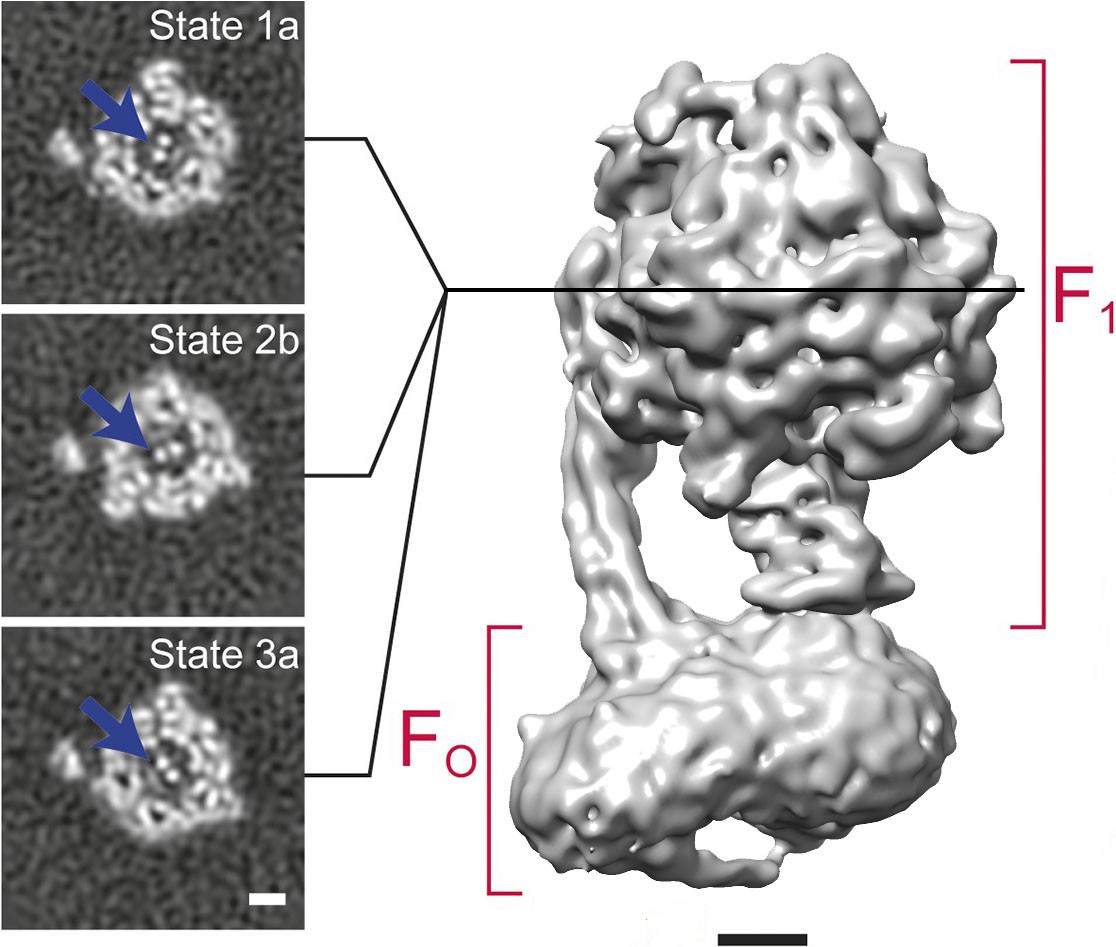
3D classification of a dataset of F1FO-ATPase, revealing different conformational states (reproduced from Figure 6A and B in Zhou et al., 2015).
Sections through the F1 domain showing the γ subunit (arrows) in three different states related by 120° rotations are shown on the left. A surface rendering of the map corresponding to State 1a is shown on the right. Scale bars, 25 Å.
Figure 7
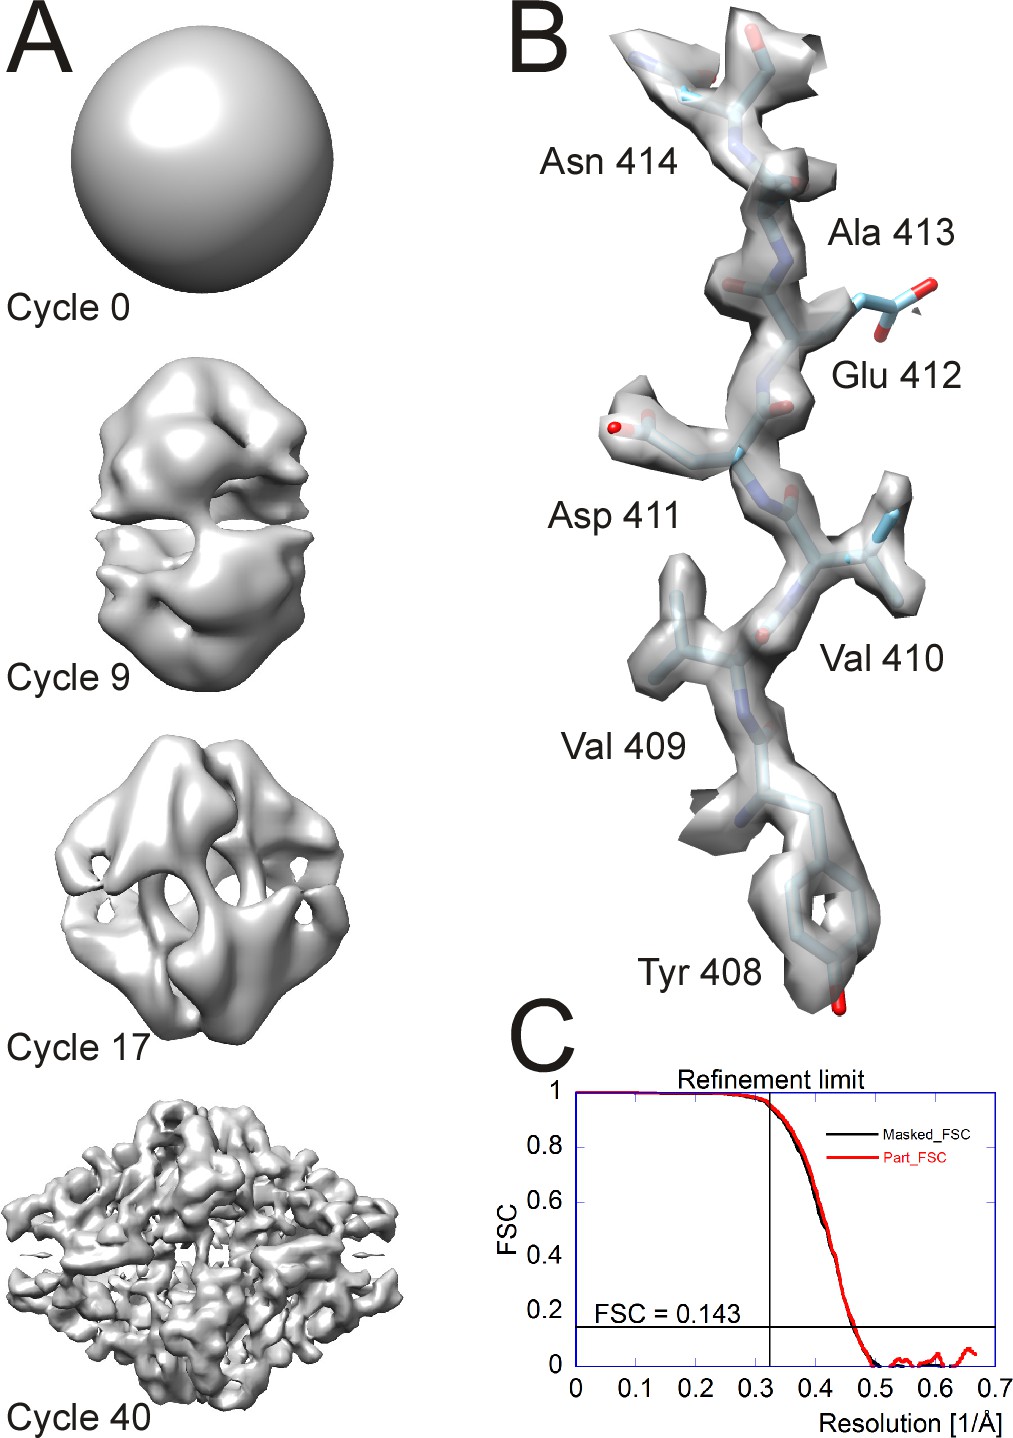
Processing results of the β-galactosidase dataset (Bartesaghi et al., 2015) used to benchmark cisTEM.
(A) Different stages of the ab-initio reconstruction procedure, starting from a reconstruction from randomly assigned Euler angles. The process takes less than an hour to complete on a high-end CPU-based workstation. (B) High-resolution detail of the refined β-galactosidase reconstruction with an average resolution of 2.2 Å, showing sidechain details for most amino acids. (C) FSC plots for the refined β-galactosidase reconstruction. The black curve was calculated using a tight mask applied to the half maps (Masked_FSC). A correction for potential masking artifacts (Chen et al., 2013) did not lead to adjustments of this curve. The red curved was calculated with a more generous spherical mask and adjusted for the solvent background within that mask (Part_FSC, Equation (19)). The resolution limit of 3.1 Å, which was not exceeded during refinement, as well as the FSC = 0.143 threshold are indicated by lines.
-
Figure 7—source data 1
Source data for the curves shown in Figure 7C.
- https://doi.org/10.7554/eLife.35383.009
Tables
Table 1
Benchmarking of cisTEM using a high-resolution dataset of β-galactosidase (Bartesaghi et al., 2015).
https://doi.org/10.7554/eLife.35383.010| Processing step | Details | Time (hours) |
|---|---|---|
| Movie processing | 1539 movies, 38 frames, super-resolution | 1.1 |
| CTF determination | Using aligned movie average as input | 0.1 |
| Particle picking | 131,298 particles | 0.1 |
| 2D classification | 50 classes, 28 selected with 119,523 particles | 0.8 |
| Ab initio 3D reconstruction | 40 iterations | 0.8 |
| Auto refinement | 8 iterations, final resolution 2.2 Å | 1.4 |
| Manual refinement | 1 iteration (incl. defocus), final resolution 2.2 Å | 0.4 |
| Total | 4.7 |
Additional files
-
Source code 1
Source code for cisTEM 1.0 beta.
- https://doi.org/10.7554/eLife.35383.011
-
Transparent reporting form
- https://doi.org/10.7554/eLife.35383.012
Download links
A two-part list of links to download the article, or parts of the article, in various formats.
Downloads (link to download the article as PDF)
Open citations (links to open the citations from this article in various online reference manager services)
Cite this article (links to download the citations from this article in formats compatible with various reference manager tools)
cisTEM, user-friendly software for single-particle image processing
eLife 7:e35383.
https://doi.org/10.7554/eLife.35383


