Hexameric and pentameric complexes of the ExbBD energizer in the Ton system
- RIKEN SPring-8 Center, Japan
- University of Fukui, Japan
Figures
Figure 1 with 3 supplements

Crystal structure of the ExbB hexamer.
(A) Viewed from the periplasmic side indicated by a red arrow in (C). (B) From the cytoplasmic side indicated by a blue arrow in (C). (C) Viewed parallel to the membrane. Overlaid with volume rendering (Smart et al., 1996) inside the central channel. Long α-helices are labelled α2, α5, α6 and α7 for one subunit in cyan. See also Figure 2A. (D) Plots of the channel radii (Smart et al., 1996) of the hexamer (solid line) and pentamer (dashed line; Celia et al., 2016).
Figure 1—figure supplement 1
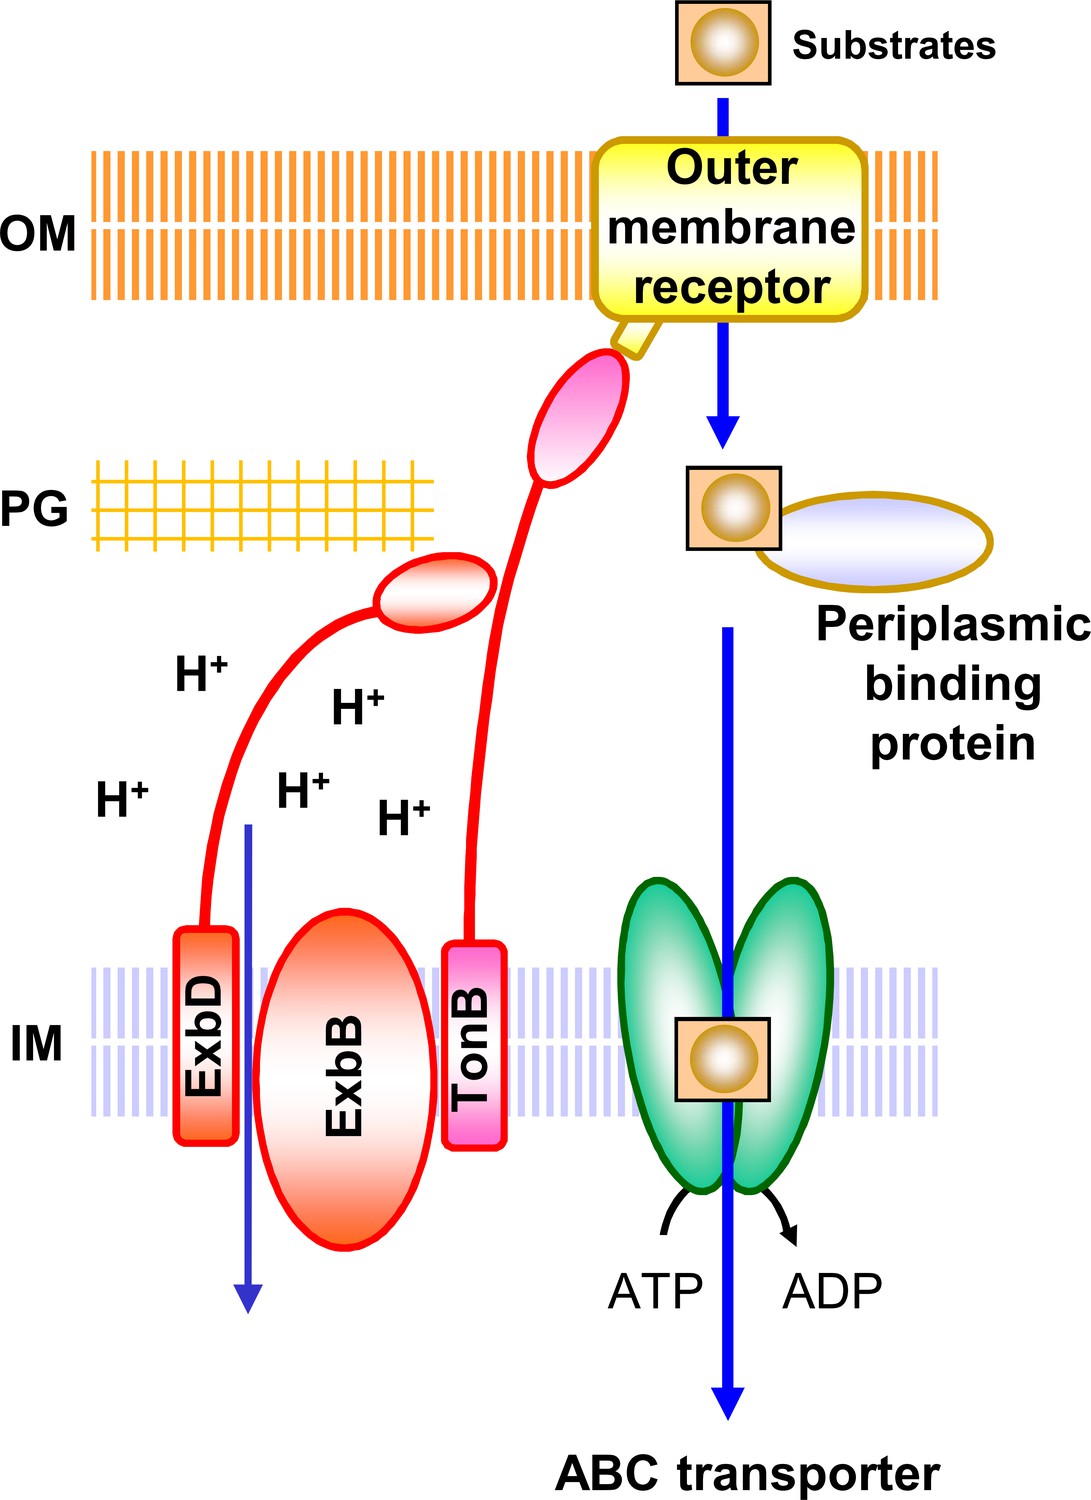
Schematic diagram of TM transport mediated by the Ton system.
The energy source for the uptake of substrates through the outer membrane receptors is provided by the Ton complex from an electrochemical potential gradient across the inner membrane. The Ton complex consists of three proteins, ExbB, ExbD and TonB. ExbD has a peptidoglycan-binding domain (Garcia-Herrero et al., 2007; Wojdyla et al., 2015) and also interacts with TonB through their periplasmic domains for function (Ollis et al., 2009; Gresock et al., 2015). Substrates include siderophore, vitamin B12, haem, maltodextrin, sucrose, nickel, cobalt, colicin, etc. (Faraldo-Gómez and Sansom, 2003; Noinaj et al., 2010; Krewulak and Vogel, 2011; Schauer et al., 2008). With the help of periplasmic binding proteins, the substrates are then transported into the cell by specific ABC transporters using the energy provided by ATP hydrolysis. There are many TonB-dependent outer membrane receptors (FhuA, FepA, FecA, BtuB, HemR etc.), periplasmic-binding proteins (FhuD, FepB, FecB, BtuF, HemT etc.), and ABC transporters (FhuBC, FepCDG, FecCDE, BtuCD, HemUV etc.) (Faraldo-Gómez and Sansom, 2003; Noinaj et al., 2010; Krewulak and Vogel, 2011; Schauer et al., 2008). Some substrates use other transporters to pass through the inner membrane (Schauer et al., 2008). IM, inner membrane; PG, peptidoglycan layer; OM, outer membrane.
Figure 1—figure supplement 2
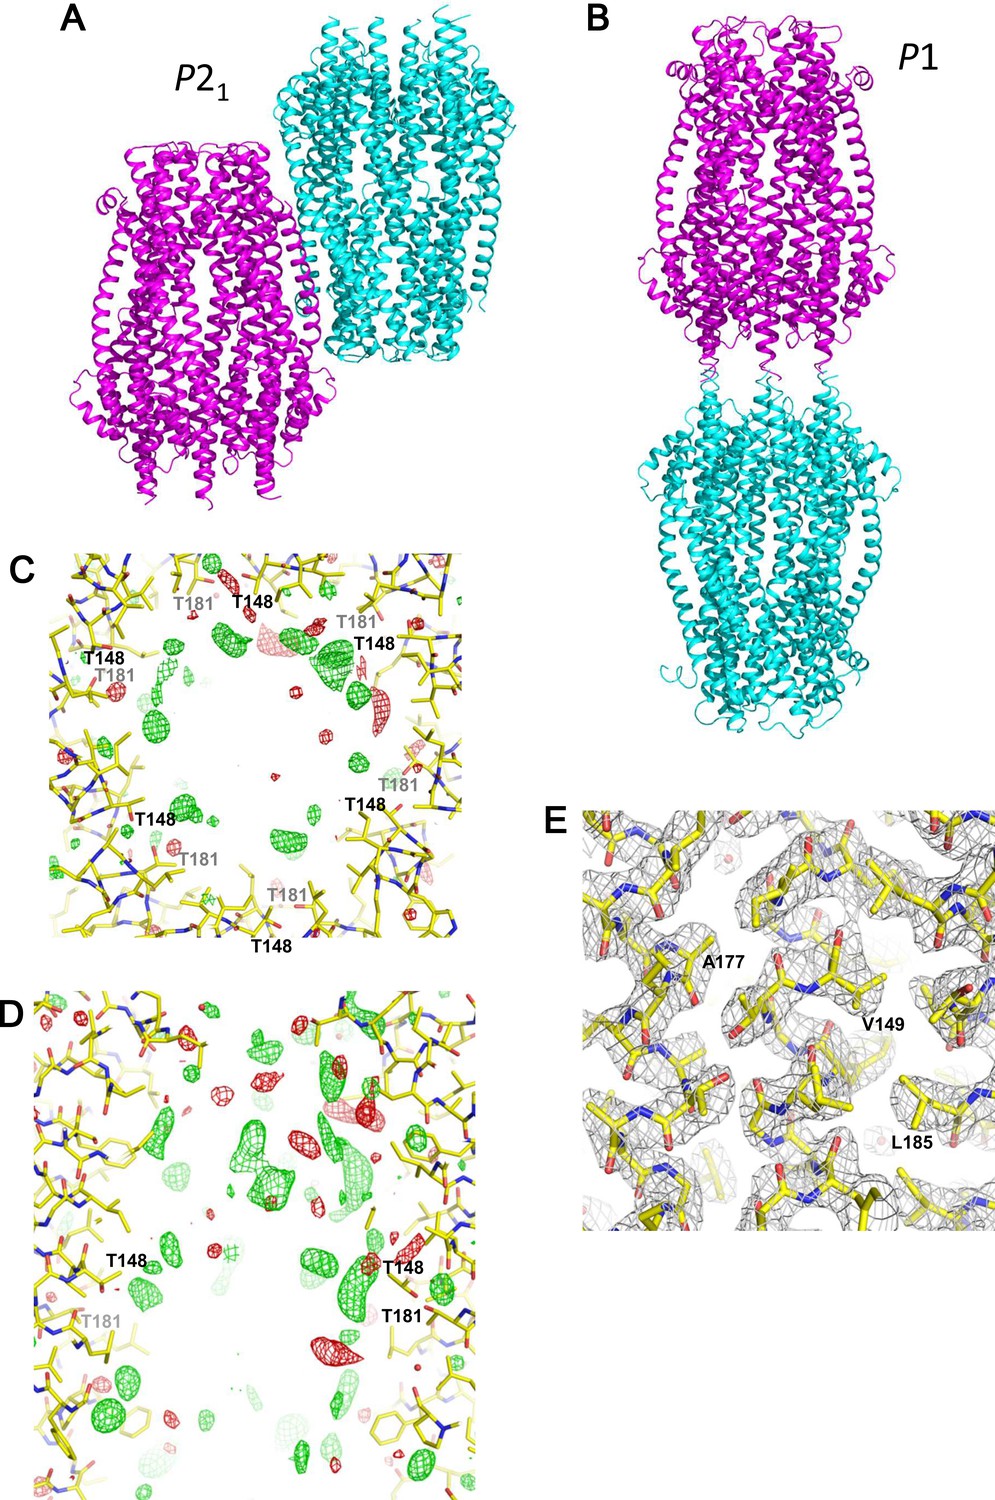
Crystal packing and electron density maps of the ExbB hexamer.
(A) Two hexamers in the asymmetric unit of a crystal in space group P21. (B) Two hexamers in the asymmetric unit in P1. The two hexamers are disposed upside down with respect to each other in both crystals. (C, D) A difference Fourier (σA-weighted |Fobs| - |Fcalc|) maps in the central channel. Top (C) and side (D) views. Untraceable masses inside the channels are indicated by green and red nets contoured at 3.0σ and −3.0σ, respectively. (E) Electron density map (σA-weighted 2 |Fobs| - |Fcalc|) in the TM region contoured at 1.5σ. Overlaid with the atomic model of the ExbB hexamer.
Figure 1—figure supplement 3
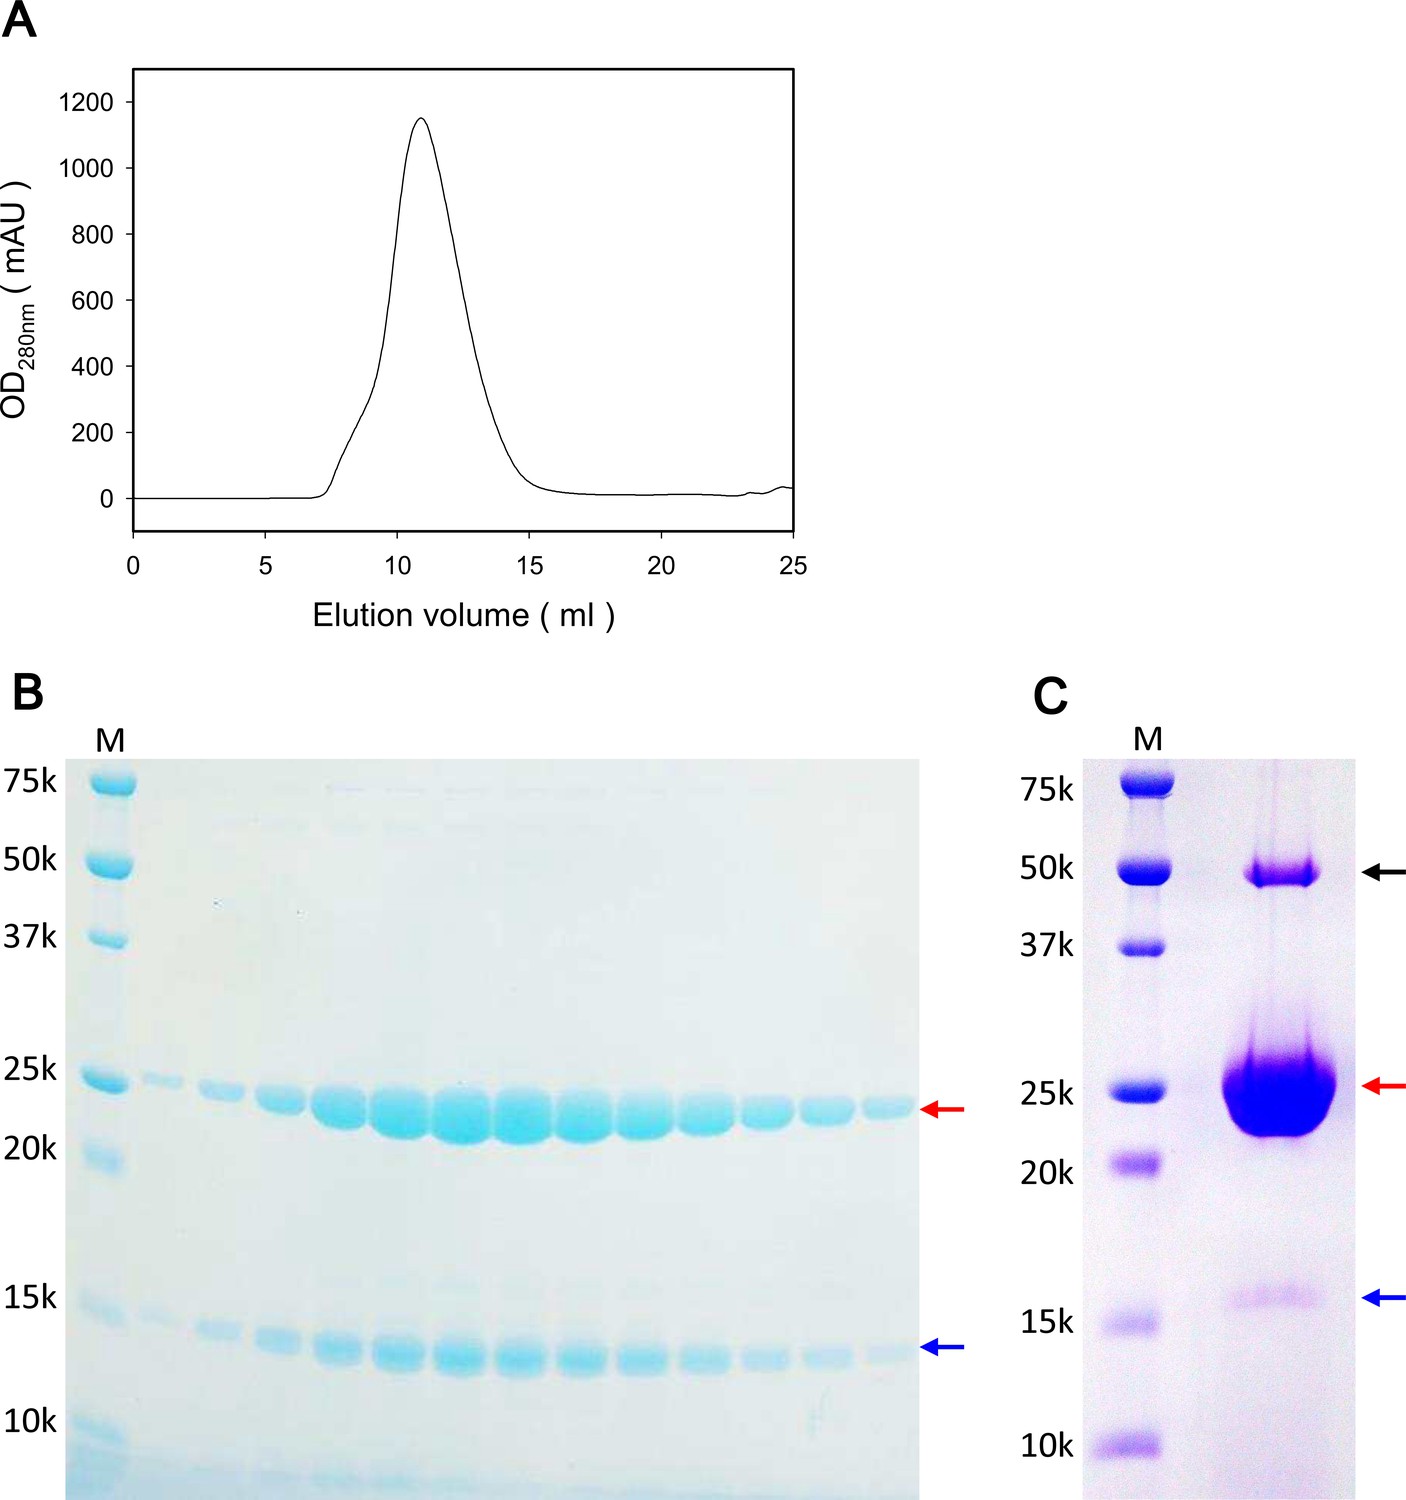
Characterization of purified ExbB and ExbD and crystals grown at pH 9.0.
(A) Elution profile of size exclusion chromatography (SEC) of the ExbBD complex. (B) A SDS-PAGE pattern of SEC fractions in (A) on a 15% homogeneous gel. (C) SDS-PAGE of crystals collected from crystallization drops. From bands cut out of the gel, peptide mass finger printing analysis identified ExbB (red arrows) and ExbD (blue arrows) with remarkably high identity scores. No other candidates were flagged in the SwissProt database by Mascot analysis (Perkins et al., 1999). A band with a black arrow corresponded to the dimer and the hexamer of ExbB, respectively. Lanes marked 'M' indicate marker.
Figure 2 with 1 supplement
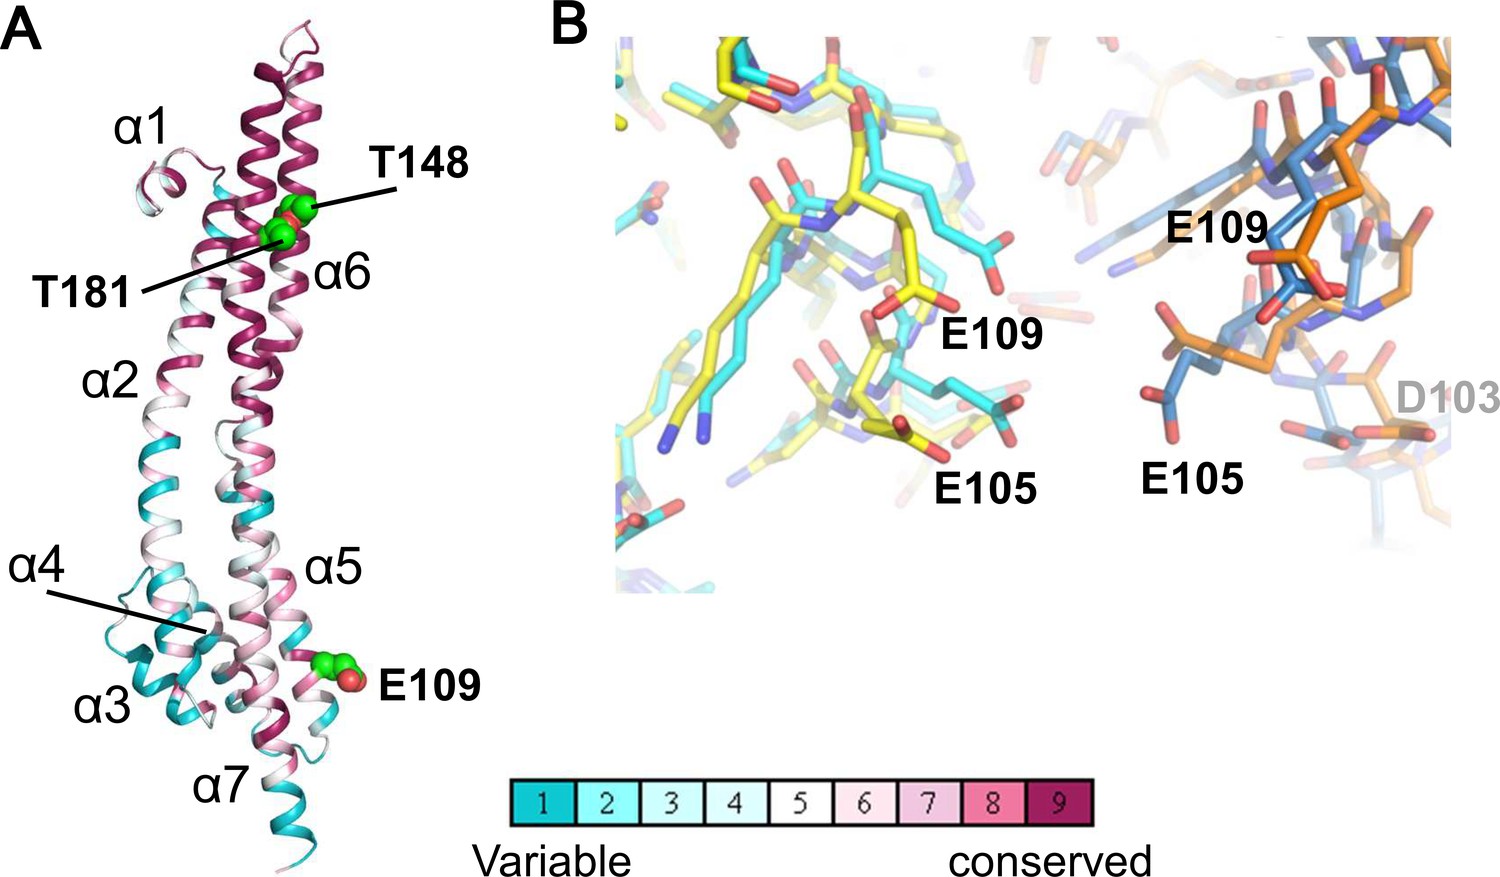
Structure of the ExbB monomer and interface between two subunits at the cytoplasmic end in the crystal.
(A) ExbB monomer in gradient colour representation for conserved and variable amino acids (Landau et al., 2005). Sequences were compared over 150 homologous proteins from the Uniprot database and aligned with BLAST. Thr 148 and Thr 181 face inside the channel. These threonines and Glu 109 in the acidic cluster (B) are displayed in CPK representation. (B) The acidic cluster between two neighbouring subunits in the cytoplasmic end. Viewed from inside the channel. See also Figure 2—figure supplement 1C. Stick representations for subunits of the hexamer in yellow and orange, and those of the pentamer in cyan and sky blue.
Figure 2—figure supplement 1
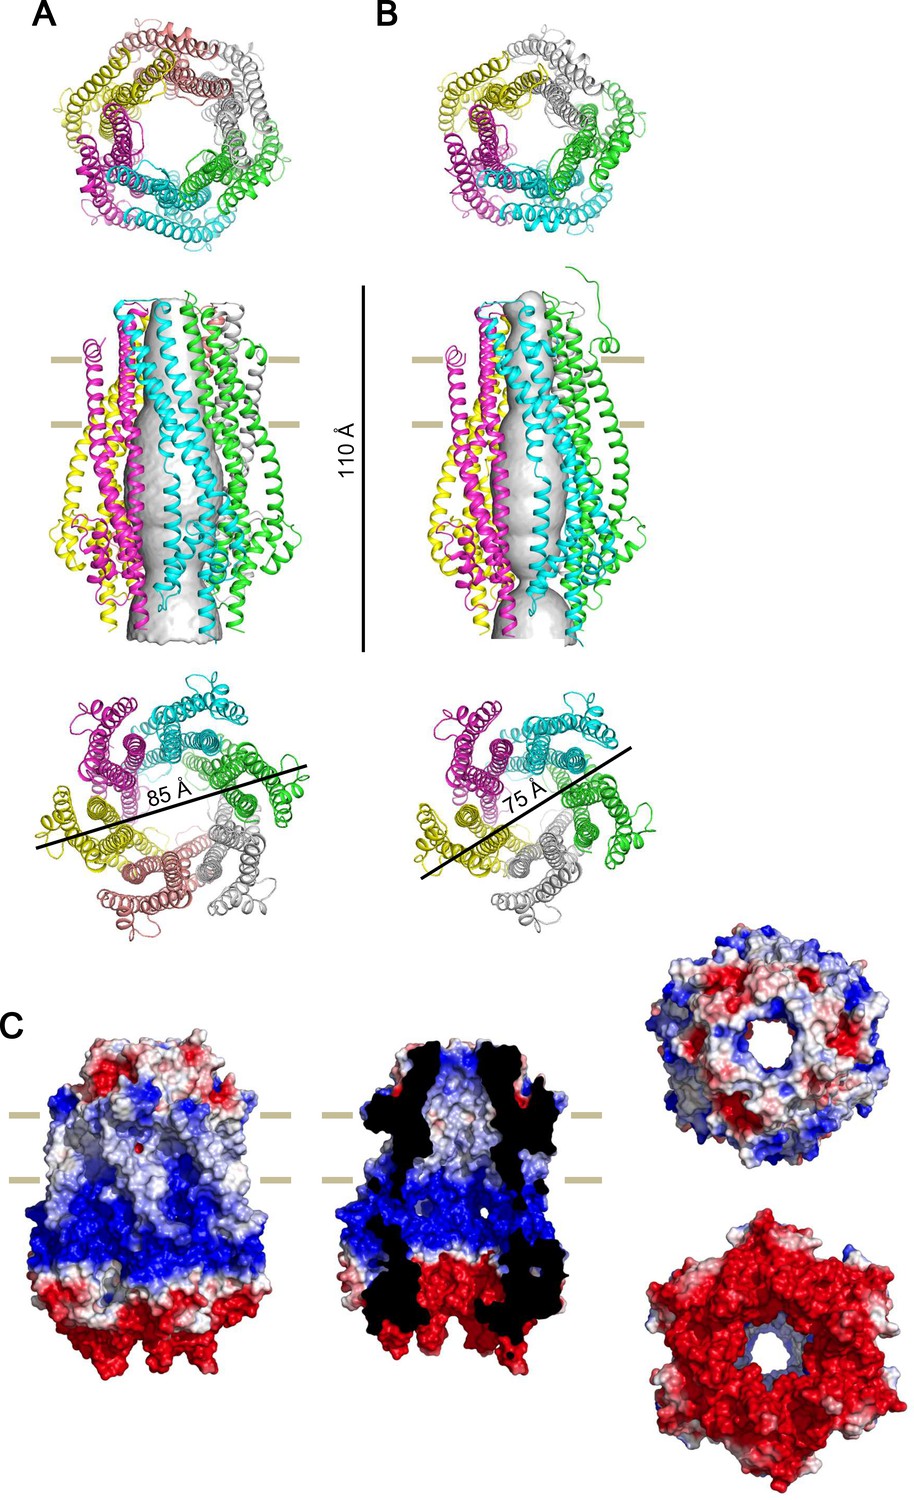
Side by side comparison of the crystal structure of the ExbB hexmer and pentamer, and electrostatic surface of the hexamer.
(A) Hexamer. (B) Pentamer (Celia et al., 2016). Figures at upper, middle, and lower correspond to top, side, and bottom views, respectively. Channel rendering (Smart et al., 1996) is overlaid in the side views. (C) Electrostatic surface (Unni et al., 2011) is displayed with electropositivity in blue and electronegativity in red. Figures at left, middle, top right and bottom right correspond to side, cut-out, top and bottom views, respectively.
Figure 3
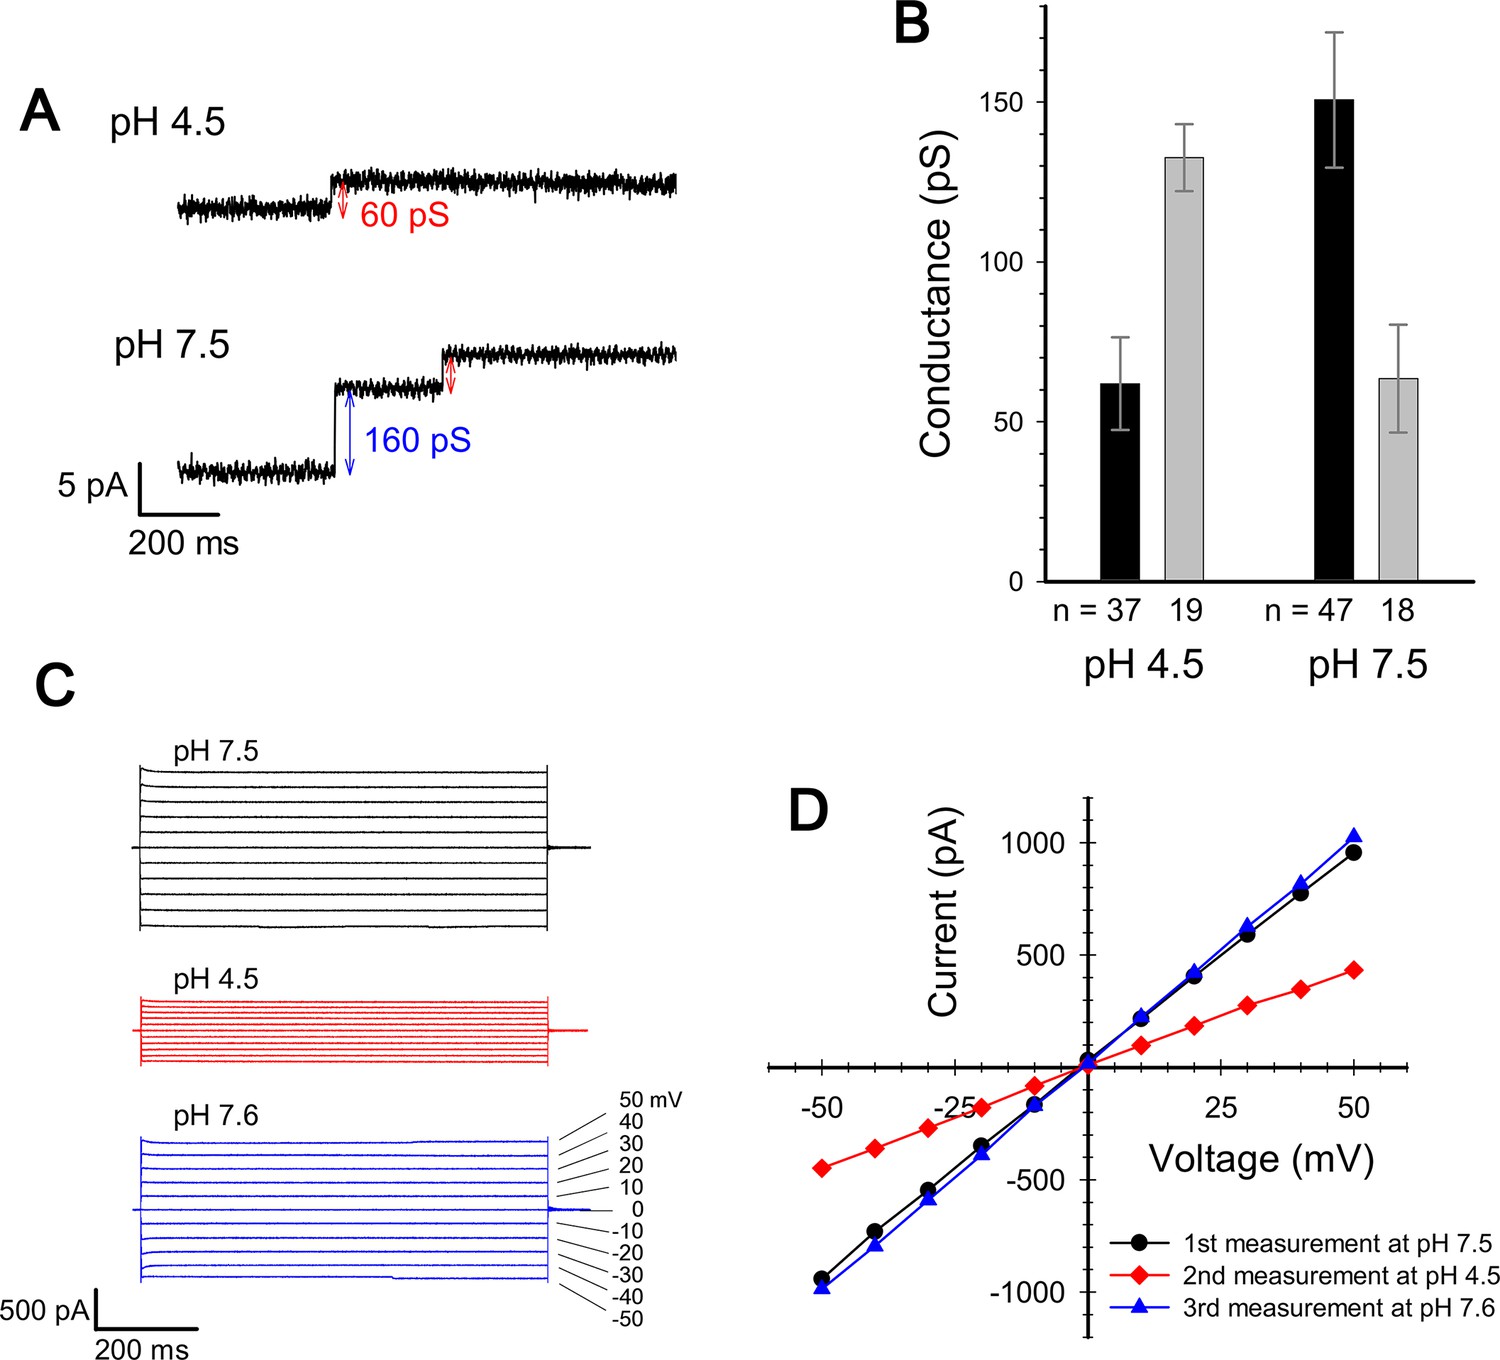
Current measurement for ExbBD complexes in planar lipid bilayers.
(A) Typical charts of channel current at pH 7.5 and pH 4.5 with a voltage of ± 50 mV. (B) The single channel conductance at pH 4.5 and 7.5. Two major modes are shown with number of observations (n). Incremental points as in (A) were counted as the event of the single channel, as it is unlikely that two events occur simultaneously. (C) Macroscopic current traces upon voltage steps for many ExbBD complexes in the planar bilayers. The current was first measured at pH 7.5 (black) and then the solutions in the cis and trans chambers were changed to pH 4.5 (red) for another measurement by adding succinic acid. After that, it was returned to pH 7.6 (blue) with Tris buffer. (D) Current-voltage diagrams of the datasets in (C).
Figure 4 with 1 supplement
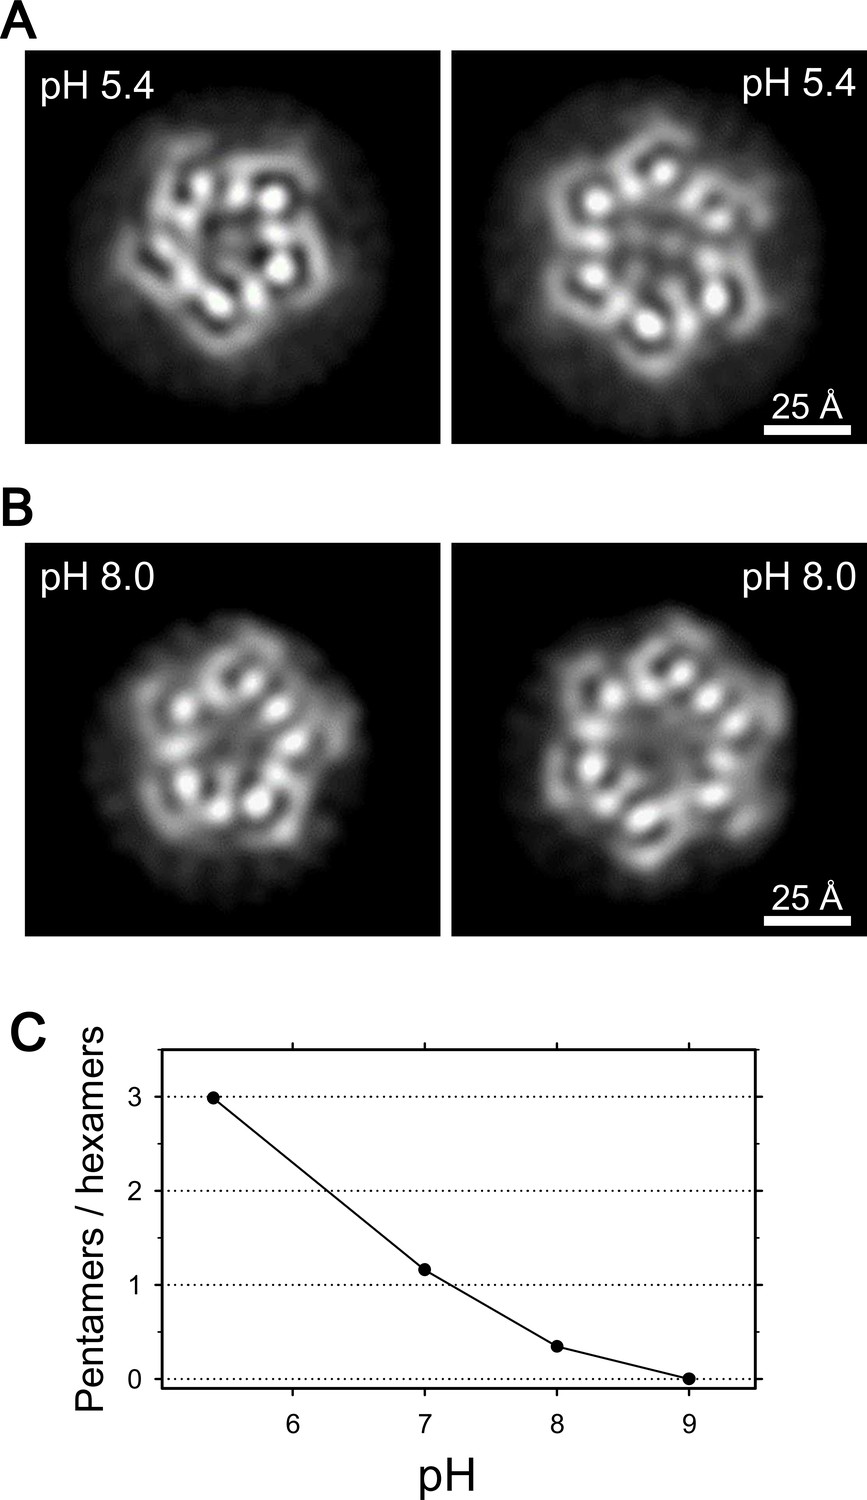
Coexistence of hexameric and pentameric ExbBD complexes.
(A) 2D class average at pH 5.4. (B) 2D class average at pH 8.0. (C) Plot showing the ratio of particle numbers contributed to pentameric averages against those to the hexameric averages. See also Supplementary file 1-Table S2 for the particle numbers.
Figure 4—figure supplement 1
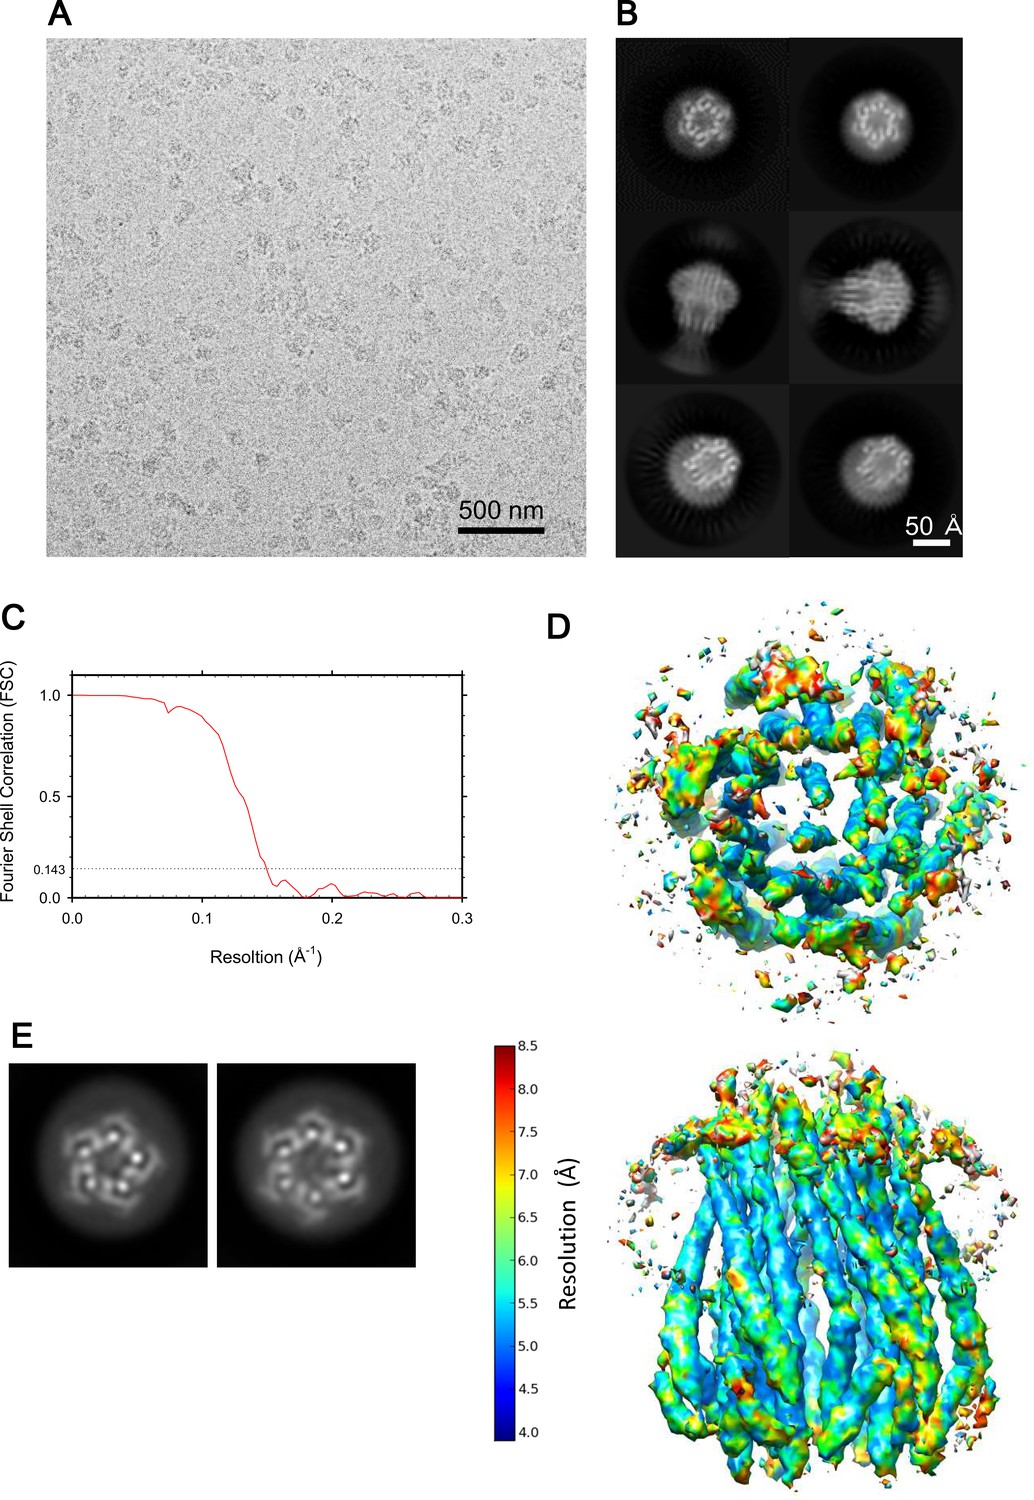
Cryo-EM images of the ExbBD complex, and resolution estimates.
(A) A representative image of the ExbBD complex embedded in vitreous ice at pH 8.0. (B) Selected 2D class averages. (C) FSC curve of the hexameric complex. (D) Local resolution calculated from unfiltered half maps using ResMap (Kucukelbir et al., 2014). (E) 2D Class averages of the sample at pH 8.0 and with the histidine tag cleaved off (See also Supplementary file 1-Table S2).
Figure 5
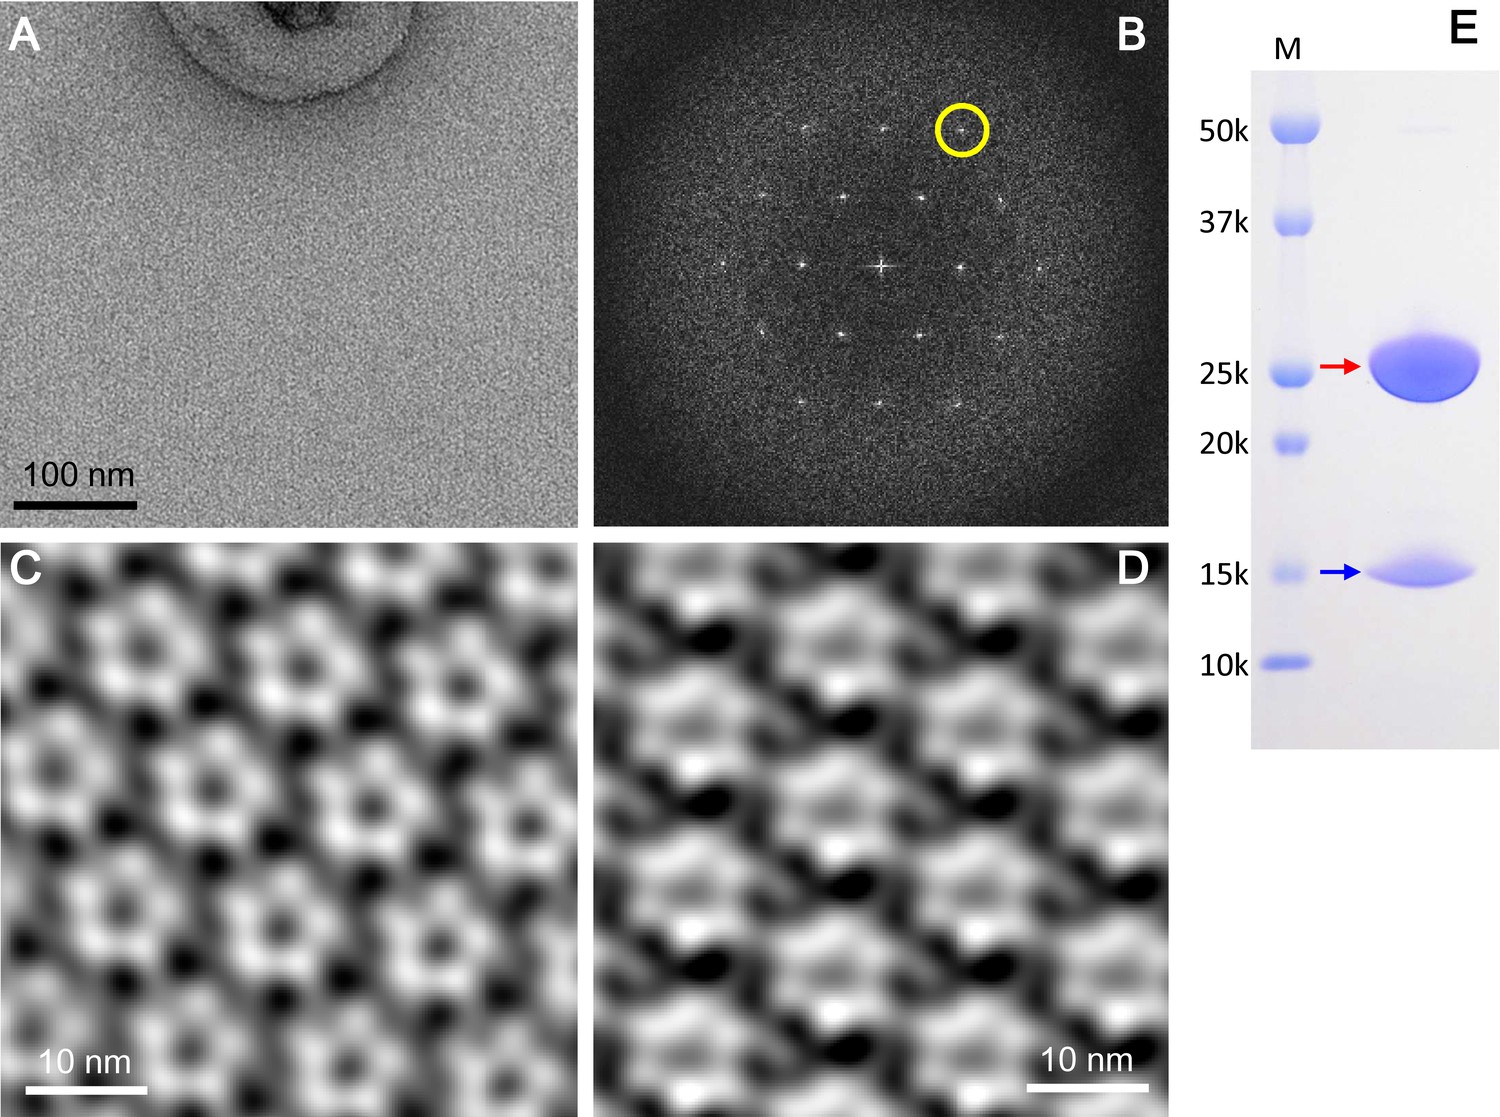
2D crystals of the ExbBD complex in lipid bilayers.
(A) A representative EM image of a negatively-stained 2D crystal. (B) Fourier transform of a crystal patch. A pseudo-hexagonal lattice pattern is visible. A yellow circle refers to a diffraction spot at ~35 Å resolution. (C) A typical array of pentagonal molecules obtained by Fourier-filtering of crystal patches. (D) A typical array of hexagonal molecules by Fourier-filtering other crystal patches. All the figures in (A), (B), (C) and (D) were produced from 2D crystals grown at pH 5.4. Eleven images were analysed. (E) A SDS-PAGE pattern of 2D crystals. Red and blue arrows correspond to ExbB and ExbD, respectively. Lane marked 'M' indicates marker.
Figure 6 with 1 supplement
Cryo-EM structure of the ExbB hexamer and ExbD trimer complex.
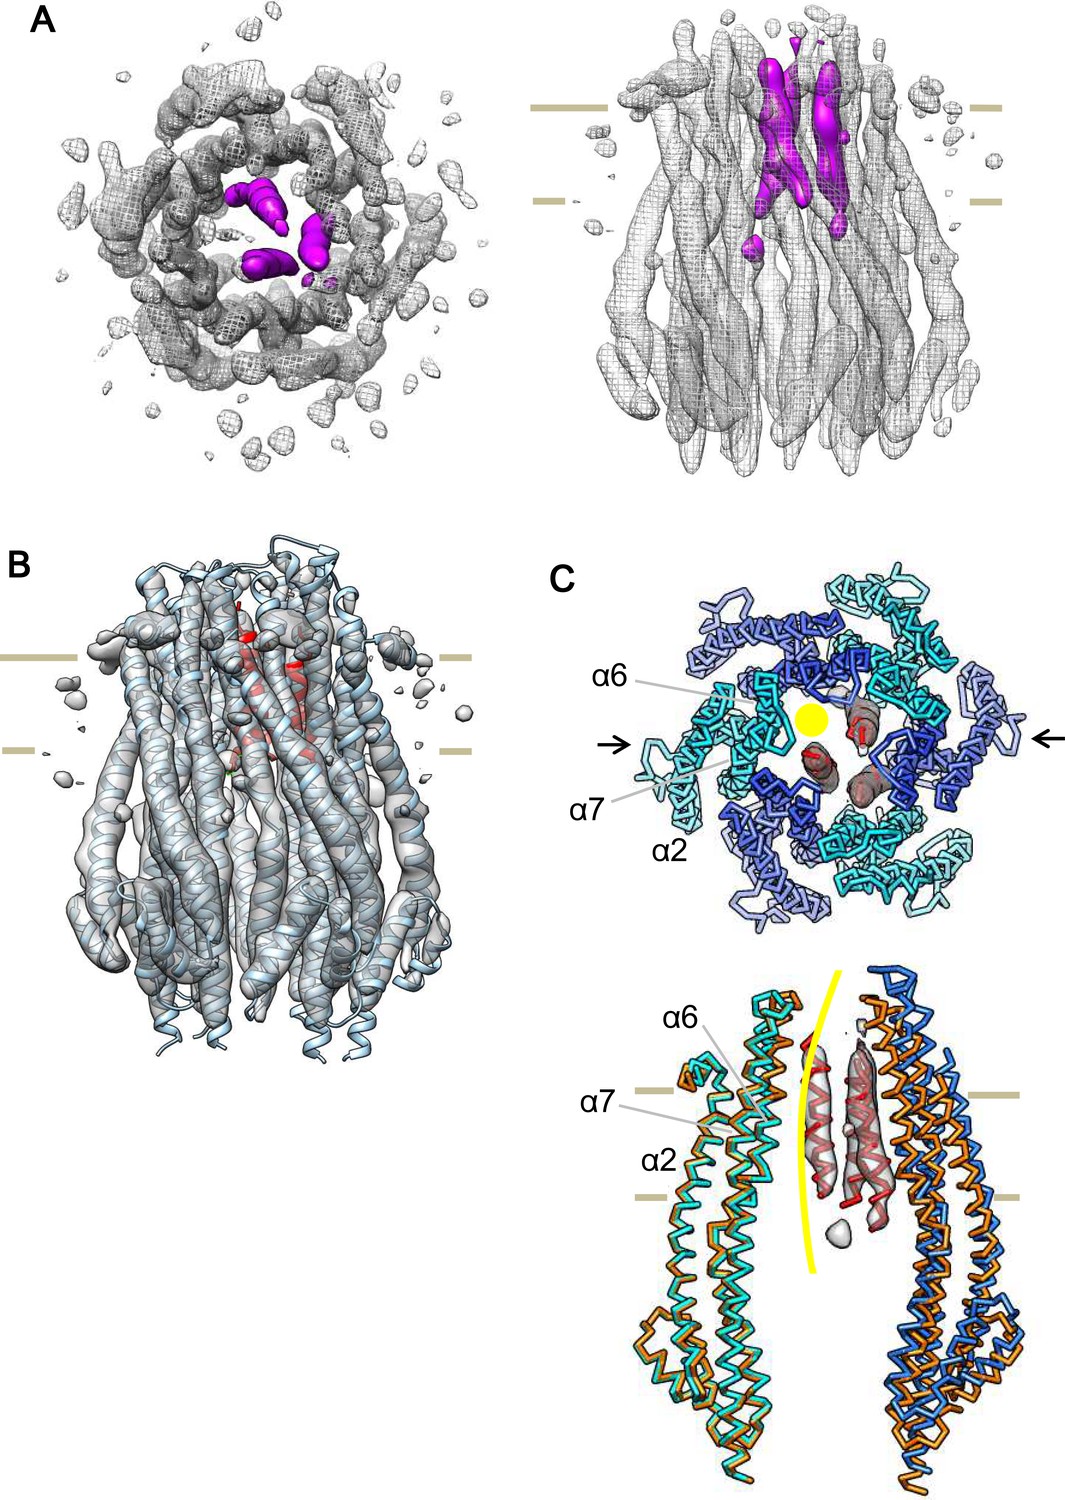
(A) Top and side views of the hexameric complex. Reconstructed to 6.7 Å resolution from cryo-EM images of samples at pH 8.0. The arrangement of the ExbD helices coloured in magenta is asymmetric inside the channel. (B) The same side view as in (A). Overlaid with the atomic models of ExbB in cyan and ExbD TM helices (ExbDTM) in red. The model of ExbB6D3TM, ExbB subunits in the hexamer crystal and ExbDTM were fitted into the cryo-EM reconstruction by rigid-body refinement in real space (Adams et al., 2010). (C) Structure changes in the ExbB6D3TM model. The cryo-EM map corresponding to ExbDTM is displayed. Side view only shows two ExbB subunits in cyan and sky blue (indicated with arrows in the top view in C) overlaid with the same ones in the crystal (orange). The subunit on the left is superimposed on that of the crystal and that on the right shows the dislocation from the position of the crystal subunit needed to fit the cryo-EM map. The viewing direction of the side view in (C) is rotated anticlockwise by ~40° around the channel axis from those in (A) and (B). A yellow circle in the top view and curve in the side view indicates the putative ion pathway.
Figure 6—figure supplement 1
Cryo-EM structures of the hexameric and pentameric ExbBD complexes.
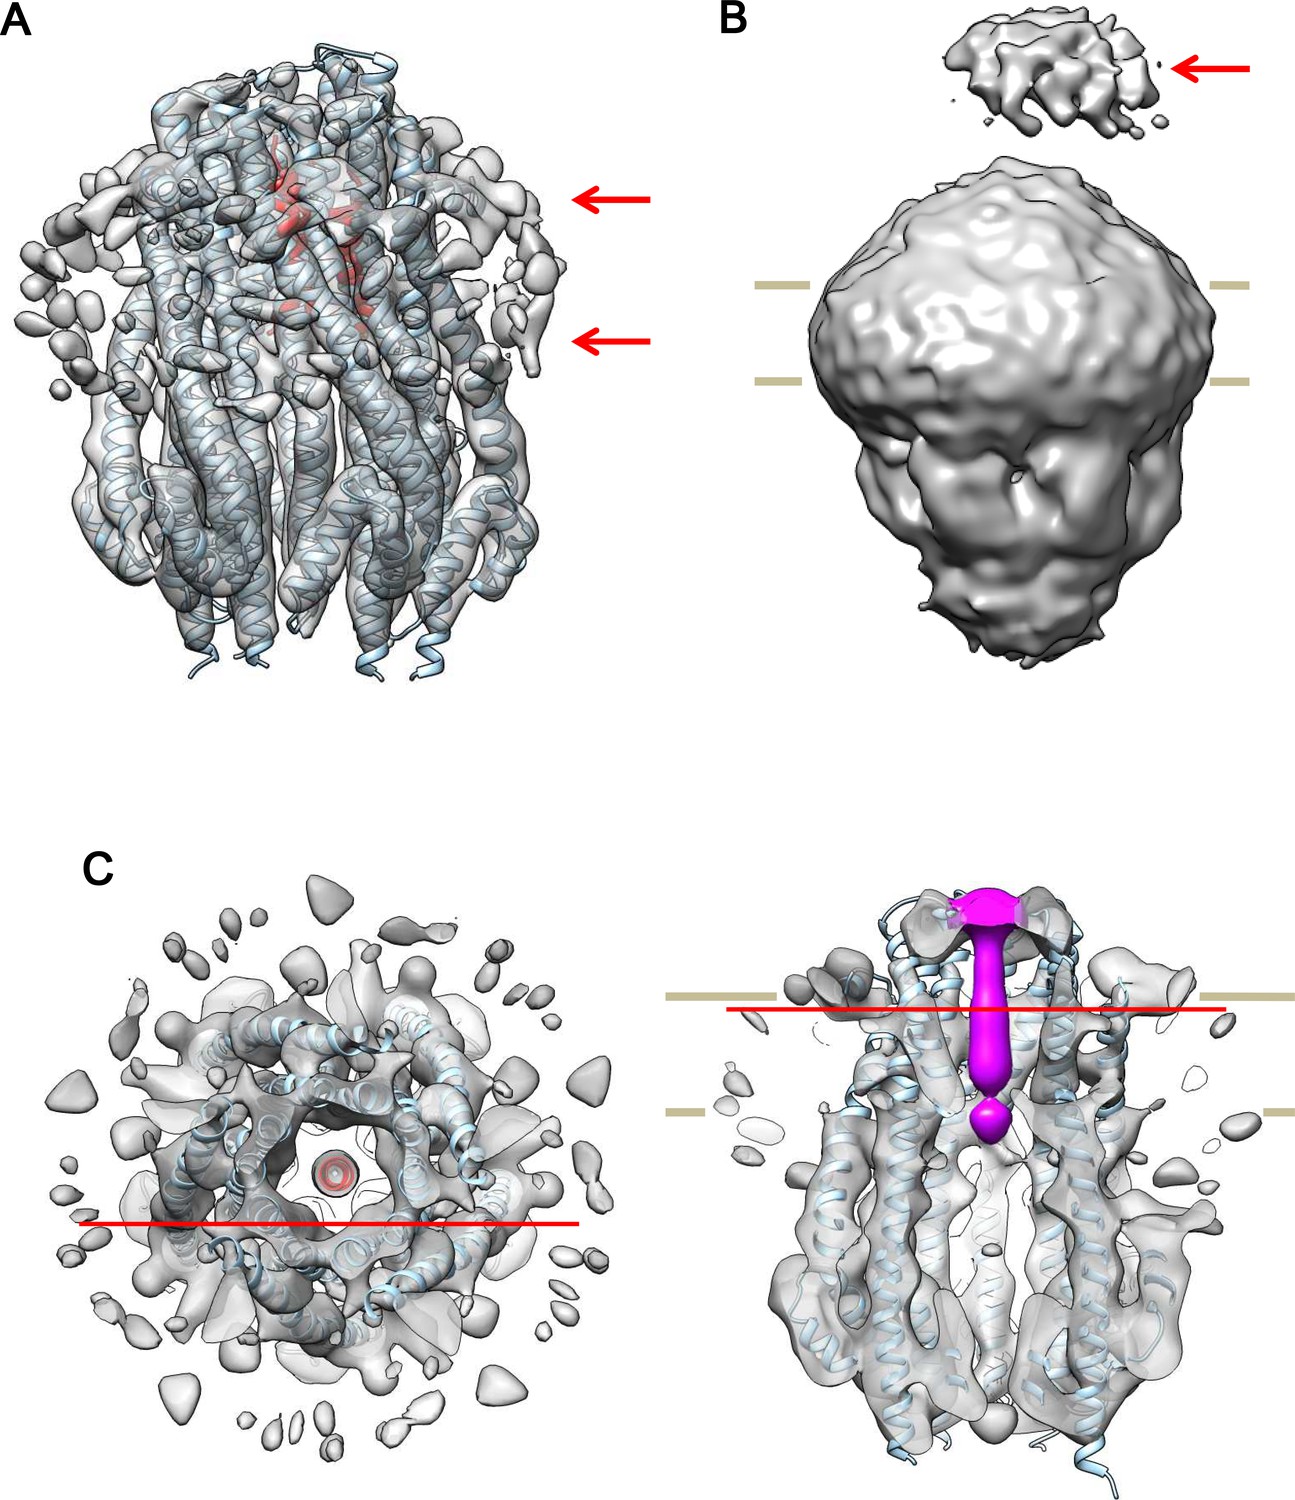
(A) The same side view of the hexameric complex as in Figure 6B, but displayed at a lower contour level and filtered to 8.2 Å resolution for clarity. Arrows indicate bound detergent around the TM region. (B) The same as in (A), but displayed at a half contour level of that in (A). A periplasmic mass (arrow) likely represents the periplasmic domain of ExbD. (C) Top and side cut-out views of the pentameric complex. Reconstructed to 7.1 Å resolution from cryo-EM images of samples at pH 5.4. The top view is overlaid with the atomic models of ExbB in cyan and ExbDTM in red. The side view is overlaid with the atomic models of ExbB and coloured with a rod-like density including ExbDTM inside the channel in magenta. The model of ExbB5D1TM, ExbB subunits in the pentamer crystal and ExbDTM were fitted into the cryo-EM map in the same way as for the hexameric complex in Figure 6. Red horizontal lines in the top and side views indicate the cut-out planes for each other.
Figure 7
Model of the hexameric ExbBD complex.
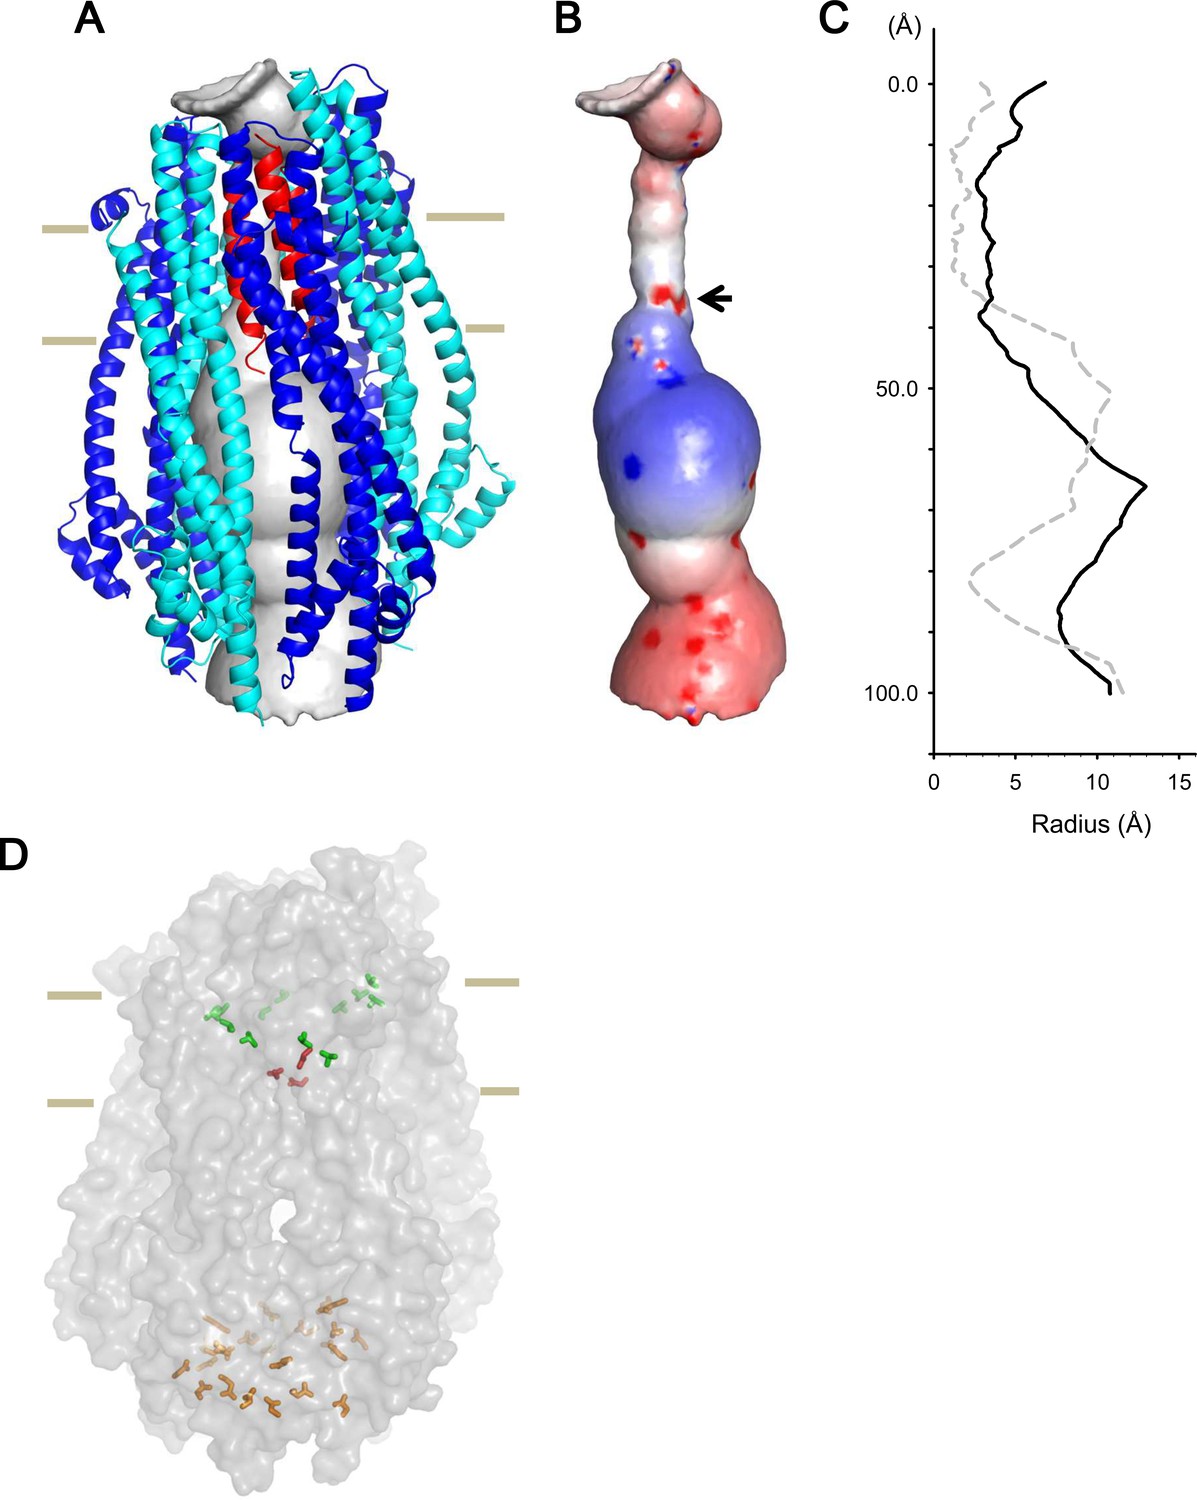
(A) A structure model of the ExbB hexamer and the TM helices of ExbD. Overlaid with volume rendering (Smart et al., 1996) inside the channel. (B) Electrostatic surface of the channel is displayed with electropositivity in blue and electronegativity in red. An arrow indicates electronegative surface of an ion-selective filter formed by Asp 25. (C) Plots of the channel radii of the model in (A) (solid line) and the pentamer with a ExbD helix in the crystal (dashed line; Celia et al., 2016). The central helix in the pentamer crystal is shifted to the periplasmic side (upper; Celia et al., 2016). (D) A side view of ExbB6ExbD3TM in surface rendering. The side chains of Thr 148, Thr 181 (green) in ExbB and Asp 25 (red) in ExbD are displayed as markers. The side chains of Asp 103, Glu 105, Glu 109, and Asp 225 are also displayed at the cytoplasmic end of the channel in orange. As the ExbB subunits are gradually shifted downwards towards the cytoplasm, residues surrounding the channel such as Thr 148 and 181 follow a spiral downward path.
Figure 8
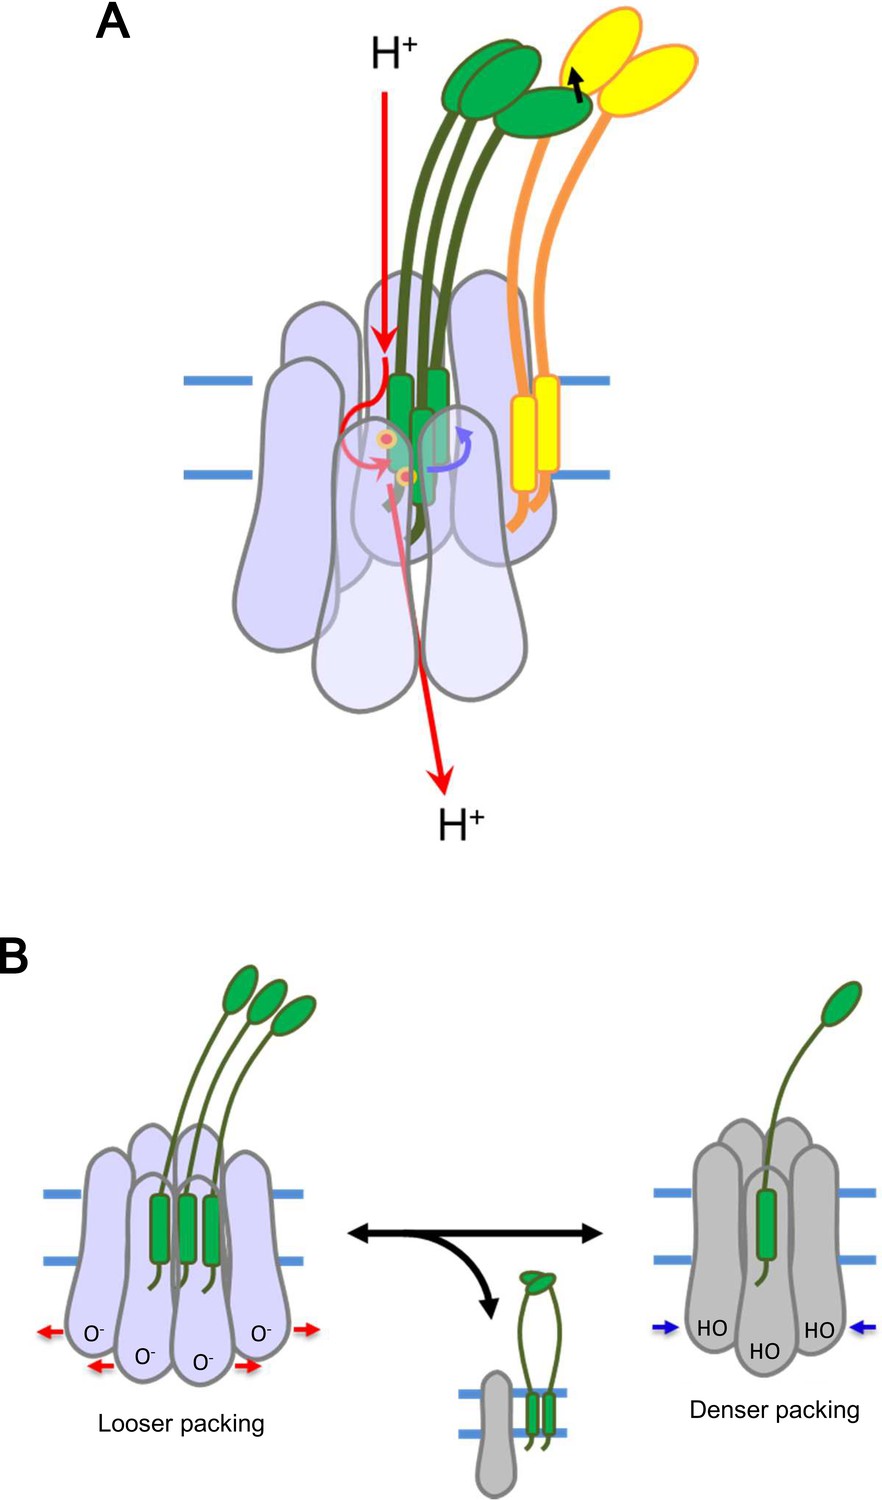
Models for energy conversion of the ExbBD complex and activation/inactivation.
(A) Energy transduction mechanism. Protons coming from the periplasmic funnel could spiral down around the ExbB wall as indicated red arrows. The spiral flux could generate a torsional force (a blue arrow; Chang et al., 2001) to induce rotational movement of the ExbD TM helices relative to the ExbB ring. ExbD interacts with TonB through their periplasmic domains (Ollis et al., 2009; Gresock et al., 2015) and the force could be transduced to TonB (a black arrow), which resides around the ExbB complex. TonB may move around the outer rim of the hexamer, facilitating linking up with outer membrane receptors (Klebba, 2016). The interaction of the TonB C-terminal domain with the periplasmic domain of the receptor induces conformational changes to release a substrate bound to the receptor into the periplasmic space (Chang et al., 2001; Klebba, 2016). (B) Transition mechanism between the hexameric and pentameric ExbBD complexes. If the hydronium concentration rises in the cytoplasmic funnel including many acidic residues, protonation (HO in the right figure) of these residues and easing the electrostatic repulsion may allow denser packing among ExbB subunits, which repels one ExbB subunit from the hexamer ring and excludes two ExbD from the central space to form the pentamer ring. The ExbD dimer is a stable complex and excluded ExbB molecules may form multimers. Thus, the pentameric complex prevents excessive proton influx into the cell. A hydronium concentration decrease and deprotonation (O- in the left figure) of the acidic residues would shift to looser packing, which recruits two ExbD to the ring and one ExbB to form the hexameric complex. ExbB, ExbD and TonB are displayed in violet or grey, green and yellow, respectively. Small red circles in (A) indicate Asp 25 in the ExbD TM helix.
Additional files
-
Supplementary file 1
Table S1: Data collection and refinement statistics of the ExbB and ExbD crystals grown Table S2.
Data collection and image analysis statistics for single particle cryo-EM. Table S3. Refinement statistics of atomic models against the cryo-EM maps
- https://doi.org/10.7554/eLife.35419.017
-
Transparent reporting form
- https://doi.org/10.7554/eLife.35419.018
Download links
A two-part list of links to download the article, or parts of the article, in various formats.
Downloads (link to download the article as PDF)
Open citations (links to open the citations from this article in various online reference manager services)
Cite this article (links to download the citations from this article in formats compatible with various reference manager tools)
Hexameric and pentameric complexes of the ExbBD energizer in the Ton system
eLife 7:e35419.
https://doi.org/10.7554/eLife.35419


