Stem cell heterogeneity drives the parasitic life cycle of Schistosoma mansoni
- Stanford University, United States
- Stanford University School of Medicine, United States
- Howard Hughes Medical Institute, University of Illinois at Urbana-Champaign, United States
- University of Chicago, United States
Figures
Figure 1 with 3 supplements
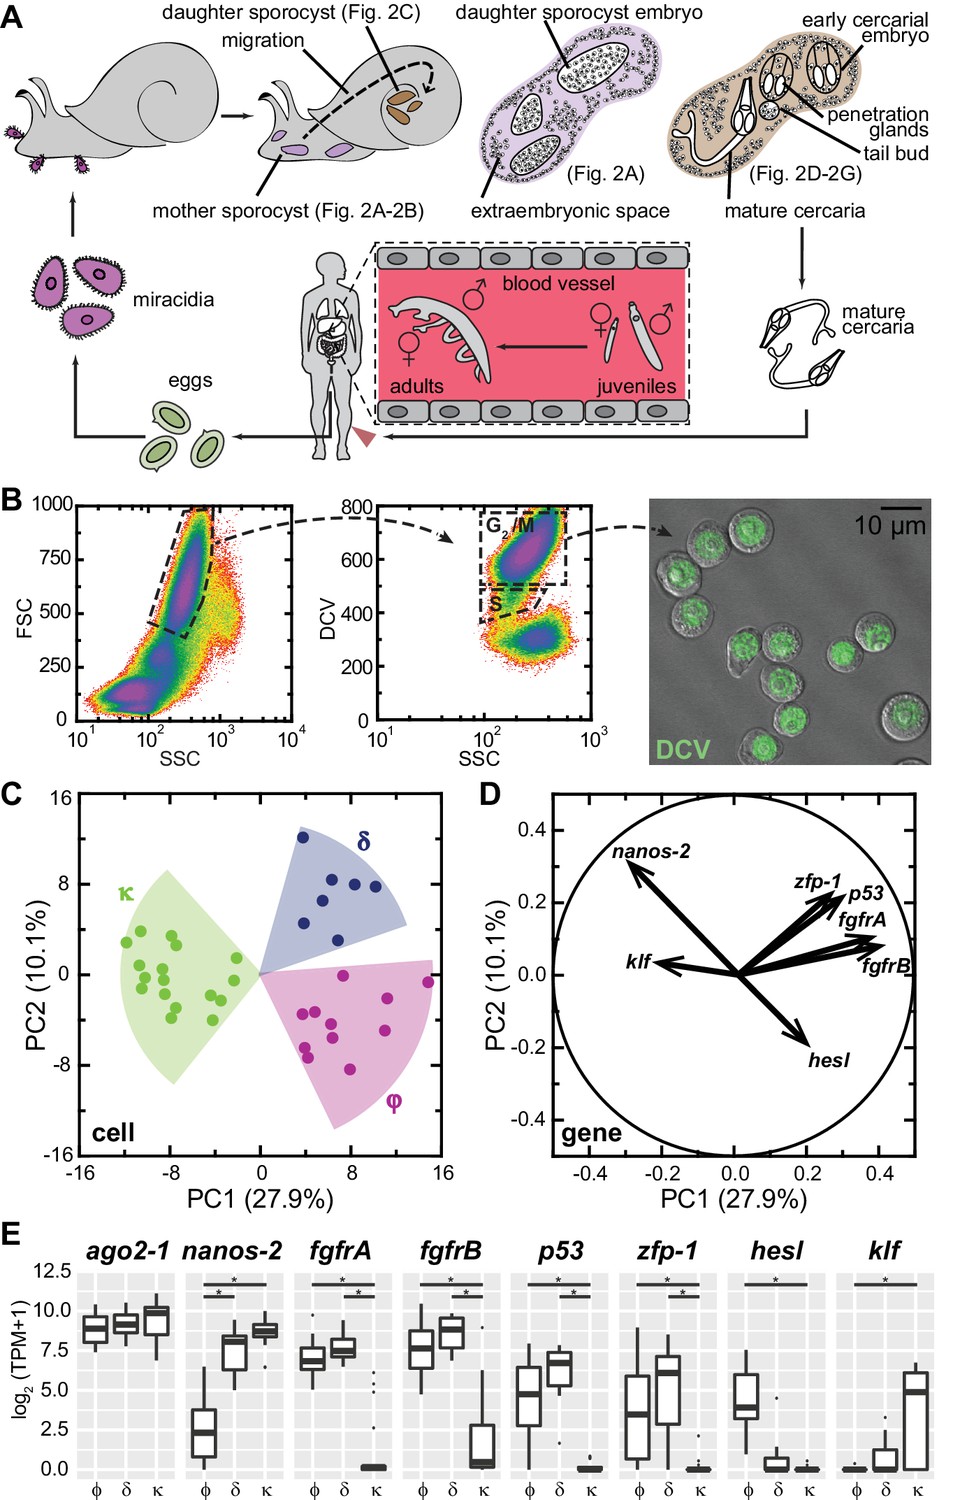
Single-cell RNAseq reveals stem cell classes in sporocysts.
(A) Schematic of the schistosome life cycle. Images depicting developmental stages shown in Figure 2 are labeled accordingly. (B) Dissociated cells were gated using forward scattering (FSC), side scattering (SSC), and DyeCycle Violet (DCV) fluorescence to isolate S or G2/M phase cells from mother sporocysts. Dead cells and debris (<30% of total events) were pre-excluded based on high TOTO-3 fluorescence. Right: Sorted G2/M phase cells from mother sporocysts visualized by DIC and fluorescence microscopy. (C) PCA of 35 single-cell transcriptomes of sporocyst stem cells. Summative variances are reported in percentages. Assignment of cell classes is based on hierarchical clustering. (D) Selected genes with heavy loadings are plotted in projection on the first 2 PCs. The projection on each axis represents the correlation coefficient of the respective gene with each principal component. (E) Box plots of expression levels of selected class-dependent genes. ago2-1 expression is also shown as a ubiquitous stem cell marker. Boxes indicate quartiles and medians, whiskers show maxima and minima, and dots represent outliers (above and below 1.5X interquartile range). *p<0.01 (t-test). p-values were estimated based on multiple models using either TPM or log2(TPM +1) as expression values.
Figure 1—figure supplement 1
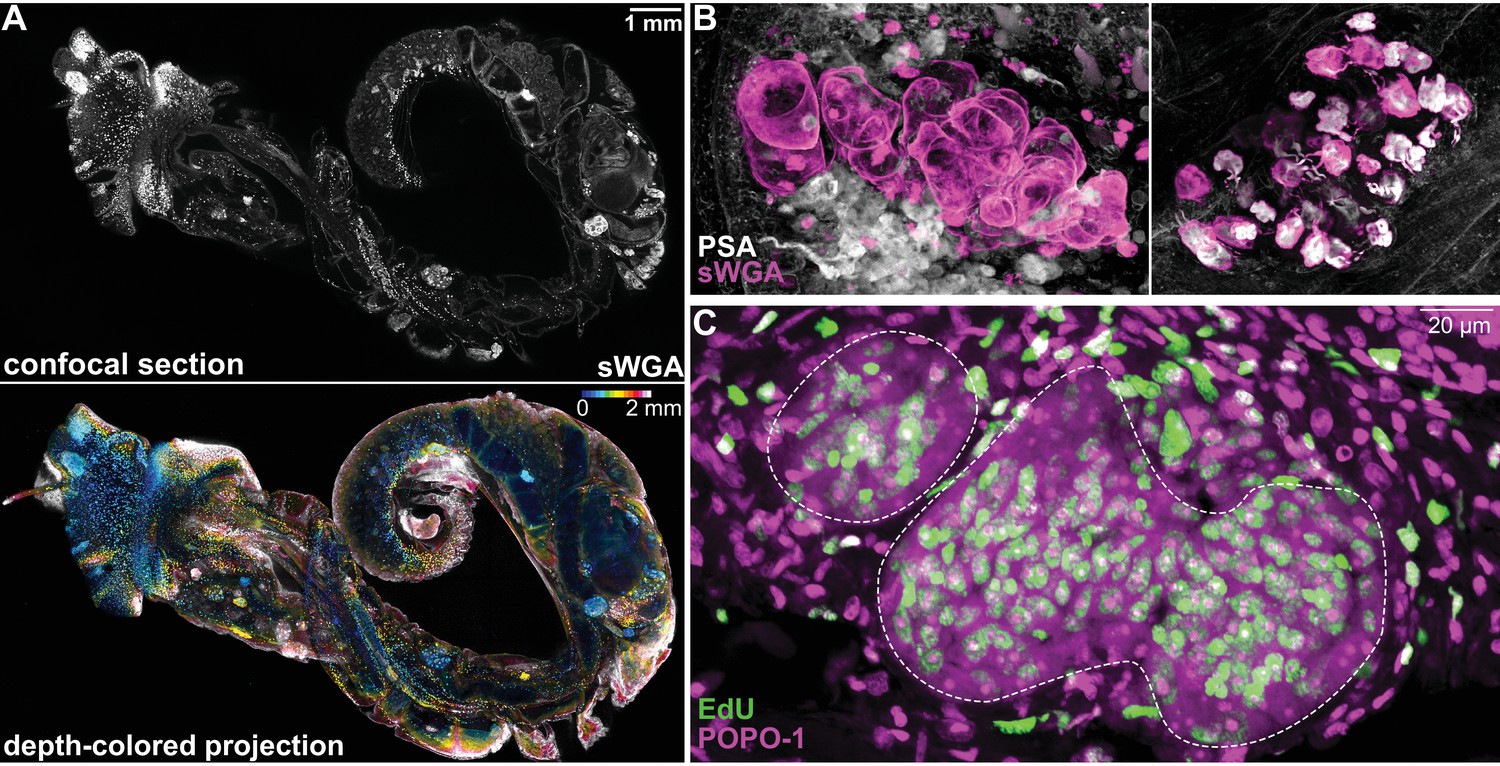
S. mansoni sporocysts develop in B. glabrata snails.
(A) The schistosome-infected snail, 2 weeks post-infection, was removed from its shell and treated to render the tissues transparent and labeled with fluorescently tagged sWGA that binds strongly to the parasite. This tiled image is ~1.5 cm in width, 2 mm in thickness, and contains ~10 billion voxels. Top: a confocal section. Bottom: ~200 confocal sections are combined to produce a depth-colored projection. (B) Representative images of mother sporocyst (left), and daughter sporocyst containing cercarial embryos (right) inside the snail host. (C) Two-day EdU labeling to detect proliferating cells in mother sporocysts (dashed circles) in a snail 1 week post-infection. Note EdU+ schistosome cells possess large nucleoli stained by POPO-1. EdU+ snail cells (outside of the circles) have compact nuclei without visible nucleoli.
Figure 1—figure supplement 2
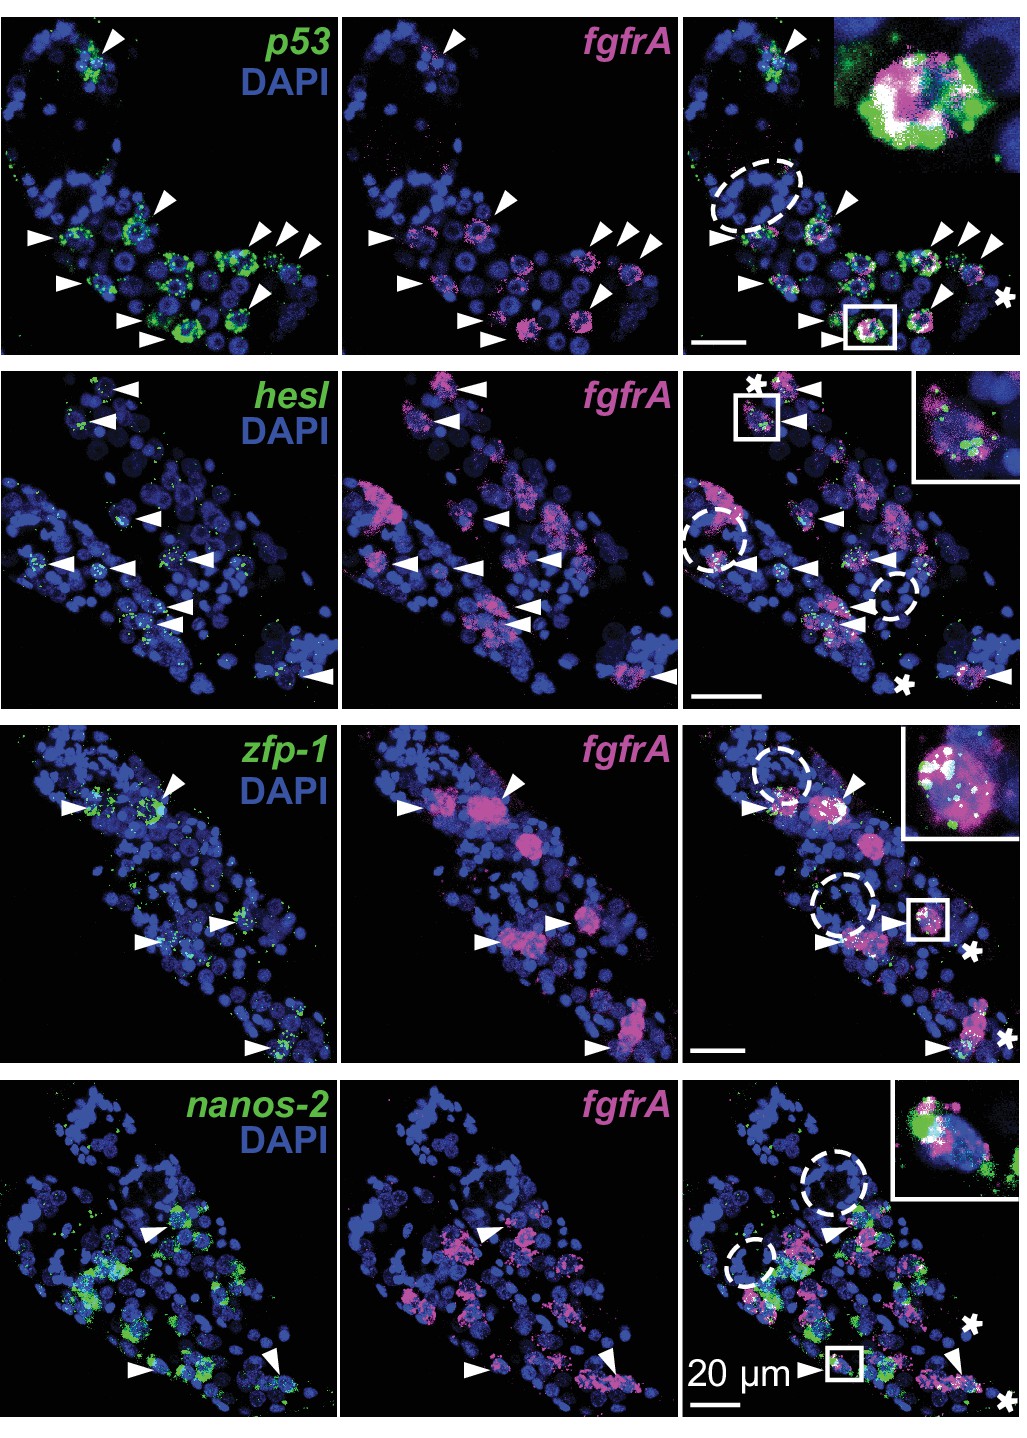
Distribution of stem cell classes in in vitro-transformed mother sporocysts.
Confocal maximum intensity projections of FISH on in vitro-transformed mother sporocysts using probes to detect the indicated transcripts. Labeled germinal cells are mostly posterior to the degenerating brain from miracidia (dashed circles). Asterisks: tail of each sporocyst; arrowheads: co-expression. Insets: magnified boxed cells.
Figure 1—figure supplement 3
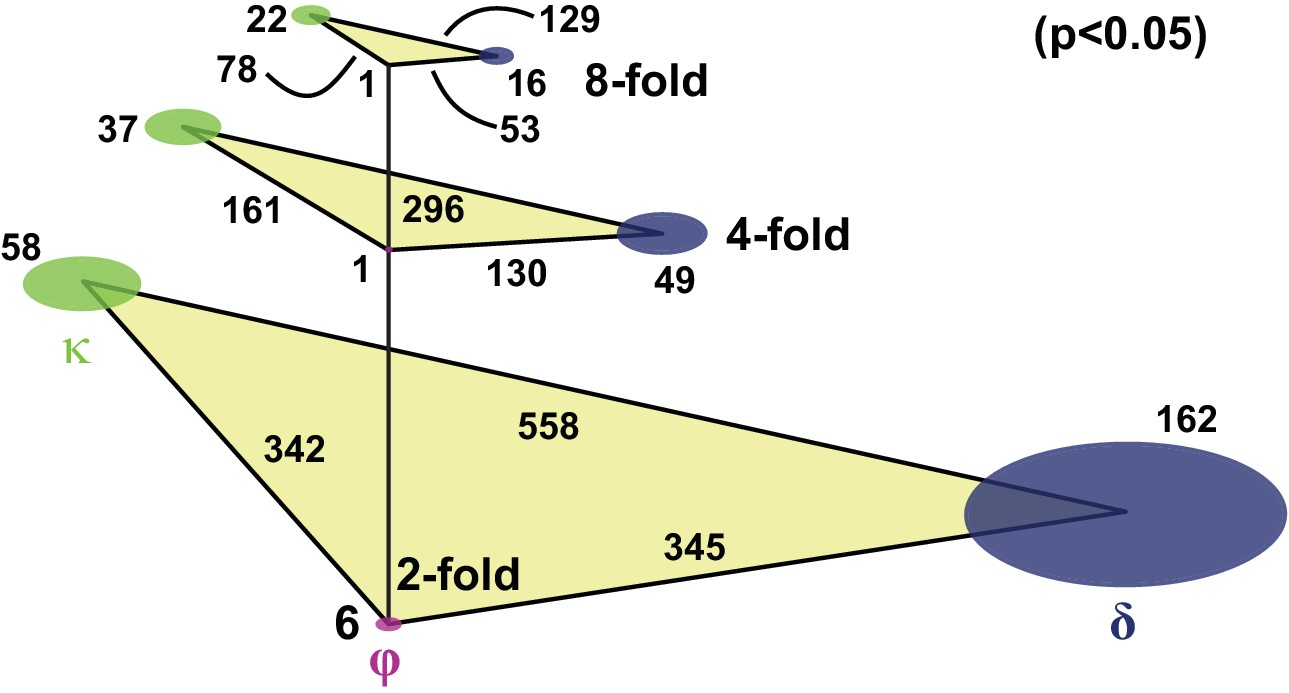
Number of genes differentially expressed between stem cell classes.
A total of 6661 transcripts are detected in at least three single cells. The levels represent the cut-off in fold difference, disk sizes scale with the number of genes specific to the respective class, triangle sides scale with the number of genes differentially expressed between respective class pairs. The differentially expressed genes are defined by two sample t-test (p<0.05), using the more stringent estimate from the assumptions of either unequal or equal population variances. For consistency in quantifying p-values, genes specific to individual classes are defined as being enriched with respect to both the other two classes.
Figure 2
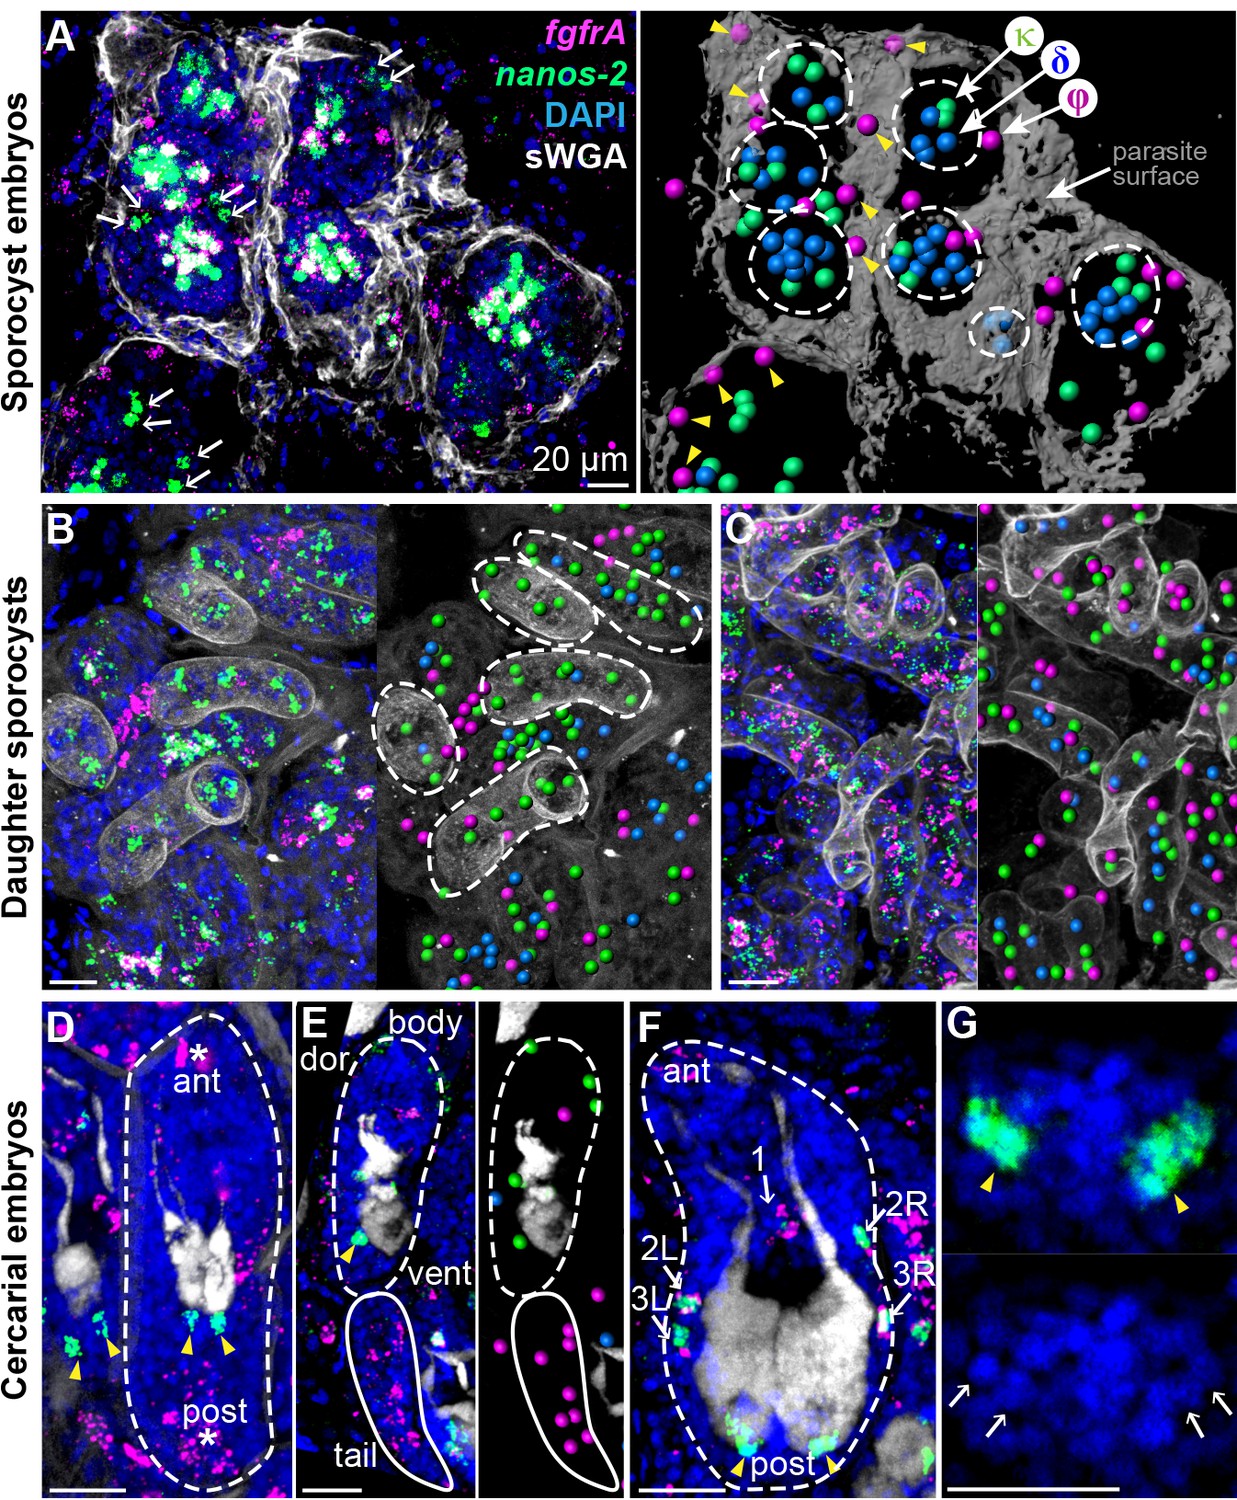
Stem cells exhibit class-specific spatial and temporal patterns during intramolluscan development.
(A) FISH of nanos-2 and fgfrA reveals spatial distributions of cell classes in a mother sporocyst containing daughter embryos (dashed circles), 10 days post-infection (dpi). sWGA (grey) labels the parasite surface (tegument). Arrows: extraembryonic κ-cells. Right: rendered image of that shown to the left. Spheres: cell centers; yellow arrowheads: ϕ-cells beneath the surface. (B) Mature daughter sporocysts contained in a mother sporocyst 15 dpi. Dashes outline the body surfaces of daughters. In daughters, κ-cells comprised 522 out of 592 counted stem cells in these daughters, while fewer δ-cells (61/592) and φ-cells (9/592) were observed. (C) Daughter sporocysts in snail ovotestis, 25 dpi. (D) Early cercarial embryo before the tail bud forms. φ-cells were found concentrated both anteriorly and posteriorly, where the mouth and tail bud form; only two κ-cells were detected posterior to the two penetration glands. (E) Later development during cercarial embryogenesis. φ-cells were mostly located in the tails; the κ-cell pair were posterior to the glands. (F) Mature cercarial body in daughter sporocysts 30 dpi (dorsal view). 1: anterior midline cell; 2L, 2R: anterior lateral cells; 3L, 3R: posterior lateral cells. Arrowheads: κ-cells, asterisks: ϕ-cells, arrows: δ-cells. sWGA: penetration glands. Note that only the cercarial body is transmitted to the mammalian host, whereas tails are discarded outside of the host epidermis during penetration. (G) κ-cell clusters, magnified from (F), contain multiple cells each (single confocal section). Arrows: individual nuclei in κ-cell clusters. Scale bars: 20 µm. All images are maximum intensity projections from 30 µm tissue cryosections. Since animals are thicker than the sections, parasite surface and penetration glands were used to determine the orientation and position of the sections.
Figure 3
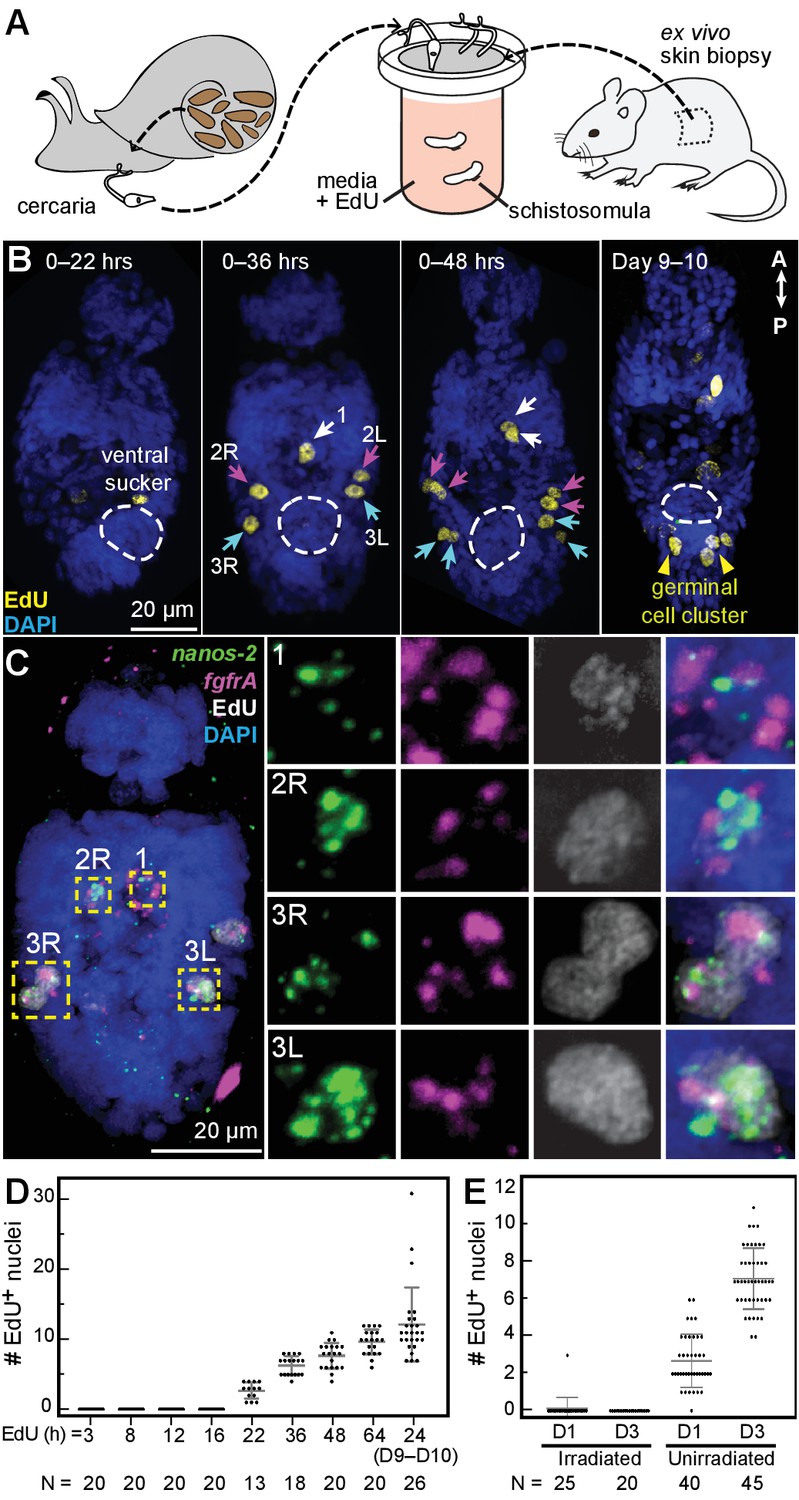
Larvally derived stem cells proliferate in schistosomula.
(A) Schematic of in vitro transformation from cercariae to schistosomula and EdU labelling. (B) EdU+ cells are detected medially (1) and laterally (2L, 2R, 3L,3R) at the locations of δ-cells in cercarial bodies (ventral view). These cells divide to generate doublets, indicated by arrows. The time of EdU pulse post-transformation is indicated. Images are maximum intensity projections of confocal stacks. (C) Confocal maximum intensity projection of FISH of nanos-2 and fgfrA on schistosomula at 2 days post-transformation confirms that only δ-cells incorporated EdU. Right: magnified images of boxed cells. (D) Quantification of EdU incorporation after transformation; x axis: length of EdU treatment post-transformation. Means and standard deviations are specified. N: number of worms analyzed. (E) Irradiated cercariae exhibit no EdU+ cells after transformation, which confirms that EdU specifically labels proliferating cells.
Figure 4 with 4 supplements
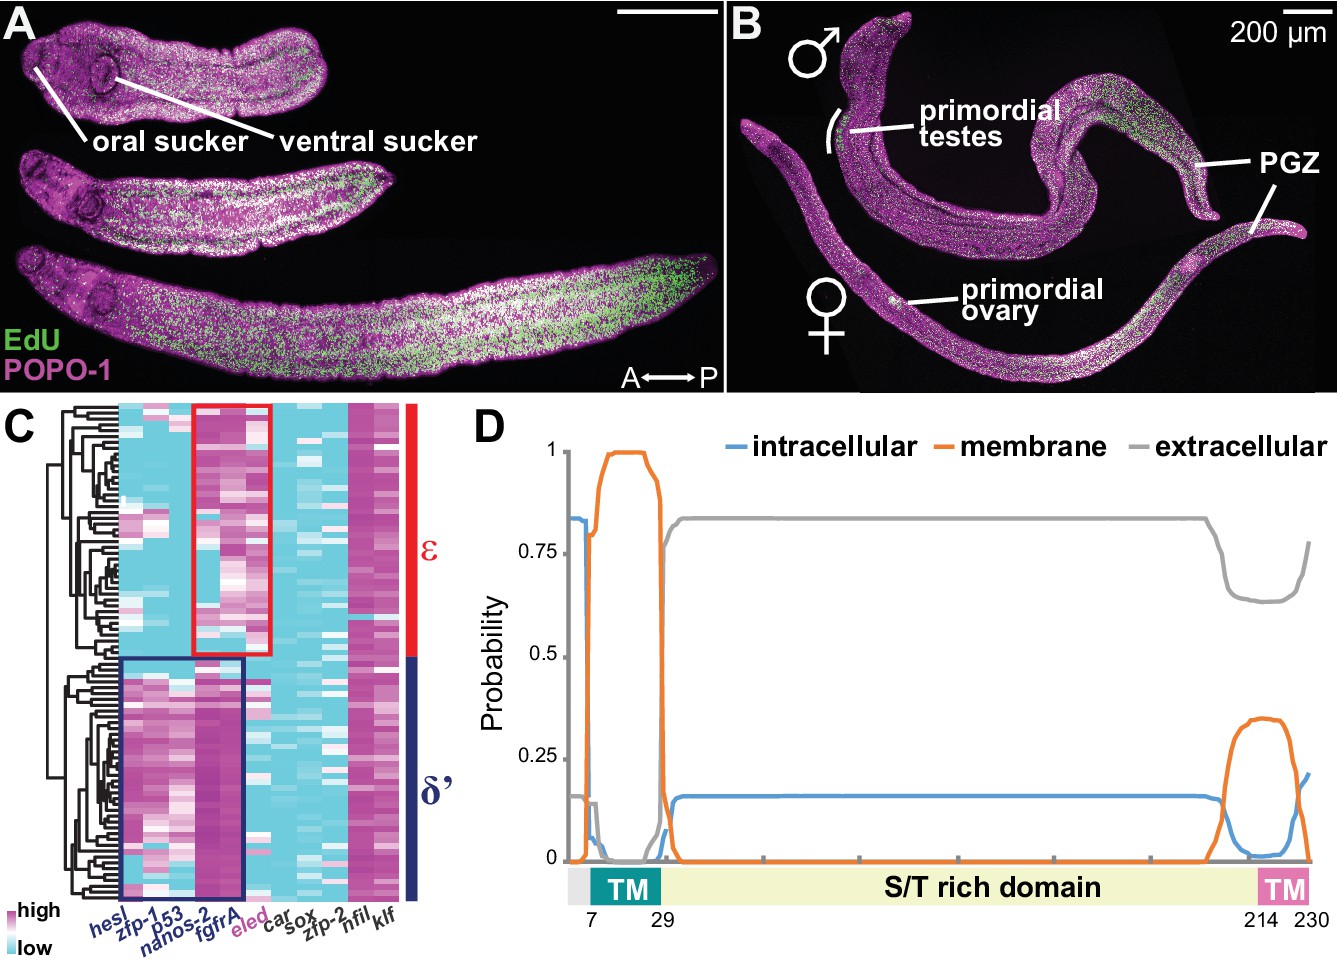
Emergence of a new stem cell class, ε, in juveniles.
(A–B) Distributions of EdU+ cells in three-week-old juveniles. Note the high density of EdU+ cells toward the posterior of the worms. (B) More mature males with partly developed lateral body extensions and females with a visible uterus display EdU+ cells in primordial gonads and the posterior growth zone (PGZ). (C) Hierarchical clustering of 85 juvenile stem cells distinguishes two major cell classes. Gene names in blue: cell class-dependent genes identified in the sporocyst stem cells; gene names in grey: top genes upregulated in juvenile stem cells compared to sporocyst stem cells. Expression levels were standardized gene-by-gene by mean-centering and dividing by the standard deviation of expressing cells. (D) Domain diagram of Eled, predicted by TMHMM 2.0 (Krogh et al., 2001). TM: transmembrane domain. S/T rich domain: extracellular domain enriched in serine/threonine.
Figure 4—figure supplement 1
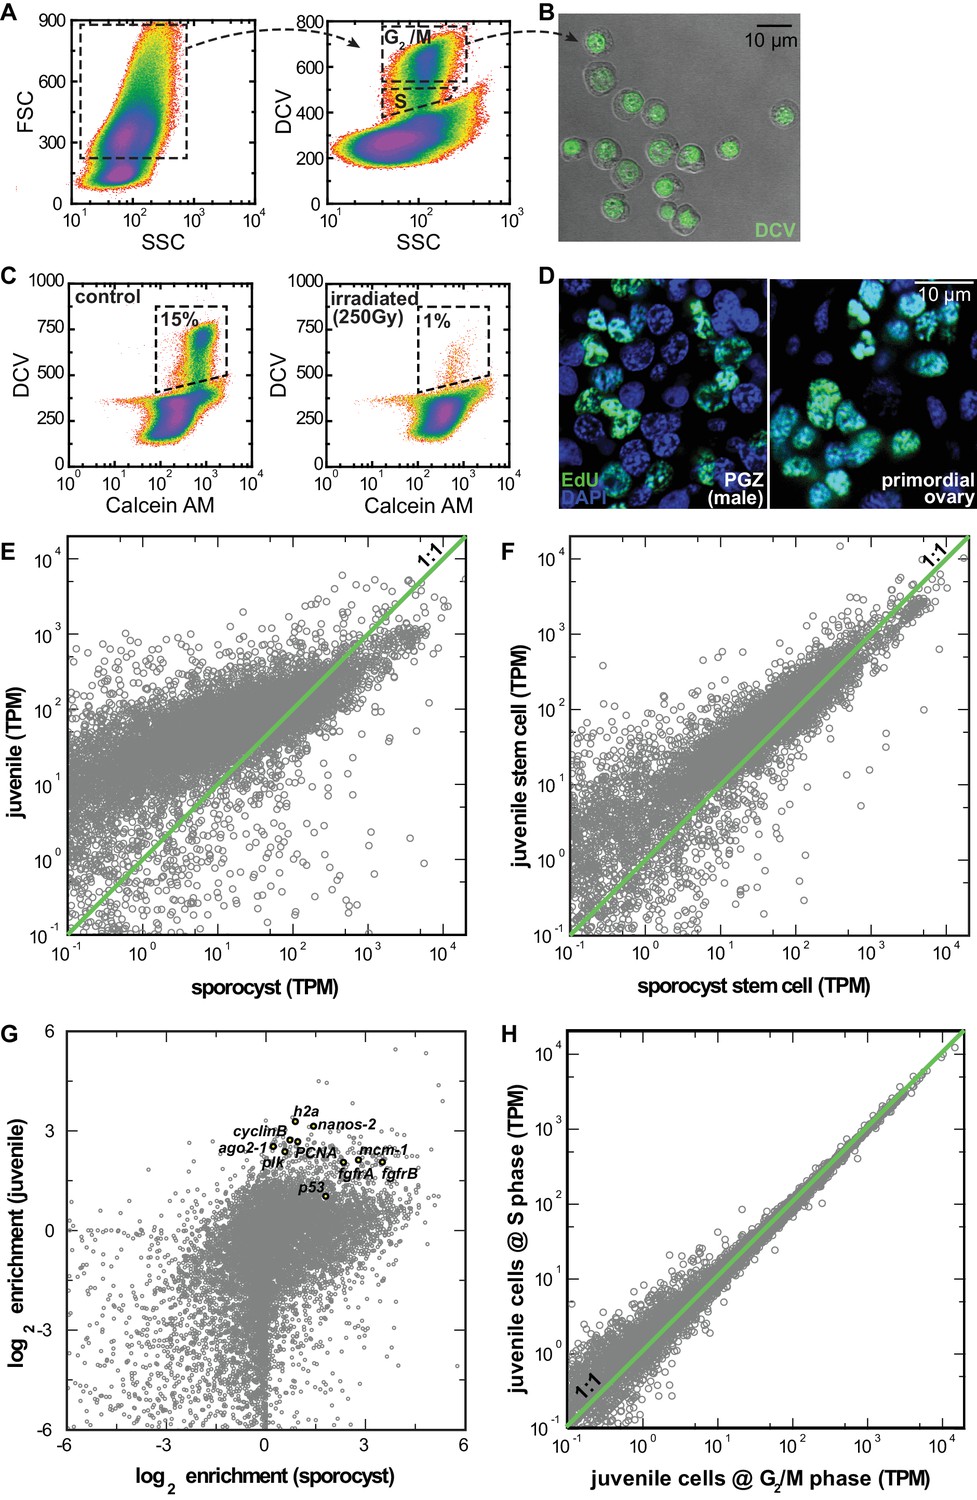
RNAseq comparison of FACS-isolated proliferating cells from sporocysts and juveniles.
(A) Dissociated cells were gated using FSC, SSC, and DCV fluorescence to isolate S or G2/M phase cells from juveniles. Dead cells and debris (<30% of total events) were pre-excluded based on high TOTO-3 fluorescence. (B) Sorted G2/M phase cells from juveniles visualized by DIC and fluorescence microscopy. (C) Proliferating cells in juveniles are irradiation-sensitive. Calcein AM fluorescence measures cytoplasmic content. Percentages are normalized to total number of live cell events. (D) Single confocal sections to show similar nuclear morphology of EdU+ cells in soma (left) and primordial gonads (right) in juvenile worms. (E) Comparison of expression levels in log space for all genes encoded by the S. mansoni genome (n = 10,765) between juveniles and sporocysts. (F) Comparisons of expression levels in log space for all transcripts (n = 10,765) between sorted G2/M cells from juveniles vs. mother sporocysts. (G) Comparison of enrichment in stem cells in log space for all genes between juveniles and sporocysts. Previously characterized stem cell genes in Wang et al. (2013) are highlighted. All these genes are enriched in the sorted cell populations. (H) Comparisons of expression levels in log space for all transcripts between juvenile cells at S phase vs. G2/M phase. This result suggests that cell-cycle status is unlikely to contribute to the observed cell heterogeneity. Although our single-cell analyses rely exclusively on the G2/M phase cells, at the population level, G2/M and S phase cells are largely transcriptionally identical. This conclusion is surprising but consistent with the previous single-cell analyses of proliferating stem cells in schistosome’s free-living cousin, the planarian (van Wolfswinkel et al., 2014).
Figure 4—figure supplement 2
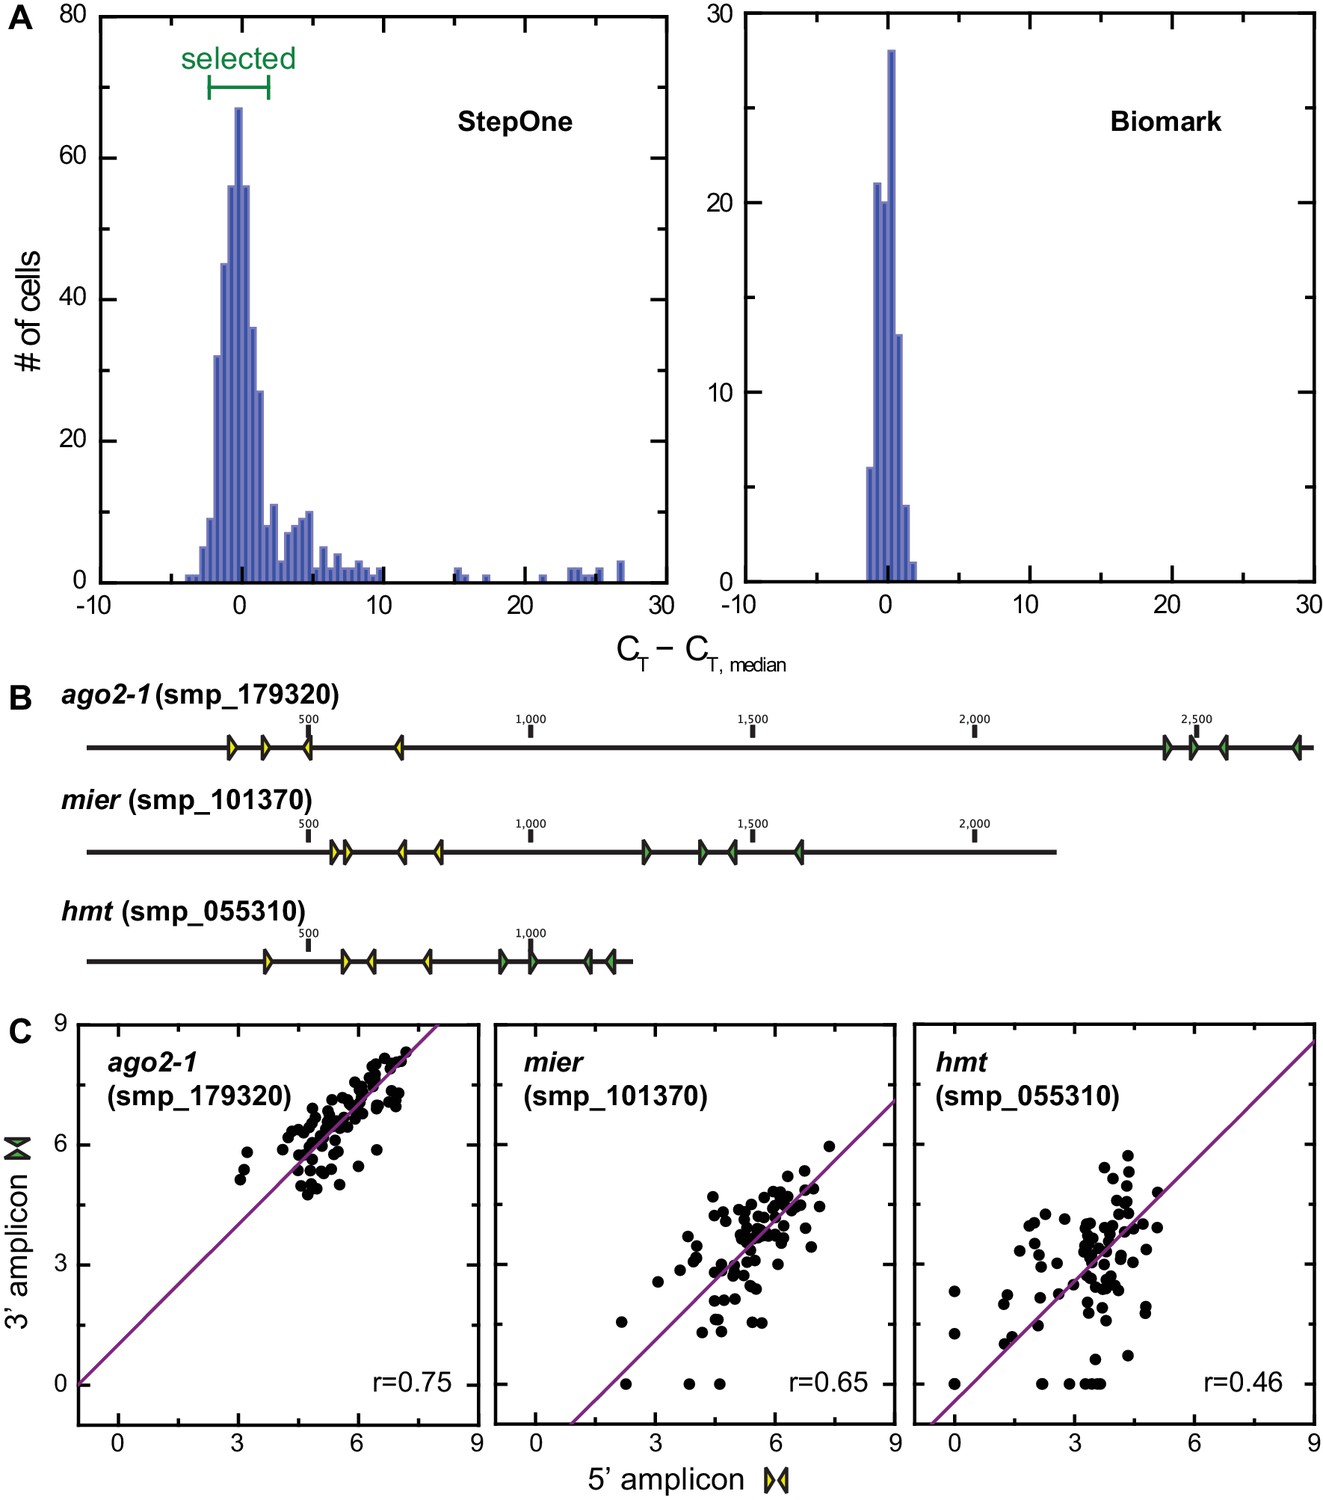
Analysis of technical variation of single-cell qPCR.
(A) Histogram showing variations in CT values corresponding to h2a levels from individual juvenile stem cells on StepOne Real-time PCR platform. 4 CT around the plate median were selected for multiplex qPCR on the Fluidigm Biomark platform, which showed similar variations in h2a level. (B) Positions of nested primer sets on ago2-1, mier, and hmt coding sequences, three genes that cover the full dynamic range in gene expression levels. Two sets of primers were measured simultaneously for each of the three genes to estimate technical noise. (C) Single-cell qPCR determined expression levels of ago2-1, mier, and hmt based on two amplicons show linear relations. The spread from linear relations quantifies the technical uncertainty in this method. Technical noise was determined as 2 ~3 CT and inversely proportional to gene expression level.
Figure 4—figure supplement 3
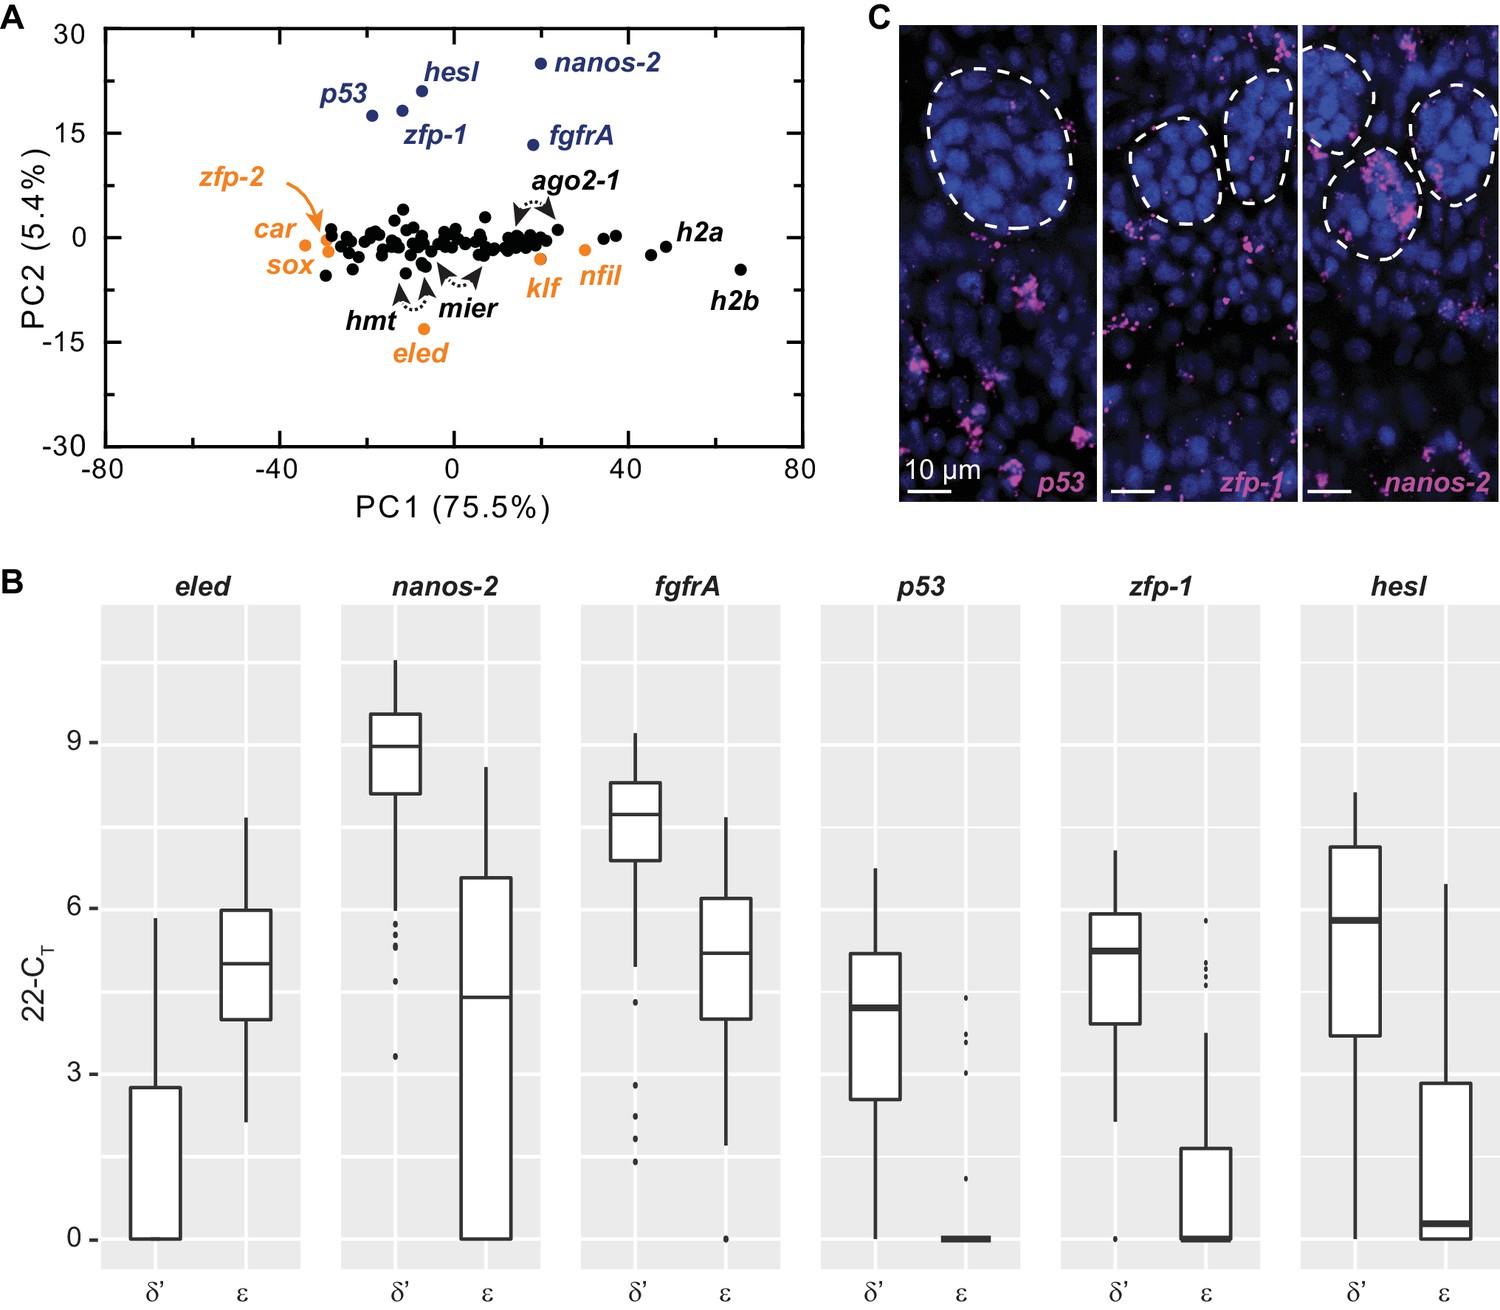
Single-cell qPCR identifies ε-cells in juveniles.
(A) PCA of the single-cell qPCR results revealed that most assayed genes extended along PC1, which appears to scale with average expression levels among cells. The top class-specific markers in sporocyst stem cells, including nanos-2, fgfrA, p53, zfp-1, and hesl were opposed on PC2 by eled. Although eled is undetectable in sporocyst stem cells but is among the most abundant transcripts in juvenile stem cells, cellular heterogeneity was not dominated by differences between sporocyst and juvenile stem cells, since all other top genes in this category (i.e. genes upregulated in juvenile vs. sporocyst stem cells, orange) had small loadings on PC2. Blue: cell class-dependent genes identified in the sporocyst stem cells; arrowheads: ago2-1, mier, and hmt are represented by two independent primer sets. (B) Box plots of expression levels of selected class-dependent genes. Boxes indicate quartiles and medians, whiskers show maxima and minima, and dots represent outliers (above and below 1.5X interquartile range). For all genes, the difference is statistically significant (p<10−4, t-test). Note that the limit of detection of the single-cell qPCR experiments was determined as 22 CT; undetected genes or CT values greater than 22 were all adjusted to 22. Expression values in log space were calculated as 22-CT. The technical noise was determined as 2–3 CT. (C) Confocal sections of FISH to detect p53, zfp-1, and nanos-2. Dashed circles: testes lobes. p53 and zfp-1, are only expressed in δ’-cells and excluded from primordial gonads, whereas nanos-2 is expressed in both soma and a subset of germ cells.
Figure 4—figure supplement 4
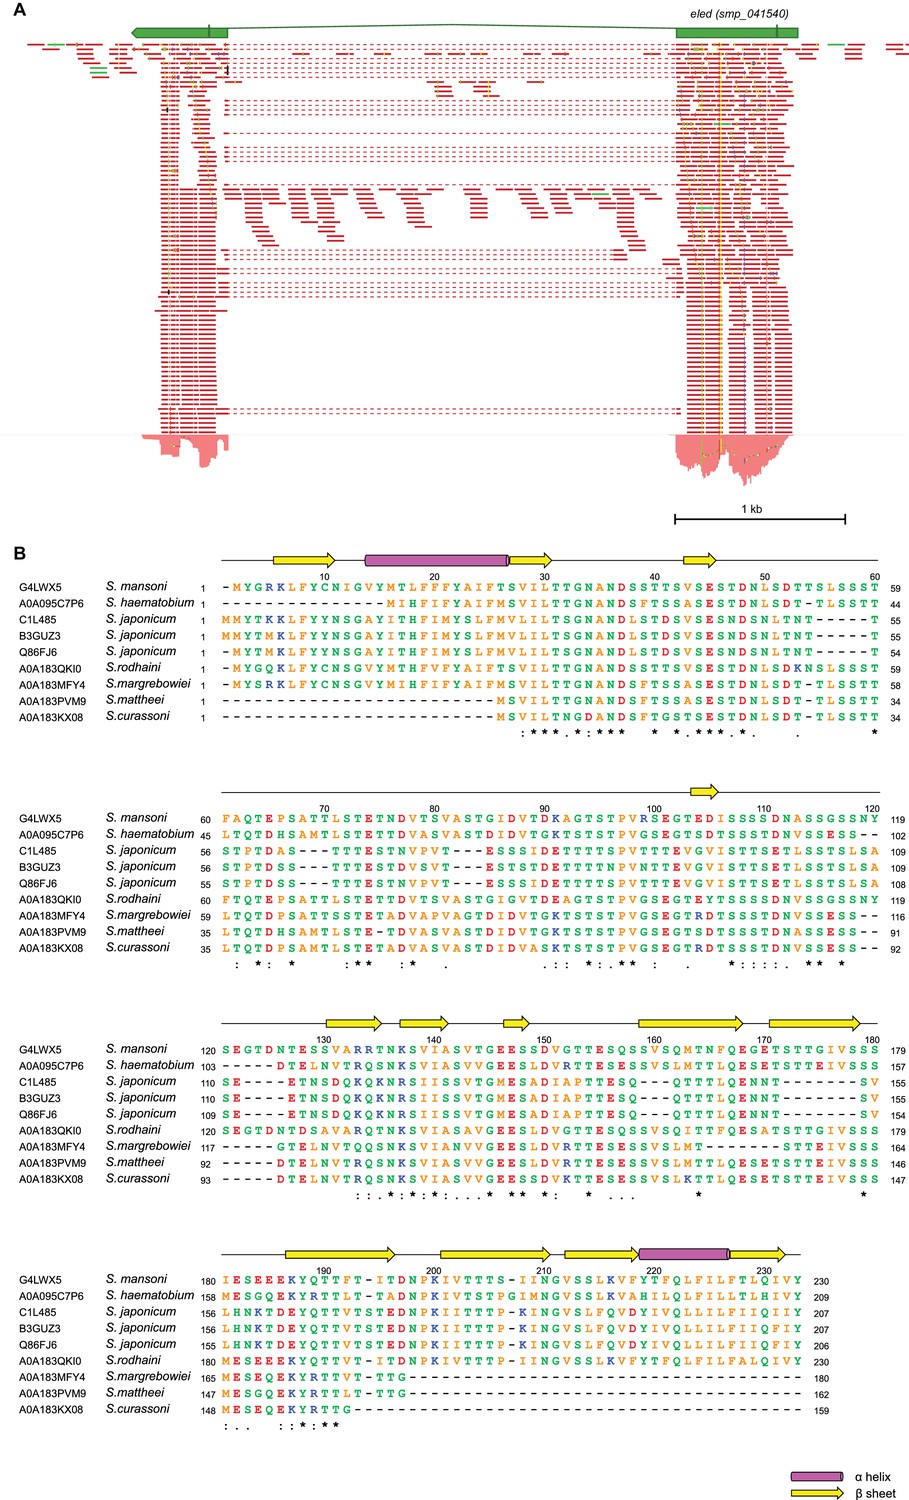
eled gene structure.
(A) RNAseq read mapping confirms the annotation of eled (Smp_041540). Exons are shown as green boxes connected by introns (lines). Start and stop codon are also specified. Reads that bridge the two exons are shown by dotted lines. Total RNA was extracted from juvenile worms. (B) Sequence alignment of eled homologs from various schistosome species. Alignment was generated by ClustalOmega (Li et al., 2015) using sequences of Uniprot IDs specified in the figure. Secondary structural elements are predicted by PSIPRED server based on S. mansoni sequence (Buchan et al., 2013). Identical, very similar, and similar amino acids are indicated by ‘*’, ‘:’, and ‘.’, respectively. Colors represent residues with different properties. Orange: A, V, F, P, M, I, L, W; red: D, E; blue: R, K; green: S, T, Y, H, C, N, G, Q.
Figure 5
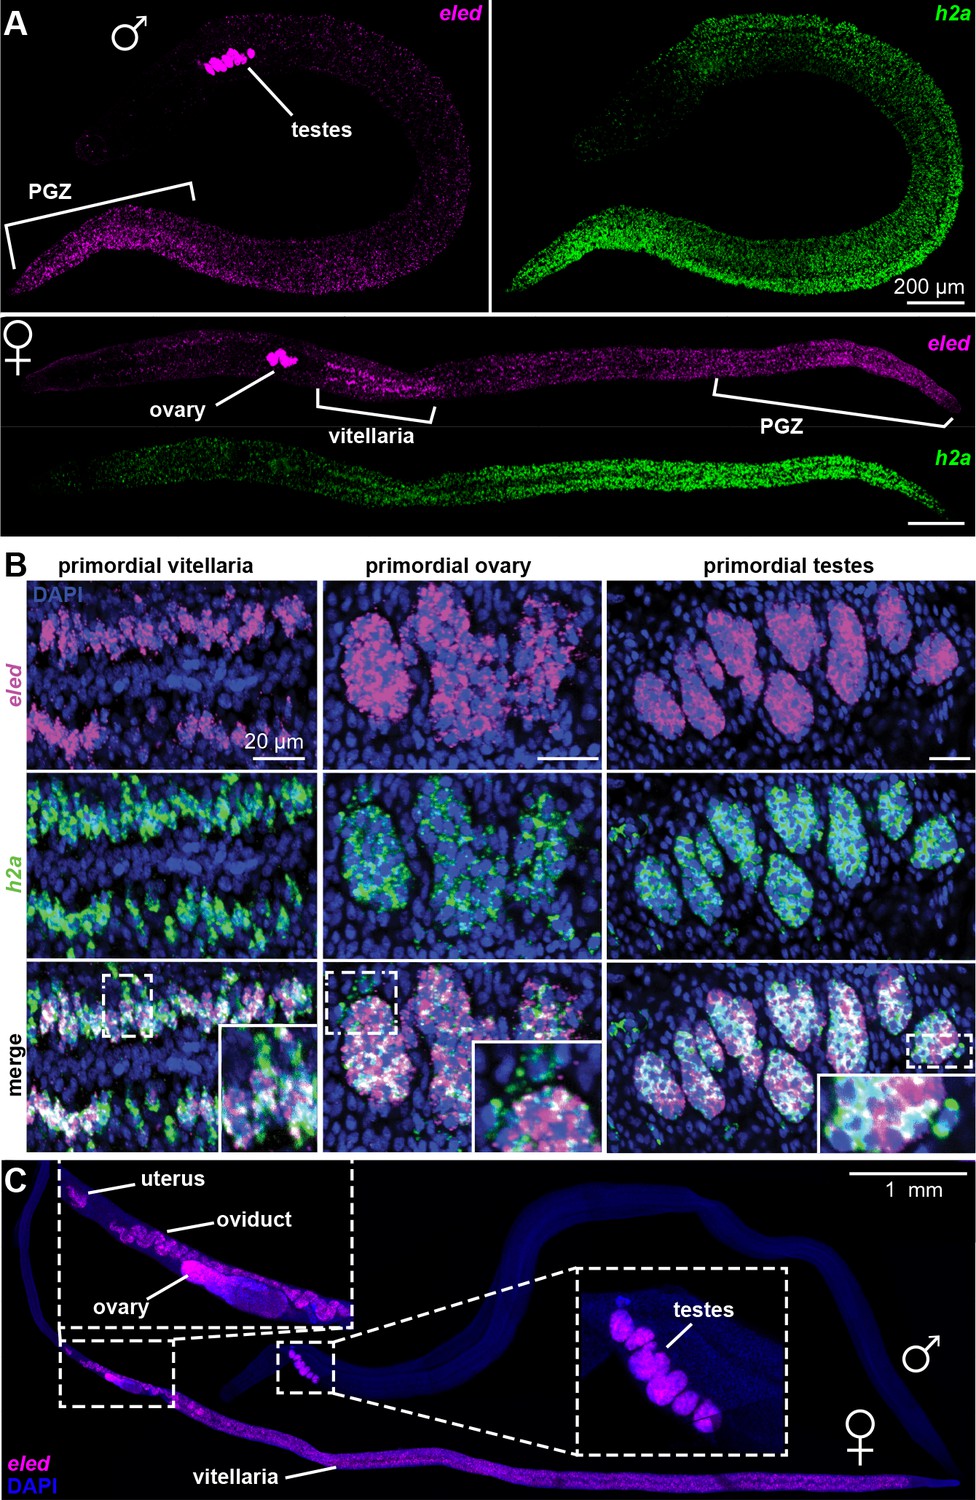
Changes in eled expression during the course of intramammalian development.
(A) FISH detects eled and h2a expression in juveniles. The boundary of the PGZ is defined by a sharp drop of eled+ cells. eled signal in testes and ovary was over saturated in order to detect weaker expression in soma. (B) Double FISH of eled and h2a in juvenile gonads. Insets: magnified boxed areas. (C) eled expression in adults. eled+ cells were only detected in reproductive organs (insets). Note high expression in testes and anterior ovary, where oogonial stem cells are found, but low expression in the posterior ovary, where germ cells differentiate.
Figure 6 with 1 supplement
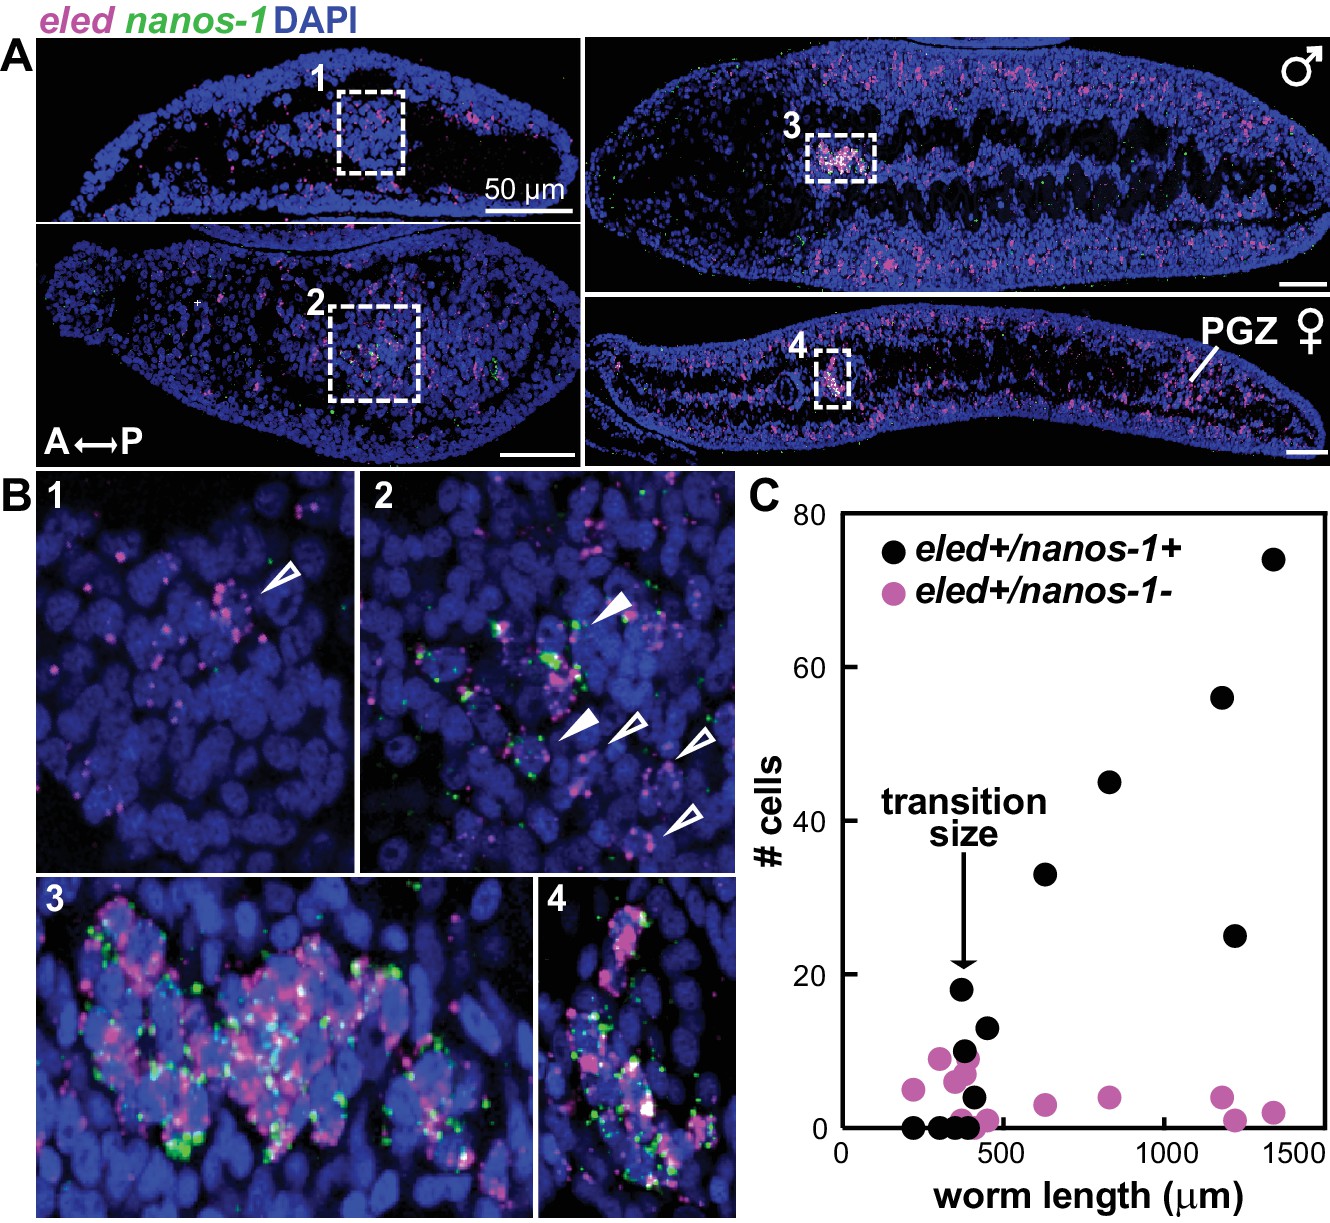
eled expression precedes that of germline-specific nanos-1.
(A) Double FISH of eled and nanos-1 in 3-week juveniles, showing the emergence of nanos-1 expression in gonadal primordia. (B) Magnified boxed gonadal regions in (A). Images are numbered from less to more mature worms. Images are confocal sections. Empty arrowheads: eled+nanos-1-; solid arrowheads: eled+nanos-1+. (C) Quantification of nanos-1 expression in eled+ presumptive germ cells as a function of worm length. Symbols represent cell counts in individual animals. Note the sharp transition at worm length ~400 µm (N = 13).
Figure 6—figure supplement 1
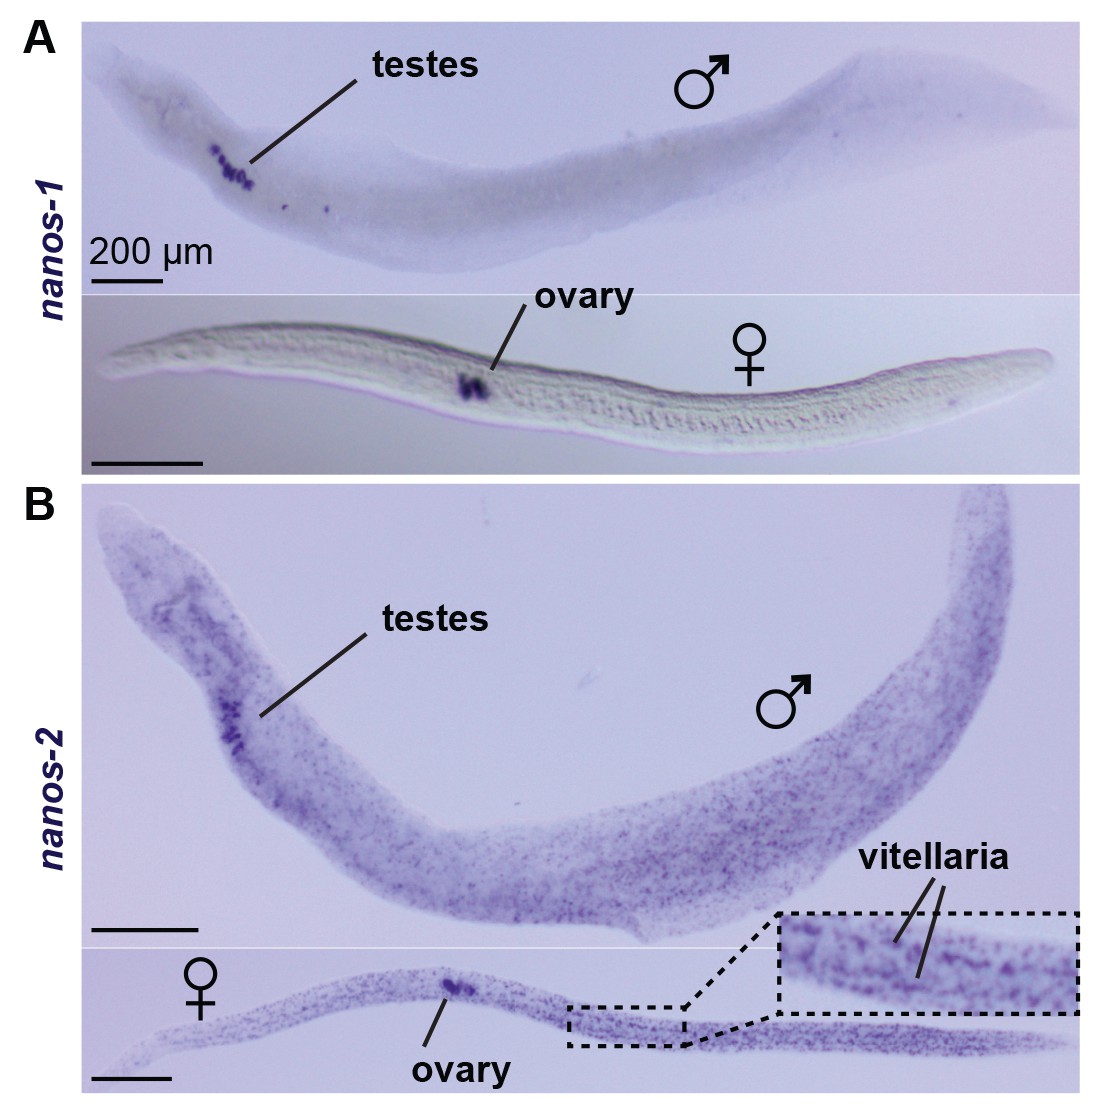
nanos-1 expression is germline specific.
WISH of (A) nanos-1 and (B) nanos-2 in juveniles (top: male; bottom: female). While nanos-2 is expressed in both ε and δ’-cells, the other schistosome nanos homolog, nanos-1, only shows expression in testes, ovary, and vitellaria.
Figure 7
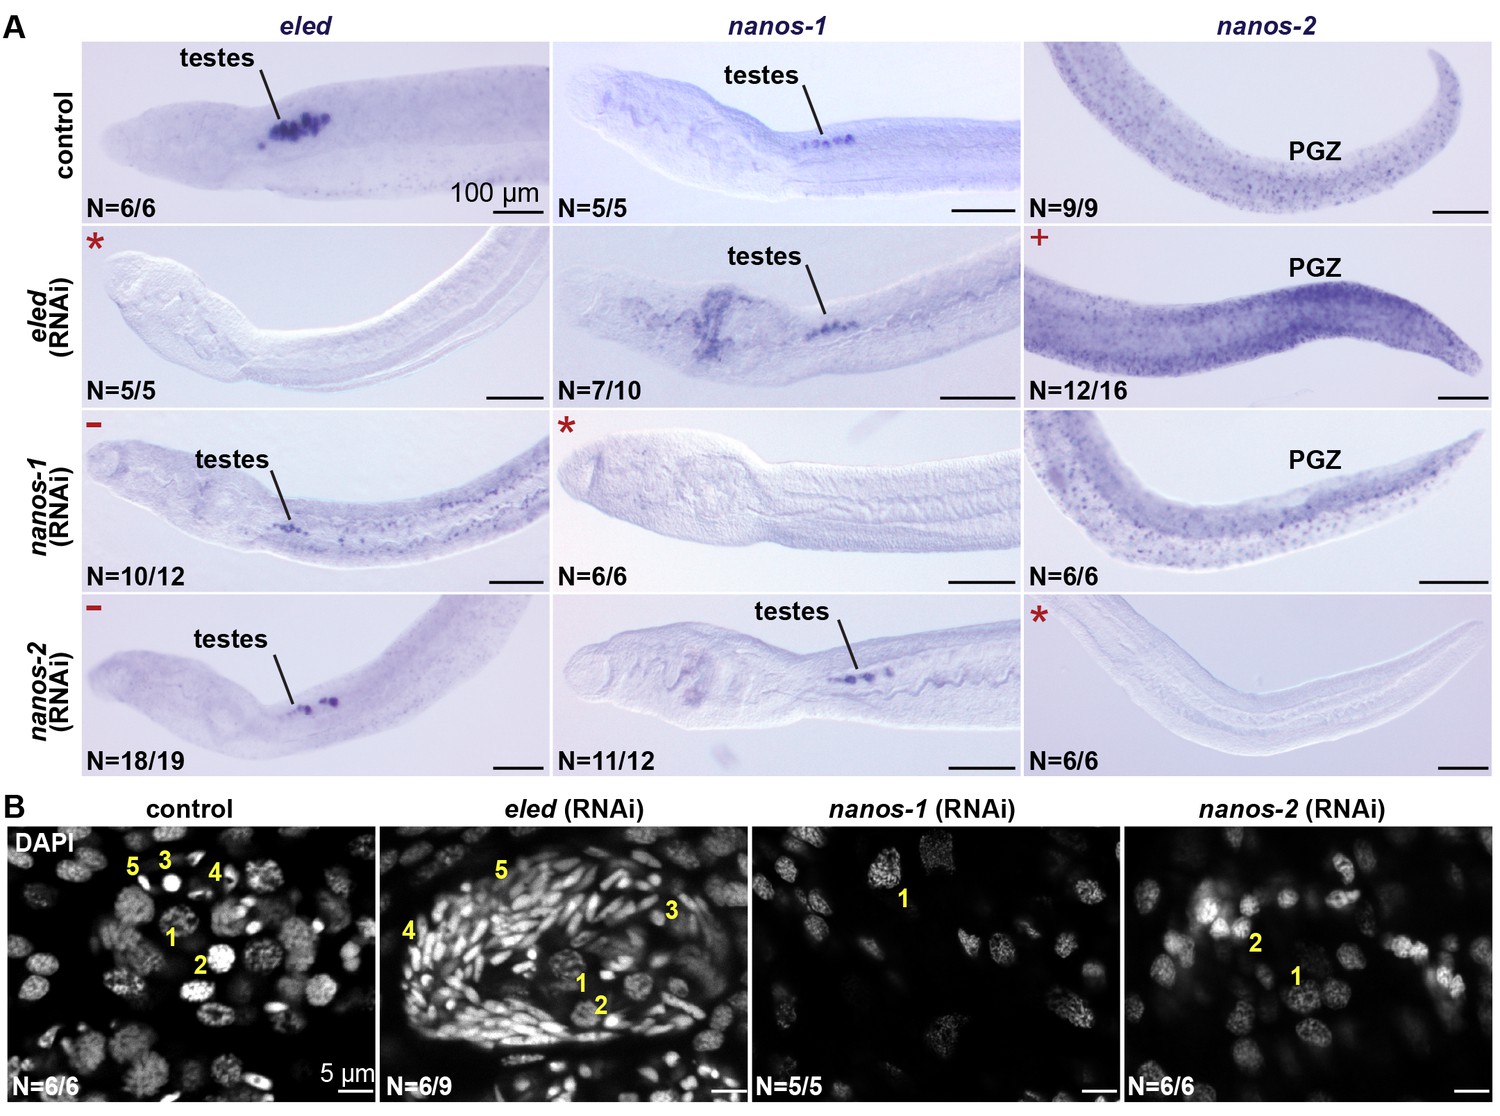
eled functionally antagonizes nanos.
(A) WISH images showing the expression of eled, nanos-1, and nanos-2 in male juveniles after RNAi. +: higher nanos-2 expression compared to the control; -: regressed testes; asterisks: RNAi depletion of the target transcripts. (B) Confocal sections of DAPI-stained testes in RNAi worms. Nuclear morphologies are consistent with (1) undifferentiated spermatogonium, (2) spermatocyte; (3) round spermatid, (4) elongating spermatid, and (5) sperm. In nanos-1 or nanos-2 (RNAi) animals, all testis lobes regressed; whereas in eled (RNAi) animals, worms with more than two testis lobes with accumulation of sperm were counted as manifesting the phenotype (schistosomes normally possess 6–8 testis lobes). N: number of worms analyzed in one biological replicate; penetrance was consistent between 4 biological replicates.
Figure 8

A proposed model for the schistosome stem cell classes.
κ-cells are at the top of the hierarchy, and express nanos-2 and klf. Activation of several genes associated with somatic stem cell function in adults (fgfrA/B; p53; zfp-1) leads to the specification of δ-cells, which we propose serve to generate somatic tissues. Downregulation of nanos-2 and activation of hesl in δ-cells leads to the formation of φ-cells, which are associated with many transitory larval structures, including the sporocyst epidermis (tegument) and the cercarial tail. Only a small number of κ and δ-cells is transmitted from the asexual to the sexual life-cycle stages. After entry into the mammalian host, activation of hesl in δ-cells leads to δ’-cells, which appear to serve as the source of the adult somatic stem cells. κ-cells downregulate nanos-2 and activate expression of an intramammalian stage-specific transcript, eled, generating ε-cells, which are distributed in gonadal primordia and the posterior growth zone. During maturation, gonadal ε-cells subsequently activate germline-specific nanos-1, which commits ε-cells to germline fate.
Tables
Key resources table
| Reagent type (species) or resource | Designation | Source or reference | Identifiers | Additional information |
|---|---|---|---|---|
| Strain (Schistosoma mansoni) | NMRI | BEI Resources | NR-21963 | |
| Antibody | Anti-Digoxigenin-POD | Roche | 11207733910 | |
| Antibody | Anti-Digoxigenin-AP | Roche | 11093274910 | |
| Antibody | Anti-DNP-HRP | PerkinElmer | FP1128 | |
| Antibody | Anti-Fluorescein-POD | Roche | 11426346910 | |
| Recombinant DNA reagent | Plasmid-pJC53.2 | Addgene | 26536 | |
| Chemical compound | succinylated Wheat Germ Agglutinin (sWGA) | Vector Laboratories | FL-1021S | |
| Chemical compound | Carboxyrhodamine 110 azide | Click Chemistry Tools | AZ105 | |
| Chemical compound | Alexa Fluor 488 azide | Invitrogen | A10266 | |
| Chemical compound | 5-ethynyl-2-deoxyuridine (EdU) | Invitrogen | A10044 | |
| Chemical compound | Vybrant DyeCycle Violet (DCV) | Invitrogen | V35003 | |
| Chemical compound | POPO-1 | Invitrogen | P3580 | |
| Chemical compound | TOTO-3 | Invitrogen | T3604 | |
| Chemical compound | Calcein AM | Invitrogen | C3100MP |
Additional files
-
Supplementary file 1
Sporocyst stem cell class-dependent genes and their mean expression levels in each stem cell class.
Genes exhibit significant differences (>4 fold, p<0.01) between δ, κ, and φ stem cell classes in sporocysts. p-values were calculated by a two-sample t-test, using the more stringent estimate from the assumptions of either unequal or equal population variances.
- https://doi.org/10.7554/eLife.35449.019
-
Supplementary file 2
Nested primer sets used for single-cell qPCR.
Feature IDs are given in the S. mansoni genome version 5 (Protasio et al., 2012), but all sequences input for primer design were manually curated by pooling all our RNAseq reads together and mapping to the reference genome. All primer sets were validated by bulk qPCR on whole animal cDNA libraries. Note that for three targets, Smp_179320, Smp_101370, and Smp_055310, we have two independent nested primer sets.
- https://doi.org/10.7554/eLife.35449.020
-
Supplementary file 3
Gene names used in the main text and figures.
Genes are associated with feature IDs in the S. mansoni genome version 5 (Protasio et al., 2012). Their functional annotations and cloning primer sequences are also listed.
- https://doi.org/10.7554/eLife.35449.021
-
Transparent reporting form
- https://doi.org/10.7554/eLife.35449.022
Download links
A two-part list of links to download the article, or parts of the article, in various formats.
Downloads (link to download the article as PDF)
Open citations (links to open the citations from this article in various online reference manager services)
Cite this article (links to download the citations from this article in formats compatible with various reference manager tools)
Stem cell heterogeneity drives the parasitic life cycle of Schistosoma mansoni
eLife 7:e35449.
https://doi.org/10.7554/eLife.35449


