Striking circadian neuron diversity and cycling of Drosophila alternative splicing
- University of California, Berkeley, United States
- Howard Hughes Medical Institute, Brandeis University, United States
- Brandeis University, United States
Figures
Figure 1 with 2 supplements

Many novel alternatively spliced junctions were identified in isolated Drosophila neurons.
Alternatively spliced junctions (AS junctions) were identified in RNA-seq libraries generated from isolated Drosophila neurons (DN1s, LNds, LNvs, and dopaminergic (TH)) as well as from a separately prepared heterogeneous Drosophila whole head sample. (A) Pictorial representation of the Junction Usage Model (JUM), using a cassette exon AS pattern as an example. AS junctions are identified in RNA-seq data from reads that have alternative 5’- or 3’- splice sites. These AS junctions are grouped into AS structures, defined as a set of splice junctions that share the same 5’- or 3’- splice site. The usage of each sub-AS-junction, that is the relative abundance of that sub-AS-junction compared to the other AS junctions in the same AS structure is calculated and can be compared across different conditions for differential AS analysis. AS structures are then assembled into conventionally recognized AS patterns based on the unique topological feature of the splice graph representing each pattern. (B) The bar graph on the left shows the number of AS junctions identified in each sample, including only the ones that are found within a gene. Darker blue indicates those AS junctions found in the heterogeneous whole head transcriptome and also annotated in the current genome annotation. Lighter blue denotes those junctions identified in the whole head transcriptome and not in the current genome annotation. Red denotes those junctions found in isolated neurons but not in the whole head transcriptome. The bar graph on the right shows the number of genes with the corresponding ALT junctions as specified on the left. (C) The majority of the AS junctions exclusively identified in neuron subtypes are novel and not annotated in the current genome annotation (~95%; shown in red). (D) Heat map of all AS junctions identified from the neuronal subtypes and the whole head sample. Every column is an AS junction and if the junction is identified in a sample, a blue grid is shown; otherwise a red grid is shown.
-
Figure 1—source data 1
AS junctions identified in DN1, LNd, LNv, TH neurons and heads.
- https://doi.org/10.7554/eLife.35618.006
Figure 1—figure supplement 1
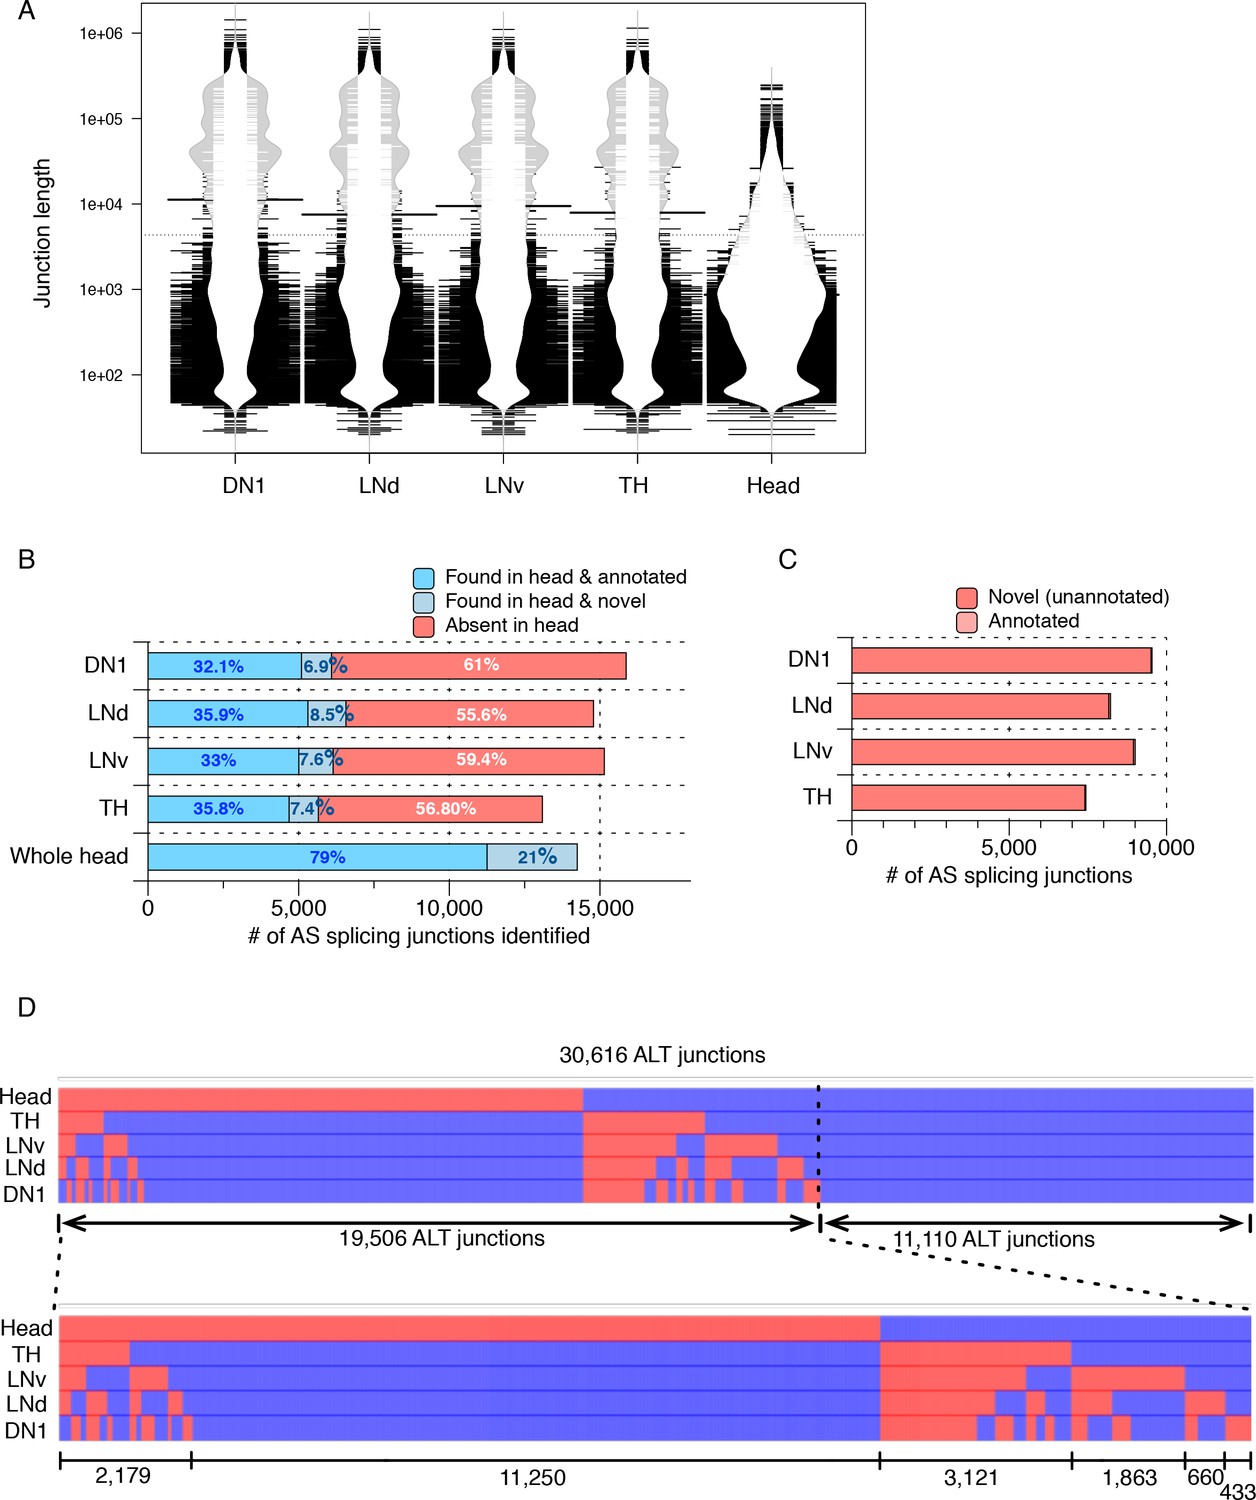
Many AS junctions with varying lengths were identified in isolated neuron subtypes.
Alternatively spliced junctions (AS junctions) were identified in RNA-seq libraries generated from isolated Drosophila neurons (DN1s, LNds, LNvs, and dopaminergic (TH)) as well as from a separately prepared heterogeneous Drosophila whole head sample. (A) Bean plot depicting the length distribution of AS junctions identified from all neuronal samples. Many extremely long AS junctions are found, especially enriched in isolated neuronal subtypes. (B) The bar graph shows the number of total AS junctions (of all lengths) identified in each sample, including only the ones that are found within a gene. Darker blue indicates those AS junctions found in the heterogeneous whole head transcriptome and also annotated in the current genome annotation. Lighter blue denotes those junctions identified in the whole head transcriptome and not in the current genome annotation. Red denotes those junctions found in isolated neurons but not in the whole head transcriptome. (C) The majority of the total AS junctions (of all lengths) exclusively identified in neuron subtypes are novel and not annotated in the current genome annotation (>99%; shown in red). (D) Heatmap of all AS junctions (of all lengths) identified from the neuronal subtypes and the whole head sample. Every column is an AS junction and if the junction is identified in a sample, a blue grid is shown; otherwise a red grid is shown.
Figure 1—figure supplement 2
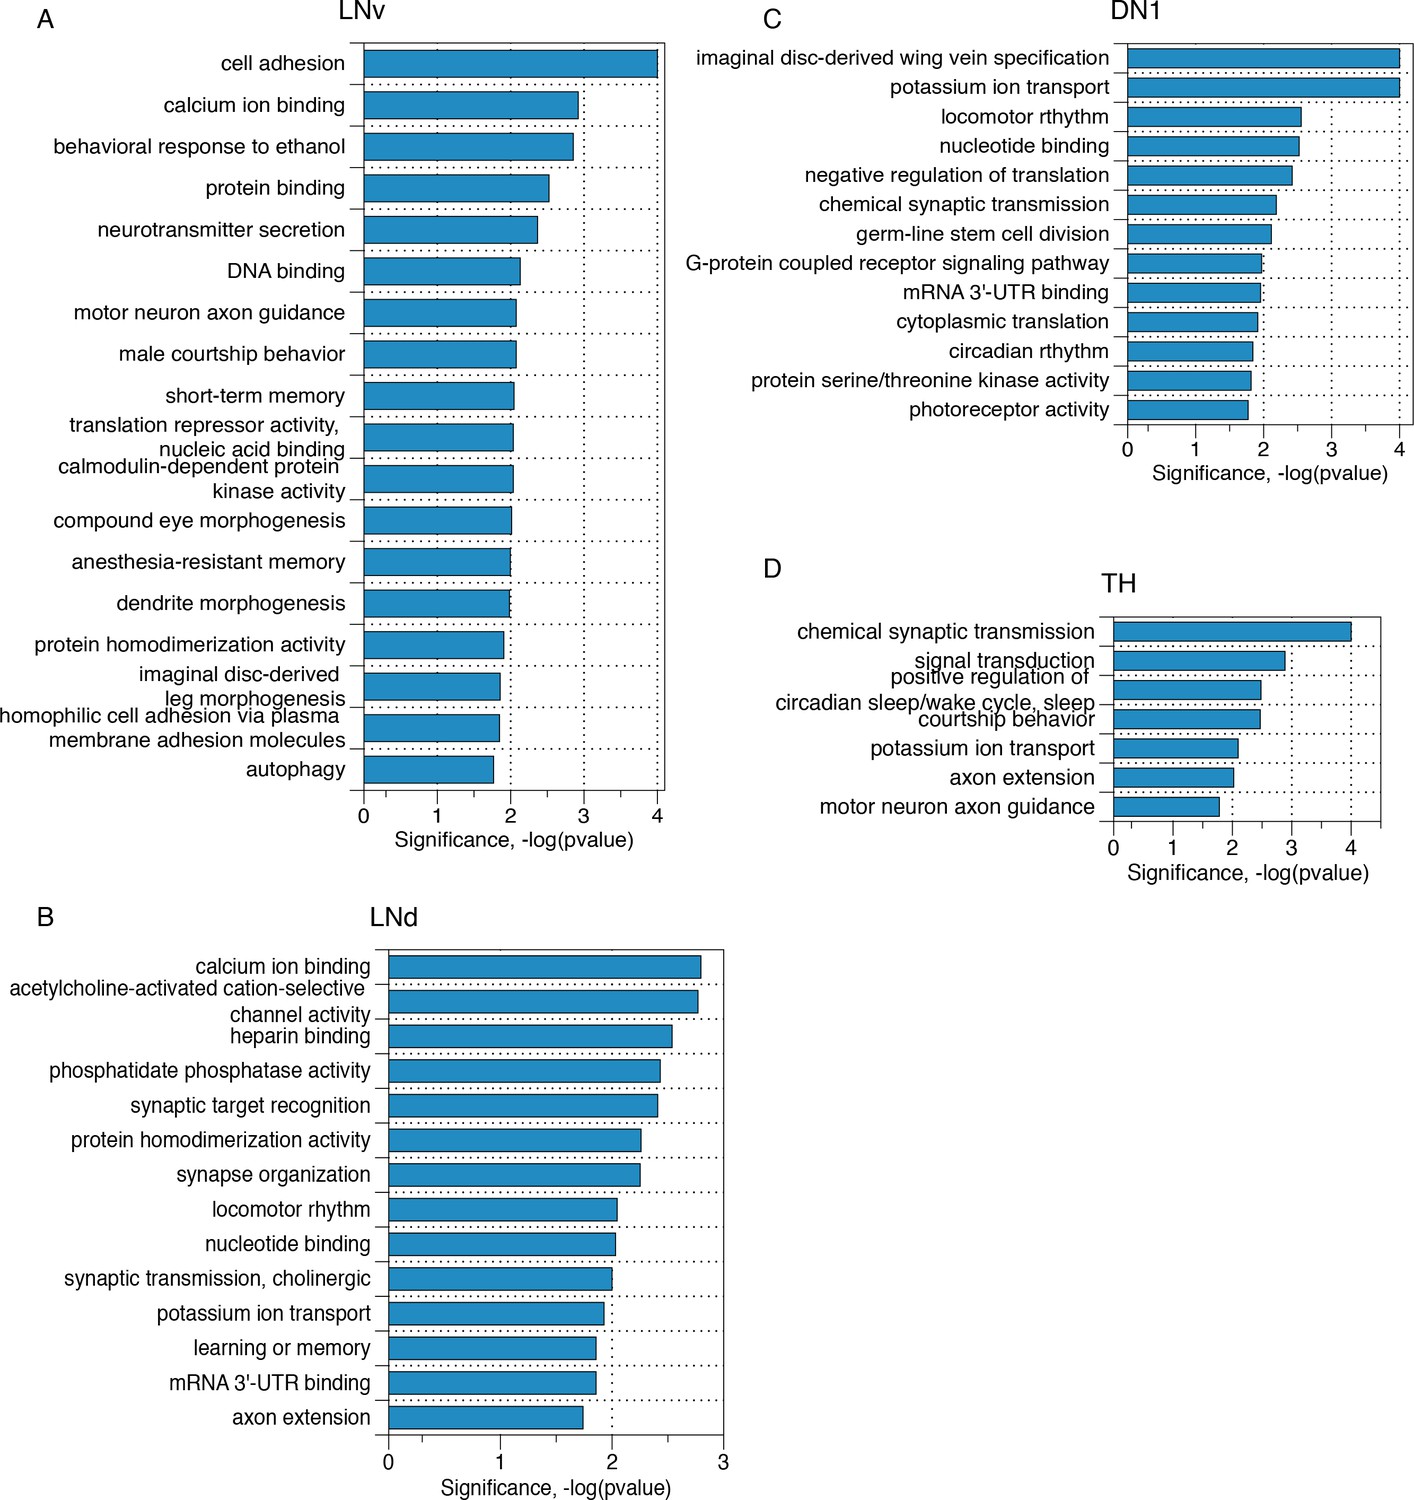
Transcripts with neuron subgroup specific novel ALT junctions reflect critical neuronal functions.
Gene ontology analyses of those transcripts that present neuron subgroup-specific novel ALT junctions that are not found in whole head samples for (A) LNv neurons, (B) LNd neurons, (C) DN1 neurons and (D) TH neurons, respectively.
Figure 2
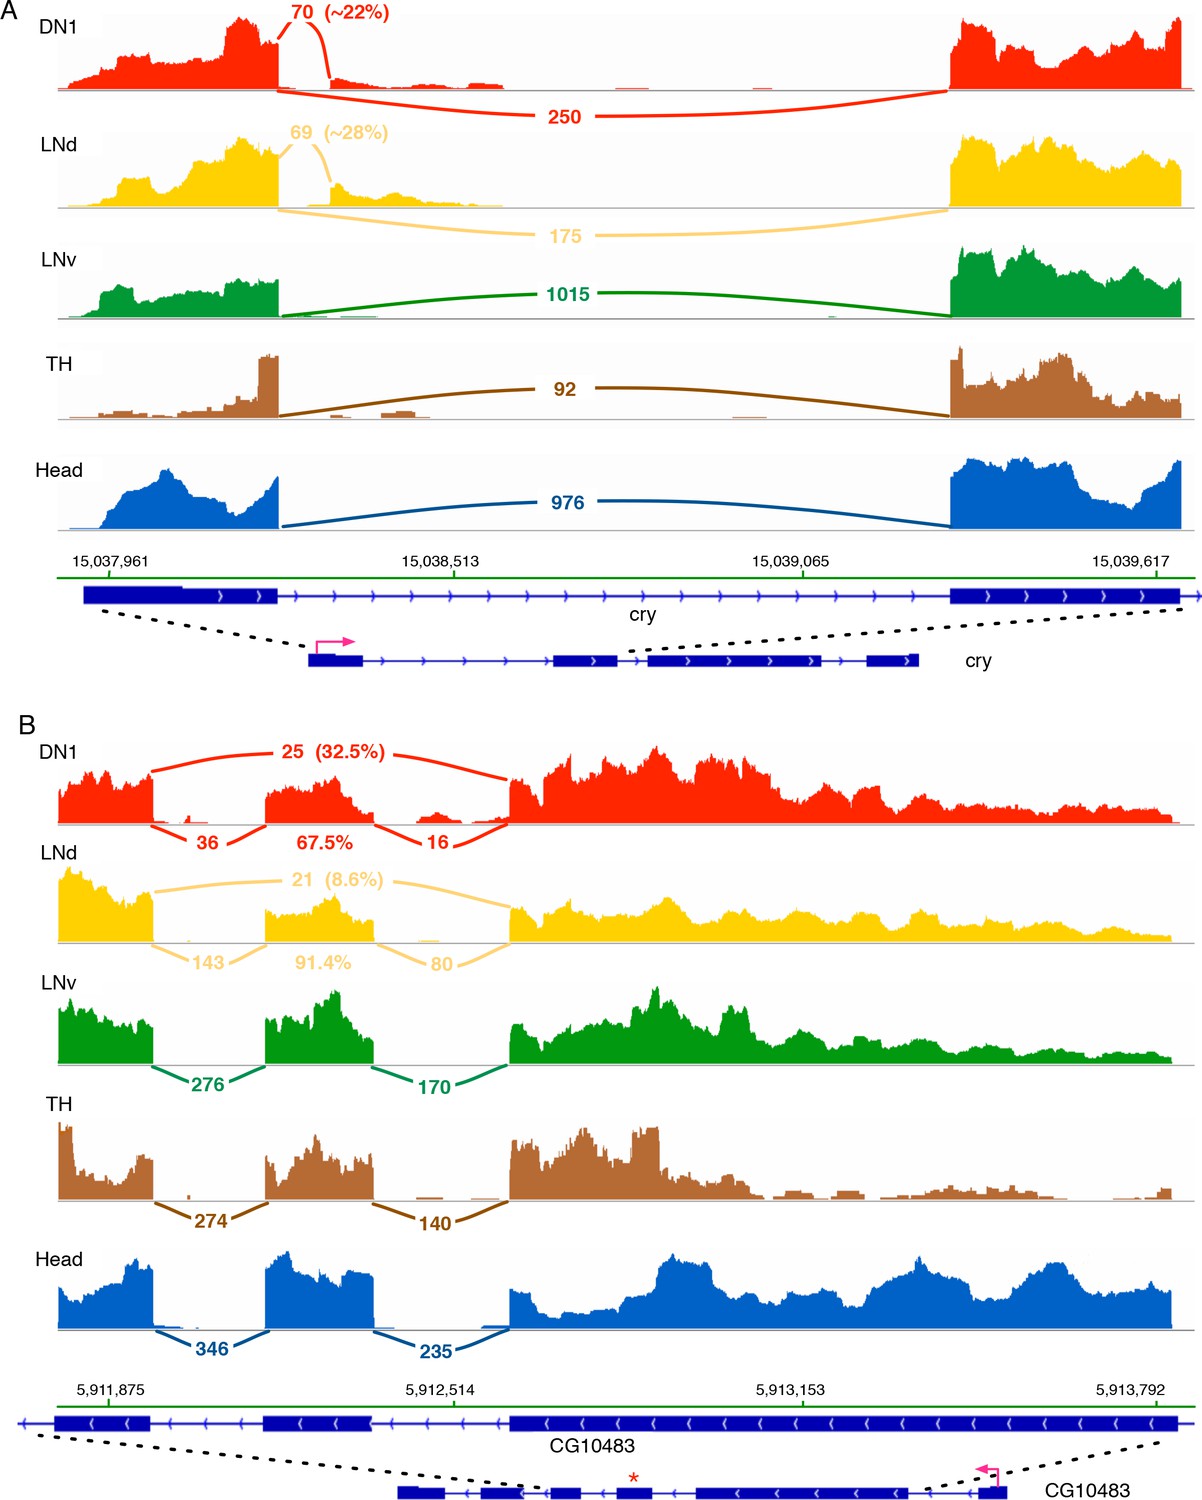
Cry and CG10483 transcripts show neuron subtype-specific alternative splicing that is absent in the heterogeneous head sample.
Neuron subtype-specific novel alternative splicing of cry and CG10483 are shown. RNA-seq data tracks derived from the neuronal samples are shown, with arcs representing splice junctions and the number of unique-mapped RNA-seq reads mapped to the junction across the arc. A percentage number is shown to indicate the usage of the specific junction or the corresponding splicing isoform. The orientation of the transcript is shown at the bottom: the red arrow indicates the direction of the promoter. The dotted lines indicate the region of transcript that is enlarged to highlight the alternatively spliced region. (A) The transcript of the blue-light photoreceptor, cry, has a novel alternative splicing junction in DN1s and LNds that is not observed in the head transcriptome: the first exon is spliced to a novel exonic region within the first intron. (B) The putative G-protein coupled receptor, CG10483, undergoes an exon-skipping event in LNds and DN1s that is not observed in whole heads. The skipped exon three is marked by ‘*’ and is skipped in ~10% of the CG10483 transcripts in LNds and ~30% of the CG10483 transcripts in DN1s.
Figure 3 with 3 supplements
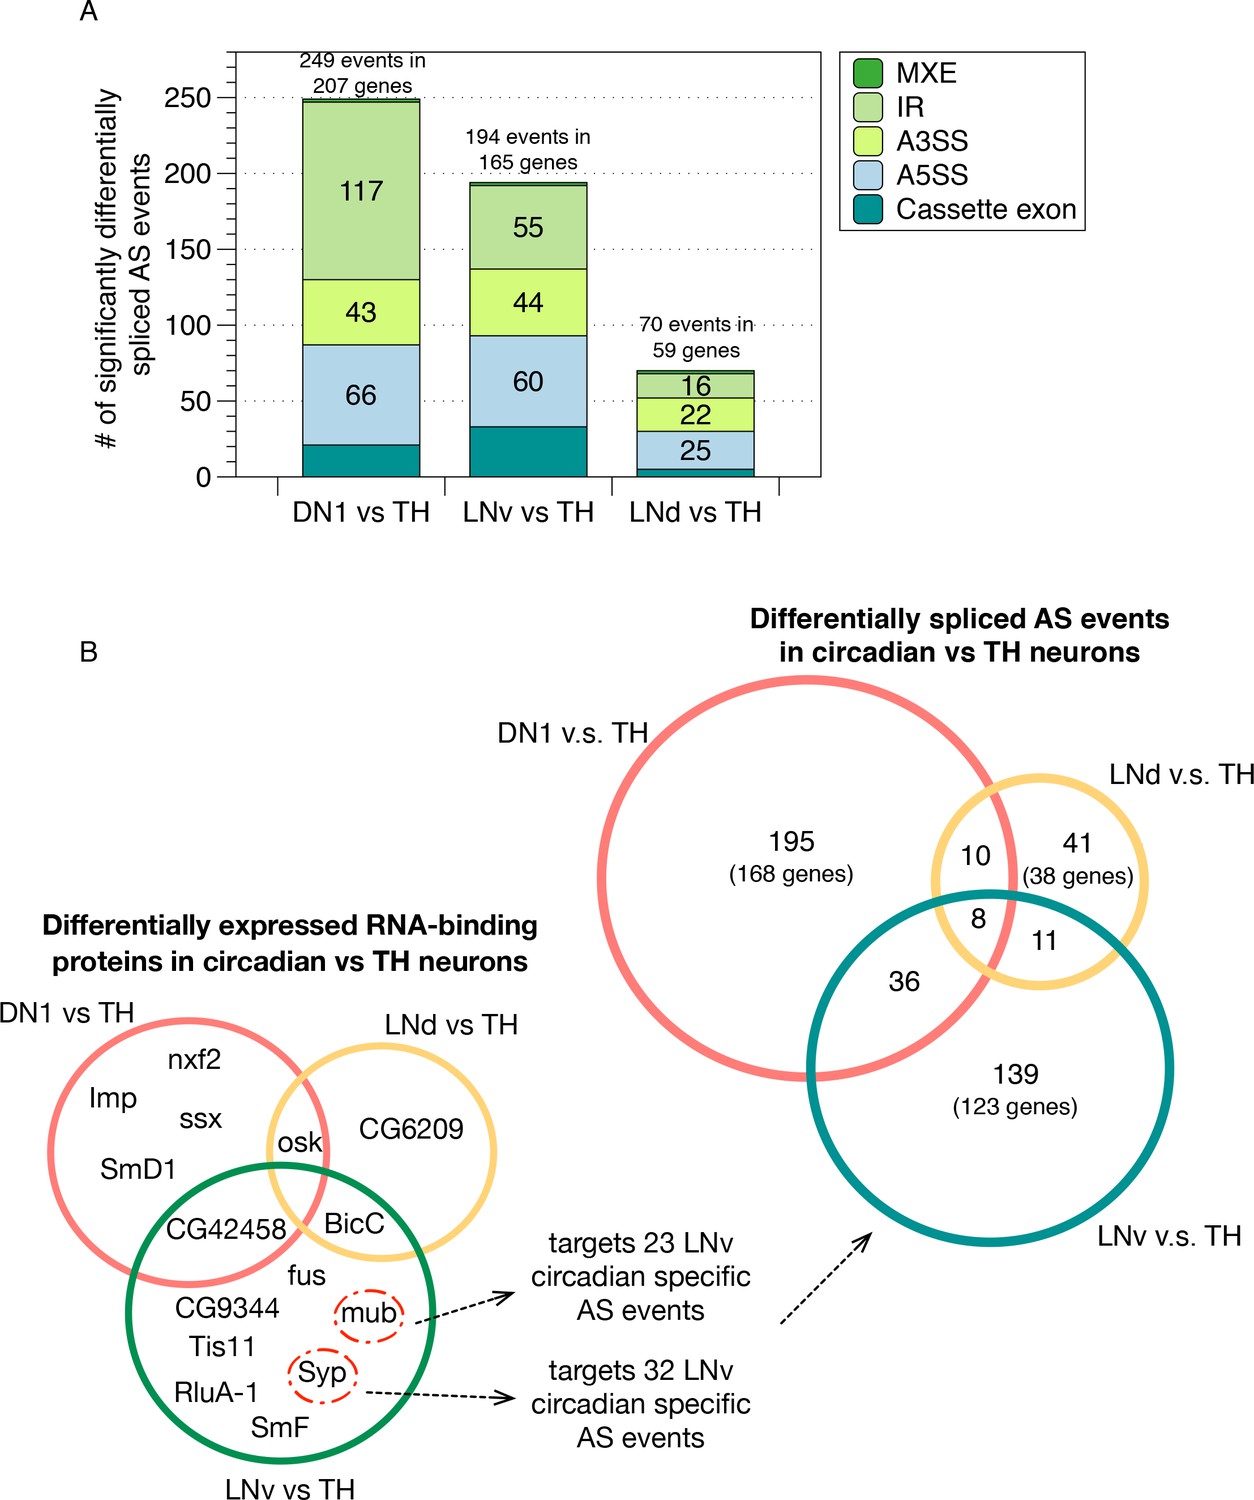
Identification of differentially spliced AS events in circadian neurons compared to non-circadian, TH neurons.
(A) AS events that were differentially spliced in the circadian neurons (DN1, LNd and LNv) compared to the dopaminergic neurons (TH) were identified using JUM, respectively. The number and type of these differentially alternatively spliced AS events are shown. (Cassette exon - SE, alternative 5’/3’ splice site –A5SS/A3SS, intron retention – IR, mutually exclusive exons – MXE). (B) Venn graph in the top right showing the overlap of differentially alternatively spliced AS events among the three circadian neuron subtypes versus TH neurons, as well as the number of genes involved in these AS events. Most of the transcripts undergoing differential AS events are unique to one subset of the circadian neurons. Only eight transcripts in eight genes show differential AS events in all three circadian neuron groups. Venn graph in the lower left showing the overlap of differentially expressed RBPs (potential splicing regulators) in each of the three circadian neuron subtypes compared to TH neurons. Very limited overlap is also found for the differentially expressed RBPs among neuron subpopulations. The RBPs Syp and mub which are differentially expressed in LNvs versus TH neurons target 32 and 23 LNv-specific AS event transcripts as determined from publicly available CLIP and RIP-seq experiment datasets (Stoiber et al., 2015).
-
Figure 3—source data 1
Differentially spliced AS events in DN1 neurons versus the non-circadian TH neurons.
- https://doi.org/10.7554/eLife.35618.012
-
Figure 3—source data 2
Differentially spliced AS events in LNd neurons versus the non-circadian TH neurons.
- https://doi.org/10.7554/eLife.35618.013
-
Figure 3—source data 3
Differentially spliced AS events in LNv neurons versus the non-circadian TH neurons.
- https://doi.org/10.7554/eLife.35618.014
-
Figure 3—source data 4
Differentially spliced AS events in DN1 neurons versus LNd neurons.
- https://doi.org/10.7554/eLife.35618.015
-
Figure 3—source data 5
Differentially spliced AS events in LNd neurons versus LNv neurons.
- https://doi.org/10.7554/eLife.35618.016
-
Figure 3—source data 6
Differentially spliced AS events in DN1 neurons versus LNv neurons.
- https://doi.org/10.7554/eLife.35618.017
-
Figure 3—source data 7
Differentially expressed gene transcripts in DN1 neurons versus the non-circadian TH neurons.
- https://doi.org/10.7554/eLife.35618.018
-
Figure 3—source data 8
Differentially expressed gene transcripts in LNd neurons versus the non-circadian TH neurons.
- https://doi.org/10.7554/eLife.35618.019
-
Figure 3—source data 9
Differentially expressed gene transcripts in LNv neurons versus the non-circadian TH neurons.
- https://doi.org/10.7554/eLife.35618.020
Figure 3—figure supplement 1
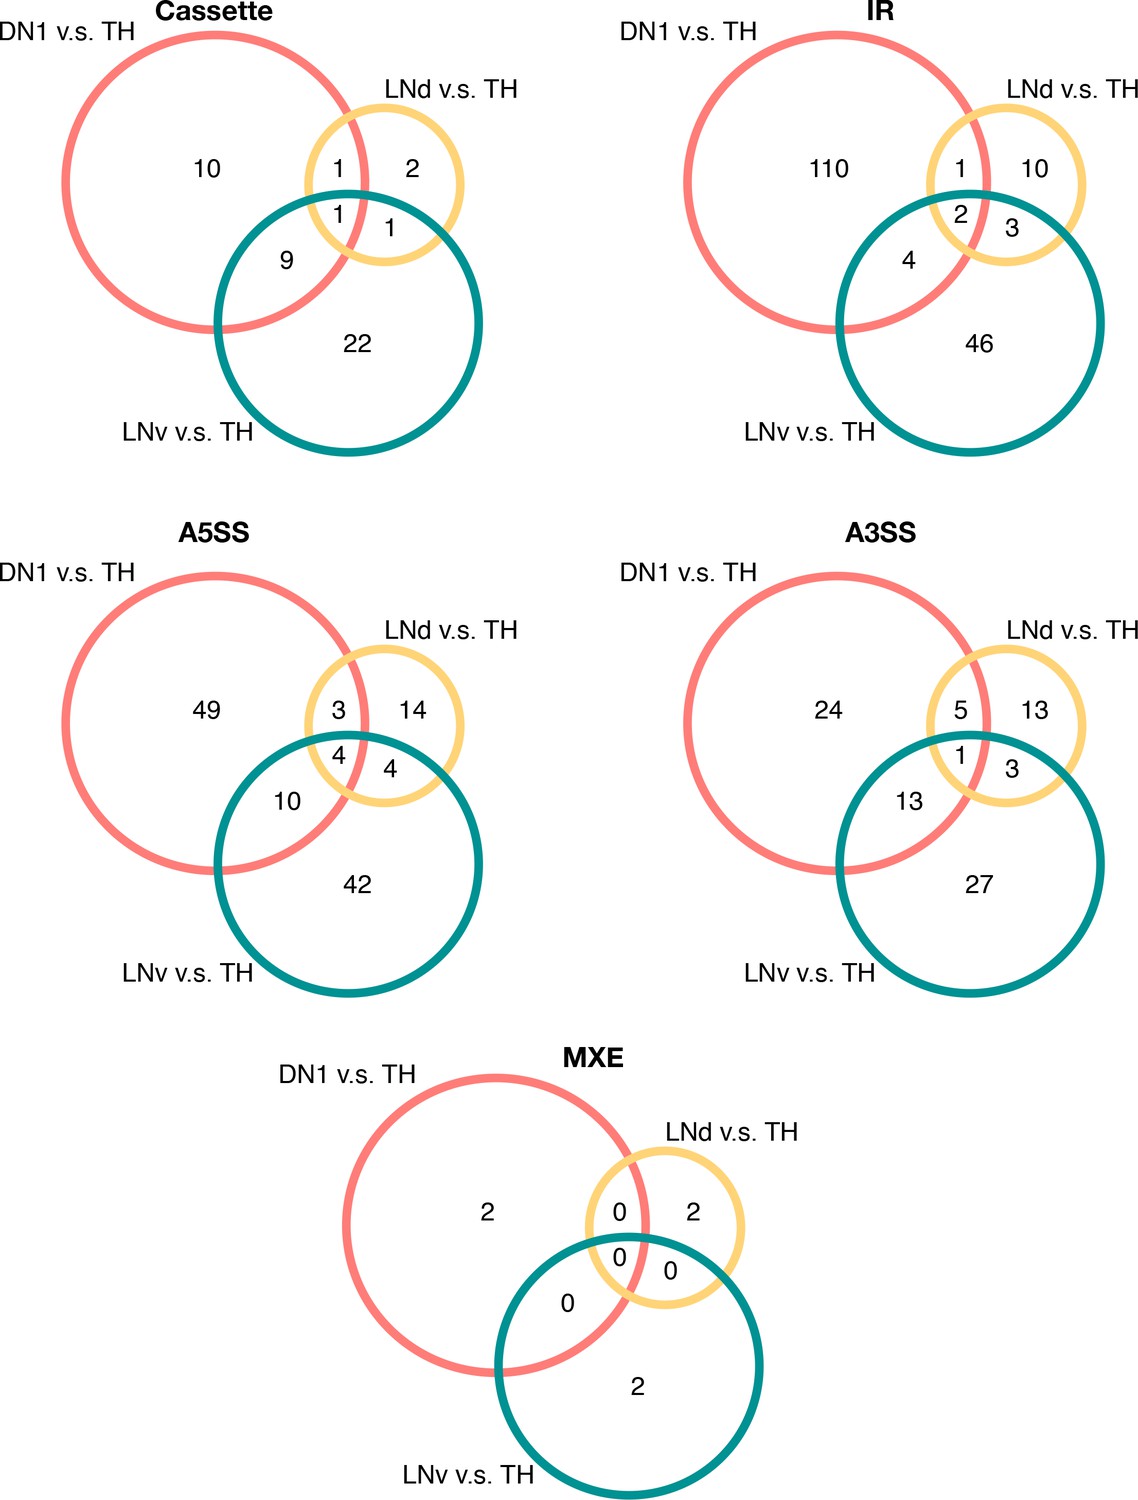
Overlap of differentially spliced AS events in circadian neurons compared to non-circadian, TH neurons in each conventionally recognized splicing pattern category.
Venn graphs showing the overlap of differentially alternatively spliced AS events among the three circadian neuron subtypes versus TH neurons, in each splicing pattern category. Most of the transcripts undergoing differential AS events are unique to one subset of the circadian neurons.
Figure 3—figure supplement 2
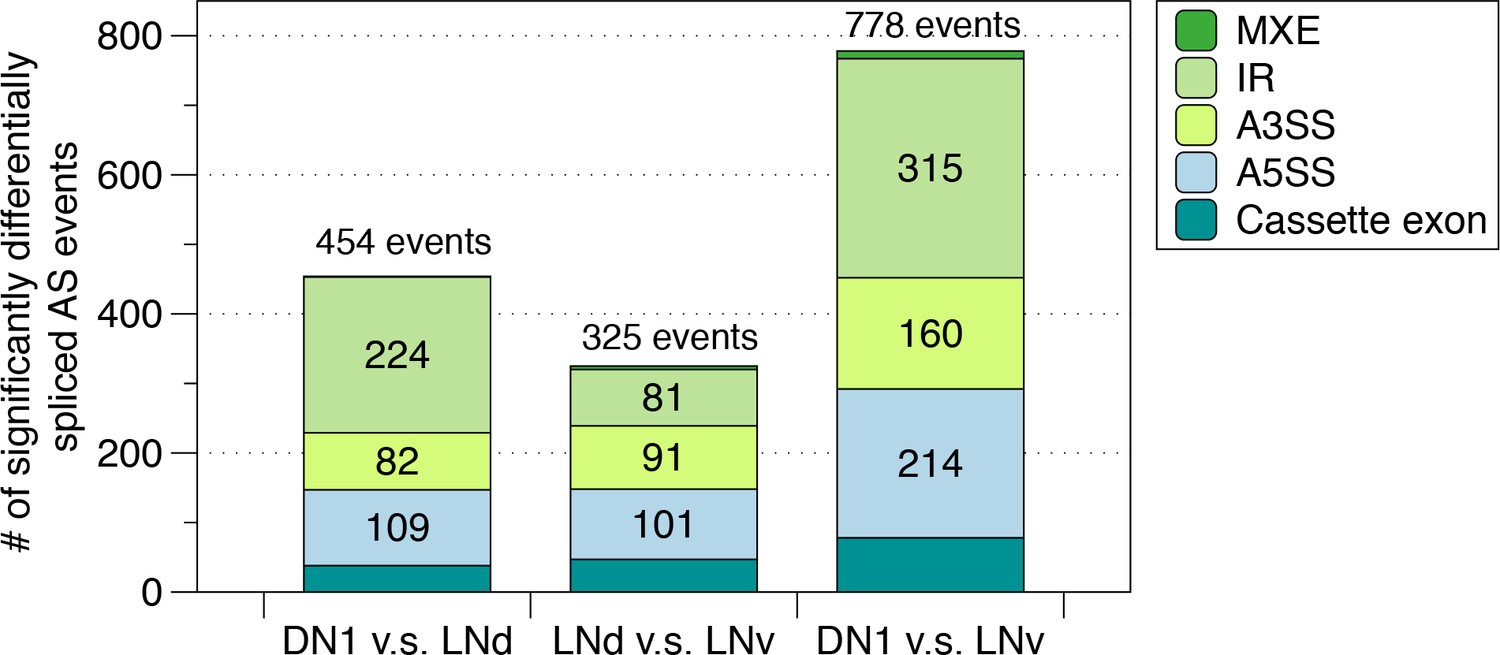
Identification of differentially spliced AS events among the circadian neuron subpopulations.
AS events that were differentially spliced in each of the circadian neuron subpopulations compared to another (DN1 vs. LNd, LNd vs. LNv and DN1 vs. LNv) were identified using JUM, respectively. The number and type of these differentially alternatively spliced AS events are shown.
Figure 3—figure supplement 3
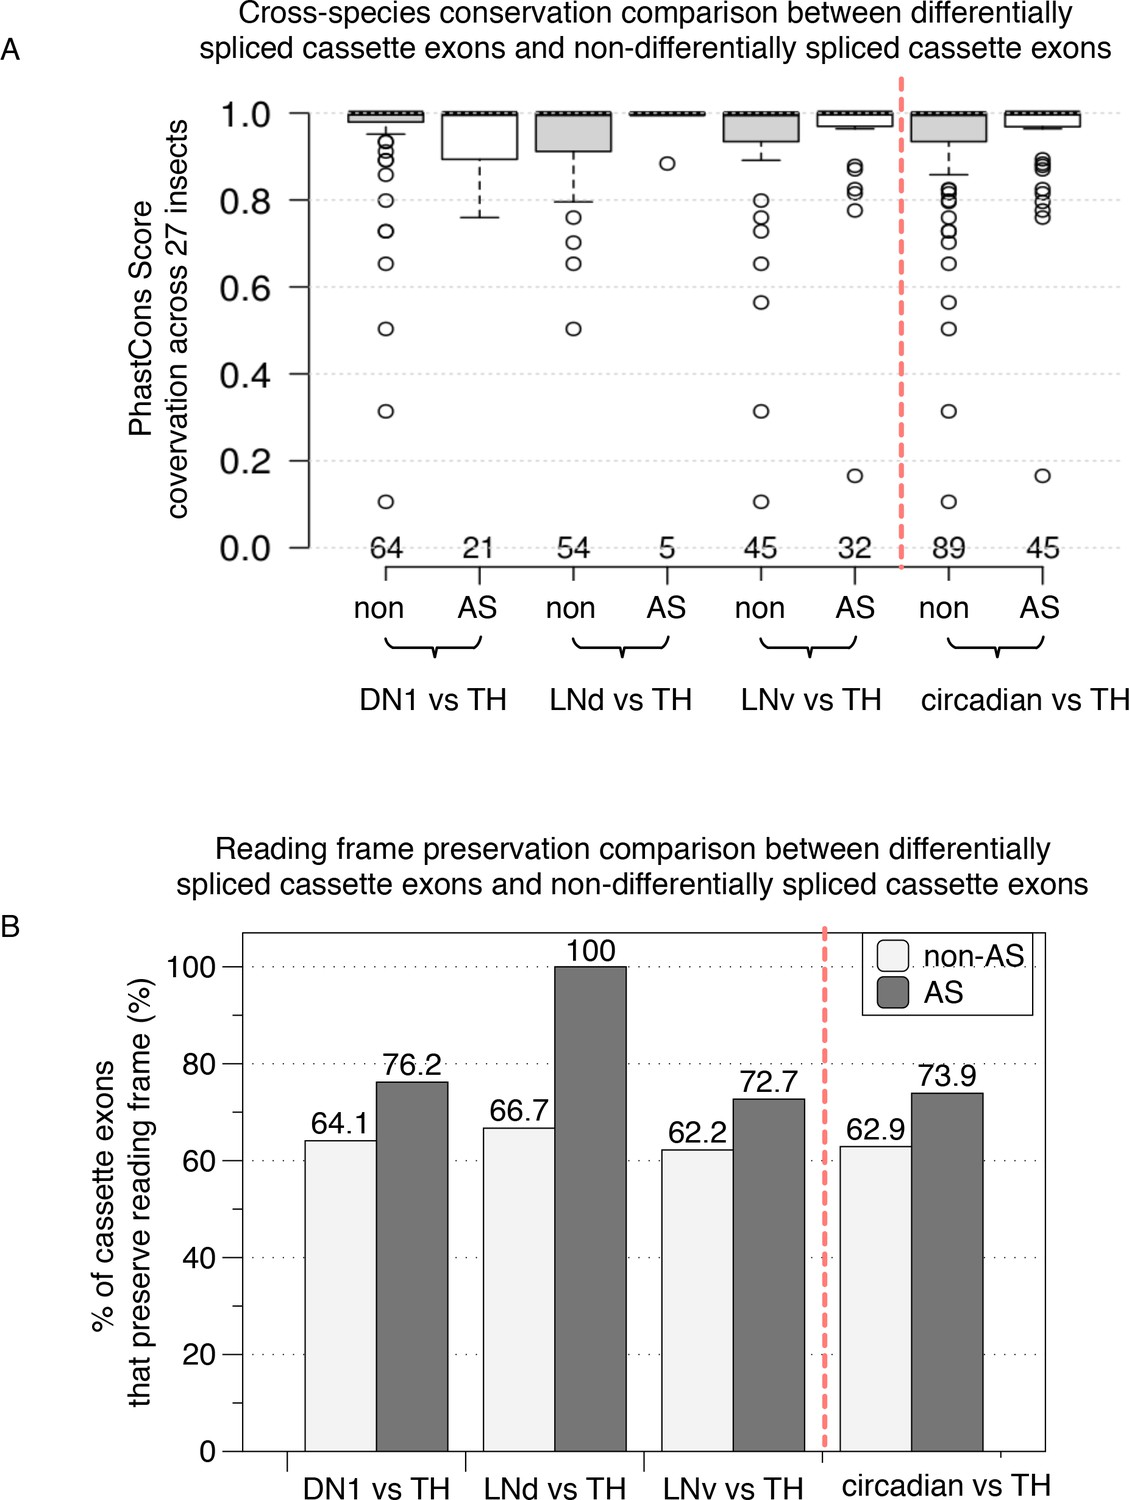
Functional comparison of differentially spliced cassette exons and non-differentially spliced cassette exons in circadian versus non-circadian TH neurons.
(A) Cross-species conservation comparison. Average PhastCon scores across 27 insect species for the set of differentially spliced cassette exons (AS) and non-differentially spliced cassette exons (non) in circadian versus non-circadian neurons are plotted as a boxplot. The panels on the right of the red dashed line showing the combined differentially spliced cassette exons and non-differentially cassette exons from all three circadian neurons versus TH neuron comparisons. (B) Reading frame preservation comparison. The percentages of cassette exons that preserve reading frame when excluded/included are plotted for the differentially spliced cassette exons (AS, dark shaded columns) and the non-differentially spliced exons (non, light gray-shaded columns).
Figure 4
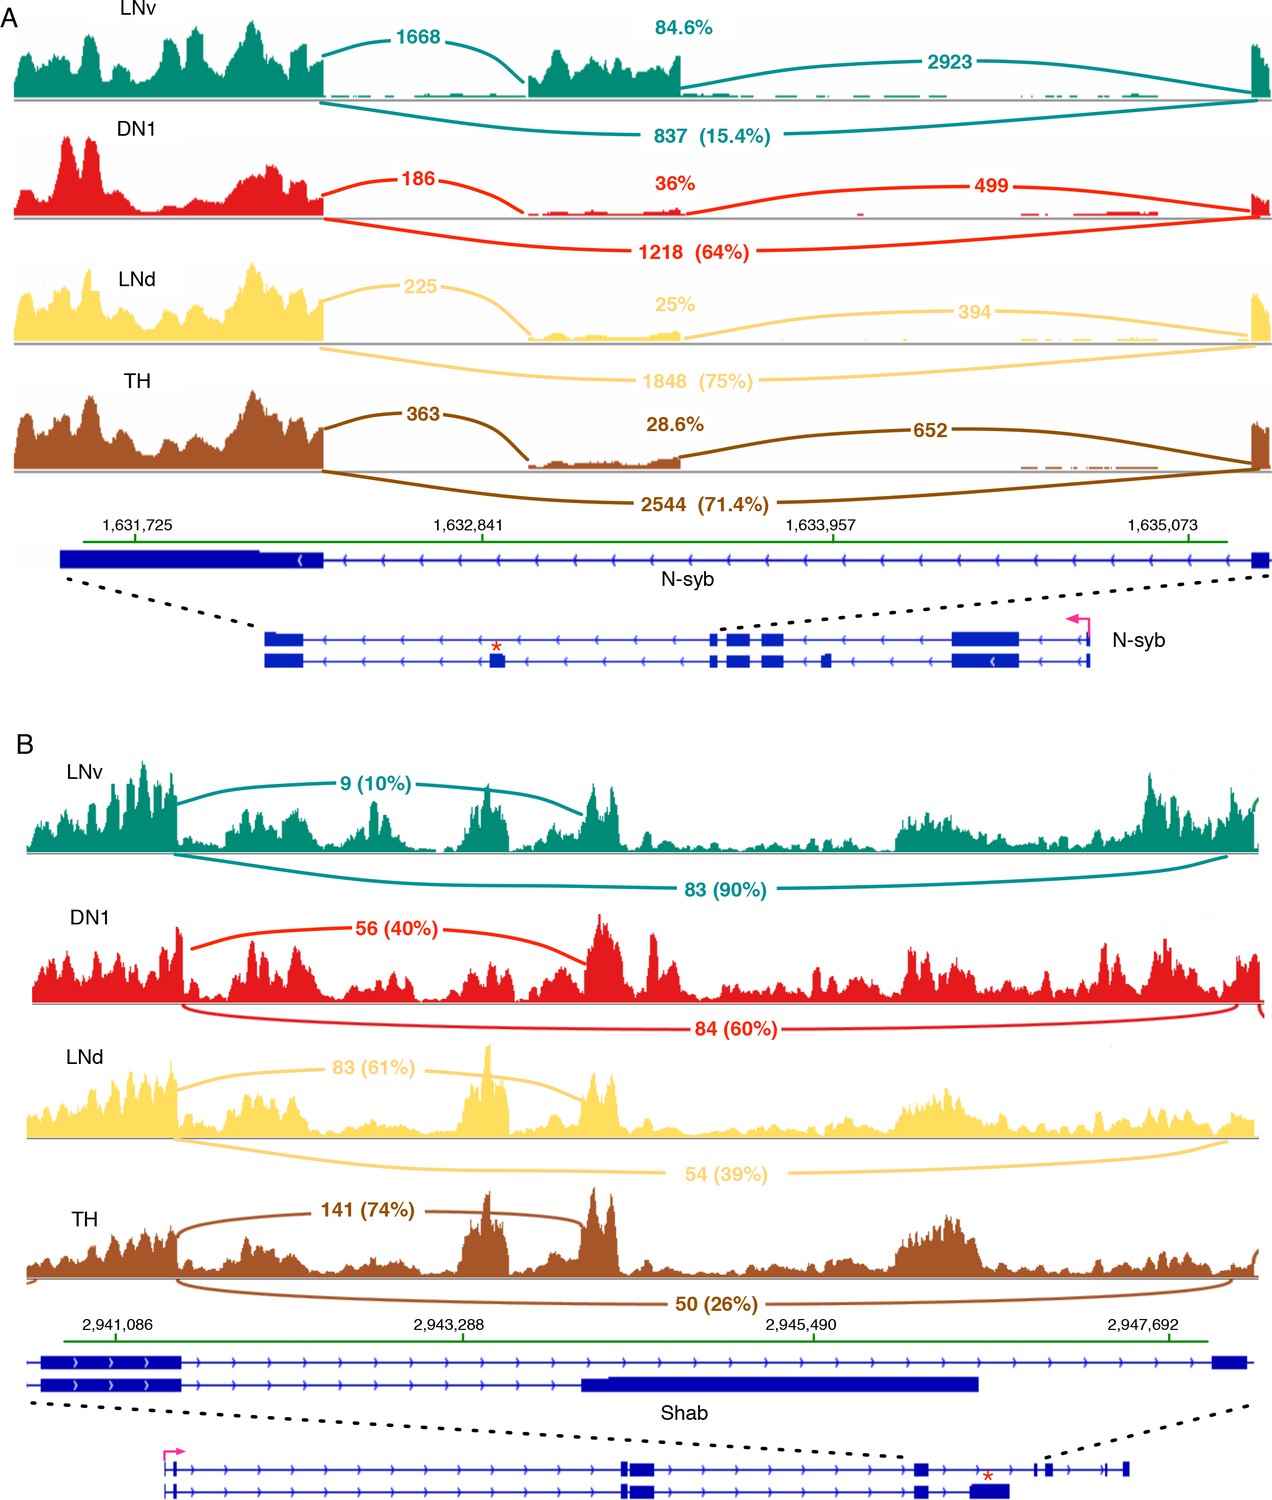
N-syb and Shab undergo differential splicing in circadian neurons compared to non-circadian, TH neurons.
(A) In LNvs, the Neuronal synaptobrevin (N-syb) transcript is enriched for the isoform that includes an exon present in variant J. The alternatively spliced exon is marked by ‘*’. Use of this exon results in a N-syb protein with a different C-terminus (85 amino acids). (B) The transcript of the potassium-gated voltage channel, Shab, undergoes differential alternative splicing in LNvs and DN1s. This results in the higher usage of the terminal exon present in variant K of Shab (marked by ‘*’). This creates a protein with a novel C-terminus that lacks the sixth transmembrane region of the potassium channel. The high intronic signal seen in this region of Shab is due to the presence of a gene in this region on the opposite strand.
Figure 5
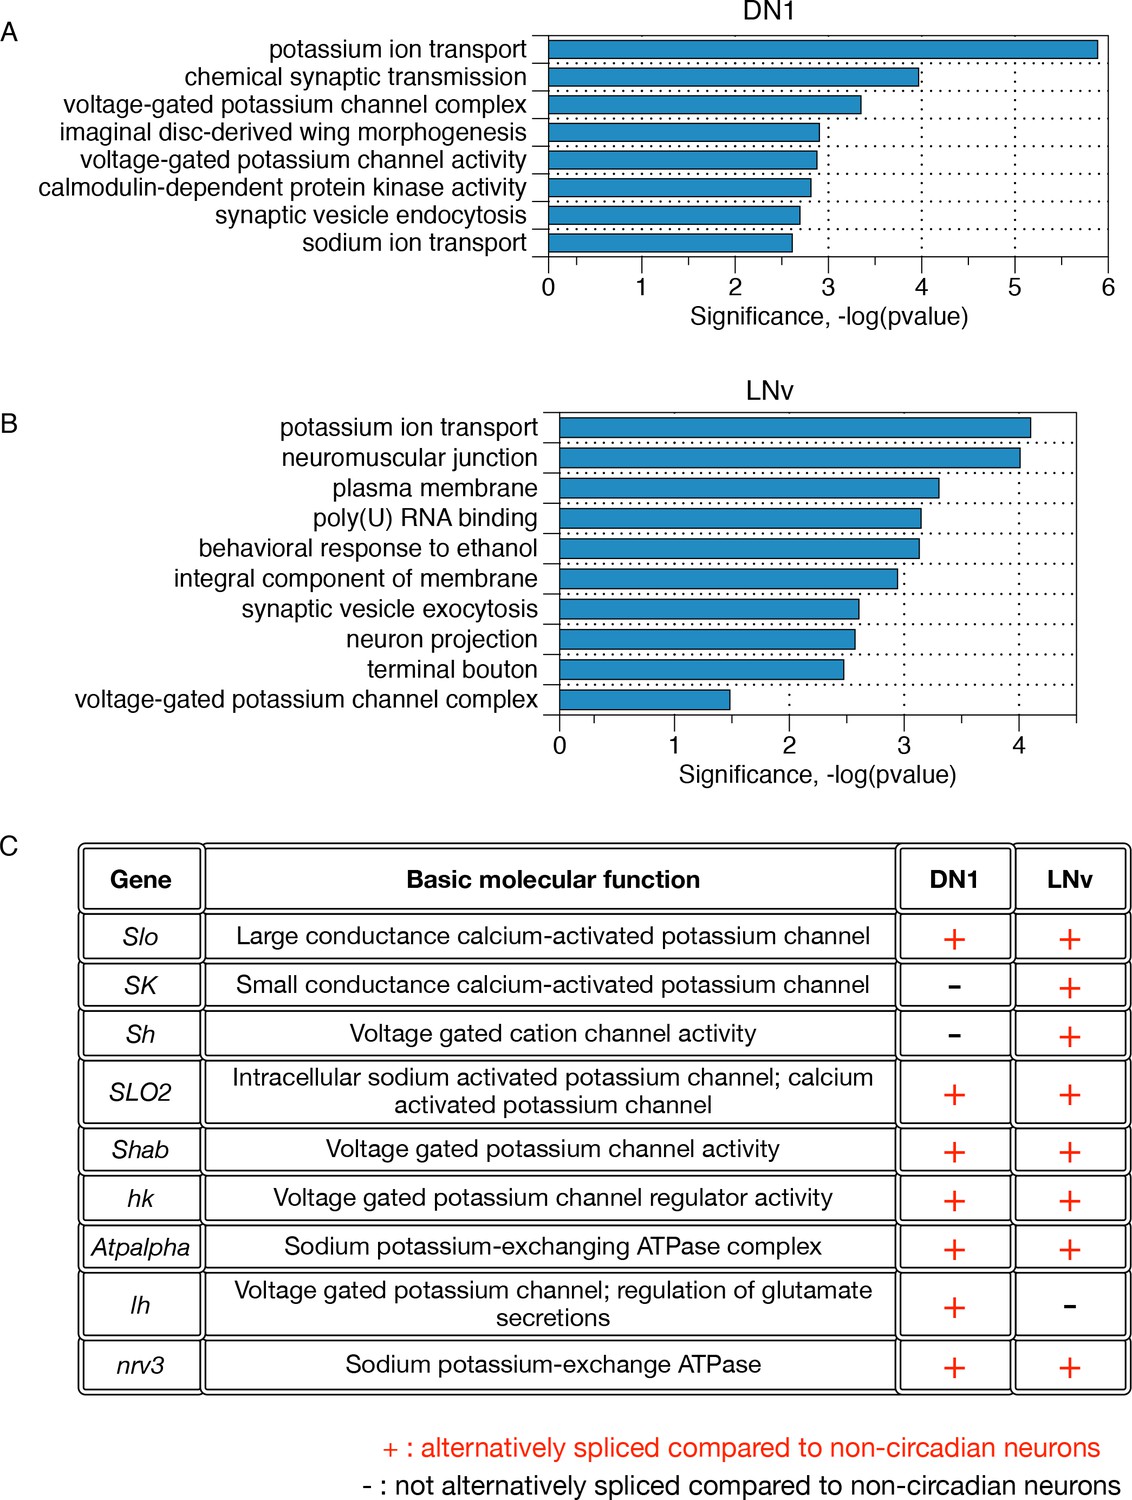
Differentially alternatively spliced transcripts in LNvs and DN1s compared to non-circadian neurons reflect specific neuronal functions.
(A) Gene ontology analysis of those transcripts that undergo differential alternative splicing in DN1s reveals enrichments in potassium ion transport, calmodulin-dependent protein kinases, and synaptic vesicle endocytosis. (B) Gene Ontology (GO) analysis of those transcripts that undergo differential alternative splicing in LNvs reveals enrichments in potassium ion transport, synaptic vesicle exocytosis, neuron projections and terminal boutons. (C) Many differentially spliced transcripts in circadian neurons encode proteins involved in potassium ion transport, including six different classes of potassium channels as well as two sodium-potassium-exchanging ATPases.
Figure 6 with 3 supplements
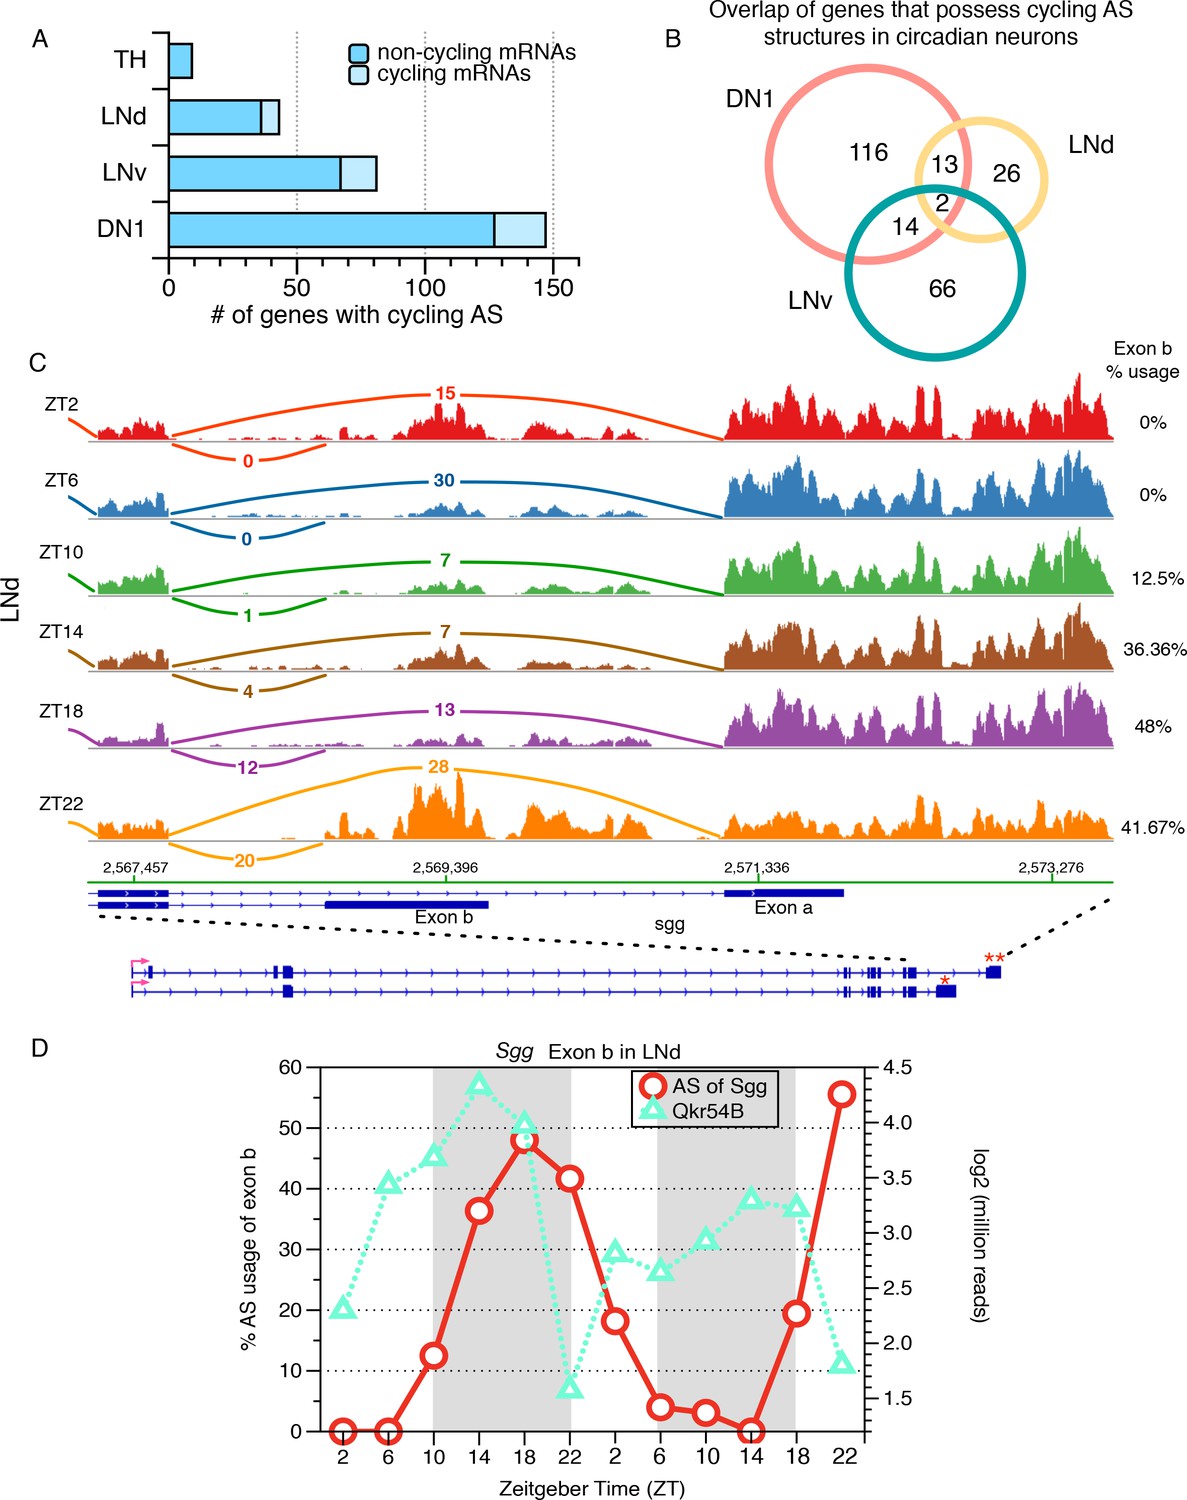
Identification of cycling alternative splicing in Drosophila circadian neurons.
To identify cycling time-of-day changes in alternative splicing, the frequency at which each sub-AS-junction is utilized in every profiled AS structure was examined across six timepoints taken at four hour intervals throughout the day. Two independent six-timepoint-datasets were examined. (A) The distribution of the number of genes with cycling AS structures identified in each neuronal group. The majority of the cycling AS structures identified occur in non-cycling mRNAs (dark blue). As a non-circadian neuronal group, the number of genes with cycling AS identified in TH neurons serves as a negative control and estimate of false positives of the analysis. (B) Overlap of genes with cycling AS structures across the three circadian neuron subtypes. Most cycling AS structures are neuron specific; only two transcripts undergo cycling AS in all three groups of circadian neurons. (C) Sashimi plots highlight RNA-seq signal at the 3’-end of the gene encoding the circadian kinase, Shaggy (Sgg). The architecture of the Sgg gene is shown below; the red arrow indicates the direction of transcription. Time of day is indicated by Zeitgeber time (ZT) on the left side of the figure; ZT0 is the beginning of 12 hr of lights-on and ZT12 is the beginning of 12 hr of lights-off. The transcript of the circadian kinase, Shaggy (sgg), undergoes time-of-day oscillations in alternative splicing at the 3’-end of the transcript in LNd neurons. In early morning (ZT2/ZT6), terminal exon a (marked by ‘**’) is preferred, generating a slightly longer protein isoform. In the night (ZT18/22), splicing shifts to utilize terminal exon b (marked by ‘*’) that generates a shorter protein isoform with different C-terminus. (D) The frequency at which the shorter protein isoform of Sgg (with exon b) is generated is graphed throughout the day for two independent days, over two independent set of 6-timepoints in red circles, following the y axis on the left. The time-of-day dependent expression levels of the cycling Qkr54B transcript is shown using green triangles, following the y axis on the right. Qkr54B is a predicted regulator of Sgg transcripts determined by publically available RIP-seq experiments (Stoiber et al., 2015).
-
Figure 6—source data 1
Cycling AS events in DN1, LNd, LNv and TH neurons.
- https://doi.org/10.7554/eLife.35618.027
Figure 6—figure supplement 1

Predominant inclusion of exon a of the Sgg transcript in LNv and DN1 neurons.
The frequency of inclusion of exon b of the Sgg transcript in LNv (blue) and DN1 (red) neurons is shown. Low levels of exon b inclusion are found throughout the day. The x-axis shows Zeitgeber time (ZT). ZT0 denotes lights on and ZT12 denotes lights off.
Figure 6—figure supplement 2
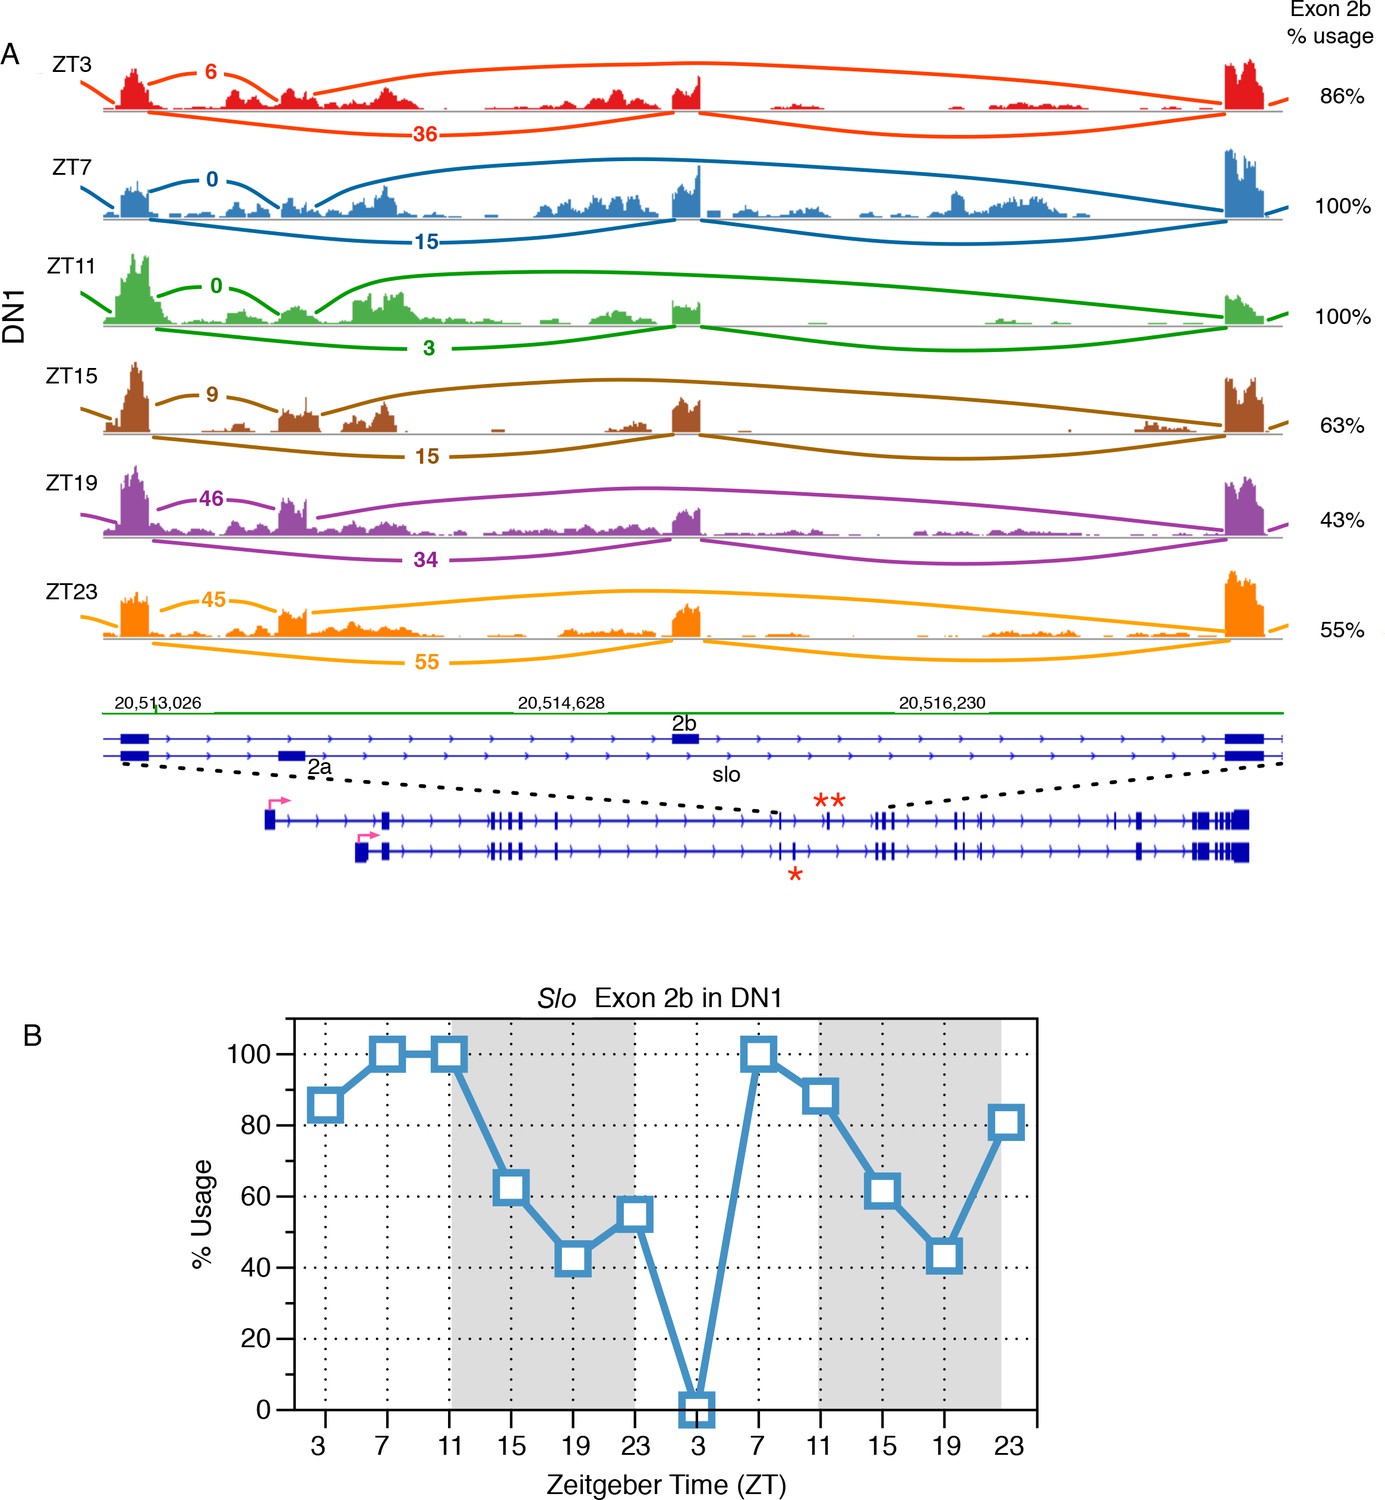
Identification of slo transcripts that exhibit cycling alternative splicing in Drosophila circadian neurons.
(A) Slowpoke (Slo) undergoes cycling alternative splicing in DN1 neurons. Sashimi plots highlight RNA-seq signals within the region of Slo that where exons 2a (marked by ‘*’) and exon 2b (marked by ‘**’) are mutually exclusively included. The architecture of the Slo gene is shown below; the red arrow indicates the direction of transcription. Time of day is indicated by Zeitgeber time (ZT) on the left side of the figure; ZT0 is the beginning of 12 hr of lights-on and ZT12 is the beginning of 12 hr of lights-off. In the morning, exon 2b of the Slo transcript is preferentially used then during the night there is a shift to the inclusion of exon 2a instead. (B) The slowpoke (slo) channel shows time-of-day dependent variation in the usage of exon 2a and 2b in DN1 neurons. Exon 2b is primarily included in the morning and then its usage drops in the night as splicing switches to include exon 2a instead.
Figure 6—figure supplement 3
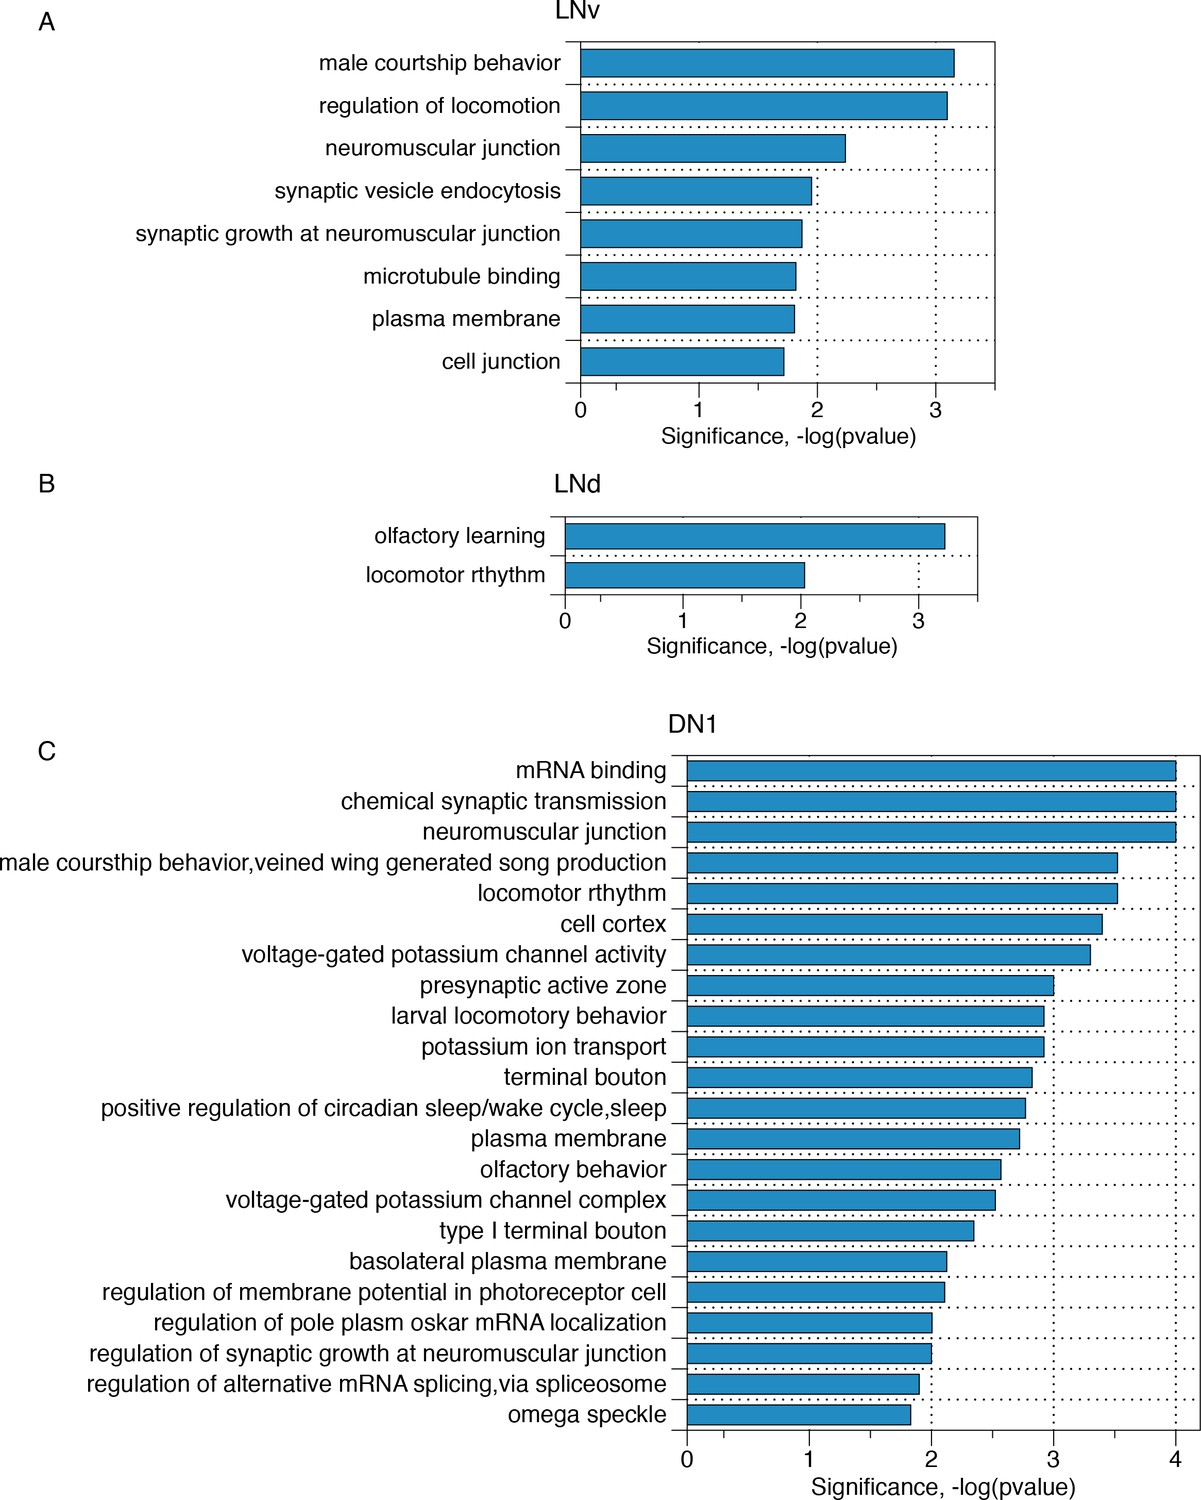
Transcripts with neuron subgroup-specific cycling AS structures reflect crucial neuronal functions.
Gene ontology analyses of those transcripts that have neuron subgroup-specific cycling AS structures for (A) LNv neurons, (B) LNd neurons, (C) DN1 neurons, respectively.
Figure 7 with 1 supplement
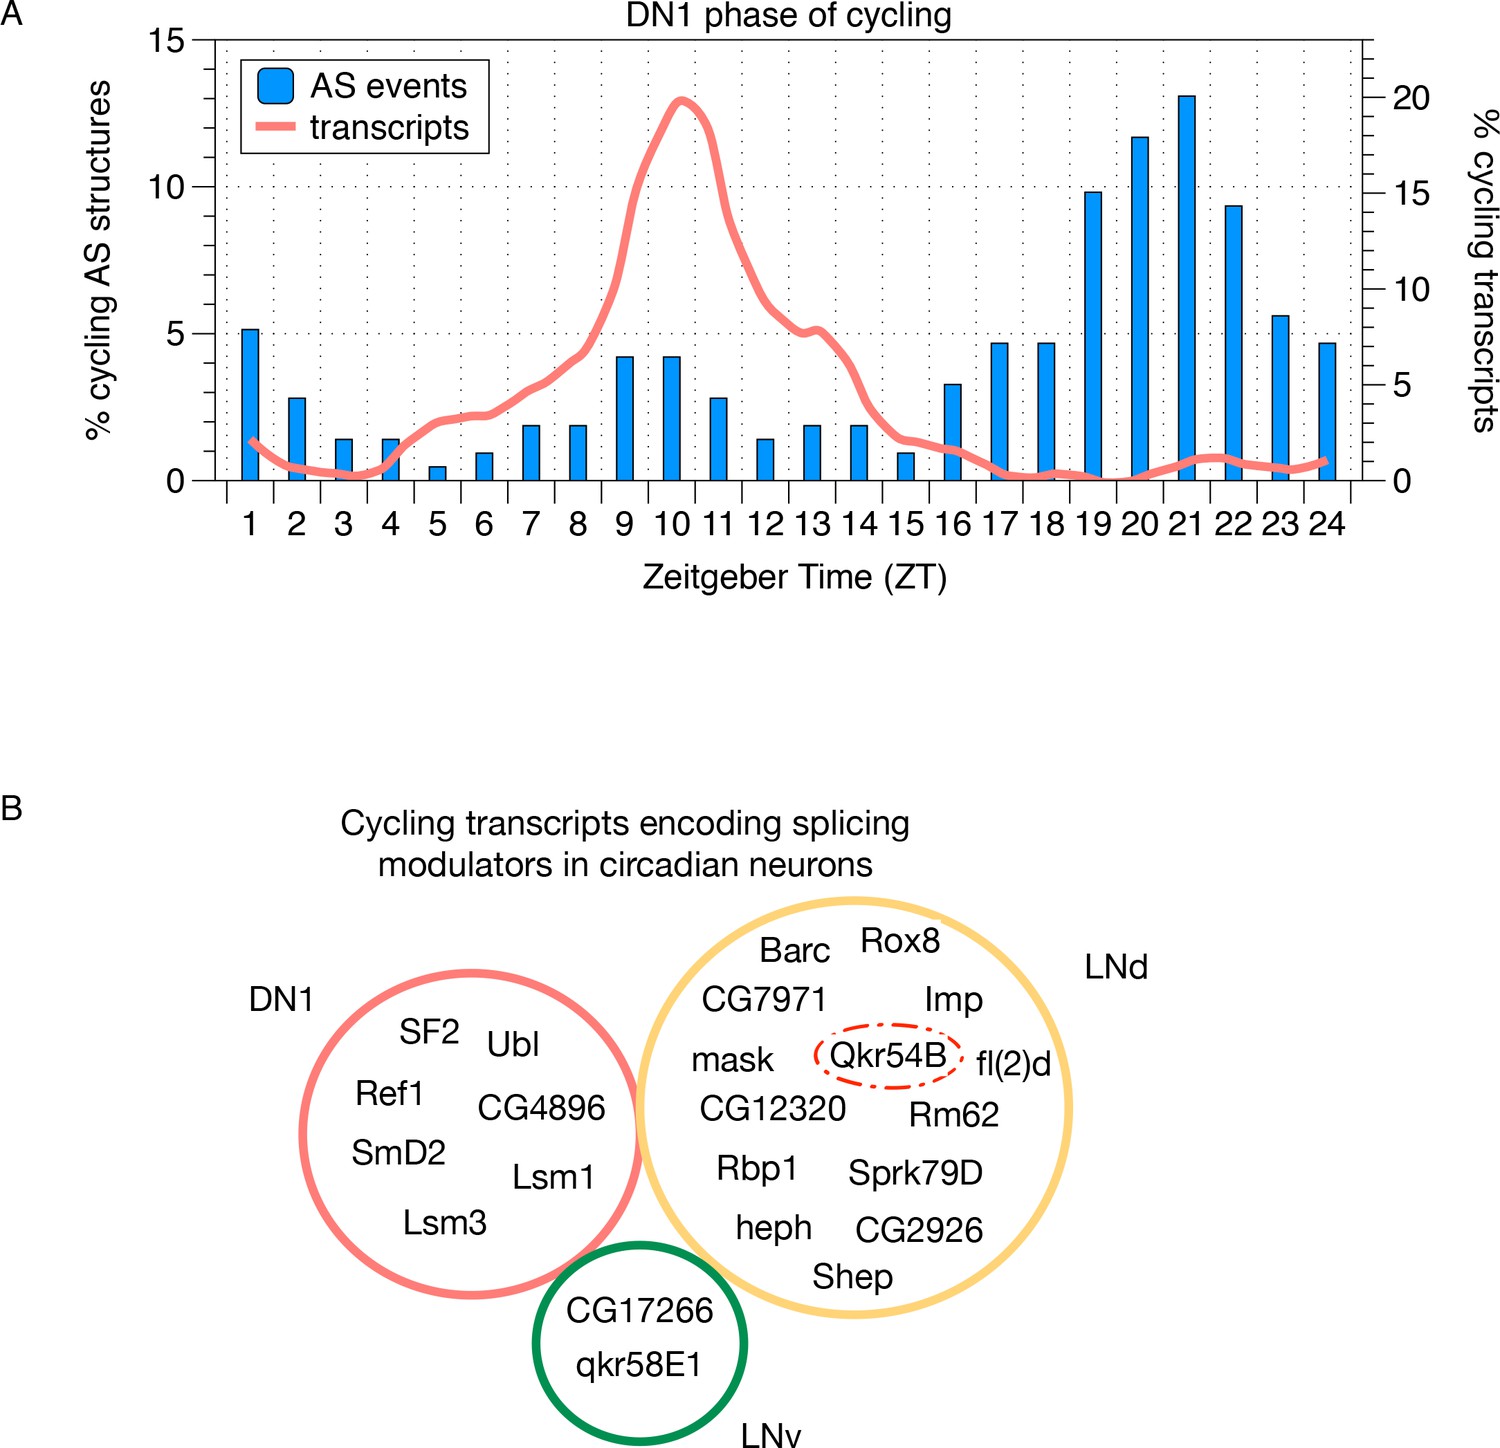
Cycling alternative splicing and mRNA expression in Drosophila circadian neurons.
(A) The phase distribution of cycling AS structures in DN1 neurons is plotted as a histogram (blue) with the phase distribution of all cycling transcripts in DN1 neurons overlaid (orange). In DN1s, most cycling transcripts are at their highest level at mid-morning. In contrast, cycling AS structures are most abundant in the late night. (B) Cycling transcripts that encode RBPs that act as splicing modulators were identified. The Venn graph shows the overlap of these cycling RBPs in each of the circadian neuron subpopulations. Every circadian neuron expresses a unique set of cycling RBPs. Qkr54B (red dashed circle) is known to target the Sgg transcripts (Stoiber et al., 2015) that present cycling AS patterns in LNd neurons.
Figure 7—figure supplement 1
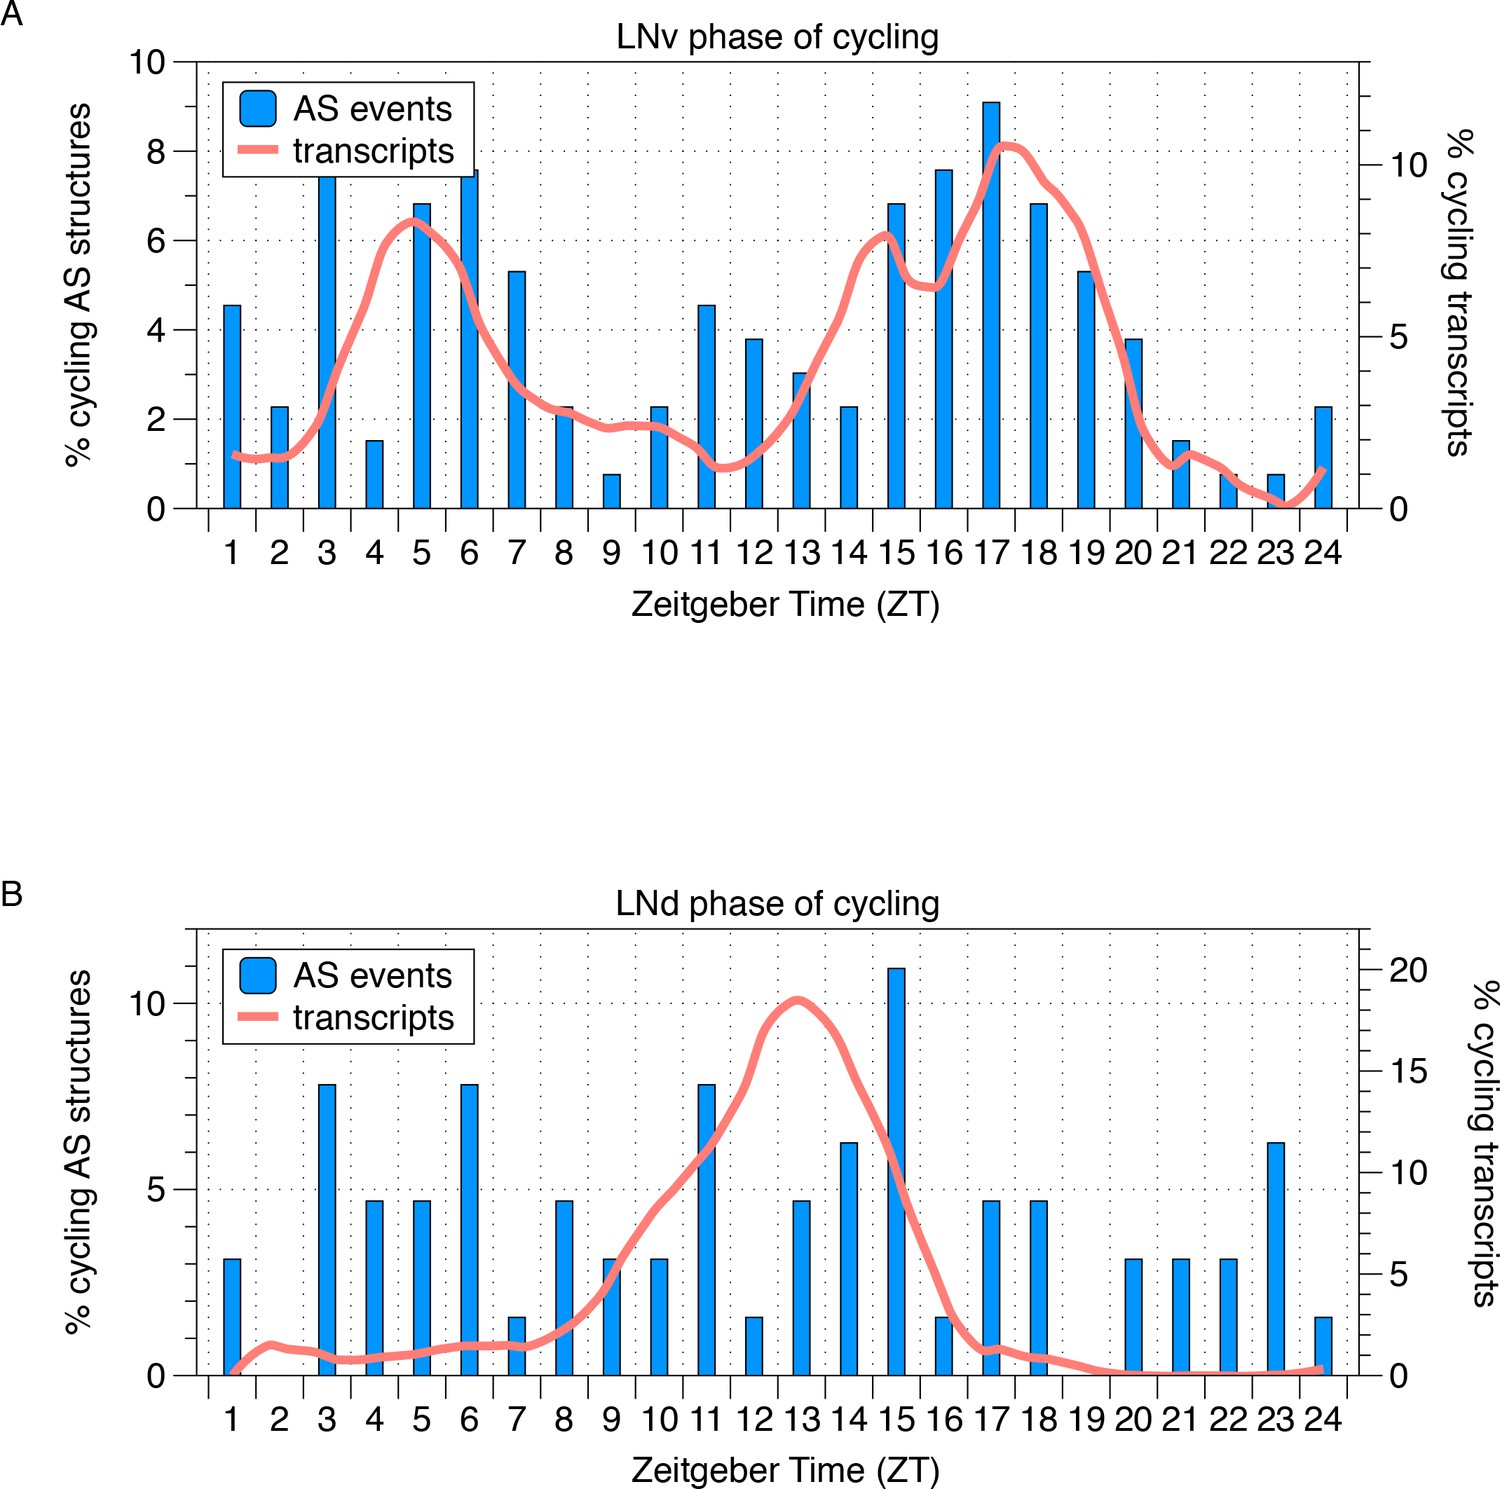
Phase distribution of cycling AS structures in LNvs and LNds.
The phase distribution of cycling AS structures in LNv and LNd neurons is plotted as a histogram (blue) with the phase distribution of all cycling transcripts overlaid (orange). In LNvs, cycling transcripts and cycling AS structures show a bimodal phase distribution in the mid-morning and mid-night. In LNds, cycling transcripts peak midday and cycling AS structures peak throughout the day.
Tables
Key resources table
Additional files
-
Supplementary file 1
The distribution of splice site type (including reverse strand) in the AS junctions detected in each neuron group/sample.
The distribution of splice site type in the AS junctions (including reverse strand) detected in each neuron group/sample that are within a gene.
- https://doi.org/10.7554/eLife.35618.030
-
Supplementary file 2
Gene ontology analyses of those transcripts that present neuron subgroup specific novel ALT junctions that are not found in whole head samples for each neuron subpopulation.
- https://doi.org/10.7554/eLife.35618.031
-
Supplementary file 3
Gene ontology analyses of those transcripts that present neuron subgroup specific cycling AS structures.
- https://doi.org/10.7554/eLife.35618.032
-
Supplementary file 4
Mapping statistics of the neuronal RNA-seq data to the Drosophila genome (dm3).
- https://doi.org/10.7554/eLife.35618.033
-
Supplementary file 5
Commands for STAR mapping.
- https://doi.org/10.7554/eLife.35618.034
-
Transparent reporting form
- https://doi.org/10.7554/eLife.35618.035
Download links
A two-part list of links to download the article, or parts of the article, in various formats.
Downloads (link to download the article as PDF)
Open citations (links to open the citations from this article in various online reference manager services)
Cite this article (links to download the citations from this article in formats compatible with various reference manager tools)
Striking circadian neuron diversity and cycling of Drosophila alternative splicing
eLife 7:e35618.
https://doi.org/10.7554/eLife.35618


