Specific Eph receptor-cytoplasmic effector signaling mediated by SAM–SAM domain interactions
- Shenzhen Peking University-The Hong Kong University of Science and Technology Medical Center, China
- Hong Kong University of Science and Technology, China
Figures
Figure 1
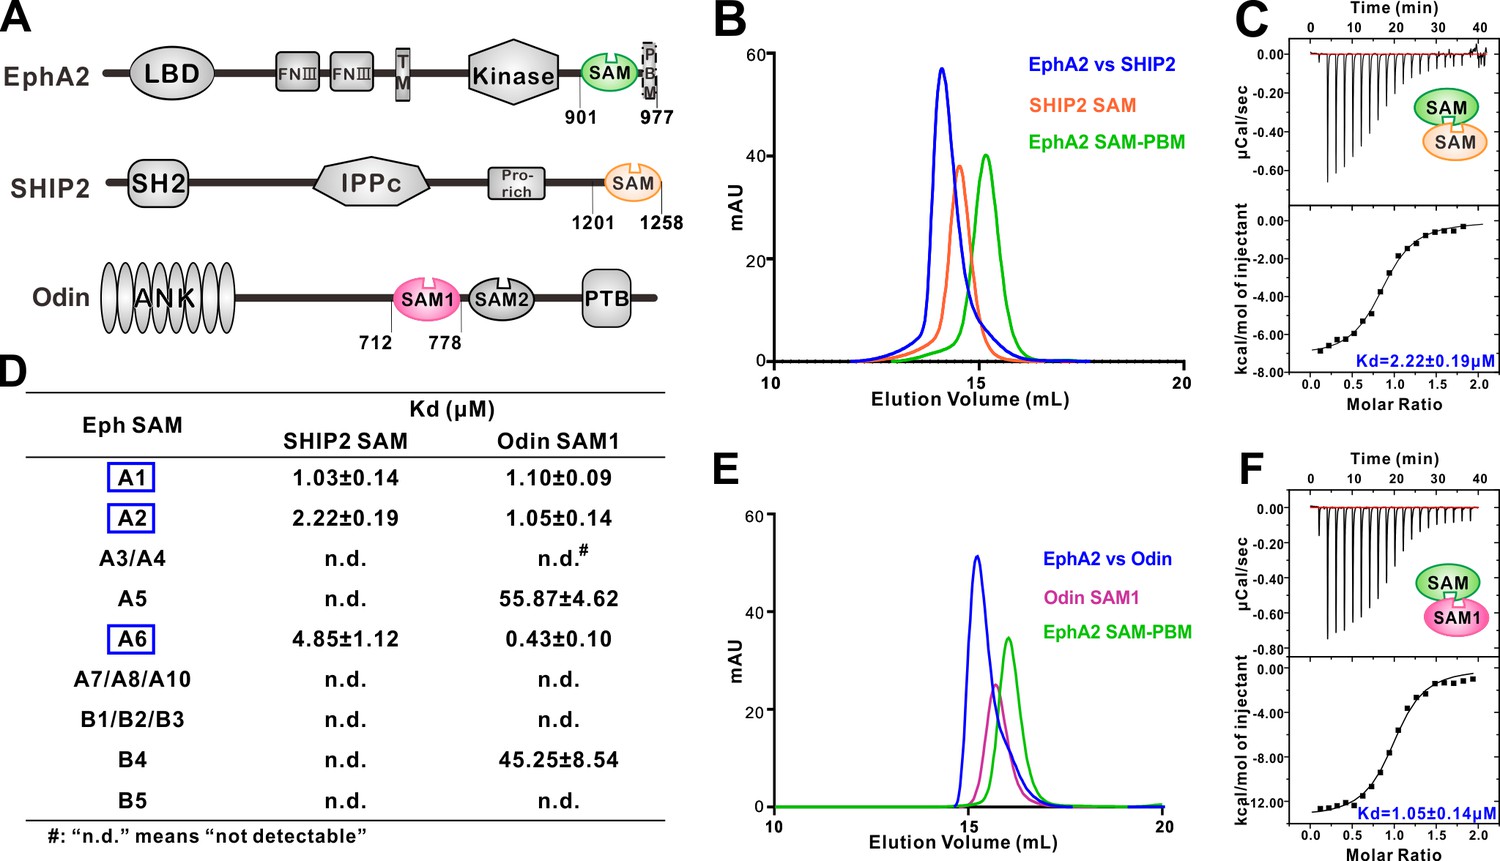
Several EphA SAM domains specifically bind to SHIP2 SAM or Odin SAM.
(A) Schematic diagrams showing the domain organizations of EphA2, SHIP2 and Odin. (B–C) Analytical gel-filtration chromatography (B) and ITC-based measurements (C) showing the interaction between EphA2 SAM and SHIP2 SAM. (D) Summary of the dissociation constants between Eph SAMs and SHIP2/Odin SAMs. All binding affinities were derived from ITC-based assays. (E–F) Analytical gel-filtration chromatography (E) and ITC-based measurements (F) of the binding of EphA2 SAM to Odin SAM.
Figure 2 with 5 supplements
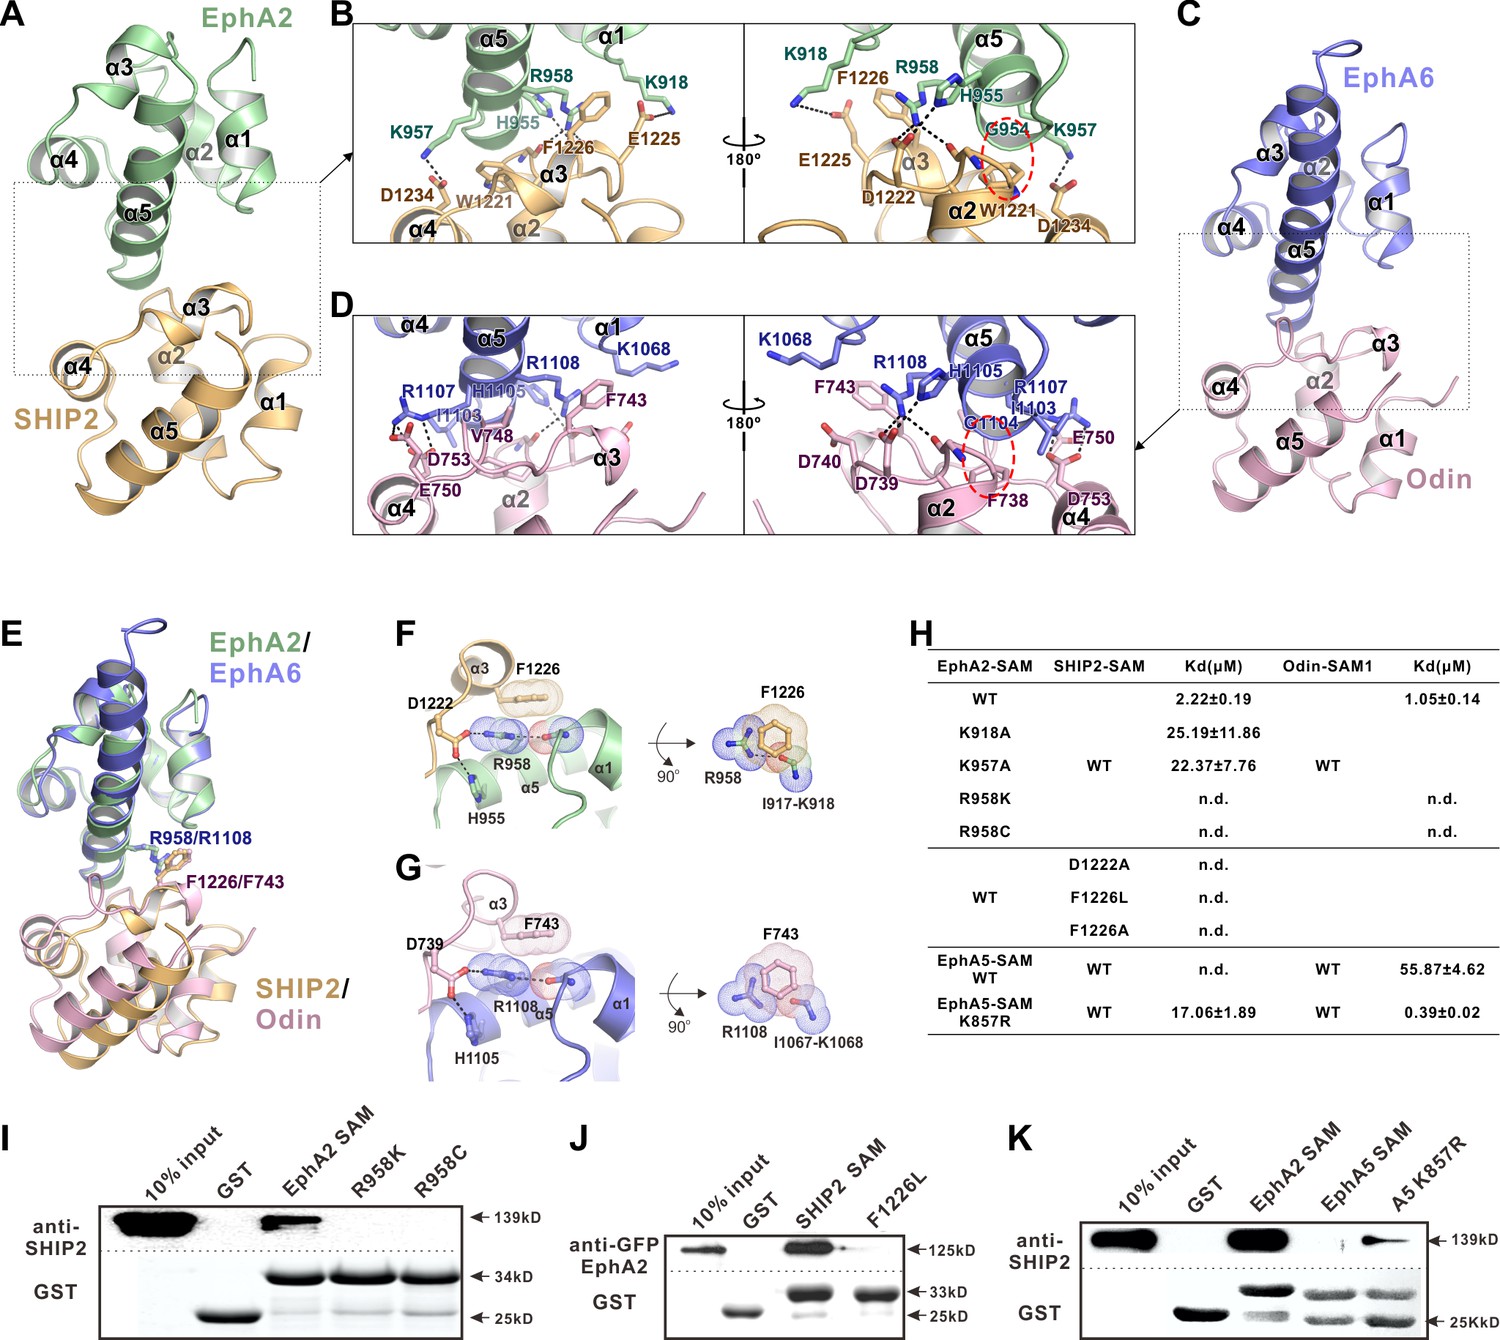
The detailed interactions governing the formation of the EphA2 SAM-SHIP2 SAM and the EphA6 SAM-Odin SAM1 complexes.
(A and C) Ribbon representations of the EphA2 SAM-SHIP2 SAM (A) and the EphA6 SAM-Odin SAM1 (C) complex structures. (B and D) Details of the interfaces in the EphA2 SAM-SHIP2 SAM (B) and EphA6 SAM-Odin SAM1 (D) complexes. Key residues are shown with the stick model. Salt bridges and hydrogen bonds are indicated with dashed lines. The Gly-aromatic residue pairs (Gly954A2/Gly1104A6 and Trp1221SHIP2/Phe738Odin) are indicated with red dashed circles. (E) Superposition of two the EphA2 SAM-SHIP2 SAM and the EphA6 SAM-Odin SAM1 complex structures with the critical R958/F1226 and R1108/F743 pairs highlighted with the stick model. (F–G) Details of the planar cation-π interaction between EphA2 R958 and SHIP2 F1226 (F), and EphA6 R1108 and Odin F743 (G). Note the planar alignment of the π electrons of the Arg sidechain and the neighboring peptide backbones in both structures. (H) Summary of the ITC-derived results showing that the mutations of the critical residues in the SAM domain interface can dramatically affect the bindings of EphA SAMs to the SAM domains from SHIP2 or Odin. (I) The Bindings of EphA2 SAM or its various mutants to the full-length SHIP2 by the GST pull-down assay. (J) The bindings of SHIP2 SAM or its F1226L-mutant to the full-length WT GFP-EphA2 analyzed by the GST pull-down assay. (K) GST pull-down assay showing that the K857R mutant of EphA5 SAM gained its binding to SHIP2.
Figure 2—figure supplement 1
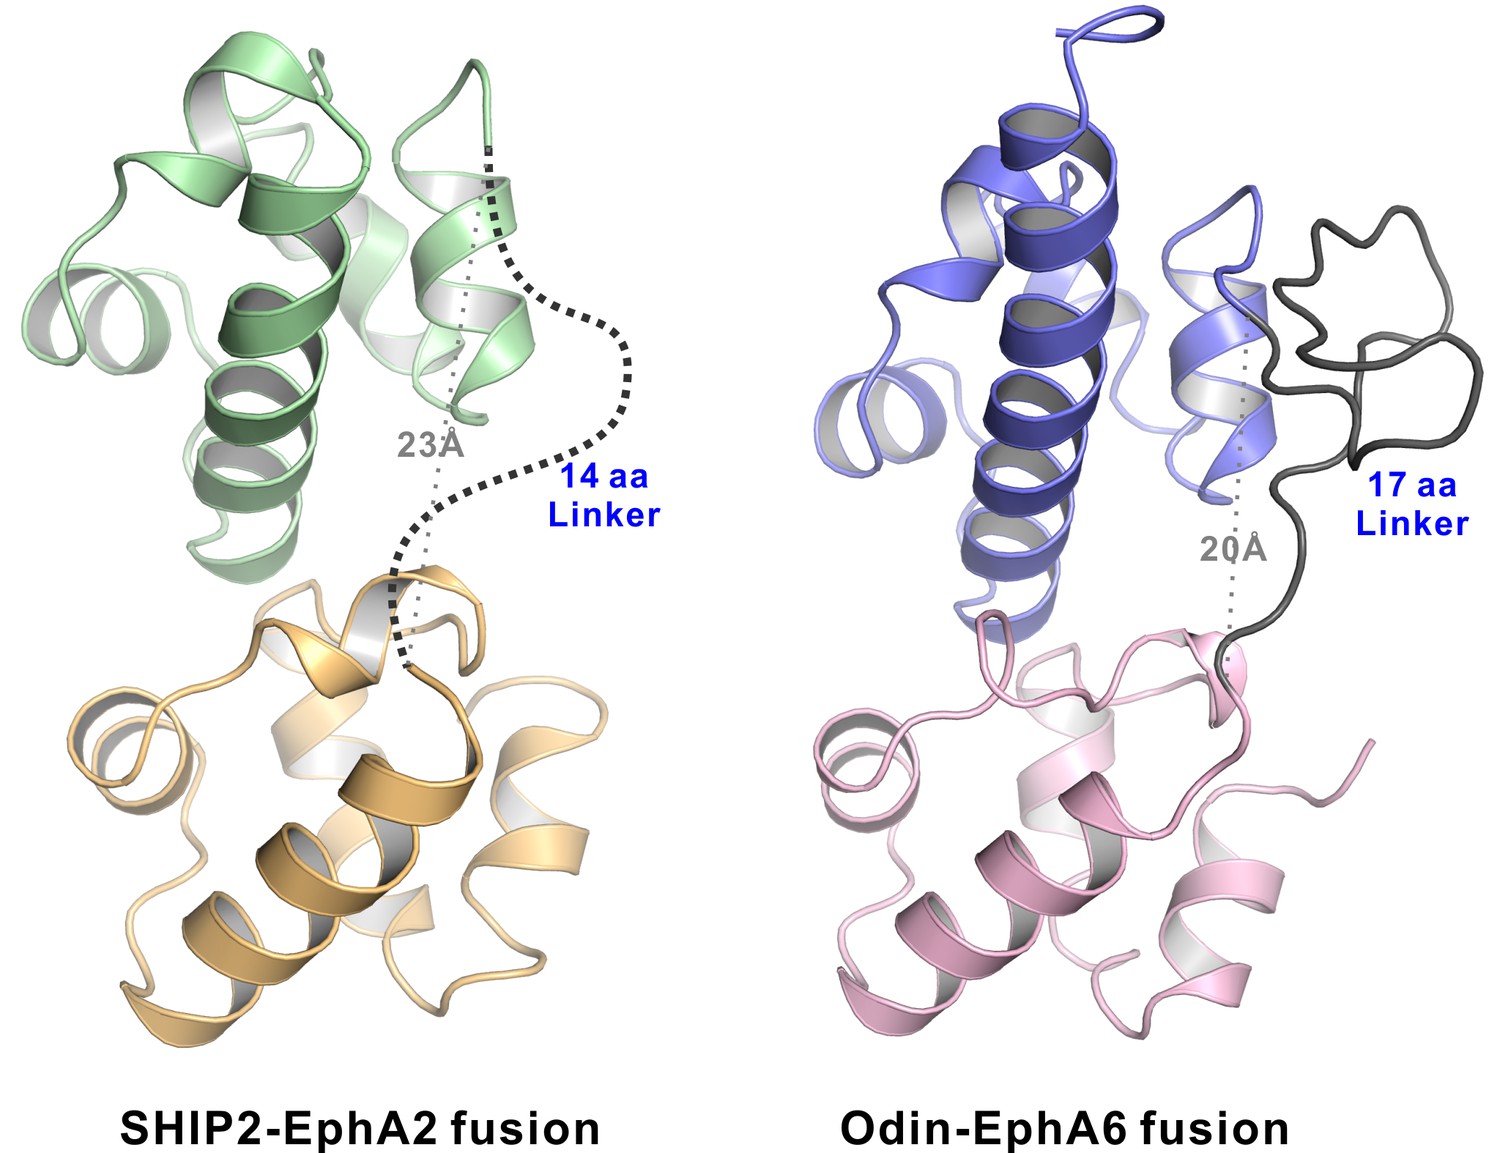
The structures of the EphA2-SHIP2 and EphA6-Odin SAM–SAM complexes showing the linkers used to connect the SAM domains in both structures are sufficiently long and flexible.
Ribbon diagram of the SHIP2 SAM-EphA2 SAM (left) and Odin SAM1-EphA6 SAM (right) structures. The 14-residue fusion linker is not defined in the electron density map in the SHIP2 SAM-EphA2 SAM structure and shown as the dashed line. The 17-residue fusion linker is well defined and stabilized by crystal packing in the Odin SAM1-EphA6 SAM structure. The grey dotted lines show the distances between the C-terminus of SHIP2 SAM or Odin SAM1 and the corresponding Eph SAM N-terminus is ~ 23 Å and ~ 20 Å, respectively.
Figure 2—figure supplement 2

The key Arg958A2/Phe1226SHIP2 cation-π interaction was not resolved in the previous NMR study.
(A) Overall structure of an earlier NMR-derived EphA2 SAM/SHIP2 SAM heterodimer shown at the same view as our crystal structure in Figure 2A. (B) The Arg958A2/Phe1226SHIP2 cation-π interaction revealed in our study was not defined in the NMR experiments as shown by four representative structures from the ensemble deposited.
Figure 2—figure supplement 3
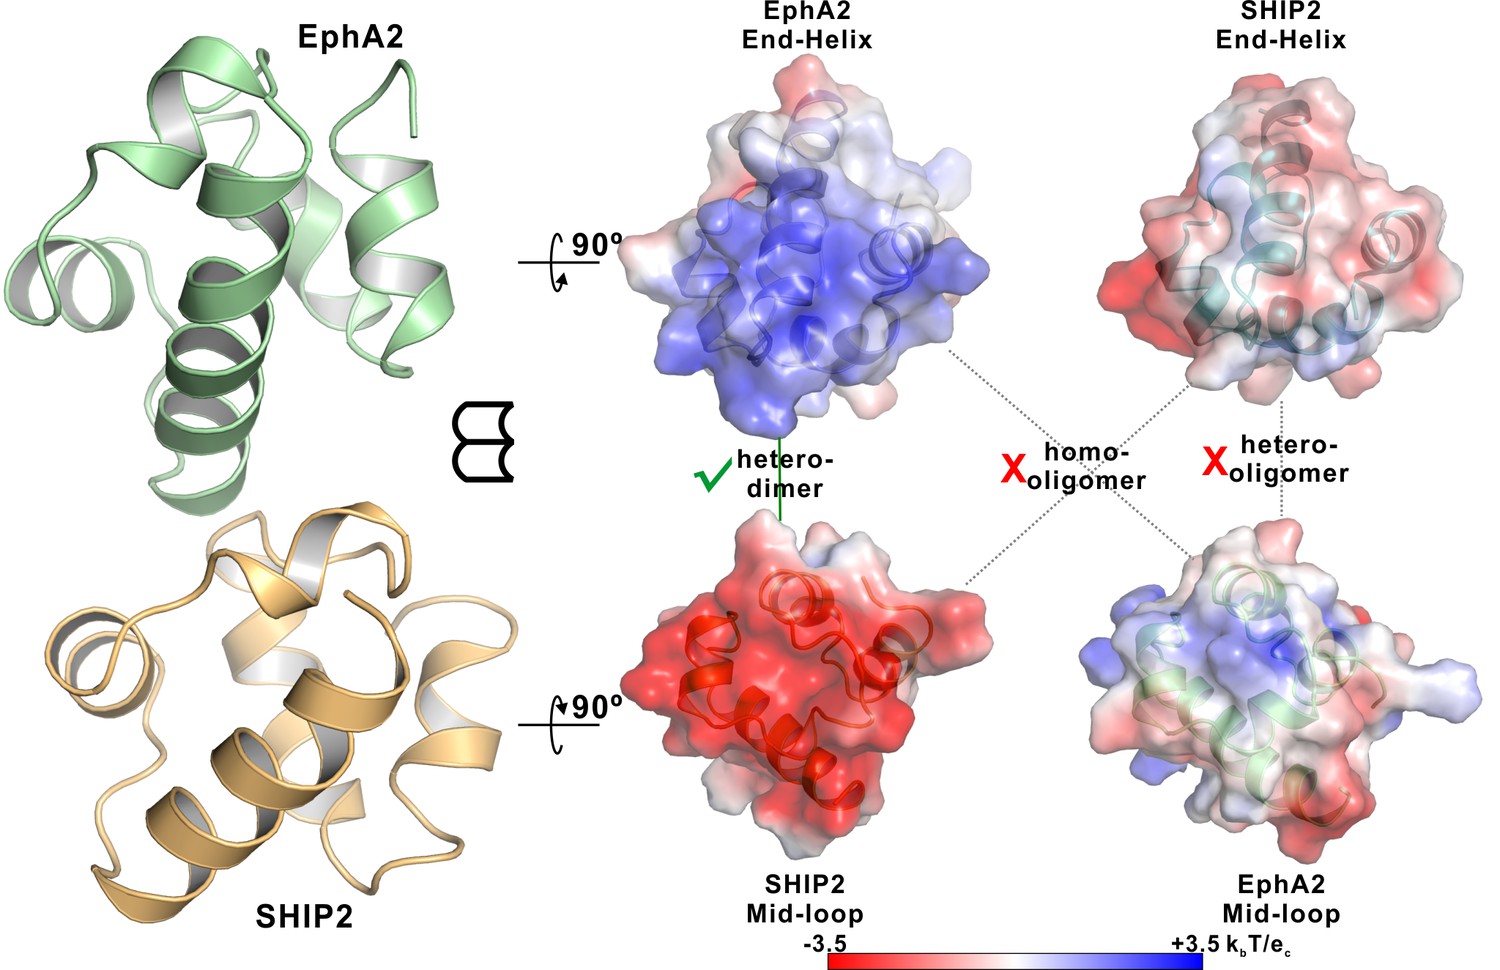
Neither EphA2 nor SHIP2 SAM can form homo-oligomers or polymerize into hetero-oligomers.
Open-book views of the surfaces of the EphA2/SHIP2 SAM–SAM interfaces showing the charge complementation. The corresponding End-Helix surface of SHIP2 is not positively charged compared with the End-Helix surface of EphA2 SAM and the corresponding Mid-Loop surface of EphA2 is not negatively charged compared with the Mid-Loop surface of SHIP2 SAM. The surface electrostatic potentials were calculated by APBS and contoured at 3.5 kBT/eC.
Figure 2—figure supplement 4
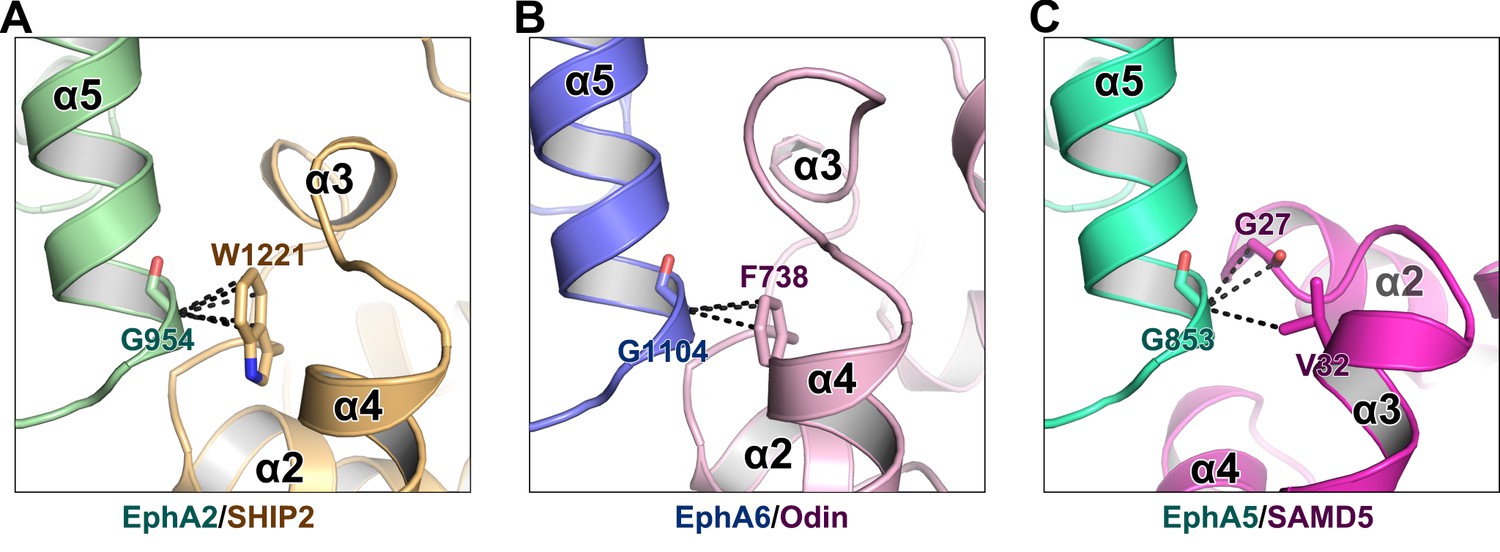
The critical role of Gly at the beginning of α5 from Eph SAM in SAM–SAM interactions.
The backbone methylene of a Gly residue at the beginning of α5 from Eph SAM (Gly954A2/Gly1104A6) is in close contact with an aromatic residue from SHIP2/Odin SAM (Trp1221SHIP2/Phe738Odin) (A and B). In the EphA5/SAMD5 complex, Gly853 is in close contact with G27SAMD5 backbone and V32SAMD5 sidechain (C). The black dashed lines indicate the distances between two atoms are within 4 Å.
Figure 2—figure supplement 5
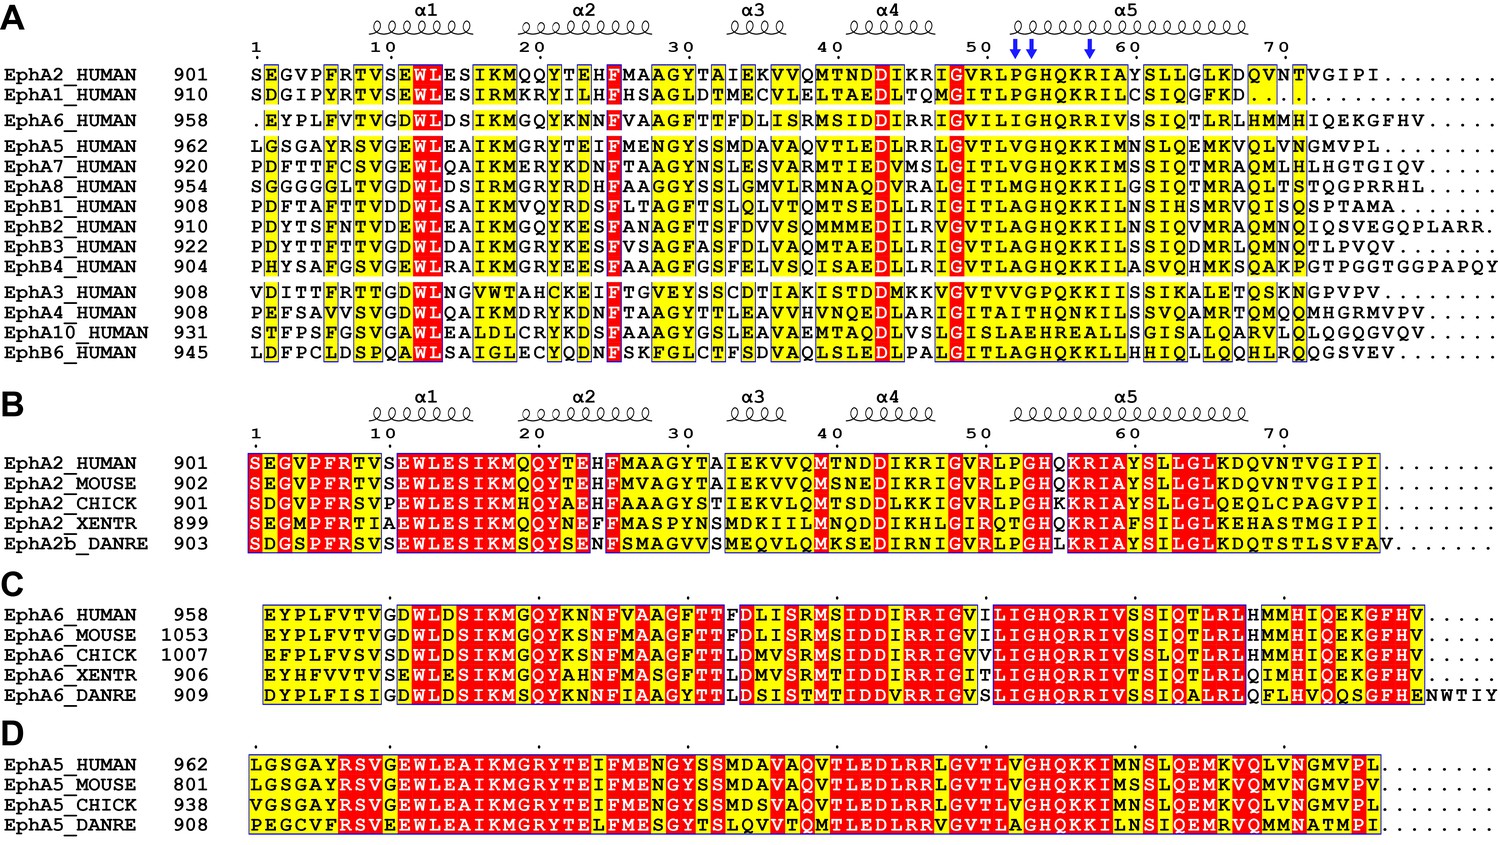
Sequence alignments of Eph SAM domains among different family members or across species.
Sequence alignments of all human Eph SAM domains (A) and members of EphA2 (B), EphA6 (C) and EphA5 (D) from 4 to 5 representative vertebrate species. The secondary structure elements are labeled according to the EphA2 SAM structure. Residues that are identical and highly similar are indicated in red and yellow boxes, respectively. The critical residues for Eph SAM interaction specificity described in the manuscript are indicated with blue arrows.
Figure 3 with 2 supplements
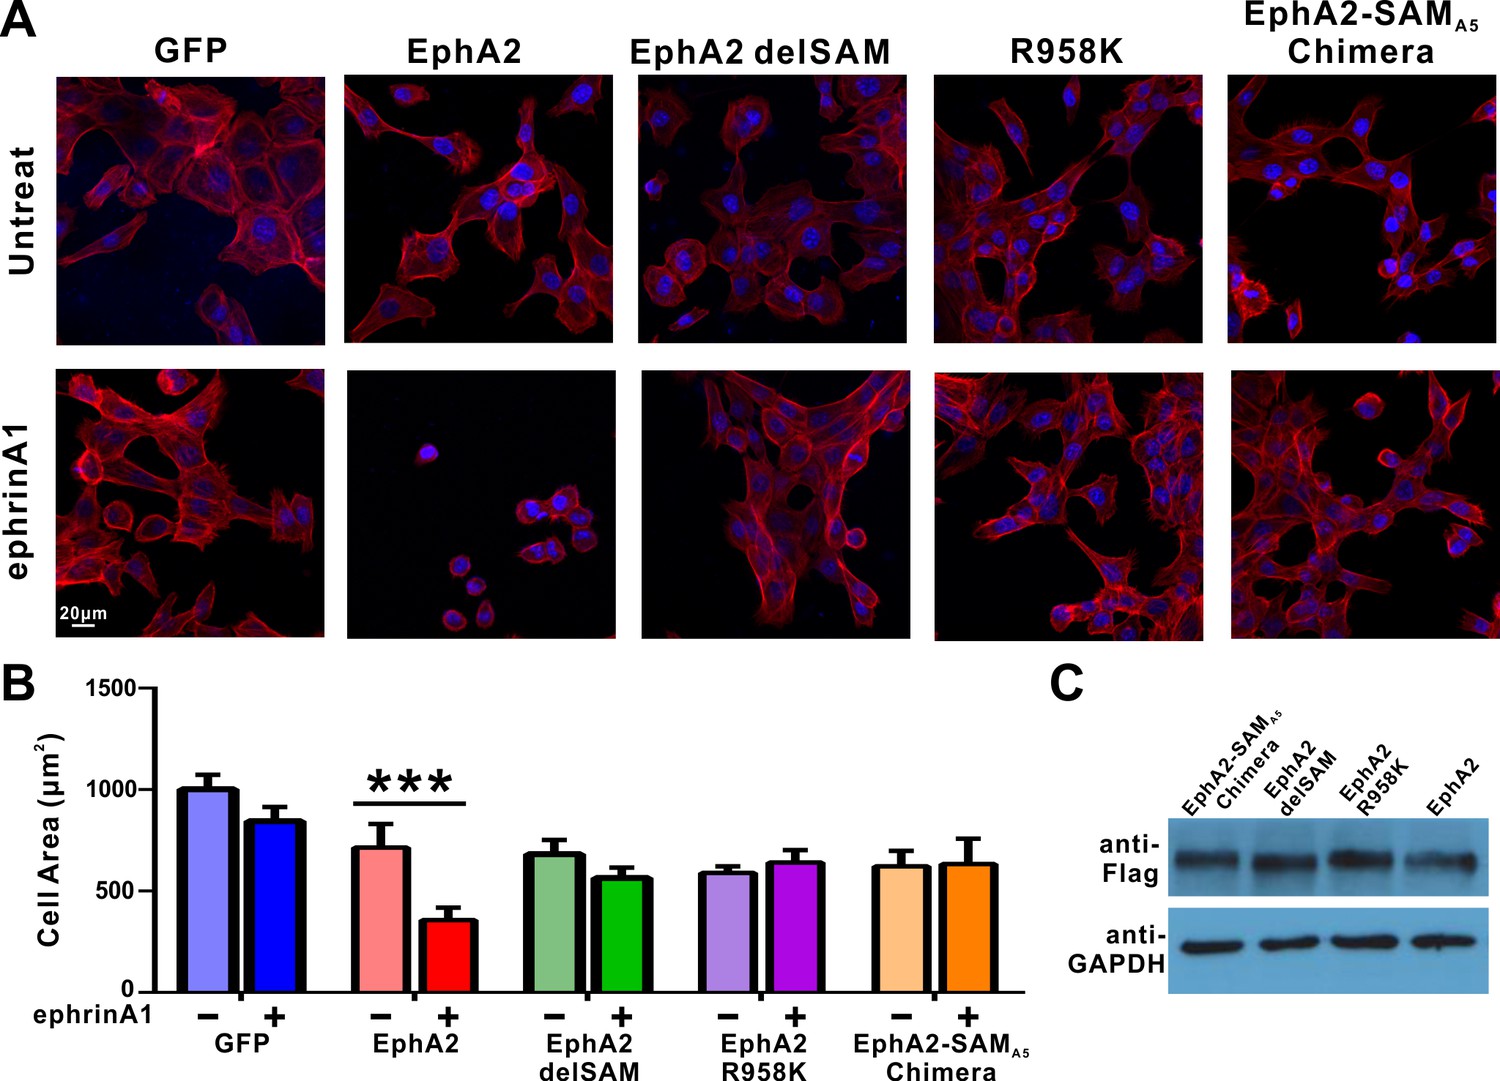
Impacts of the mutations in SAM domain of EphA2 on the RTK’s function in cell spreading in DU145 cells.
(A) Selected images showing the morphologies of DU145 cells expressing the wild-type or various mutants of EphA2 before and after ephrin A1-Fc treated. Cells were stained for F-actin with fluorescent phallodin (red), and nuclei were labelled with DAPI (blue). (B) Quantification of the cell areas of DU145 cells expressing various constructs. Data represents the mean ±SEM from four independent experiments with each experiment of at least 400 cells (***, p<0.001 by Two-way ANOVA with multiple comparisons test). (C) Western blot analysis showing the expression levels of different EphA2 (anti-Flag) constructs.
Figure 3—figure supplement 1
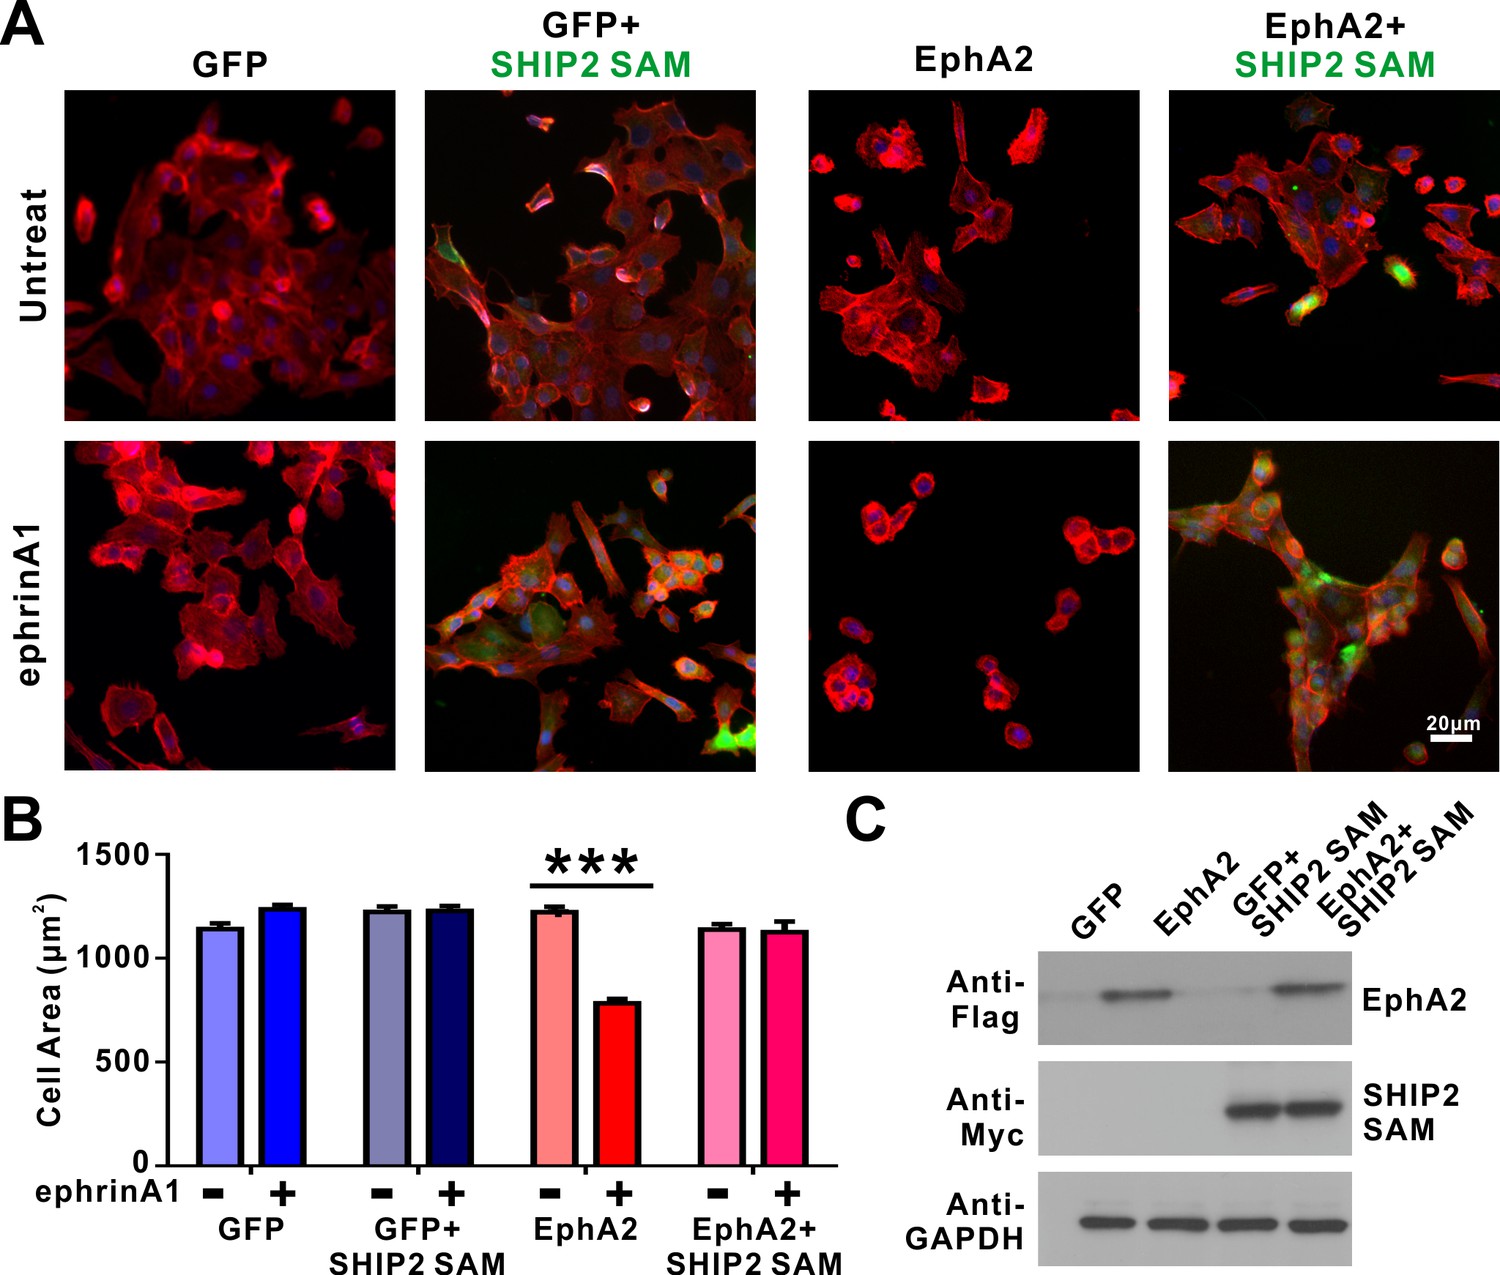
SHIP2-SAM effectively blocks the ephrinA1/EphA2-induced cell retraction.
(A) Selected images showing the morphologies of DU145 cells infected with lenti-virus expressing EphA2 or the GFP control, with or without SHIP2-SAM co-expression. These cells were further divided into two groups, with or without ephrin A1-Fc treatment. SHIP2-SAM was detected by antibody against Myc-tag (green). Cells were stained for F-actin with fluorescent phalloidin (red) and nuclei were labeled with DAPI (blue). (B) Quantification of the cell sizes of DU145 cells expressing various proteins. Data represent the mean ± SEM from four independent experiments with each experiment of at least 500 cells (***, p<0.001 by Two-way ANOVA with multiple comparisons test). (C) Western blot analysis showing the expression levels of EphA2 (anti-Flag) and SHIP2-SAM (anti-Myc) in transfected cells in each group. GAPDH serves as the loading control.
Figure 3—figure supplement 2
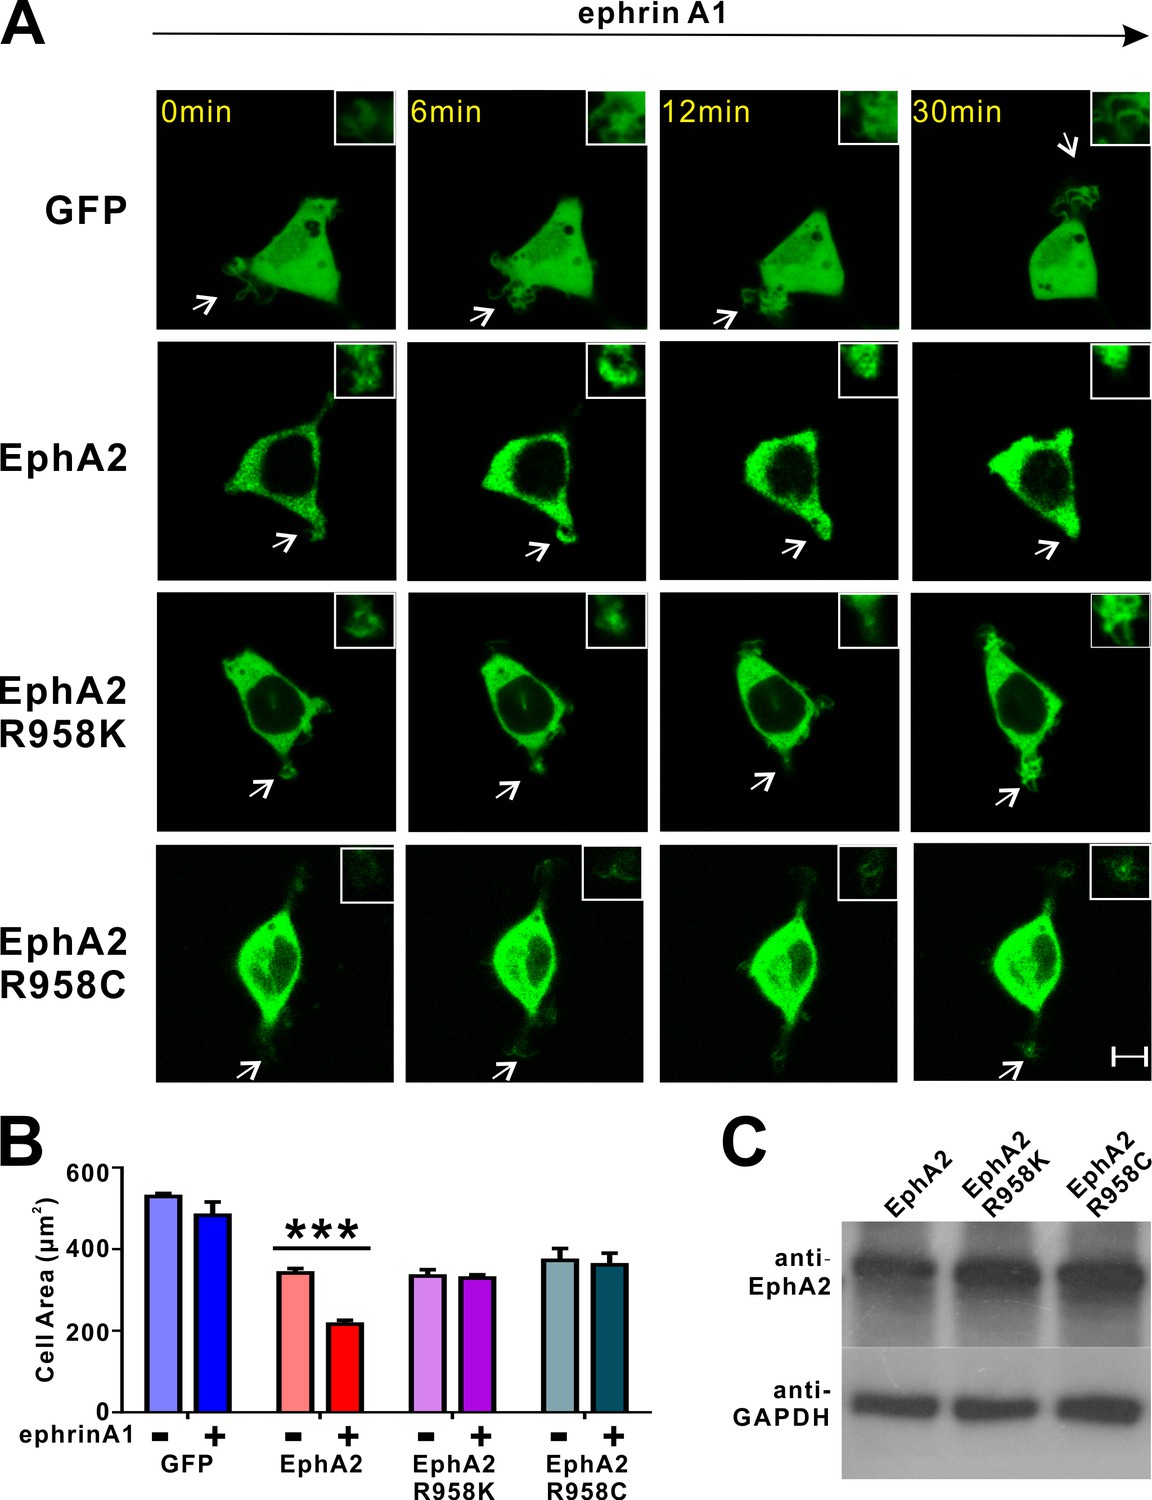
Impacts of the mutations in SAM domain of EphA2 on the RTK’s function in cell spreading in HEK293T cells.
(A) Representative images of cells expressing different EphA2 constructs before and after ephrin A1-Fc treatment at different time points. Retraction of processes (exampled by an arrow in each image and enlarged in the insert) only observed in ephrin A1-Fc treated HEK293T cells expressing WT full-length GFP-EphA2. In contrast, no retractions were observed in cells expressing EphA2 R958K, EphA2 R958C or the GFP control. (B) Quantification of the cell areas of HEK293T cells expressing various constructs. Data represent the mean ± SEM from four independent experiments with each experiment of at least 500 cells. (***, p<0.001 by Two-way ANOVA with multiple comparisons test). (C) Protein expression levels of WT EphA2 and its mutants were detected by western blot using anti-EphA2 antibody.
Figure 4

Characterization of SAMD5 as a new effector of Eph SAM.
(A) Sequence alignment of the SAM domains of SHIP2, Odin and two potential interaction partners (AIDA1 and SAMD5). (B and C) ITC (B) and analytical gel-filtration chromatography (C) showing that SAMD5 binds to EphA5 SAM. (D) ITC-derived dissociation constants showing that SAM domains from EphA5-8 and EphB1-4 bind to SAMD5 SAM.
Figure 5
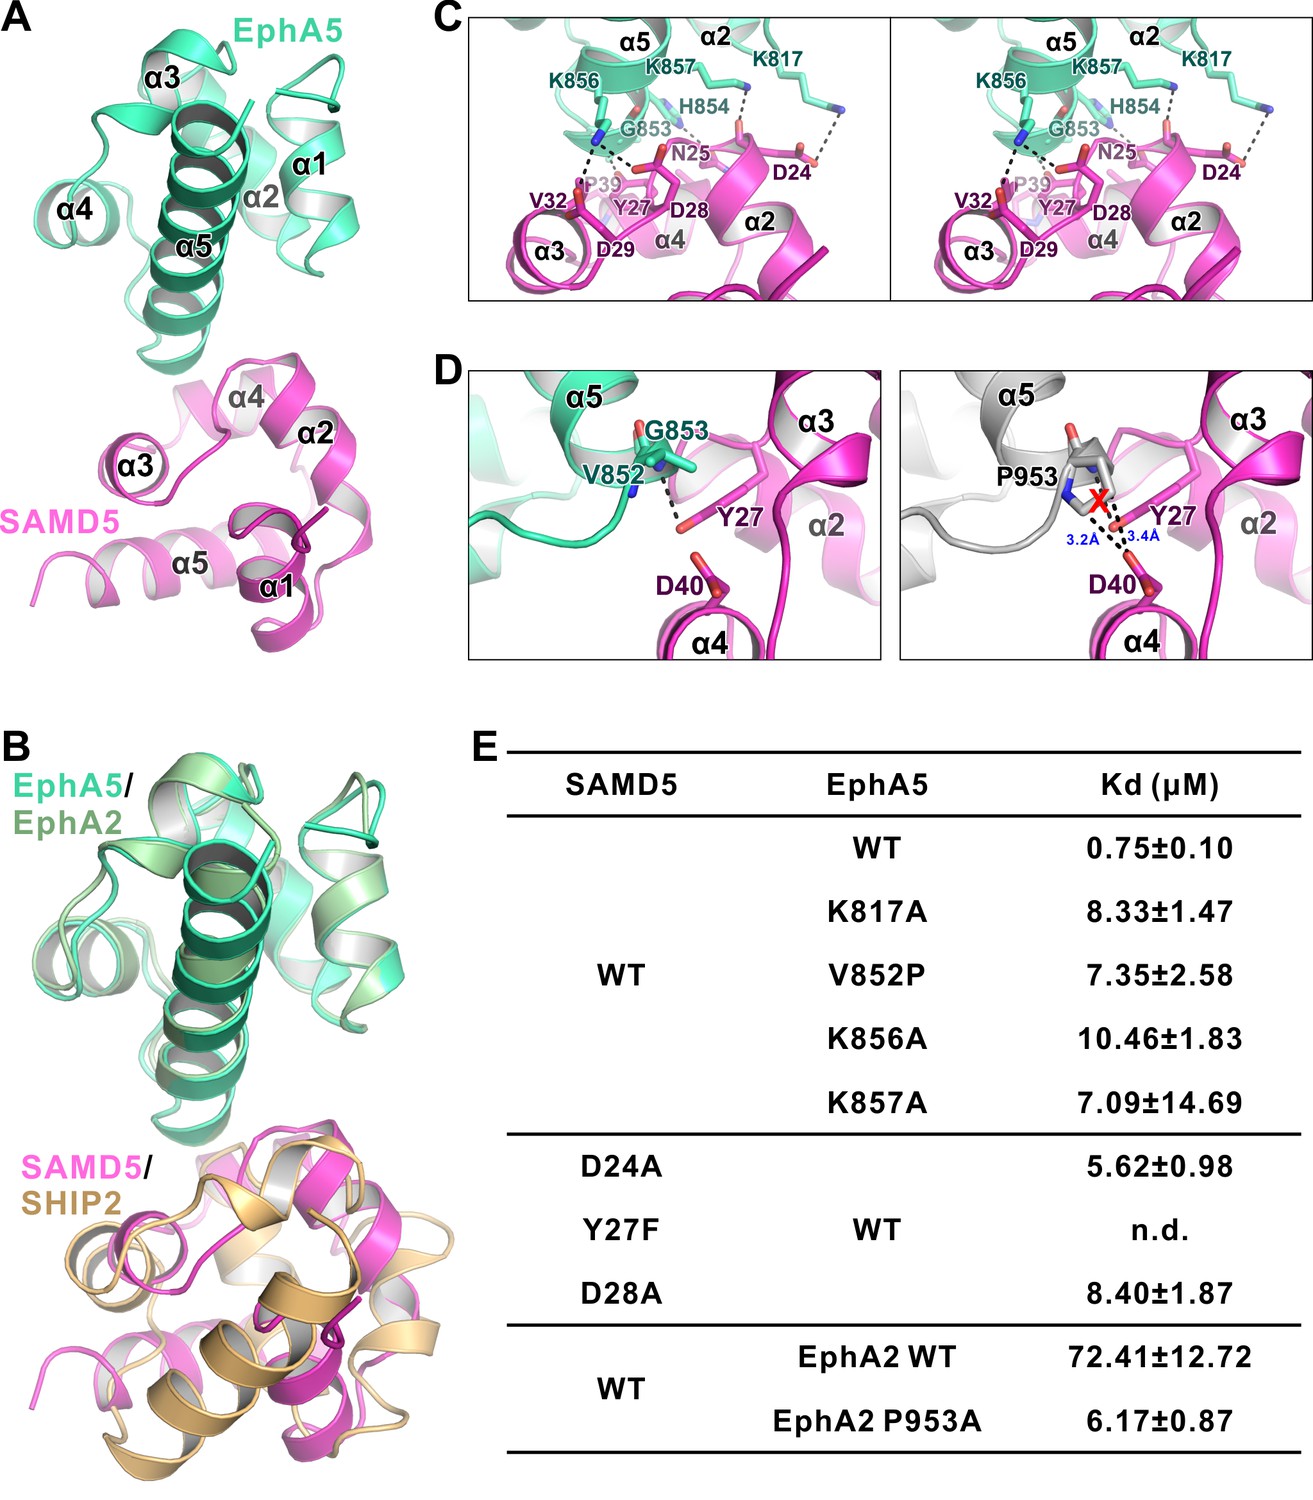
The detailed interaction between EphA5 SAM and SAMD5 SAM.
(A) Ribbon diagram showing the overall structure of the EphA5/SAMD5 complex. (B) Superposition of the EphA5/SAMD5 and EphA2/SHIP2 complex structures by aligning EphA5 and EphA2 together. SAMD5 and SHIP2 use different surfaces to interact with the same site on the SAM domains from EphA5 and EphA2. (C) Stereo view of the detailed interaction of the EphA5/SAMD5 complex. Key residues are shown with the stick model. Salt bridges and hydrogen bonds are indicated with dashed lines. (D) Structure model showing that V852P mutation of EphA5 will introduce steric hindrance with Tyr27 and Asp40 from SAMD5 and thus impair the binding. (E) ITC-derived dissociation constants showing mutations of critical residues weaken or abolish the binding between SAMD5 and EphA5, and a gain-of-function mutation of EphA2 SAM (P953A) with enhanced binding to SAMD5.
Figure 6
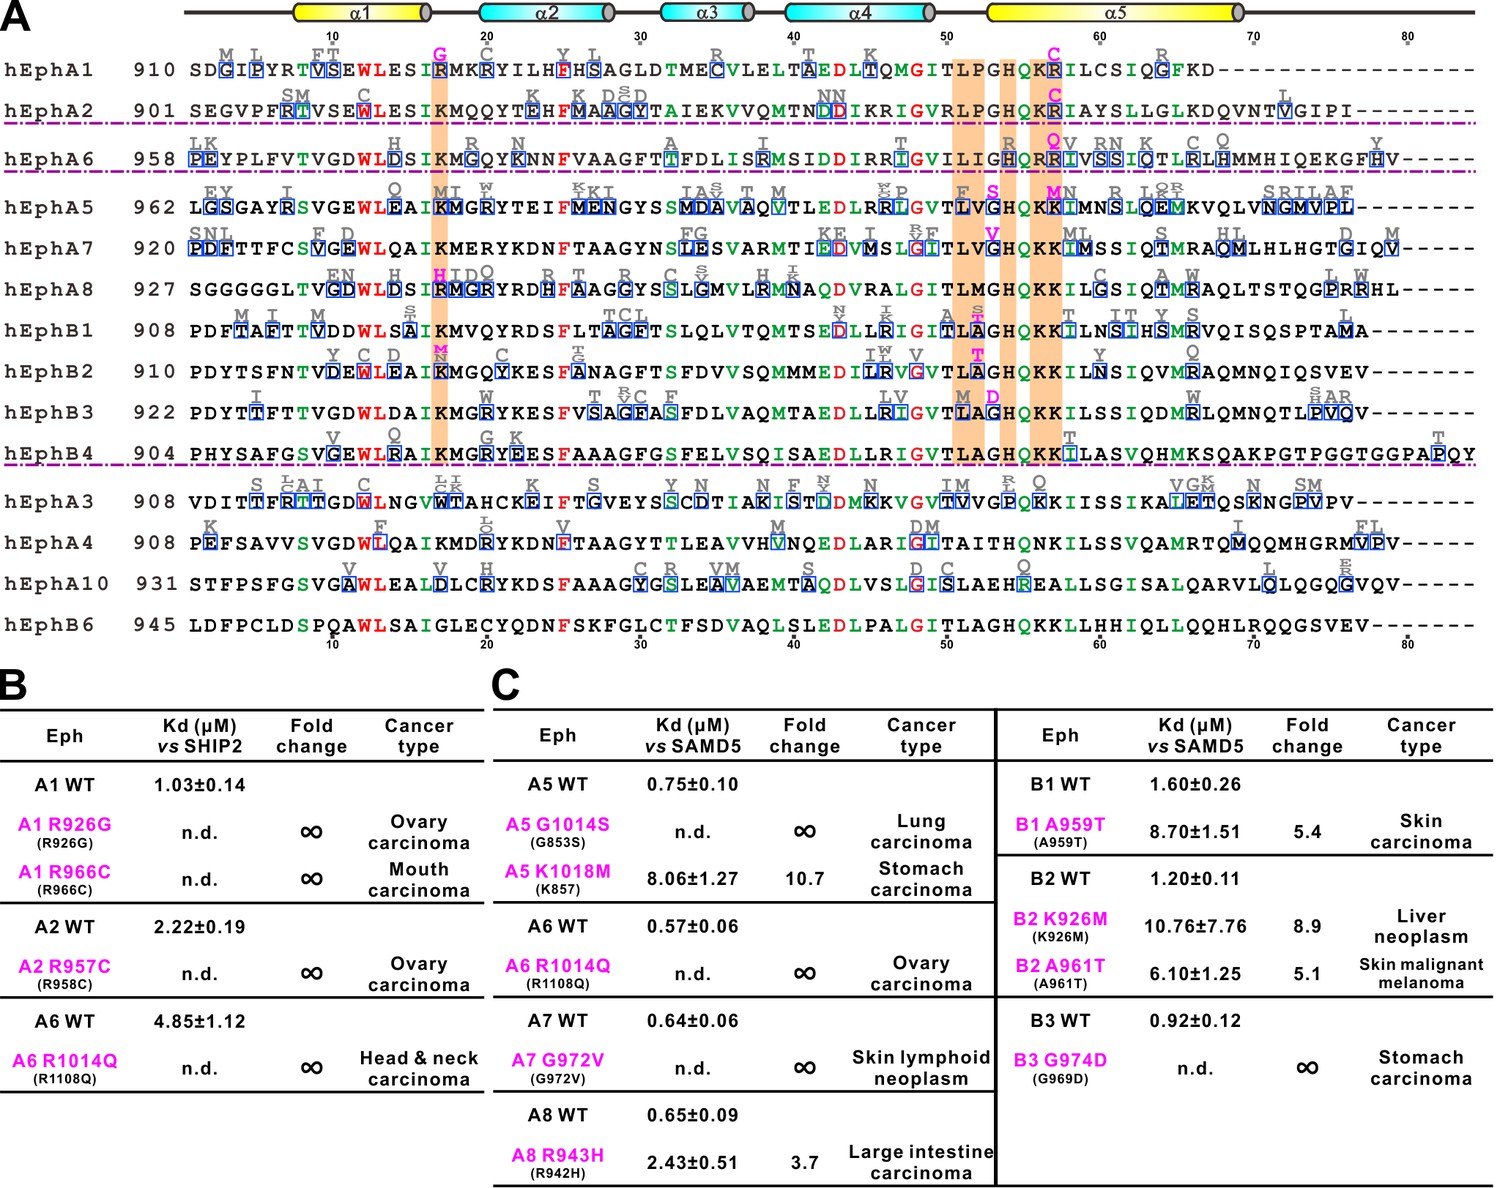
Disease mutations of Eph SAM domains.
(A) Sequence alignments of Eph SAMs. The secondary structure elements are labeled according to the EphA2 SAM structure. Residues that are identical and highly similar are shown in red and green, respectively. The residues critical in the SAM–SAM interactions are shaded in orange. Mutations within the SAM domain of all Eph receptors found in cancer patients are indicated in grey or magenta. The residues indicated in magenta were experimentally tested and shown in B and C. (B) Summary of the impacts of selected mutations of EphA1, A2, A6 identified in cancer patients (see panel A) on the SHIP2 binding. (C) Summary the impacts of selected mutations of EphA5, A6, A7, A8 and EphB1, B2, B3 identified in cancer patients (see panel A) on the SAMD5 binding.
Author response image 1
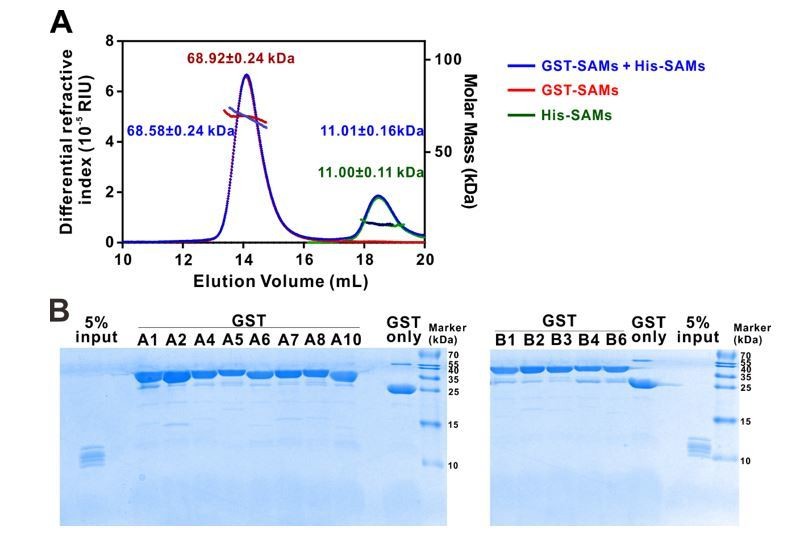
Eph receptor SAM domain did not form homo- or hetero-dimers/multimers in solution.
(A) SEC-MALS analyses showing that mixing the 14 His-tagged Eph receptor SAM domains with the 13 GST-tagged Eph receptor SAM domains (blue line) did not cause detectable elution profile changes when compared to the elution profile of the 14 His-tagged Eph receptor SAM domains (green line) and to that of 13 GST-tagged Eph receptor SAM domains (red line) (i.e. the near perfect overlap of the blue, green and red elution profiles). The concentration of each SAM domain in the assay mixtures is 10 μM. The fitted molar mass values of the His-SAM mixture, GST-SAM mixture, and the His-SAM + GST-SAM mixtures are also indicated in the figure, and further showing no detectable molar mass change upon mixing the two mixtures. (B) GST pull-down assay showing that none of the thirteen individual GST-tagged Eph receptor SAM domain had detectable binding to any one of the SAM domain in the 14 His-tagged SAM domain mixture. In this assay, each of purified GST-tagged Eph receptor SAM domain was incubated with a mixtures composed of the 14 His-tagged SAM domains (see 5% input lane). The GSH-Sepharose beads pelleted proteins were separated by Tricine SDS-PAGE and stained with Coomassie blue. No detectable His-tagged SAM domains could be observed in any of the GST-tagged Eph SAM domain pull-down experiments.
Author response image 2
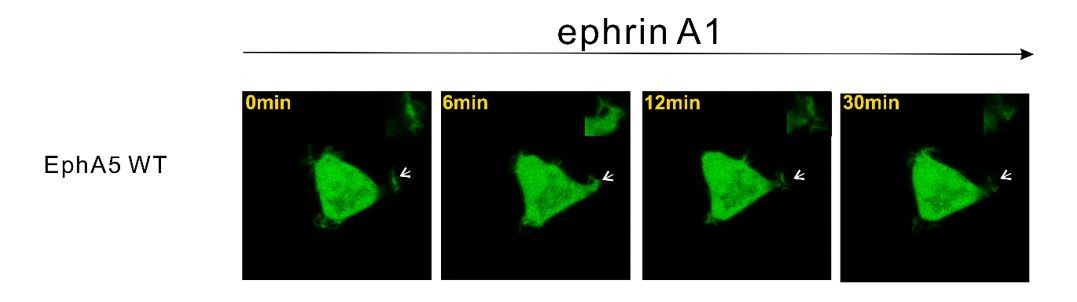
Representative images showing that HEK293T cell expressing EphA5 WT did not undergo obvious ephrinA1-induced retraction.
https://doi.org/10.7554/eLife.35677.020Tables
Table 1
Statistics of X-ray crystallographic data collection and model refinement
https://doi.org/10.7554/eLife.35677.004| Data collection | ||||
|---|---|---|---|---|
| Dataset | EphA2/SHIP2 | EphA6/Odin | EphA5/SAMD5 | |
| Space group | C2 | P212121 | C2 | |
| Unit cell (a, b, c, Å) | 138.283, 43.344, 46.377 | 38.985, 85.042, 98.383 | 98.195, 29.651, 54.170 | |
| Unit cell (α, β, γ, °) | 90, 95.354, 90 | 90, 90, 90 | 90, 109.952, 90 | |
| Wavelength (Å) | 0.97915 | 0.97915 | 0.97961 | |
| Resolution range (Å) | 50.00–1.50 (1.53–1.50) | 50.00–1.30 (1.32–1.30) | 50.00–1.90 (1.93–1.90) | |
| No. of unique reflections | 43485 (2131) | 79398 (3792) | 11829 (575) | |
| Redundancy | 3.6 (3.5) | 5.9 (5.7) | 3.2 (3.2) | |
| I/σ | 37.9 (2.4) | 39.2 (2.1) | 25.7 (1.9) | |
| Completeness (%) | 99.0 (98.1) | 97.8 (95.1) | 99.1 (100.0) | |
| Rmerge (%)* | 4.7 (62.4) | 5.4 (90.3) | 5.3 (77.1) | |
| Structure refinement | ||||
| Resolution (Å) | 50.0–1.50 (1.55–1.50) | 50.0–1.30 (1.35–1.30) | 50.0–1.90 (1.96–1.90) | |
| Rcryst†/Rfree‡ | 0.1434 (0.2686)/ 0.1911 (0.3129) | 0.1695 (0.2565)/ 0.1987 (0.2671) | 0.1938 (0.3256)/ 0.2340 (0.3282) | |
| Rmsd bonds (Å)/angles (°) | 0.009/1.22 | 0.010/1.52 | 0.015/1.67 | |
| Average B factor (Å2)§ | 30.8 | 22.8 | 30.1 | |
| No. of protein atoms | 2046 | 2745 | 1058 | |
| No. of other atoms | 273 | 443 | 96 | |
| No. of reflections | ||||
| Working set | 41244 (4003) | 77272 (7372) | 11252 (1065) | |
| Test set | 2186 (227) | 1947 (190) | 565 (57) | |
| Ramachandran plot (%)§ | ||||
| Favored regions | 99.2 | 99.1 | 98.5 | |
| Allowed regions | 0.8 | 0.9 | 1.5 | |
| Outliers | 0 | 0 | 0 | |
-
Numbers in parentheses represent the value for the highest resolution shell.
* Rmerge =Σ|Ii - Im|/ΣIi, where Ii is the intensity of the measured reflection and Im is the mean intensity of all symmetry-related reflections.
-
† Rcryst = Σ||Fobs| - |Fcalc||/Σ|Fobs|, where Fobs and Fcalc are observed and calculated structure factors.
‡ Rfree = ΣT||Fobs| - |Fcalc||/ΣT|Fobs|, where T is a test data set randomly chosen and set aside prior to refinement. For EphA6-Odin, 2.5% of total reflections were enough for the test set during refinement. For EphA2-SHIP2 and EphA5-SAMD5, 5% of total reflections were chosen as test sets.
-
§ B factors and Ramachandran plot statistics are calculated using MOLPROBITY (Chen et al., 2010).
Key resources table
| Reagent type (species) or resource | Designation | Source or reference | Identifiers |
|---|---|---|---|
| Strain, strain background (E. coli) | BL21(DE3) | Invitrogen | Cat #C600003 |
| Cell line (Human) | DU145 | ATCC | Cat #HTB-81; RRID:CVCL_0105 |
| Cell line (Human) | HEK293T | ATCC | Cat #CRL-3216; RRID:CVCL_0063 |
| Transfected construct (Lenti-virus) | pLVX-CMV-EGFP-3 ×Flag-CoPuroR | Shanghai Taitool Bioscience Co., Ltd | NA |
| Transfected construct (Lenti-virus) | pLVX-CMV-EphA2 −3 × Flag-CoPuroR | Shanghai Taitool Bioscience Co., Ltd | NA |
| Transfected construct (Lenti-virus) | pLVX-CMV-EphA2 -R958K-3×Flag-CoPuroR | Shanghai Taitool Bioscience Co., Ltd | NA |
| Transfected construct (Lenti-virus) | pLVX-CMV-EphA2 delSAM-3 × Flag-CoPuroR | Shanghai Taitool Bioscience Co., Ltd | NA |
| Transfected construct (Lenti-virus) | pLVX-CMV-EphA2- SAMA5−3 × Flag-CoPuroR | Shanghai Taitool Bioscience Co., Ltd | NA |
| Transfected construct (plasmid) | GFP-EphA2 | This paper | NA |
| Transfected construct (plasmid) | GFP-EphA2-R958K | This paper | NA |
| Transfected construct (plasmid) | GFP-EphA2-R958C | This paper | NA |
| Transfected construct (plasmid) | Myc-SHIP2-SAM | This paper | NA |
| Antibody | monoclonal Anti-Flag M2, clone M2 | Sigma | Cat #F3165; RRID:AB_259529 |
| Antibody | Anti-Myc (9B11) mouse mAb | Cell Signaling Technology | Cat #2276; RRID: AB_331783 |
| Antibody | Anti-EphA2 (D4A2) XP Rabbit mAb | Cell Signaling Technology | Cat #6997; RRID:AB_10827743 |
| Antibody | Anti-GAPDH (D16H11) XP Rabbit mAb | Cell Signaling Technology | Cat #5174; RRID:AB_10622025 |
| Peptide, recombinant protein | Recombinant Mouse Ephrin-A1-Fc Chimera | R and D Systems | Cat #602-A1 |
| Commercial assay or kit | Clone Express II, One-Step Cloning Kit | Vazyme Biotech Co., Ltd | Cat #C112 |
| Commercial assay or kit | ViaFect transfection reagent | Promega Corporation | Cat #E4981 |
| Chemical compound, drug | Rhodamine Phalloidin | Cytoskeleton Inc. | Cat #PHDR1 |
| Software, algorithm | Origin7.0 | OriginLab | http://www.originlab.com/; RRID: SCR_002815 |
| Software, algorithm | GraphPad Prism | GraphPad Software Inc. | http://www.graphpad.com/scientific-software/prism/; RRID: SCR_002798 |
| Software, algorithm | HKL2000 | HKL Research Inc. | http://www.hkl-xray.com/ |
| Software, algorithm | CCP4 | PMID: 21460441 | http://www.ccp4.ac.uk/; RRID: SCR_007255 |
| Software, algorithm | PHENIX | PMID: 20124702 | http://www.phenix-online.org/; RRID: SCR_014224 |
| Software, algorithm | PyMOL | DeLano Scientific LLC | http://www.pymol.org/; RRID: SCR_000305 |
| Software, algorithm | ASTRA6.1 | Wyatt Technology Corporation | http://www.wyatt.com/products/software/astra.html |
| Software, algorithm | ImageJ | NIH | https://imagej.nih.gov/ij/; RRID: SCR_003070 |
| Other | DAPI | Sigma | Cat #D9542 |
Additional files
-
Transparent reporting form
- https://doi.org/10.7554/eLife.35677.017
Download links
A two-part list of links to download the article, or parts of the article, in various formats.
Downloads (link to download the article as PDF)
Open citations (links to open the citations from this article in various online reference manager services)
Cite this article (links to download the citations from this article in formats compatible with various reference manager tools)
Specific Eph receptor-cytoplasmic effector signaling mediated by SAM–SAM domain interactions
eLife 7:e35677.
https://doi.org/10.7554/eLife.35677


