Assessing reliability in neuroimaging research through intra-class effect decomposition (ICED)
- Max Planck Institute for Human Development, Germany
- Max Planck UCL Centre for Computational Psychiatry and Ageing Research, Germany
- University Clinic Hamburg-Eppendorf, Germany
- Wayne State University, United States
Figures
Figure 1
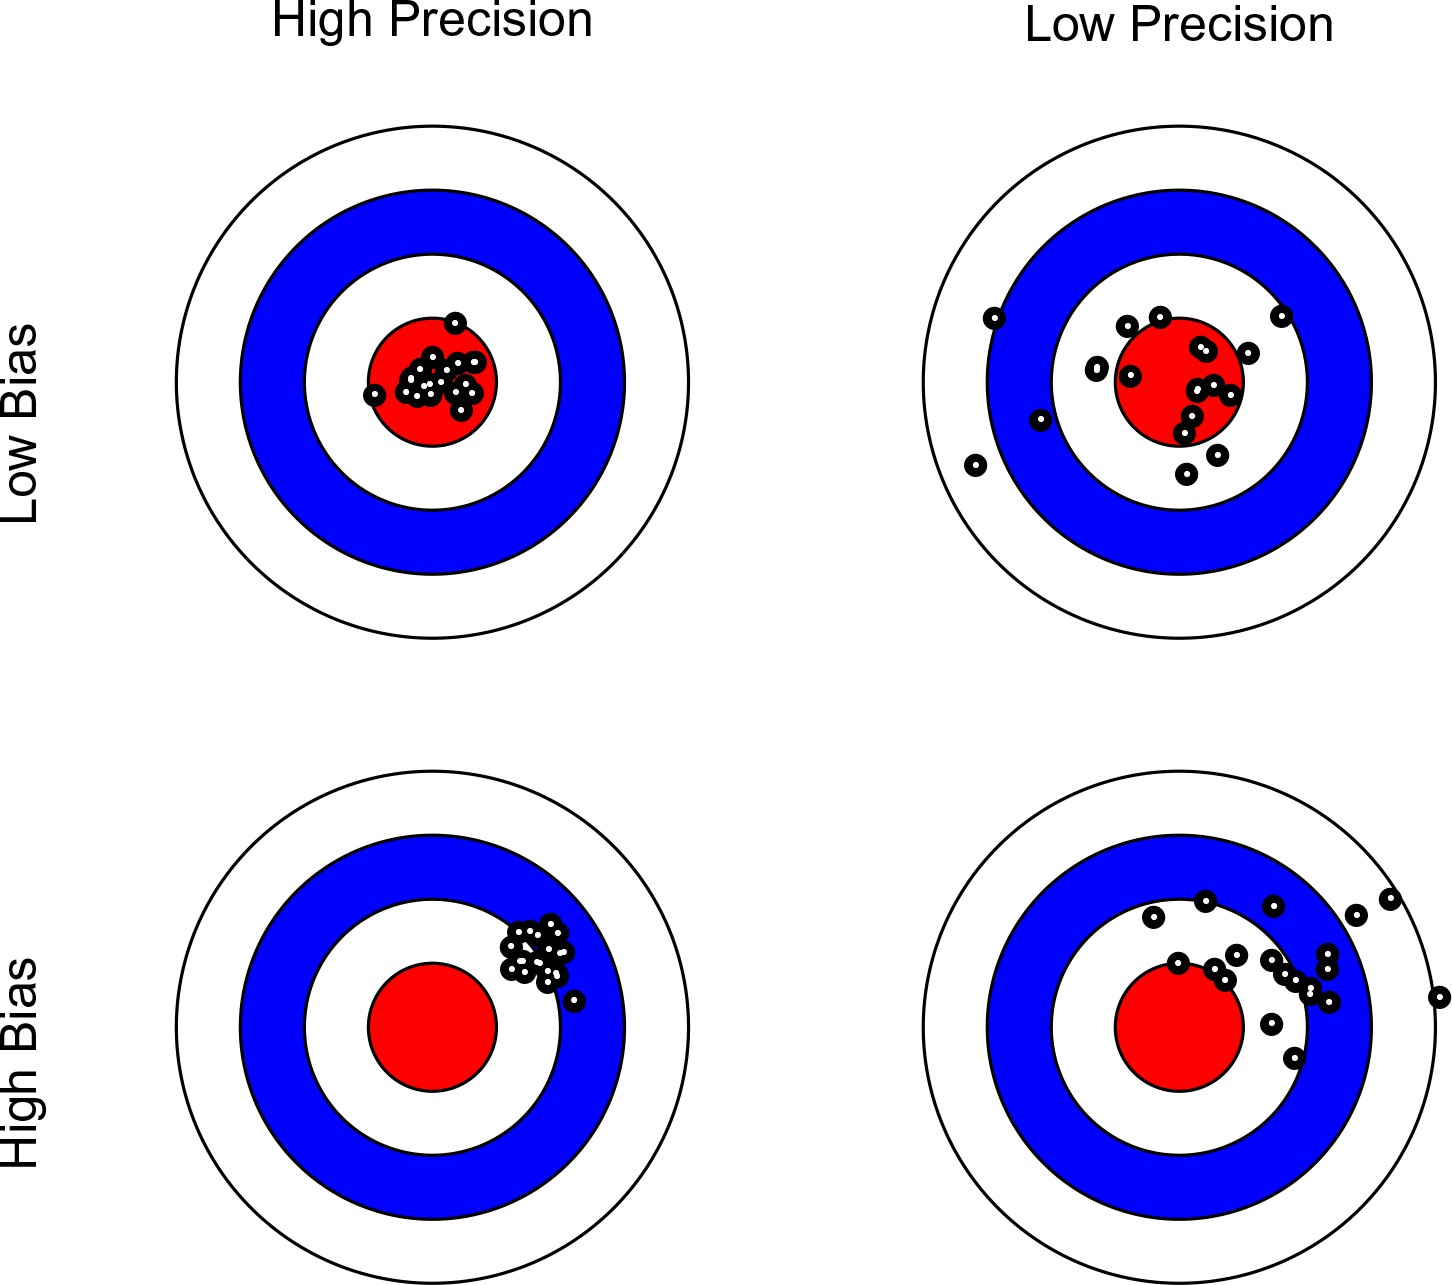
Bullseye charts representing precision and bias of a measurement instrument.
The center of each bullseye represents ground truth and the black dots represent repeated measurements. Ideal measurement instruments have minimal bias and maximal precision (as illustrated in the top-left panel).
Figure 2
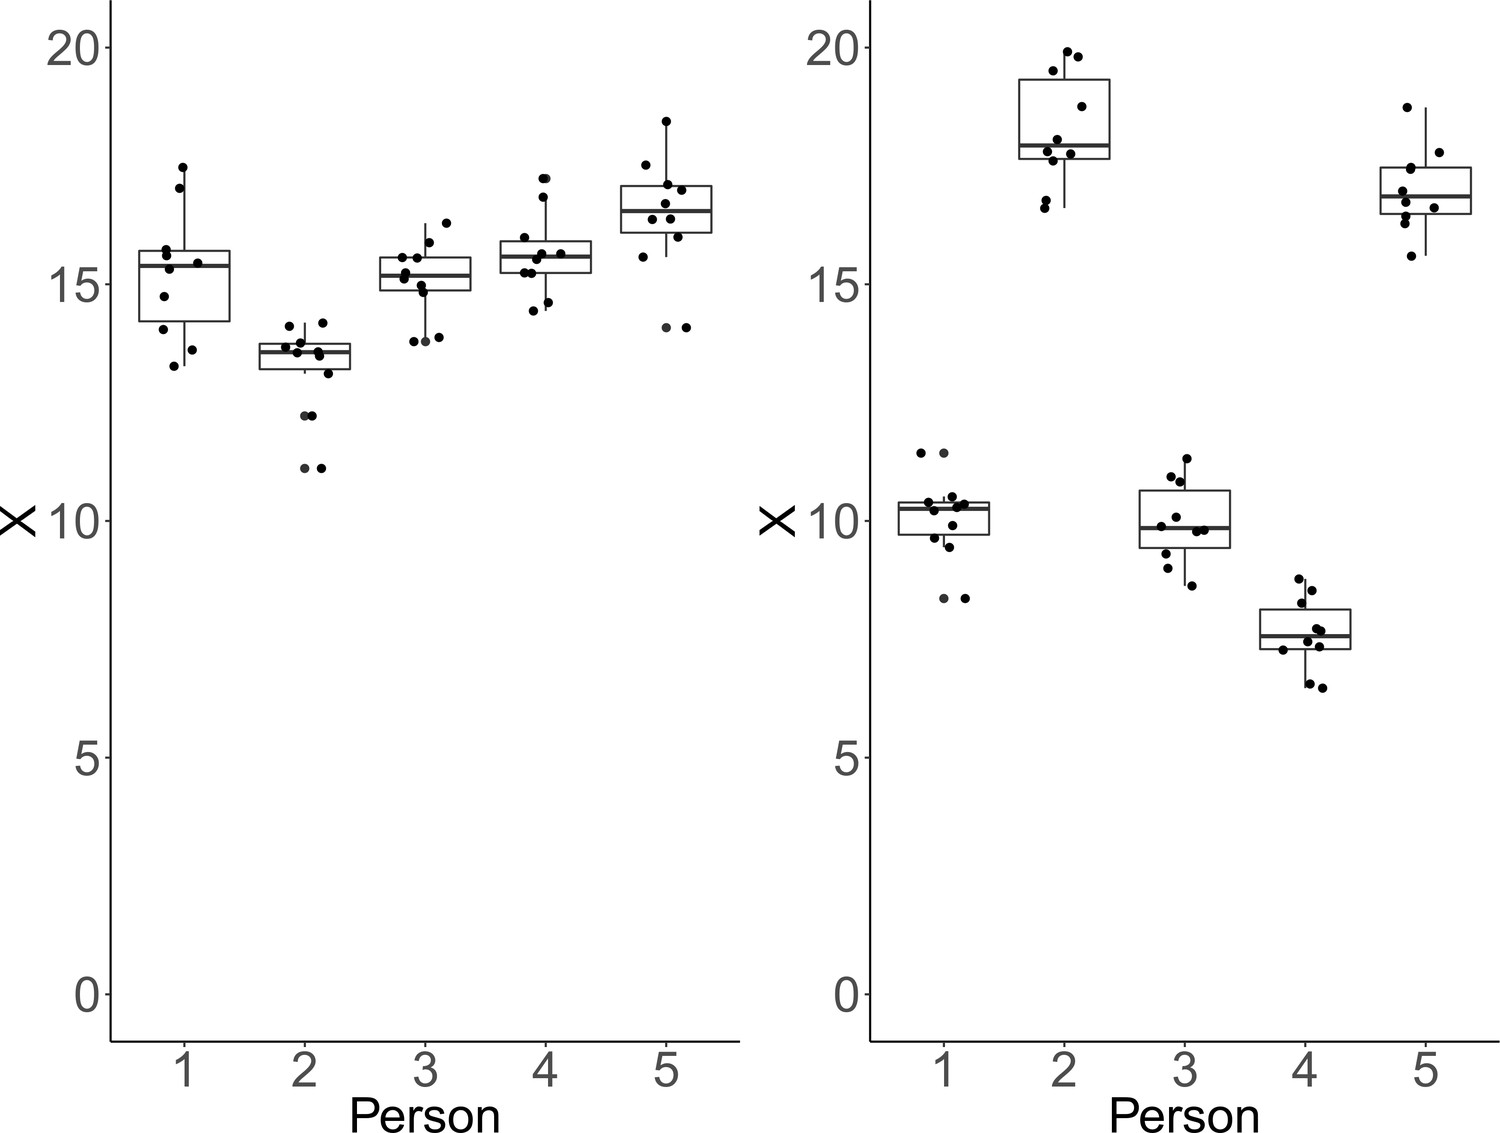
Each plot shows simulated data of 10 repeated measurements of a fictitious outcome X for five persons.
Within-person variance is identical over persons and panels. Left panel: Between-person variance is identical to within-person variance. In that case, ICC-indexed reliability is estimated at a rather low ICC = 0.48, whereas CV-indexed precision is fair, with averaged CV = 0.07. Right panel: Between-person standard deviation is larger than within-person standard deviation by a factor of five. In this condition, estimated ICC-indexed reliability is high (ICC = 0.96), but CV-indexed precision remains identical with averaged CV = 0.07 as the within-person standard deviation is still fairly small with respect to the sample mean.
Figure 3
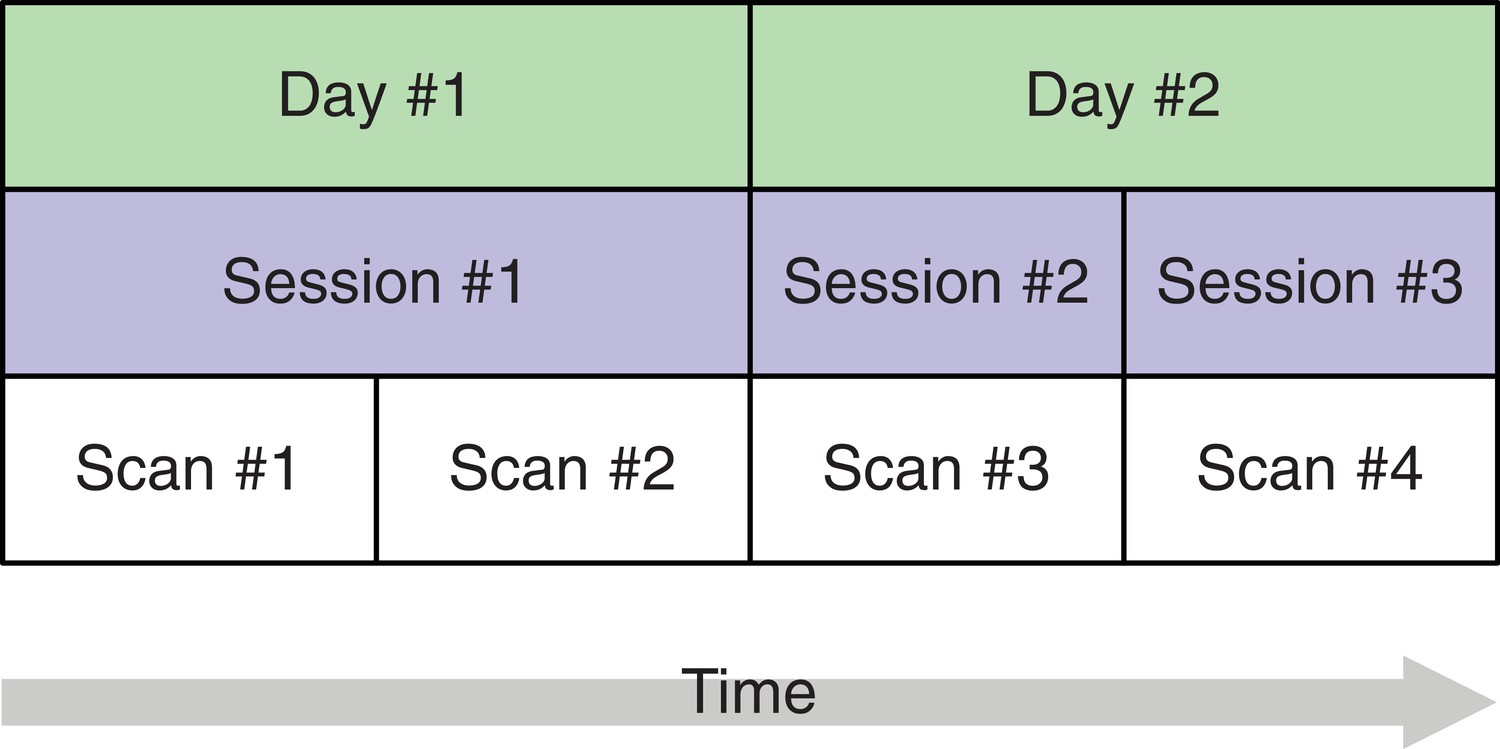
A study design with four brain imaging scans per person spread across three sessions on two days.
The start of each session (blue) implies that the person is moved into the scanner. On the first day, there is only a single session, that is, between scans 1 and 2, the person remains in the scanner whereas on day 2, the person is removed from the scanner after the first session and, after a short break, placed back in. This allows separating the session-specific and the day-specific variance contributions to total variance.
Figure 4
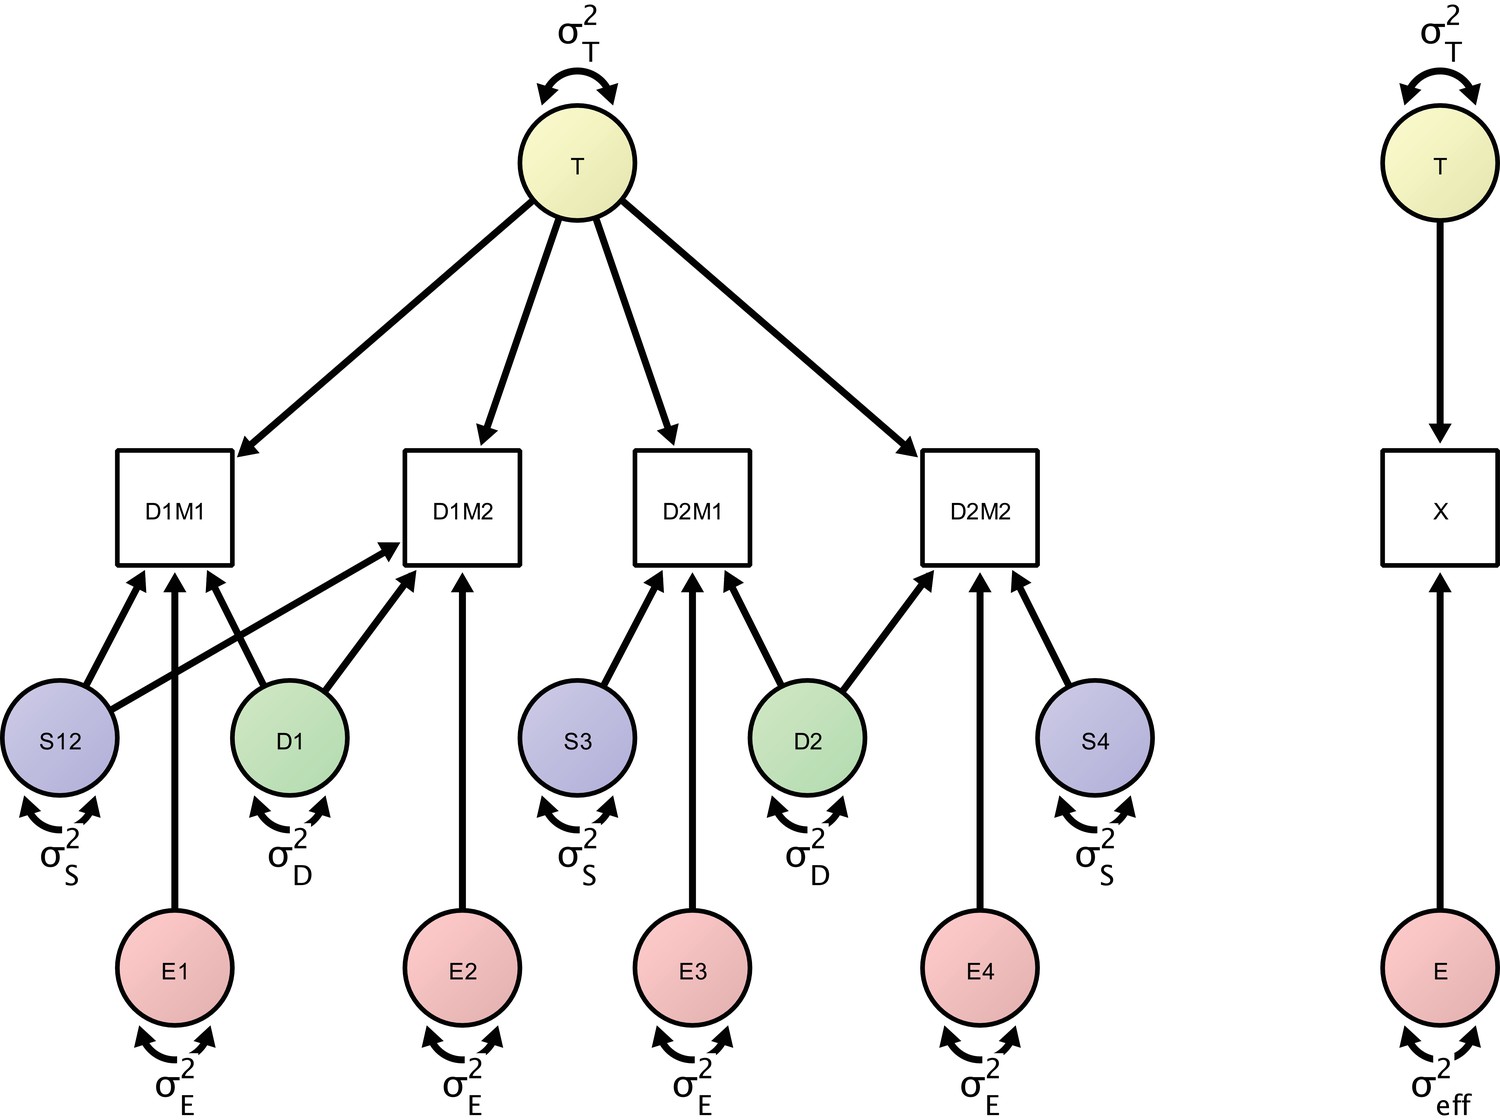
Left: Measurement model of four repeated measures according to the study design protocol.
The measurement model includes day-specific effects that are separated by the error variance sources (in green), session-specific effects (represented by error variance sources in blue) and orthogonal residual error variance sources (represented in red). Right: A minimal, power-equivalent model that represents a direct measurement of the construct of interest. The true score (representing the outcome of interest) is measured with only a single error construct, whose variance is the effective error variance representing the combined influence of the complete error (co)variance structure shown in the left model.
Figure 5
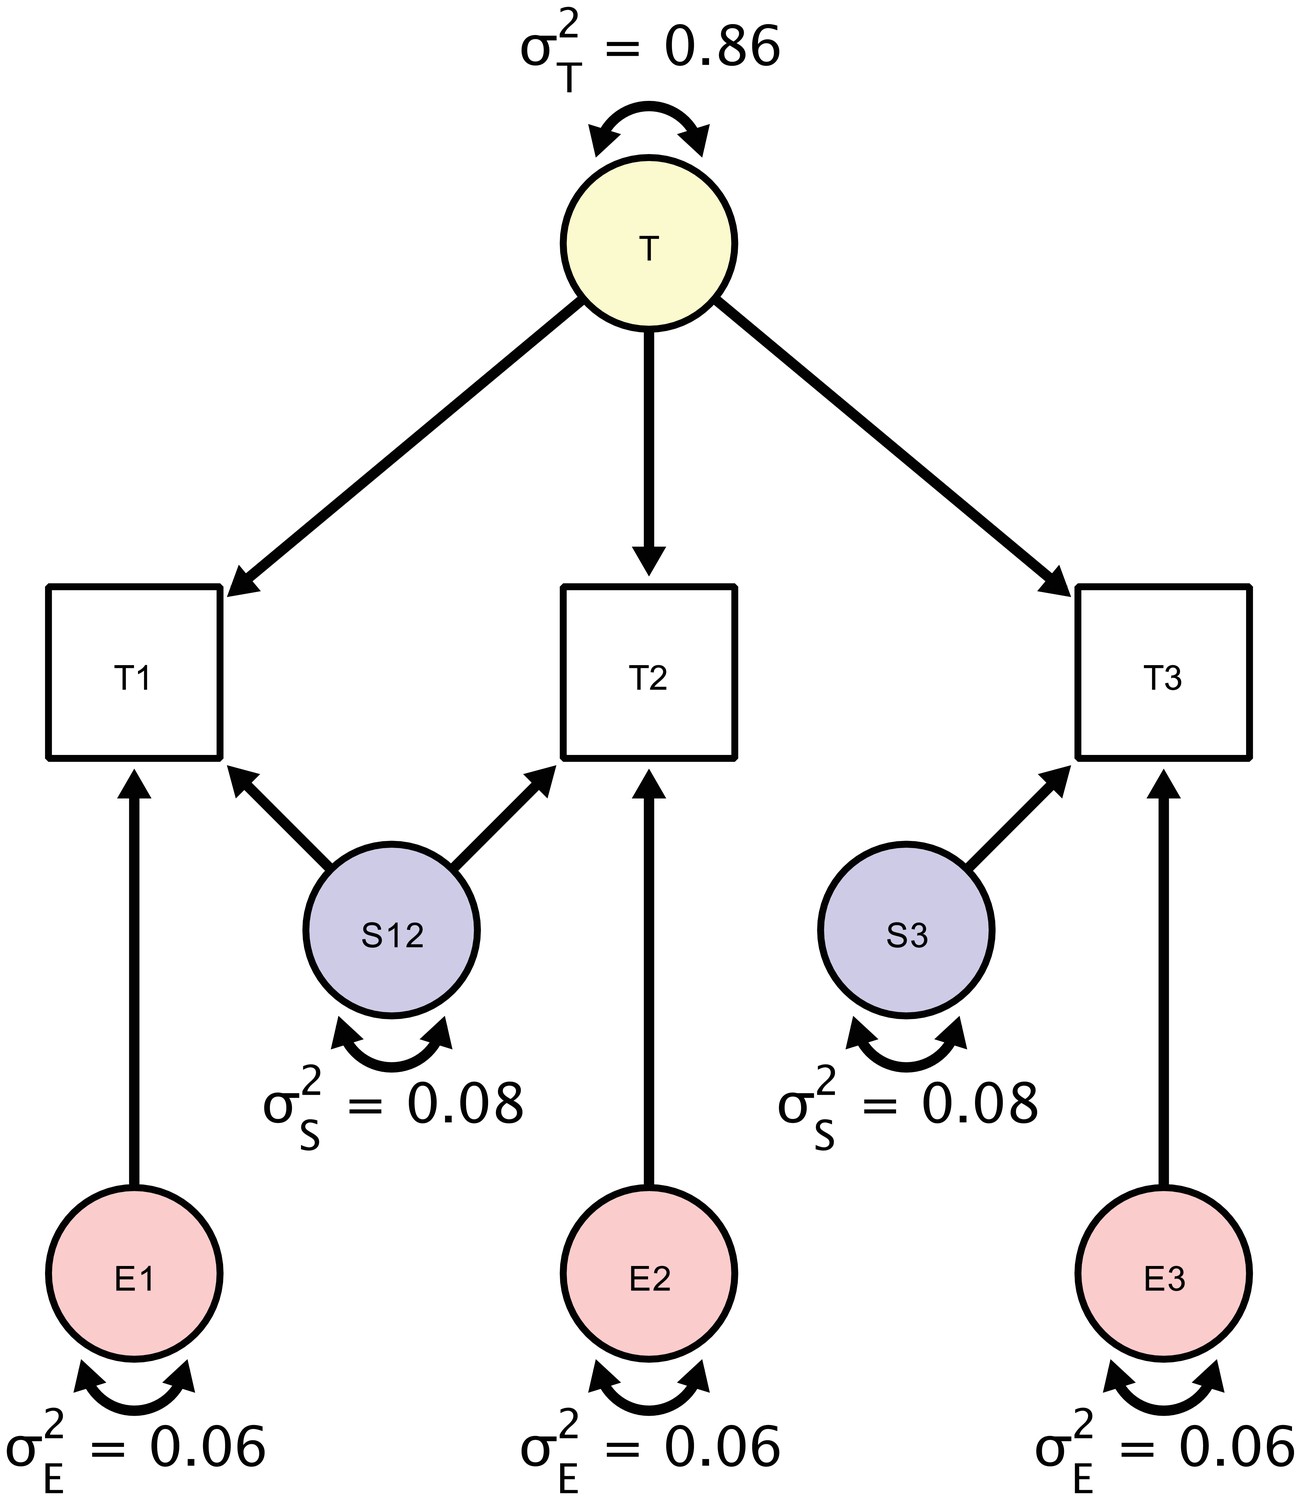
A Structural Equation Model of a repeated measures design in which each participant is scanned three times.
Each person is scanned the first time (T1), followed by a back-to-back immediate re-acquisition (T2), and, finally, the person is moved out of the scanner, positioned back in the scanner, and scanned the third time (T3). Parameters in the SEM correspond to estimates of true score variation (), session-specific error variance component (), and a residual error variance component (). The standardized estimates are based on myelin water fraction data in the anterior limb of the internal capsule acquired from Arshad et al. (2017).
Figure 6
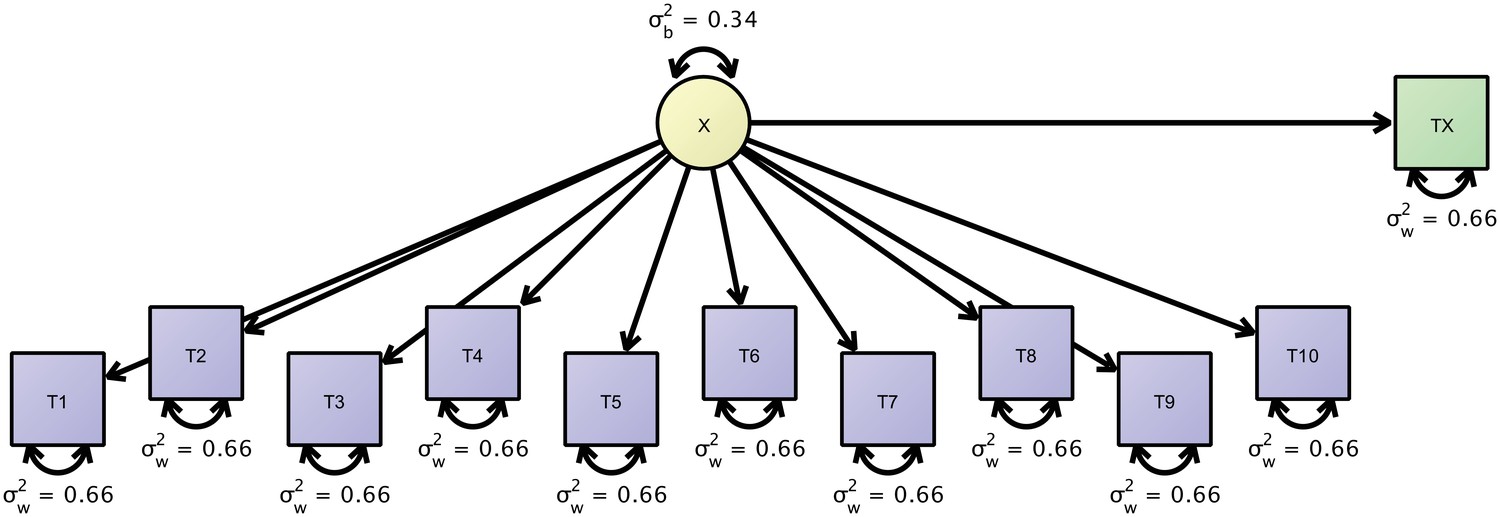
Path-diagram of a joint cross-sectional and longitudinal model to estimate link-wise resting state functional connectivity.
The latent variable X (yellow) represents the outcome of interest (e.g., a particular link-wise connectivity coefficient) and is longitudinally measured by 10 measures T1 to T10 (blue rectangles). A second cross-sectional measurement, Tx (green rectangle), augments the estimation of the between-person differences. The respective data set is organized with a mutually missing data scheme, that is, all cells of the longitudinal measurements are missing for cross-sectional data rows and vice versa.
Figure 7
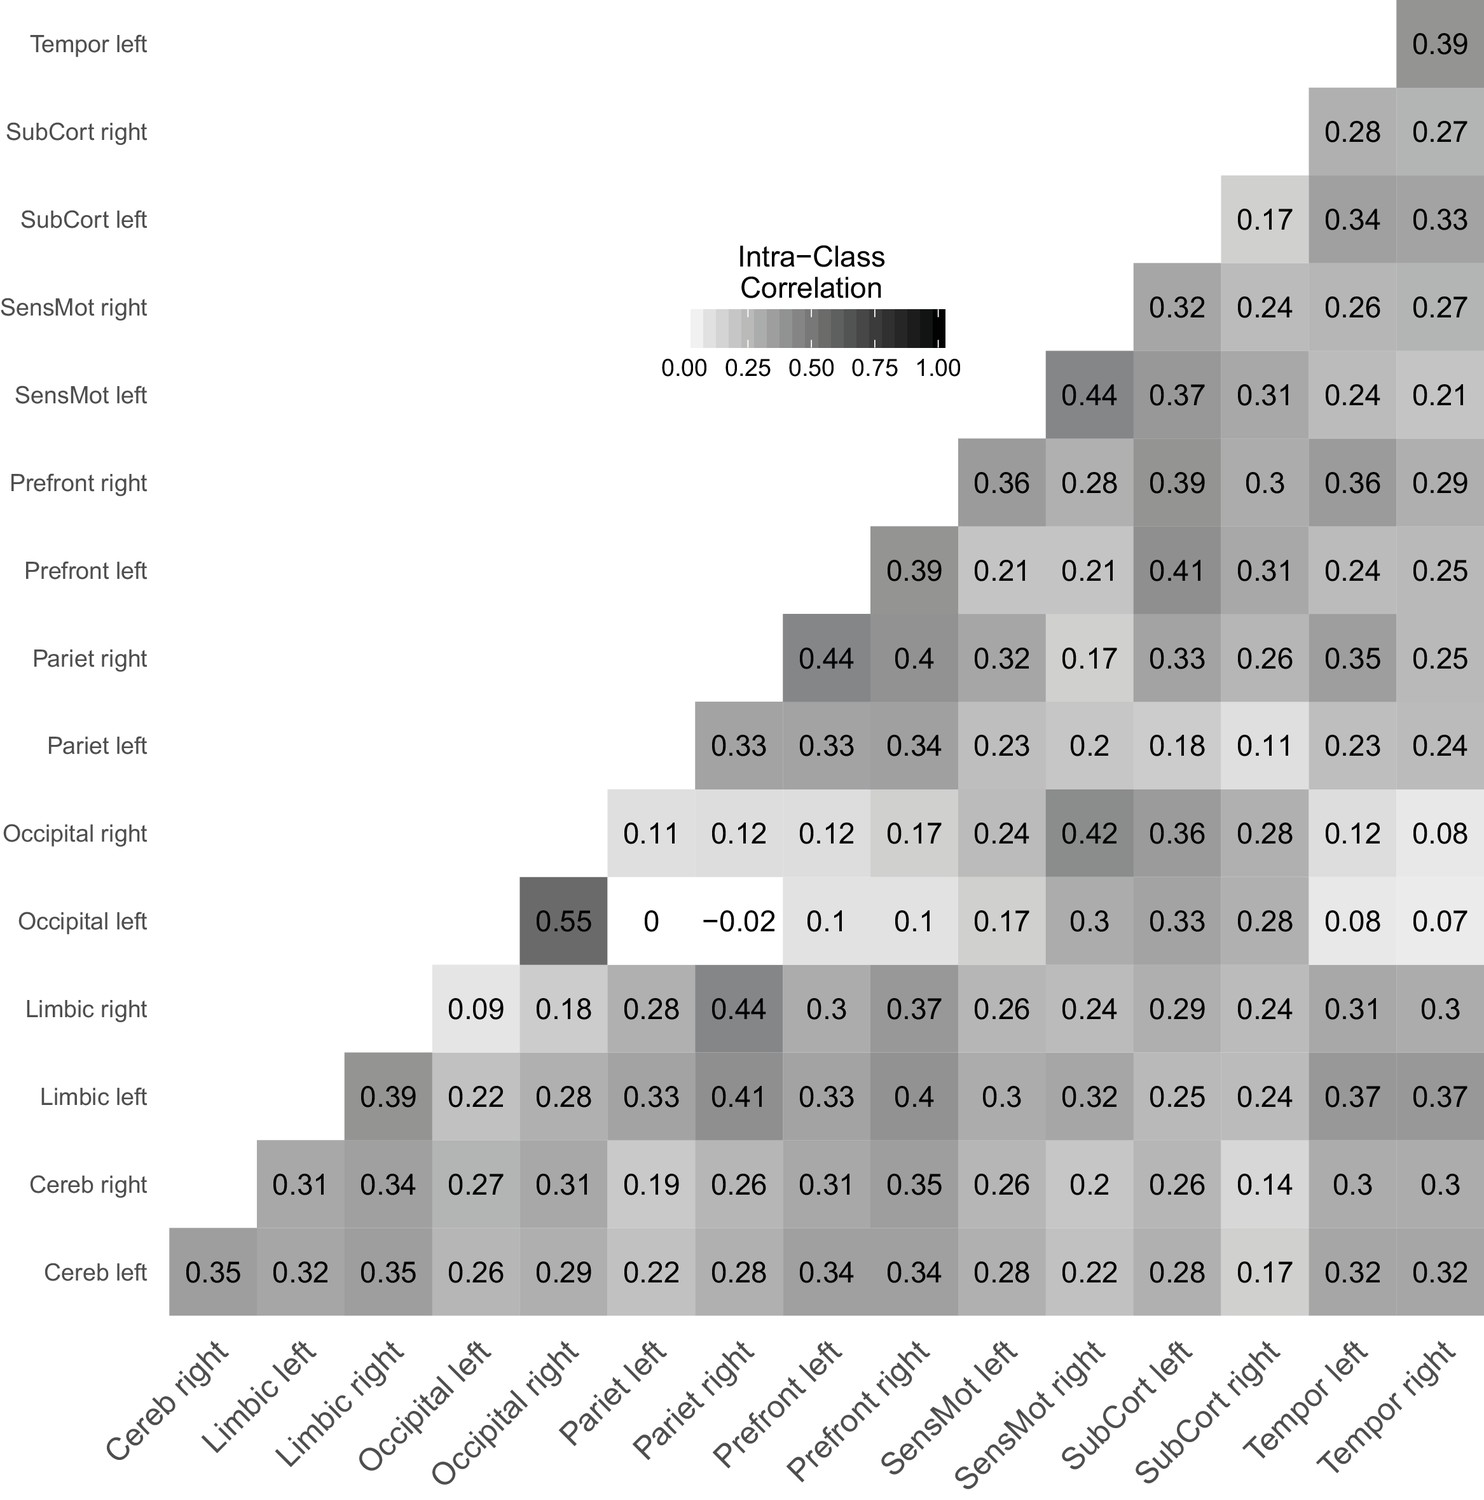
Link-wise reliability based on combined cross-sectional and longitudinal samples from the day2day study.
https://doi.org/10.7554/eLife.35718.010Tables
Table 1
A list of terms describing the concepts of variability across repetitions and average distance from ground truth over measurements across different disciplines and knowledge domains.
https://doi.org/10.7554/eLife.35718.003| Knowledge domain | Variability across repetitions | Average distance from ground truth |
|---|---|---|
| Psychology | Reliability | Validity |
| Physics | Precision | Accuracy |
| Statistics | Variance | Bias |
| Measurement Theory | Random error | Systematic error |
| ISO 5725 (‘Accuracy’) | Precision | Trueness |
Table 2
Model-implied covariance matrix.
Rows and columns correspond to the four measurement occasions (brain scans) distributed over two days. Parameters of the covariance matrix are the individual differences of the construct of interest, , the session-specific error variance, , the day-specific error variance, , and the residual error variance, .
| Scan 1 | Scan 2 | Scan 3 | Scan 4 | |
|---|---|---|---|---|
| Scan 1 | ||||
| Scan 2 | ||||
| Scan 3 | ||||
| Scan 4 |
Download links
A two-part list of links to download the article, or parts of the article, in various formats.
Downloads (link to download the article as PDF)
Open citations (links to open the citations from this article in various online reference manager services)
Cite this article (links to download the citations from this article in formats compatible with various reference manager tools)
Assessing reliability in neuroimaging research through intra-class effect decomposition (ICED)
eLife 7:e35718.
https://doi.org/10.7554/eLife.35718


