Oligomerization of a molecular chaperone modulates its activity
- Hokkaido University, Japan
- PRESTO, Japan Science and Technology Agency, Japan
- St. Jude Children's Research Hospital, United States
Figures
Figure 1 with 1 supplement
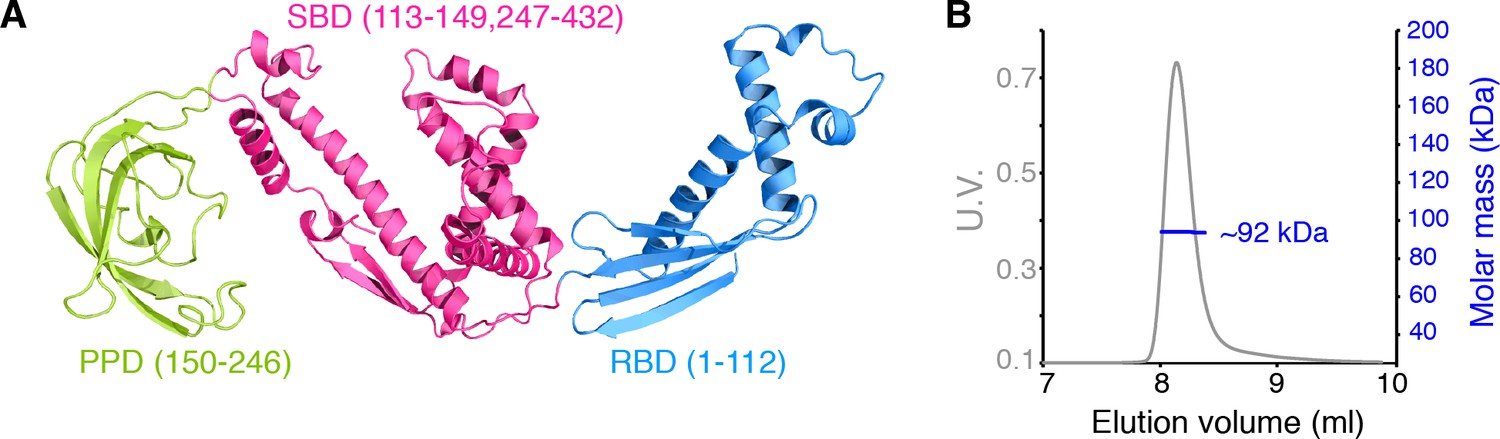
Dimerization of TF in solution.
(A) Structure of E. coli TF (PDB code: 1W26). PPD, SBD, and RBD are shown in green, pink, and blue, respectively. The residue boundaries for each one of the three domains are shown in parentheses. SBD is discontinuous and is formed primarily by the C-terminal domain. (B) Size exclusion chromatography (SEC)-MALS of unliganded TF shows that the protein forms a dimer (Theoretical molar mass: 96 kDa) in solution.
Figure 1—figure supplement 1
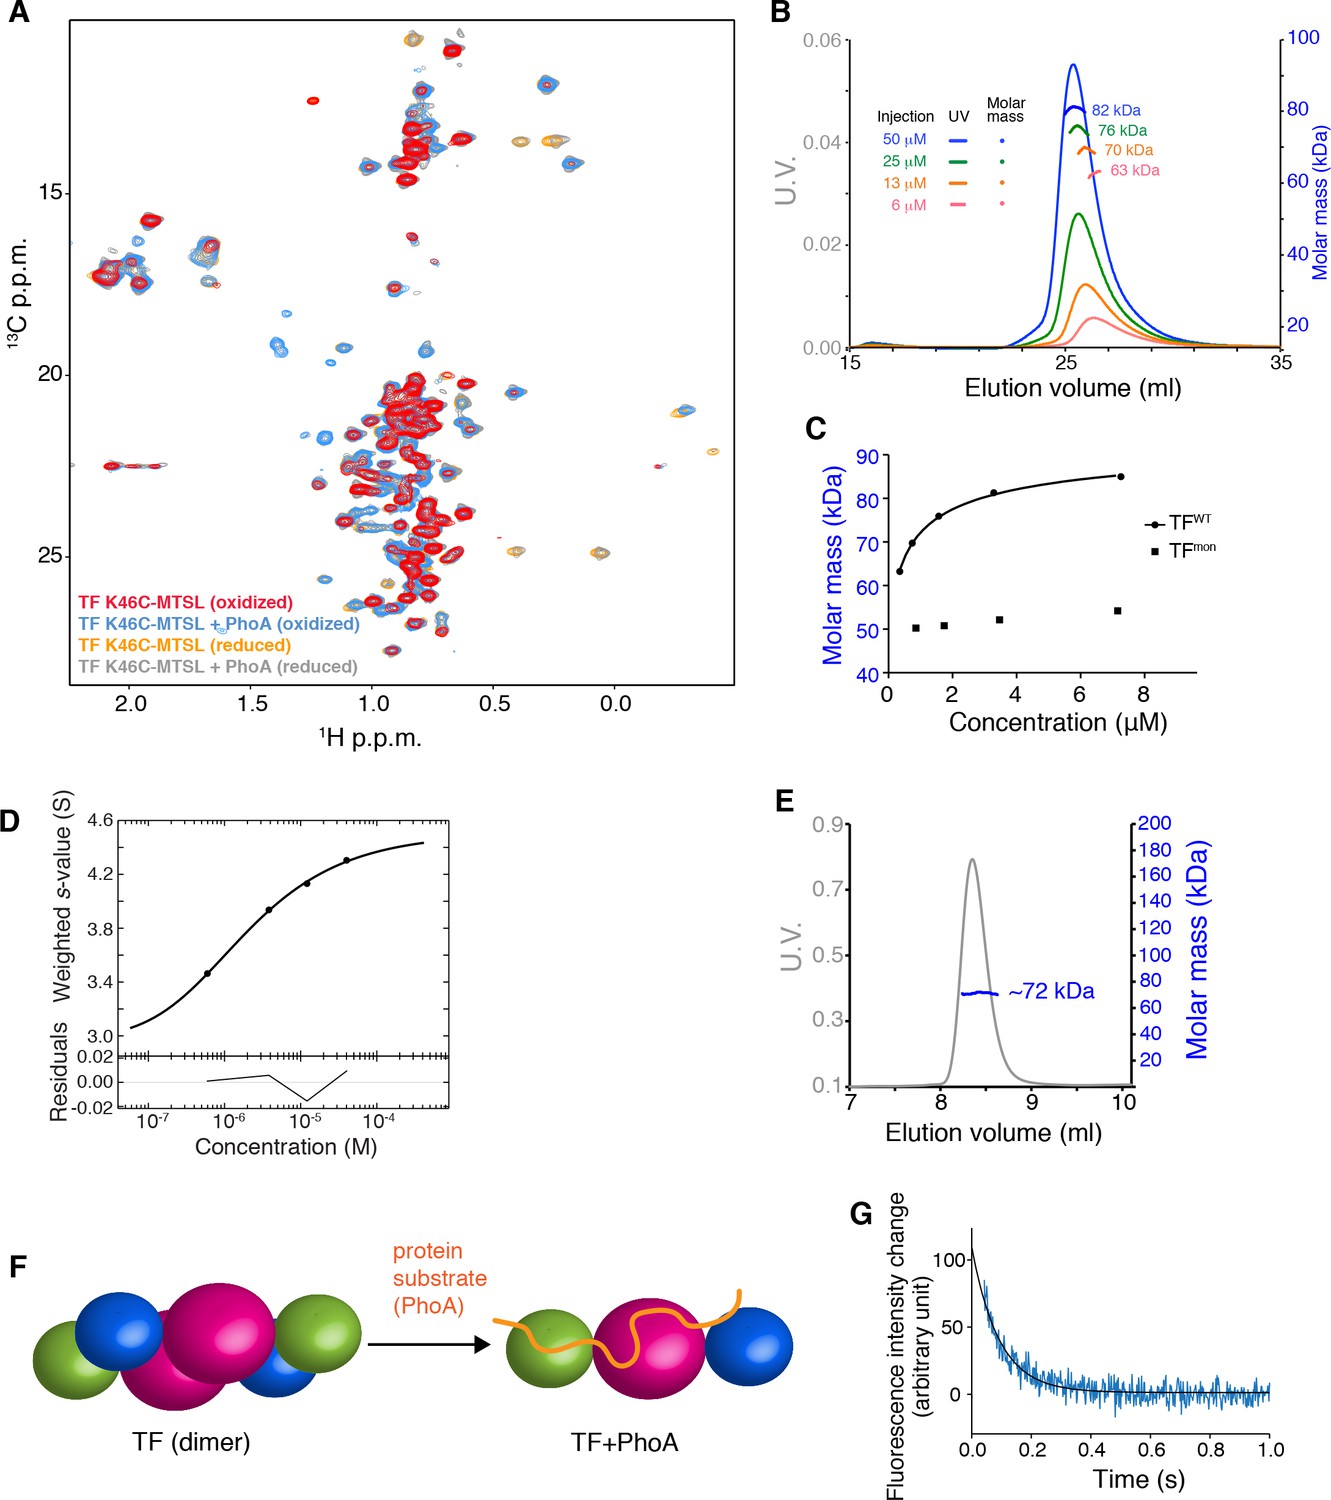
Dynamic monomer-dimer transition of TF.
(A) Observation of PRE for TF K46C attached with MTSL in the presence and absence of its substrate PhoA. Overlay of 1H-13C methyl HMQC spectra of [U-2H; Met-13CH3; Ile-δ1-13CH3; Leu,Val-13CH3/13CH3]-labeled TF K46C attached with MTSL in oxidized (paramagnetic) and reduced (diamagnetic) conditions. Reduced spectra were acquired in the presence of ascorbic acid. A number of resonances of unliganded TF broadened out in paramagnetic spectrum indicate strong intermolecular PRE due to dimer formation. Addition of unfolded substrate protein PhoA retrieved the broadened resonances, indicating the dissociation of the dimer by the interaction with the substrate. (B) SEC-MALS of TF injected at varying concentrations. Injection at lower concentration resulted lower molecular mass, indicating increase of monomer fraction at lower concentration. (C) Plots of molar mass as a function of concentration. The molar mass was estimated by SEC-MALS for TF and TFmon (TF V39E/I76E/I80A) injected at varying concentrations. The solid line represents the fit of the data to a model of monomer-dimer equilibrium. (D) Sedimentation velocity-AUC isotherm of TF. Best-fit isotherms of the weight-average s-values, sw(c), obtained by integration of c(s) distributions of TF over the entire s-range for each loading concentration in a dilution series. The solid line is the fitted isotherm to a reversible monomer-dimer self-association model. The dissociation constant Kd is 1.687 [1.482, 1.914] µM. Errors of the constants represent the 68.3% confidence interval (CI) using an automated surface projection method. (E) SEC-MALS of TF in complex with PhoA1-141 shows that TF binds to PhoA as a monomer (TF-PhoA theoretical molar mass: 66 kDa). (F) Schematic showing the monomerization of TF upon substrate-binding. (G) Dissociation kinetics of the TF dimer. Dissociation of the dimer was initiated by 10-fold dilution of TF to final concentration of 0.1 μM at 22°C. Solid line represents the fit of the data to a single exponential function yielding the dissociation rate (kdiss) of ~ 10 s−1.
Figure 2 with 4 supplements
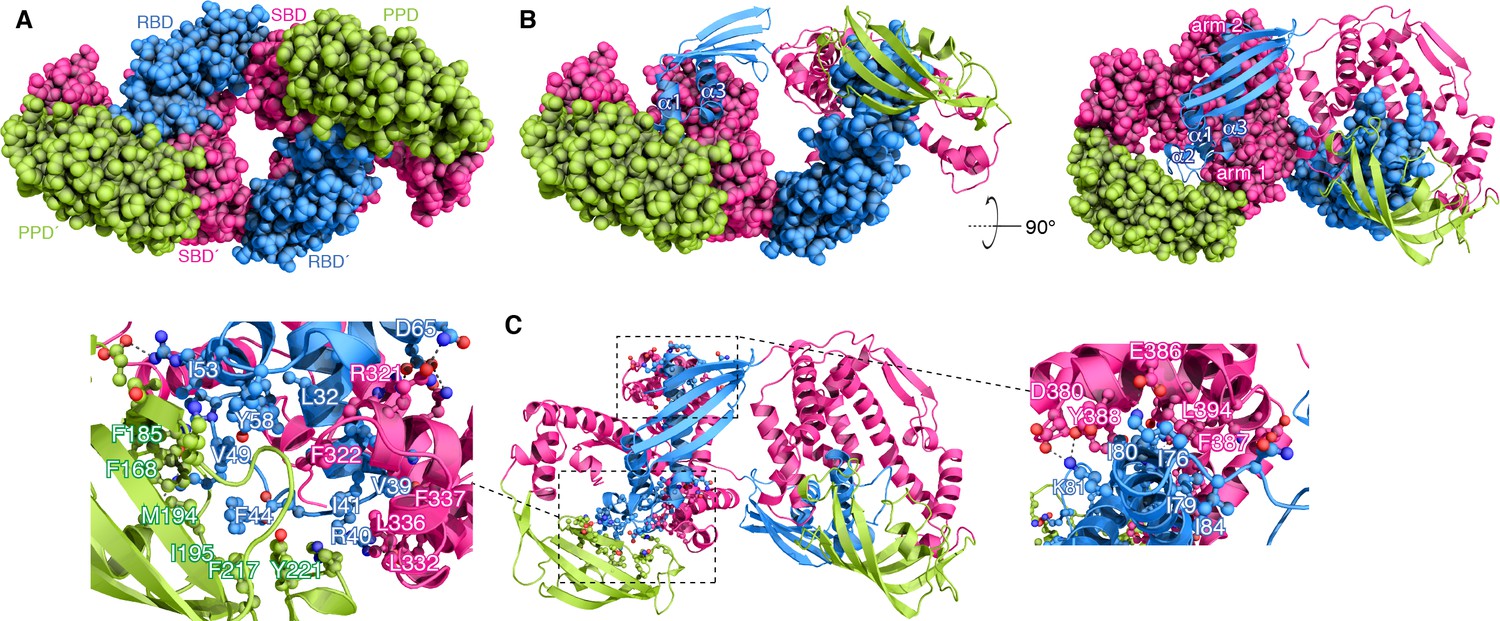
Structural basis for TF dimerization.
(A) The lowest-energy structure of the TF dimer is shown as space-filling model. TF forms a dimer in a head-to-tail orientation. RBD, SBD, and PPD are shown in blue, magenta, and green, respectively. (B) One of the TF subunits is shown as space-filling model and the other subunit shown in ribbon. The helices of the RBD and the two arm regions are labeled. (C) Expanded views of the dimeric interfaces highlighting contacts between the two subunits. Residues involved in mediating dimerization are shown as ball-and-stick.
Figure 2—figure supplement 1

NMR of dimeric TF.
(A) 1H–13C methyl HMQC spectrum of [U-2H; Ala-13CH3; Met-13CH3; Ile-δ1-13CH3; Leu,Val-13CH3/13CH3; Thr-13CH3]-labelled TF. (B) TF is enriched in hydrophobic amino acids, such as methyl-bearing (Ala, Ile, Leu, Met, Thr and Val) and aromatic (Phe, Tyr and Trp).
Figure 2—figure supplement 2
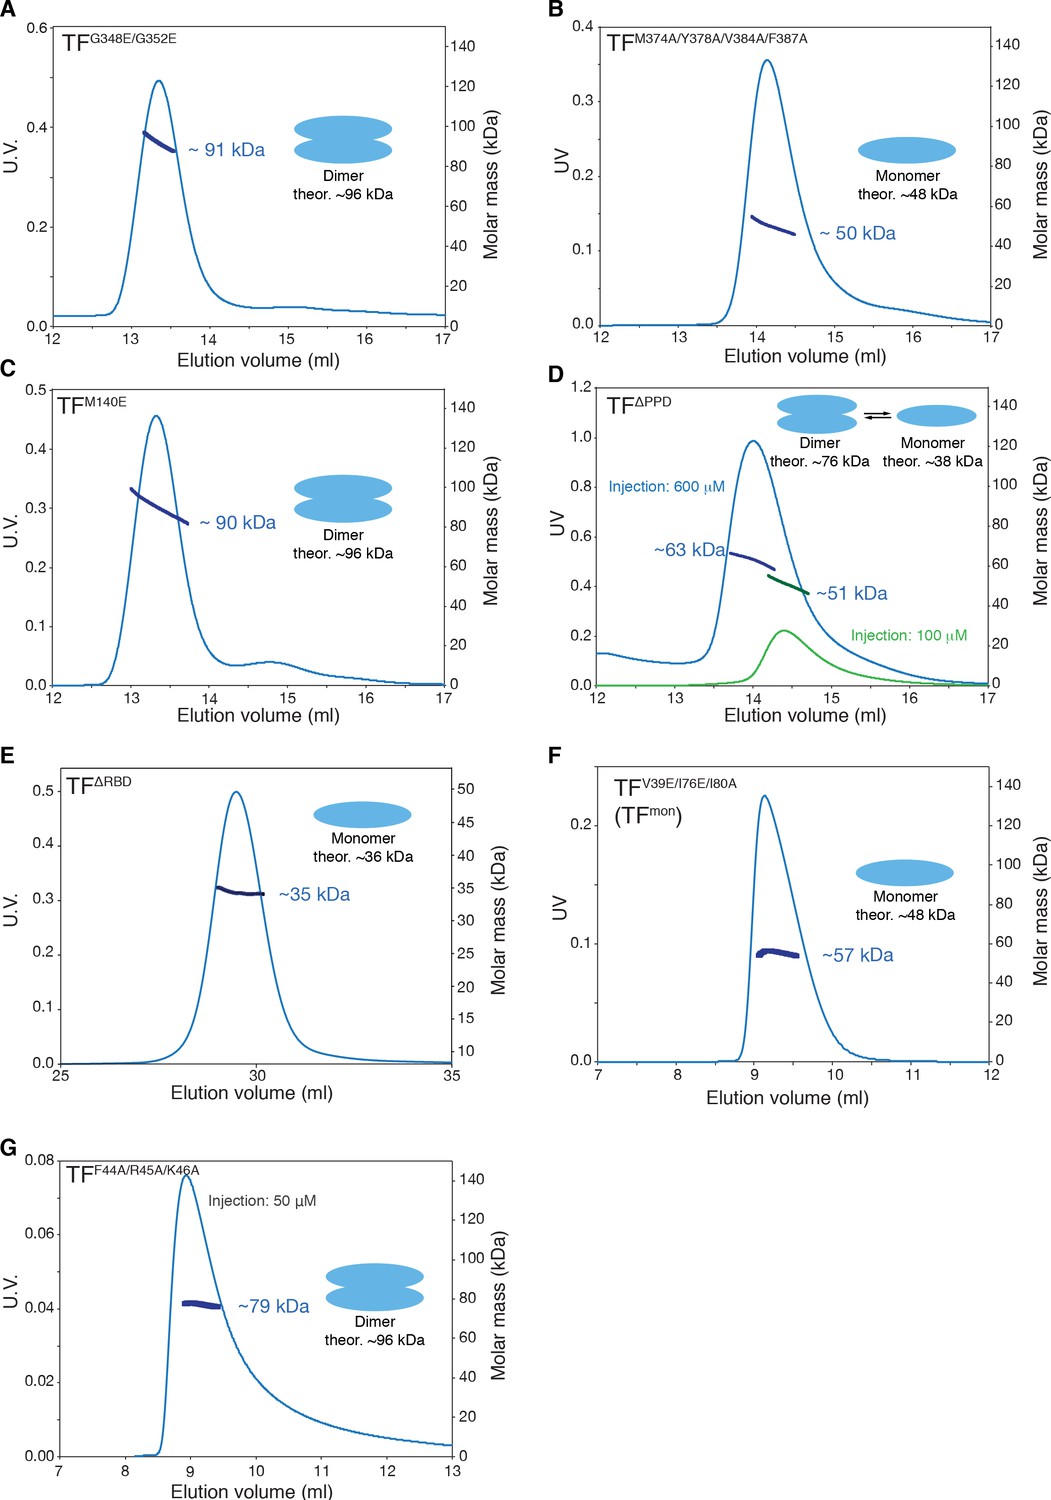
SEC-MALS of TF mutants.
SEC-MALS profiles of TFG348E/G352E (A), TFM374A/Y378A/V384A/F387A (B), TFM140E (C), TFΔPPD (D), TFΔRBD (E), TFV39E/I76E/I80A (TFmon) (F), and TFF44A/R45A/K46A (G) are shown. Proteins were injected at the concentration of 100 μM unless otherwise stated. TFG348E/G352E, TFM374A/Y378A/V384A/F387A, and TFM140E have mutations on the substrate-binding site A, B, and D, respectively. TFF44A/R45A/K46A has mutation at the ribosome-binding loop containing the signature motif. Destabilization of the dimer by the introduction of mutations on the substrate-binding site B as well as by deletion of PPD containing site E supports the engagement of these substrate-binding sites in the dimerization (Figure 3B). Moderate effect of the deletion of PPD to dimerization implies that the contribution of the interaction between PPD and RBD in the formation of the dimer is less significant and is auxiliary. The mutations in the signature motif have little effect to the dimer formation, which is consistent with the fact that only a part of the ribosome-binding loop is involved in the dimer formation and the rest is floating in the cavity formed by PPD and SBD (Figure 3—figure supplement 1A and B).
Figure 2—figure supplement 3
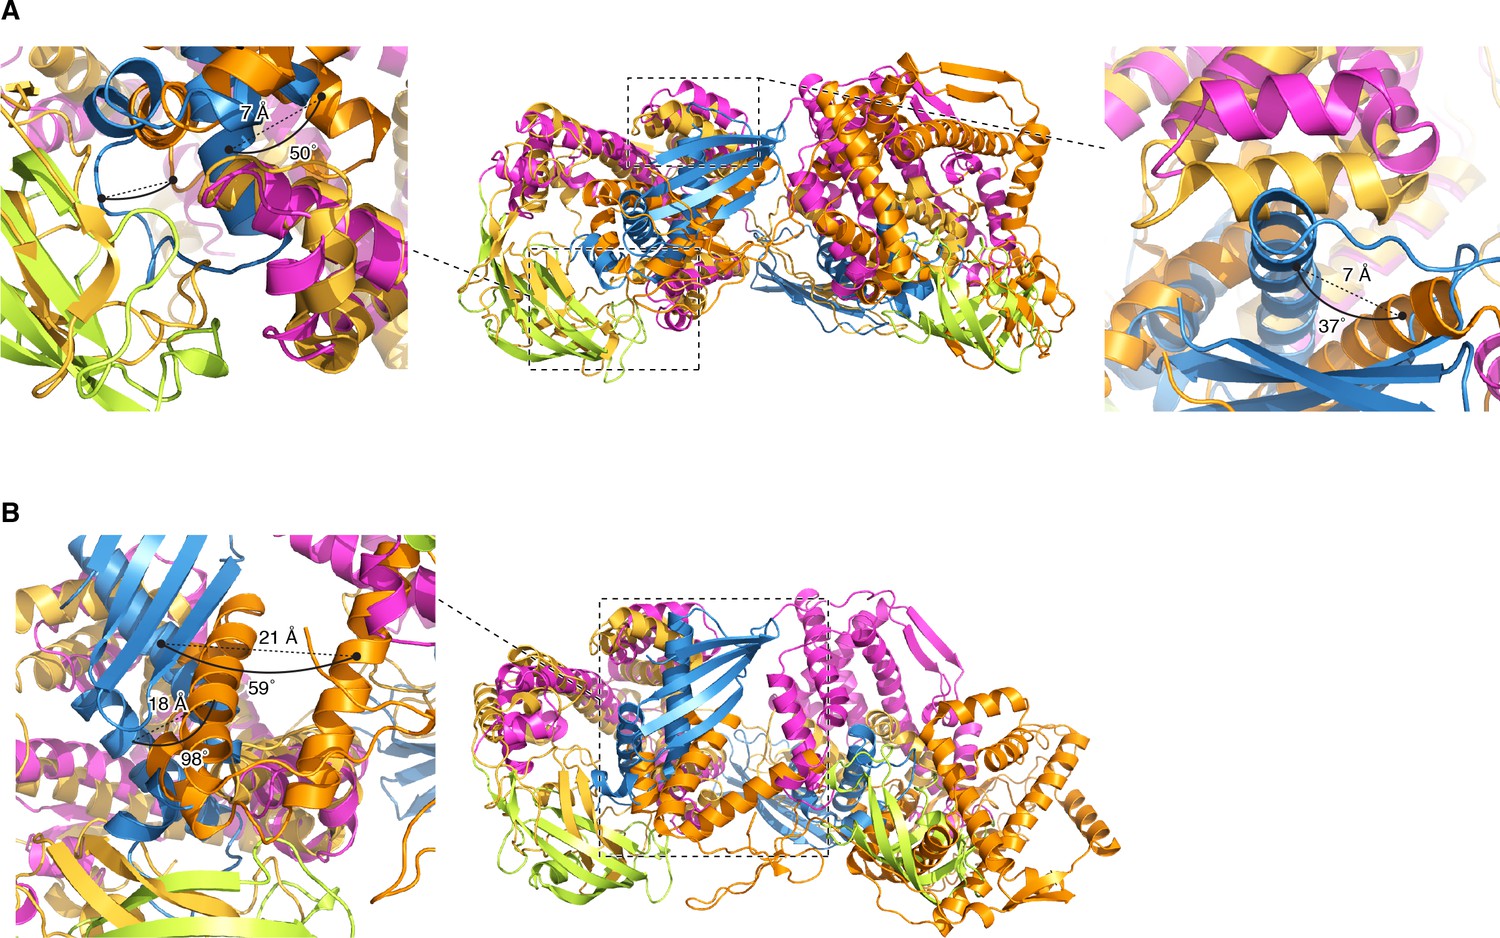
Comparison with PRE-based docking models.
The structure of TF dimer superimposed with previously reported PRE-based docking models (Morgado et al., 2017); conformer 1 [PDB code: 5OWI] (A), and conformer 2 [PDB code: 5OWJ] (B). PPD, SBD, and RBD in the structure of TF dimer are shown in green, pink, and blue, respectively. The docking model is shown in orange and gold. The coordinates are superimposed on the backbone heavy atoms of SBD. Differences in rotation and translation of the helices in RBD between the previously reported PRE-based docking model and the current dimer structure are indicated. Most of the contacts, which are seen in the current structure of the TF dimer and were validated by mutagenesis and chemical shift perturbation mapping, are not present in the PRE-based models. In the PRE-derived conformer 1, RBD makes contacts with the arm 1 and the PPD of the other subunit, which were also seen in the current dimer TF structure. However, in the PRE-derived conformer 1 the RBD makes no significant contacts with the arm 2, which is not consistent with the significant effect that mutations in the arm 2 have on the dimerization as shown by SEC-MALS (Figure 2—figure supplement 2B). The PRE-derived conformer 2 has RBD snagged on the tips of the arm 1 and arm 2, as well as on the edge of PPD. A very small overlap between the substrate-binding sites and the dimer interface is seen in the PRE-derived conformer 2. In contrast, in the current structure of TF dimer, RBD is buried inside the cradle formed by SBD and PPD of the other subunit, thus explaining why the TF dimer dissociates upon binding to the substrate protein (Figure 1—figure supplement 1A,E and F). In addition to the significant differences in the overall domain orientation between the PRE-derived models and the current TF structure, the RBD structure itself appears to be loosely packed in the PRE-derived models.
Figure 2—figure supplement 4
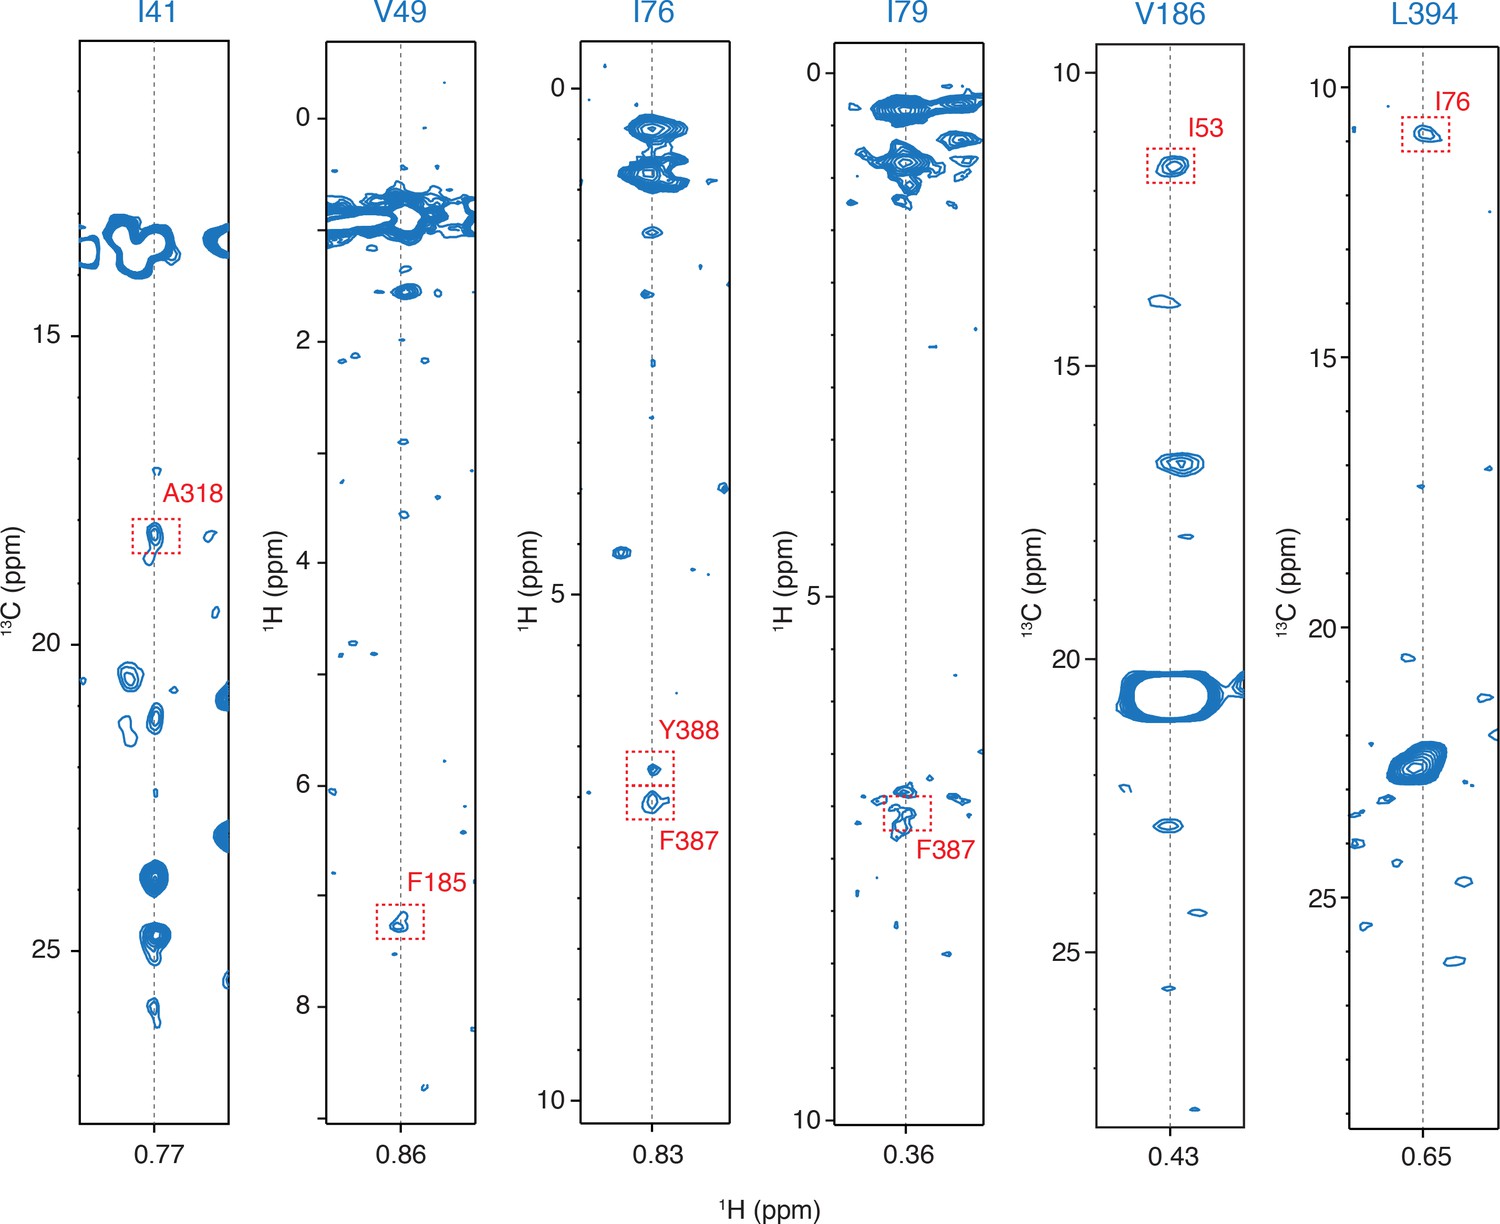
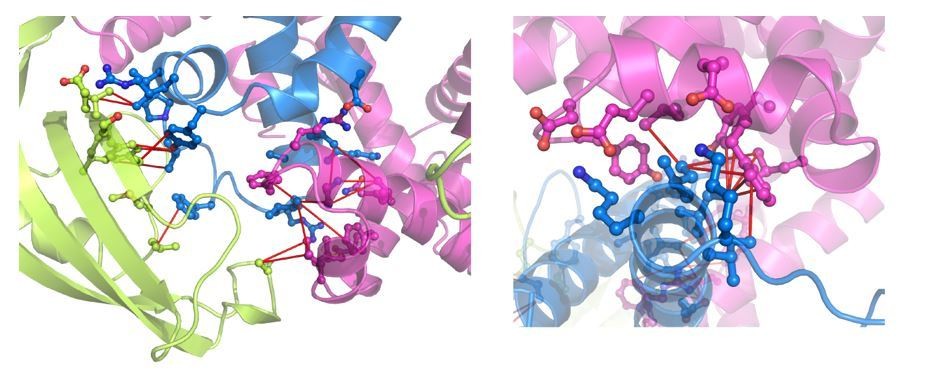
Examples of the inter-molecular NOEs.
Representative strips from 13C-edited NOESY-HMQC and HMQC-NOESY-HMQC NMR experiments. The intermolecular NOE cross peaks are designated by a dashed-line red rectangle.
Figure 3 with 2 supplements
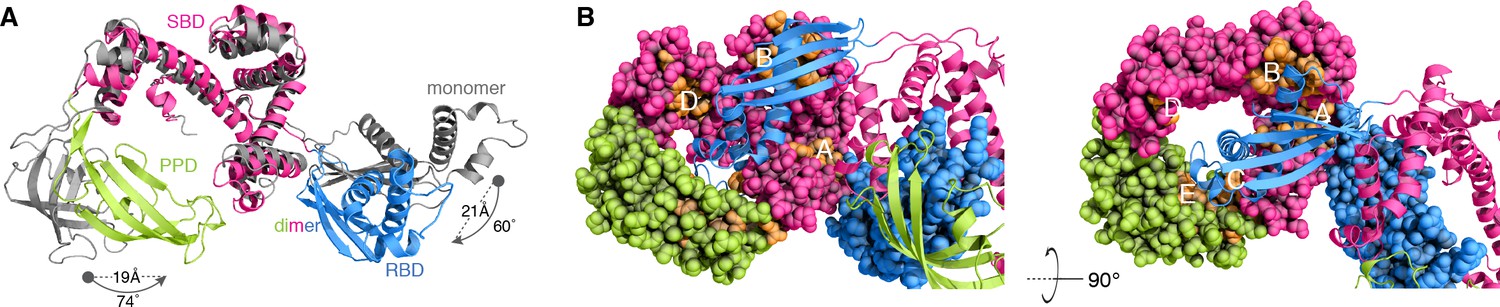
Conformational changes of TF upon dimerization.
(A) The structure of one subunit in the TF dimer (colored as in Figure 1A) and the crystal structure of monomeric TF (colored grey) [Protein Data Bank (PDB) code: 1W26] are superimposed for SBD. The changes in rotation and translation of the RBD and PPD between the monomer and the dimer are indicated. (B) View of the structure of dimeric TF highlighting the positioning of the substrate-binding sites (colored orange). The five main substrate-binding sites are labeled A, B, C, D, and E.
Figure 3—figure supplement 1

The ribosome-binding loop in the TF dimer.
Close-up view of the ribosome-binding loop in the TF dimer (A) or TF in complex with the ribosome (PDB ID: 1W2B) (B). The amino acid residues of the ribosome-binding loop involved in the interaction are shown in ball-and-stick. PPD, SBD, and RBD are shown in green, pink, and blue, respectively. The ribosome is represented as yellow surface model. (C) ITC traces of the titration of TF (right) and RBD (left) to the ribosome. Titration of RBD indicated slightly stronger affinity than that of TF, which is consistent with the fact that RBD is responsible for the binding to the ribosome and the ribosome-binding loop is protected in the TF dimer. The experiments were performed at 22°C.
Figure 3—figure supplement 2
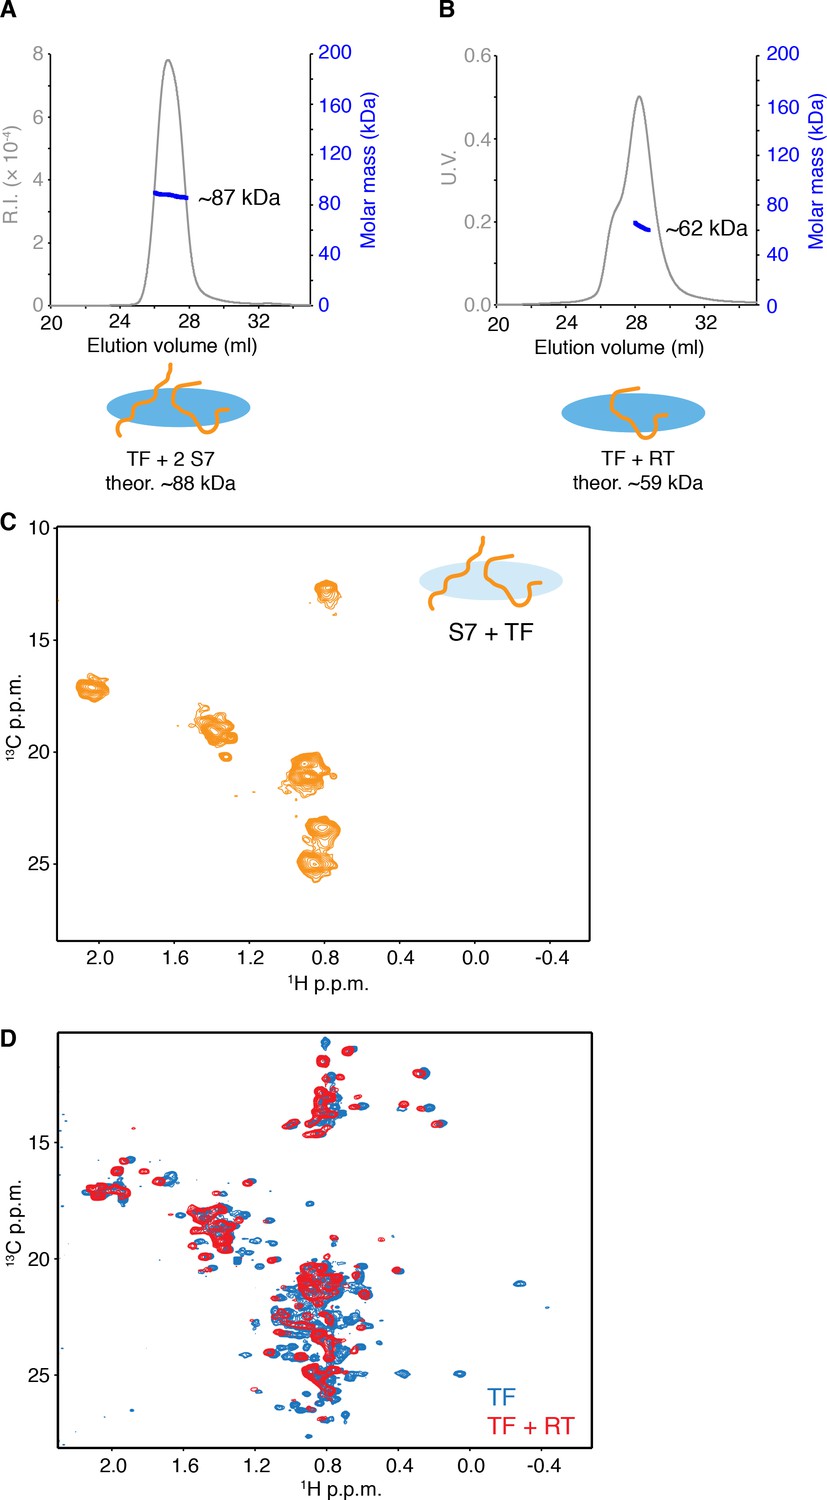
Characterization of small substrate proteins in complex with TF.
(A) SEC-MALS of E. coli S7 in complex with TF indicating two S7 molecules bind to the monomer of TF. (B) SEC-MALS of E. coli reverse transcriptase (RT)-Ec86 255–320 in complex with TF indicating one RT molecule binds to the monomer of TF. Unliganded dimeric TF eluted before TF-RT complex, resulting in a shoulder on the left side of the main peak. (C) 1H-13C methyl HMQC of [U-2H; Met-13CH3; Ala-13CH3; Ile-δ1-13CH3; Leu,Val-13CH3/13CH3]-labeled S7 in complex with unlabeled TF showing narrow dispersion of the resonances of methyl groups in S7. (D) Overlay of 1H-13C methyl HMQC of [U-2H; Met-13CH3; Ala-13CH3; Ile-δ1-13CH3; Leu,Val-13CH3/13CH3]-labeled TF (blue) and TF-RT complex (red). Several resonances that broaden out in complex with RT are located at the substrate-binding sites on TF. Most of the dispersed resonances observed in the spectrum of TF-RT complex match to the resonances of TF and no dispersed resonances are found for RT, which suggests that RT in complex with TF does not form a folded structure. The results indicate that both of RT and S7 binds to monomeric TF as an unfolded state, although the possibility of the existence of minor folded population cannot be excluded.
Figure 4 with 2 supplements
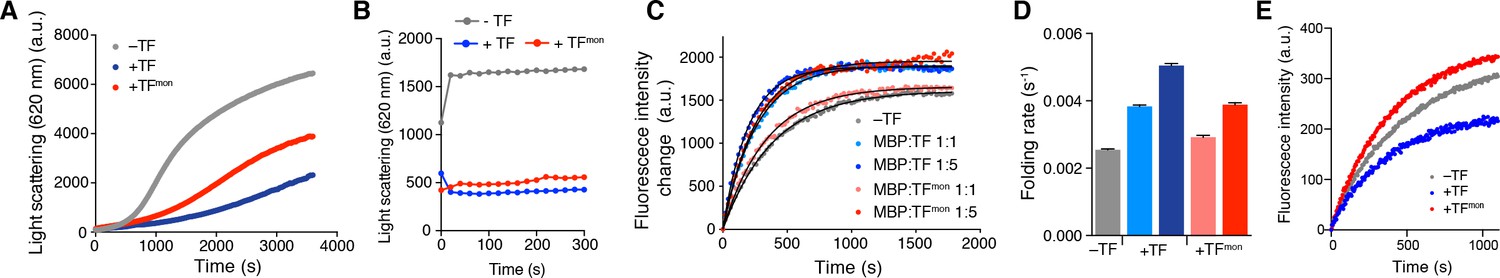
Effect of TF dimerization on chaperone activities.
Aggregation of GAPDH in the absence or presence of TF and TFmon at 0.5 μM (A) and OmpA in the absence or presence of TF and TFmon at 4 μM (B). (C) Refolding of MBP in the absence or presence of TF and TFmon. The solid line represents the fit of the data to a single exponential function. (D) Folding rates of MBP from the analysis of the curves shown in panel C. (E) Refolding of the slowly-folding MBPY283D variant in the absence or presence of TF and TFmon.
Figure 4—figure supplement 1

Aggregation of GAPDH in the absence or presence of 1 µM TF and TFmon.
The aggregation of GAPDH was monitored by 90° light scattering at 620 nm.
Figure 4—figure supplement 2
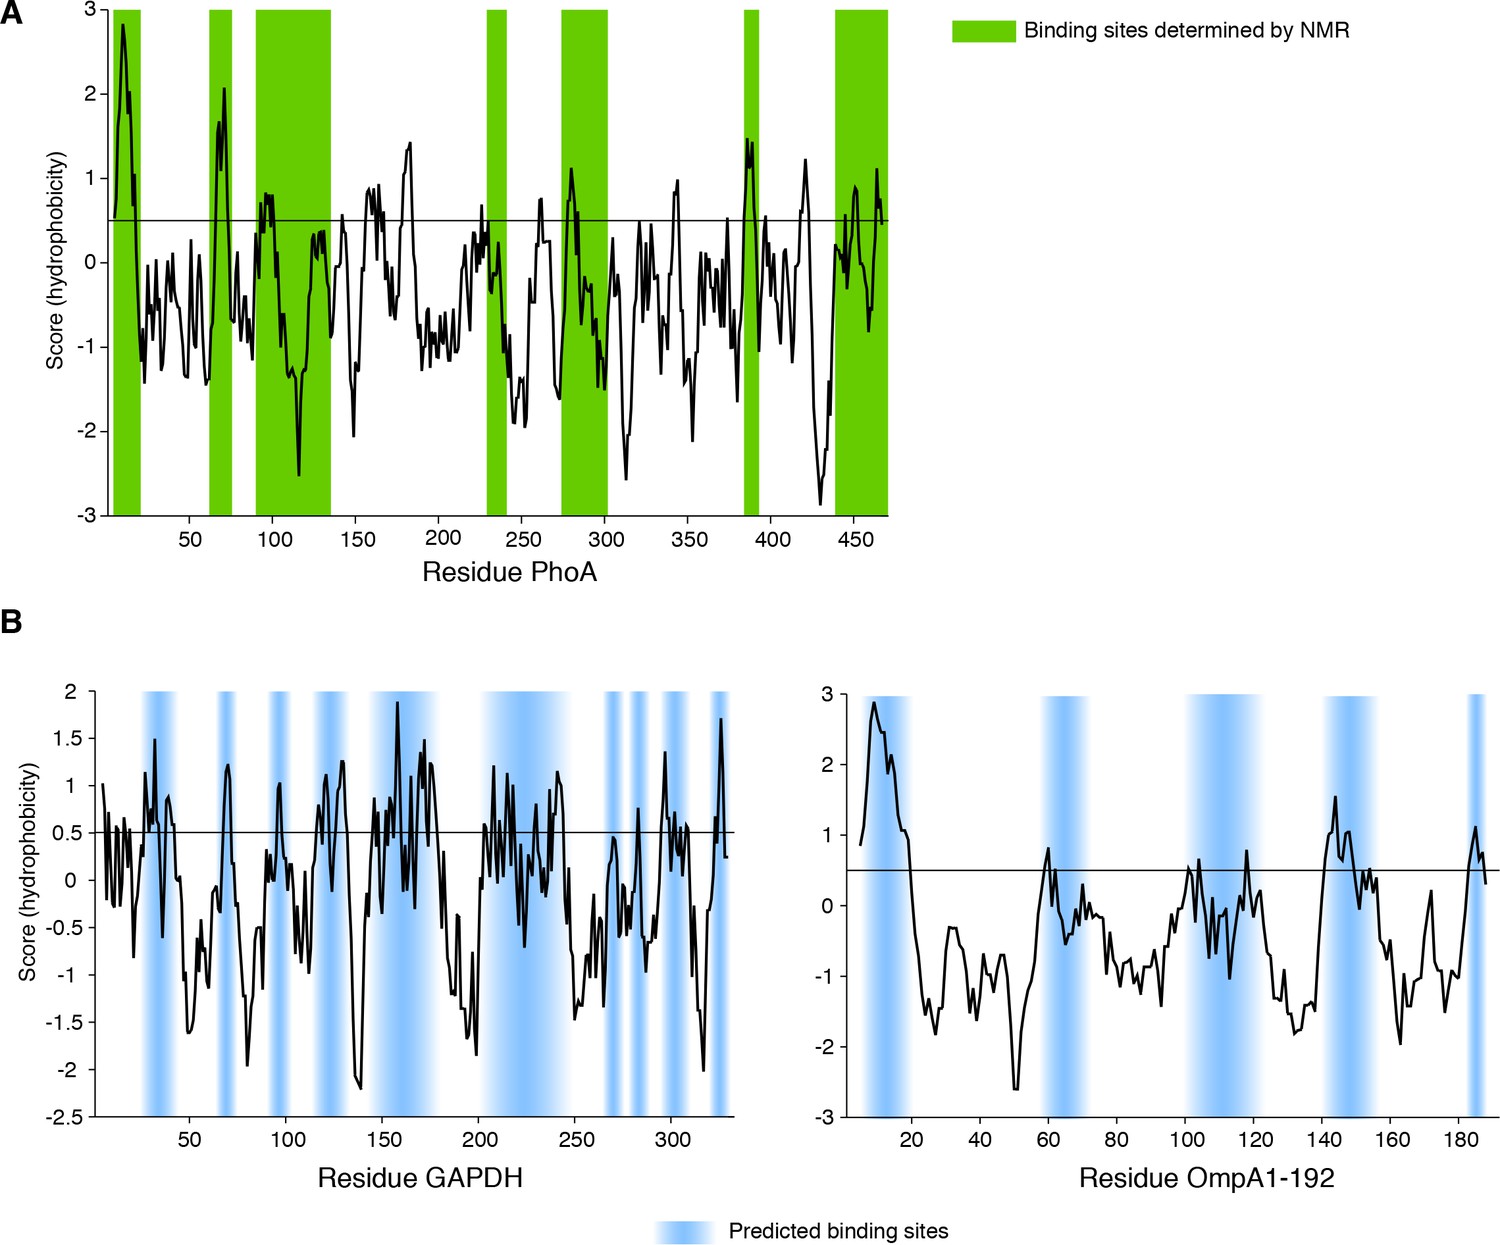
Sequence hydrophobicity of the substrate proteins of TF (Roseman algorithm, window = 9).
(A) Hydrophobicity plot of PhoA as a function of its primary sequence. TF-binding sites determined by NMR (Saio et al., 2014) are highlighted in green. (B) Hydrophobicity plot of GAPDH (left panel) and OmpA1-192 (right panel) as a function of their primary sequences. The hydrophobic stretches that are expected to bind to TF are highlighted in light blue.
Figure 5 with 2 supplements

Effect of TF dimerization on binding kinetics.
(A) Association of unfolded PhoA with TF monitored by tryptophan fluorescence. (B) Fitting of the data for the association of PhoA with TF by a single exponential function (gray line) or the sum of two exponential functions (black line), indicating that two exponential functions are required to fit the data. (C) Plots of the observed rate constant (kobs) as a function of the concentration of the dimer (left) and the monomer (right) of TF. (D) Association of PhoA with TFmon monitored by tryptophan fluorescence. (E) Plot of the observed rate constant (kobs) as a function of the concentration of monomeric TF.
Figure 5—figure supplement 1

ITC traces of the titration of unfolded proteins to TF.
ITC traces of the titration of PhoA220-310 (A) into TF (left panel), TFmon (middle panel), and TFΔRBD (right panel), or MBP198-265 (B) into TF (left panel) and TFΔRBD (right panel), Monomeric variants of TF indicated stronger affinity to the unfolded substrates, which is consistent with the fact that the three of the substrate-binding sites are buried in the dimer. The titration of PhoA220-310 and MBP198-265 were performed at 8°C and 22°C, respectively.
Figure 5—figure supplement 2
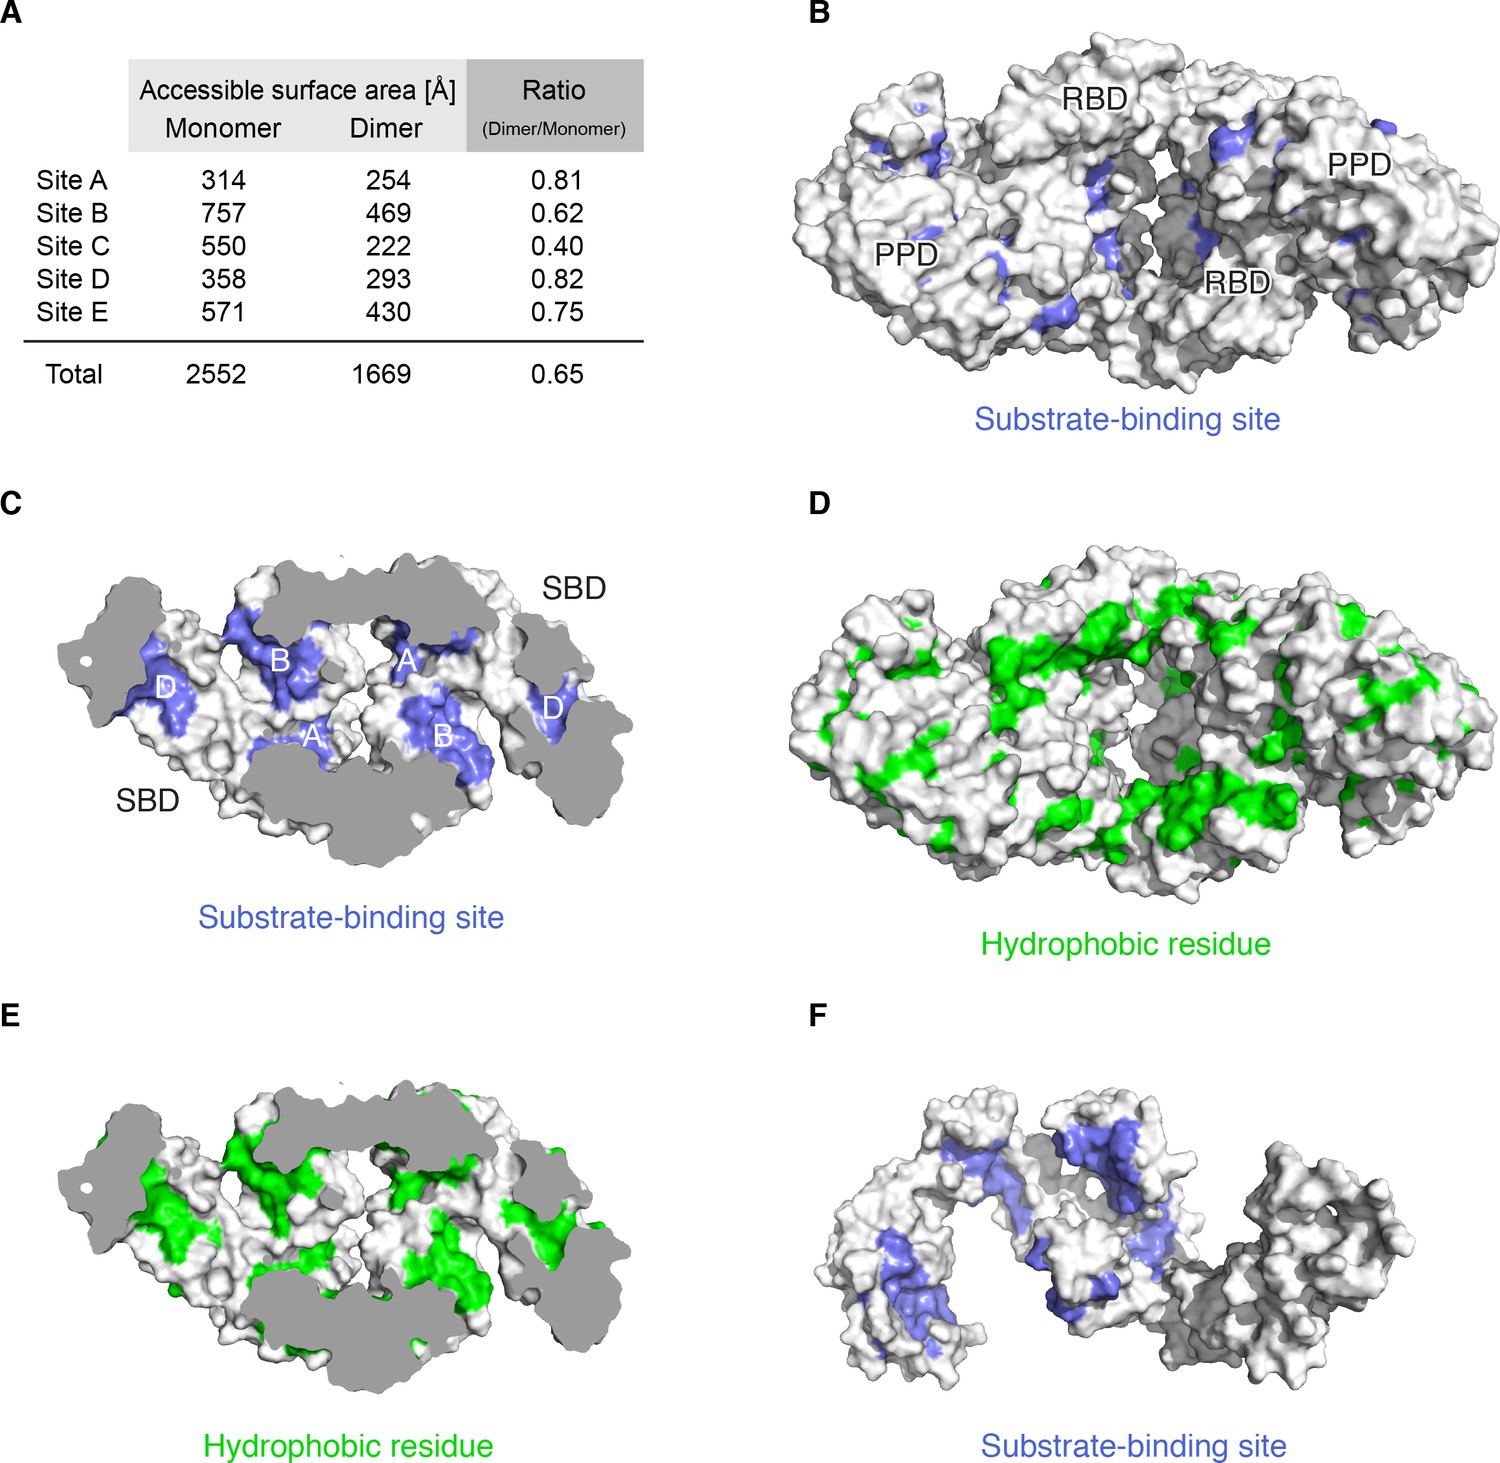
Substrate-binding sites in the dimer.
(A) Accessible surface area of the substrate-binding sites in monomeric and dimeric TF. (B) The residues identified by NMR to interact with unfolded MBP are colored blue on the surface of TF dimer. (C) Cut-away view of the TF dimer with the mapping of substrate-binding sites as in the panel B. Substrate-binding sites A, B and D are assembled on the inner surface of the cavity in the dimer, forming a single broad substrate-binding site. (D) Mapping of hydrophobic residues colored green on the surface of TF dimer. The pore of the dimer is paved with a large hydrophobic surface on RBD that leads into the cavity. (E) Cut-away view of the TF dimer with the mapping of hydrophobic residues as in the panel D. (F) The mapping of the substrate-binding sites colored blue on the surface of the crystal structure of monomeric TF [PDB code: 1W26].
Figure 6
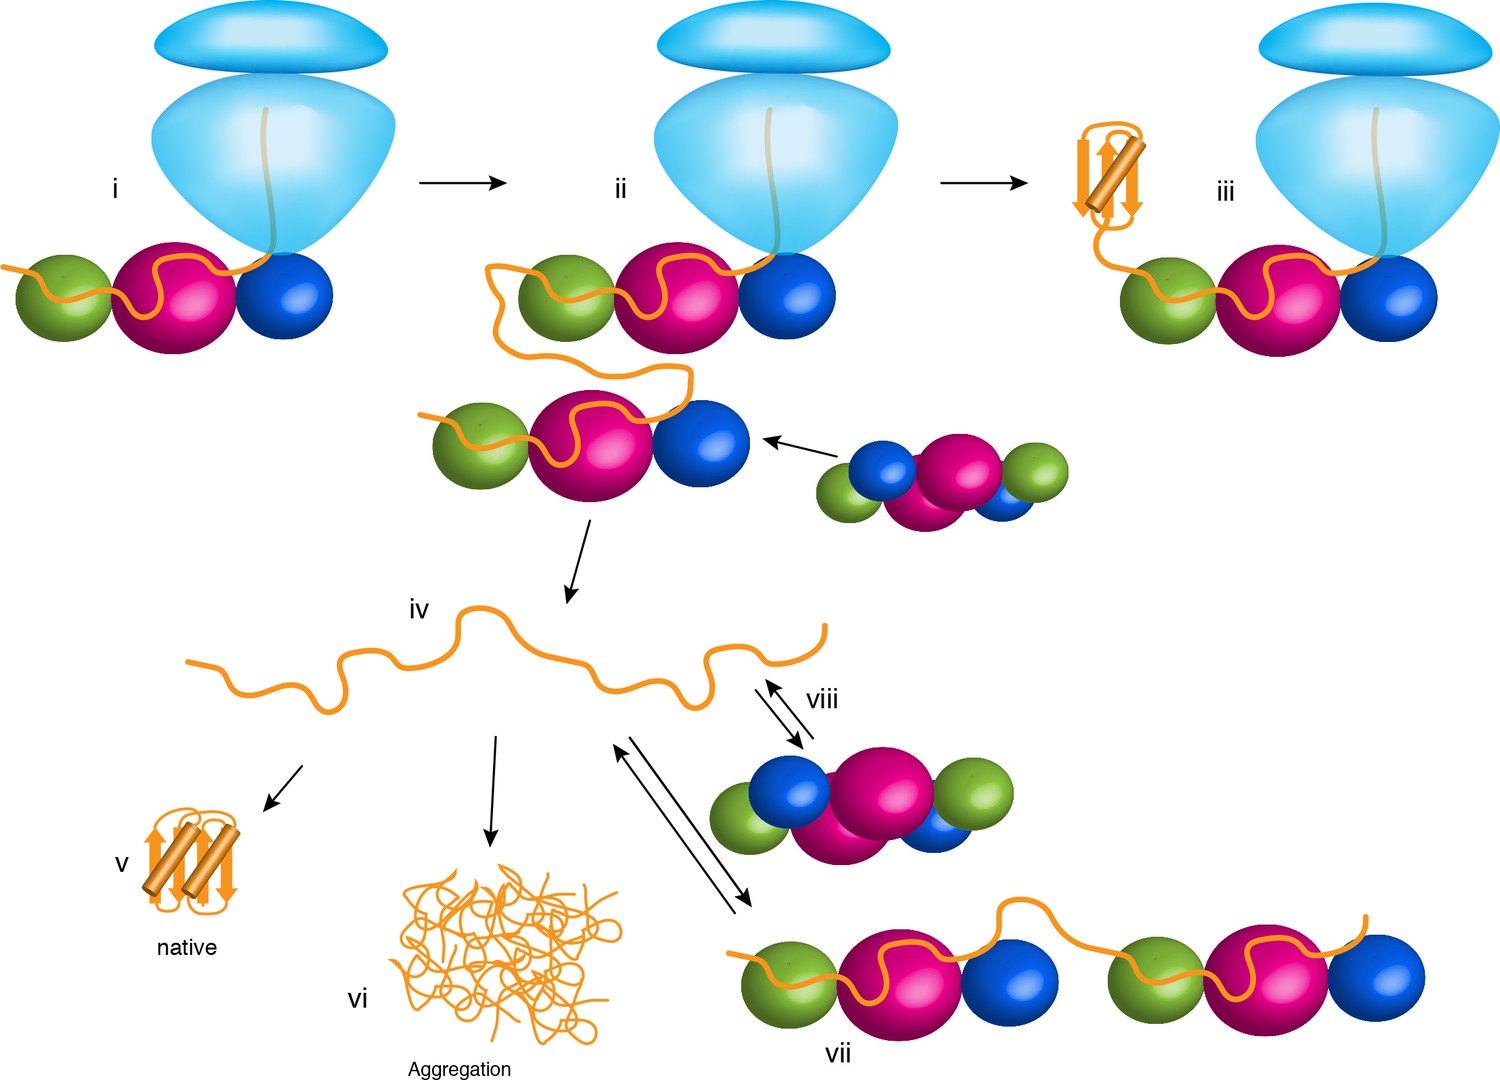
Chaperone activities of TF in the cell.
The ribosome is shown in light blue. The protein substrate is shown in orange, and TF is represented as spheres with the subunits colored as in Figure 2A. See text for details.
Author response image 1
NOE mapping for the interfaces for PPD-RBD and Arm1-RBD (left panel) and Arm2-RBD.
The intermolecular NOEs are indicated by red lines. TF domains are colored as in Figure 2.
Tables
Table 1
Structural and NMR statistics of TF dimer.
https://doi.org/10.7554/eLife.35731.004| Distance restraints* | |
|---|---|
| NOEs | |
| Short range (intraresidue and sequential) | 870 |
| Medium range (2 < | i-j | < 5) | 467 |
| Long range ( | i-j | > 5 ) | 1230 |
| Intermolecular | 54 |
| Hydrogen bonds | 374 |
| Dihedral angle restraints (cp and | 1358 |
| Violations (mean and SD)* | |
| Distance restraints (A) | 0.005 ± 0.025 |
| Dihedral angle restraints (°) | 0.02 ± |
| 0.23 | |
| Structural coordinates rmsd* | |
| RBD core (1-39, 51-112) | |
| Chain A | |
| Backbone atoms | 1.50 ± 0. A |
| All heavy atoms | 2.04 ± 0.29 A |
| Chain B | |
| Backbone atoms | 1.56 ± 0.41 A |
| All heavy atoms | 2.07 ± 0.38 A |
| PPD core (157-190,195-241) | |
| Chain A | |
| Backbone atoms | 0.87 ± 0.09 A |
| All heavy atoms | 1.38 ± 0.07 A |
| Chain B | |
| Backbone atoms | 0.82 ± 0.14 A |
| All heavy atoms | 1.30 ± 0.11 A |
| SBD core (115-149, 250-321, 329-428) | |
| Chain A | |
| Backbone atoms | 1.40 ± 0.21A |
| All heavy atoms | 2.17 ± 0.23 A |
| Chain B | |
| Backbone atoms | 1.34 ± 0.16A |
| All heavy atoms | 2.14 ± 0.20 A |
| Ramachandran plot* | |
| Most-favored regions | 85.4% |
| Additionally allowed regions | 14.3% |
| Generously allowed regions | 0.3% |
| Disallowed regions | 0.0% |
-
*The statistics apply to the 20 lowest-energy structures.
Key resources table
| Reagent type (species) or resource | Designation | Source or reference | Identifiers |
|---|---|---|---|
| Strain, strain background (E. coli) | BL21 (DE3) | NIPPON GENE CO., LTD. | ECOS Competent E. coli BL21 (DE3) |
| Recombinant DNA reagent | PhoA | Saio et al. (2014),PMID: 24812405 | NCBIGene:945041 |
| Recombinant DNA reagent | OmpA | Tsirigotaki et al., (2018),PMID: 29606594 | NCBIGene:945571 |
| Recombinant DNA reagent | RT | Inouye et al., (1999),PMID: 10531319 | UniProtKB: P23070 |
| Recombinant DNA reagent | MBP | Huang et al. (2016), PMID: 27501151 | NCBIGene: 948538 |
| Recombinant DNA reagent | TF | Takara Bio inc. | pCold-TF (TKR 3365) |
| S7 | S7 | GenScript | Gene synthesis |
| Peptide, recombinant protein | GAPDH | Sigma-Aldrich | G-2267 |
| Software, algorithm | CYANA3.97 | Güntert (2004),PMID: 15318003 | RRID:SCR_014229 |
| Software, algorithm | CNS | Brunger (2007), PMID: 18007608 | RRID:SCR_014223 |
Additional files
-
Transparent reporting form
- https://doi.org/10.7554/eLife.35731.020
Download links
A two-part list of links to download the article, or parts of the article, in various formats.
Downloads (link to download the article as PDF)
Open citations (links to open the citations from this article in various online reference manager services)
Cite this article (links to download the citations from this article in formats compatible with various reference manager tools)
Oligomerization of a molecular chaperone modulates its activity
eLife 7:e35731.
https://doi.org/10.7554/eLife.35731


