A promoter interaction map for cardiovascular disease genetics
- The University of Chicago, United States
- Northwestern University Feinberg School of Medicine, United States
Figures
Figure 1 with 3 supplements
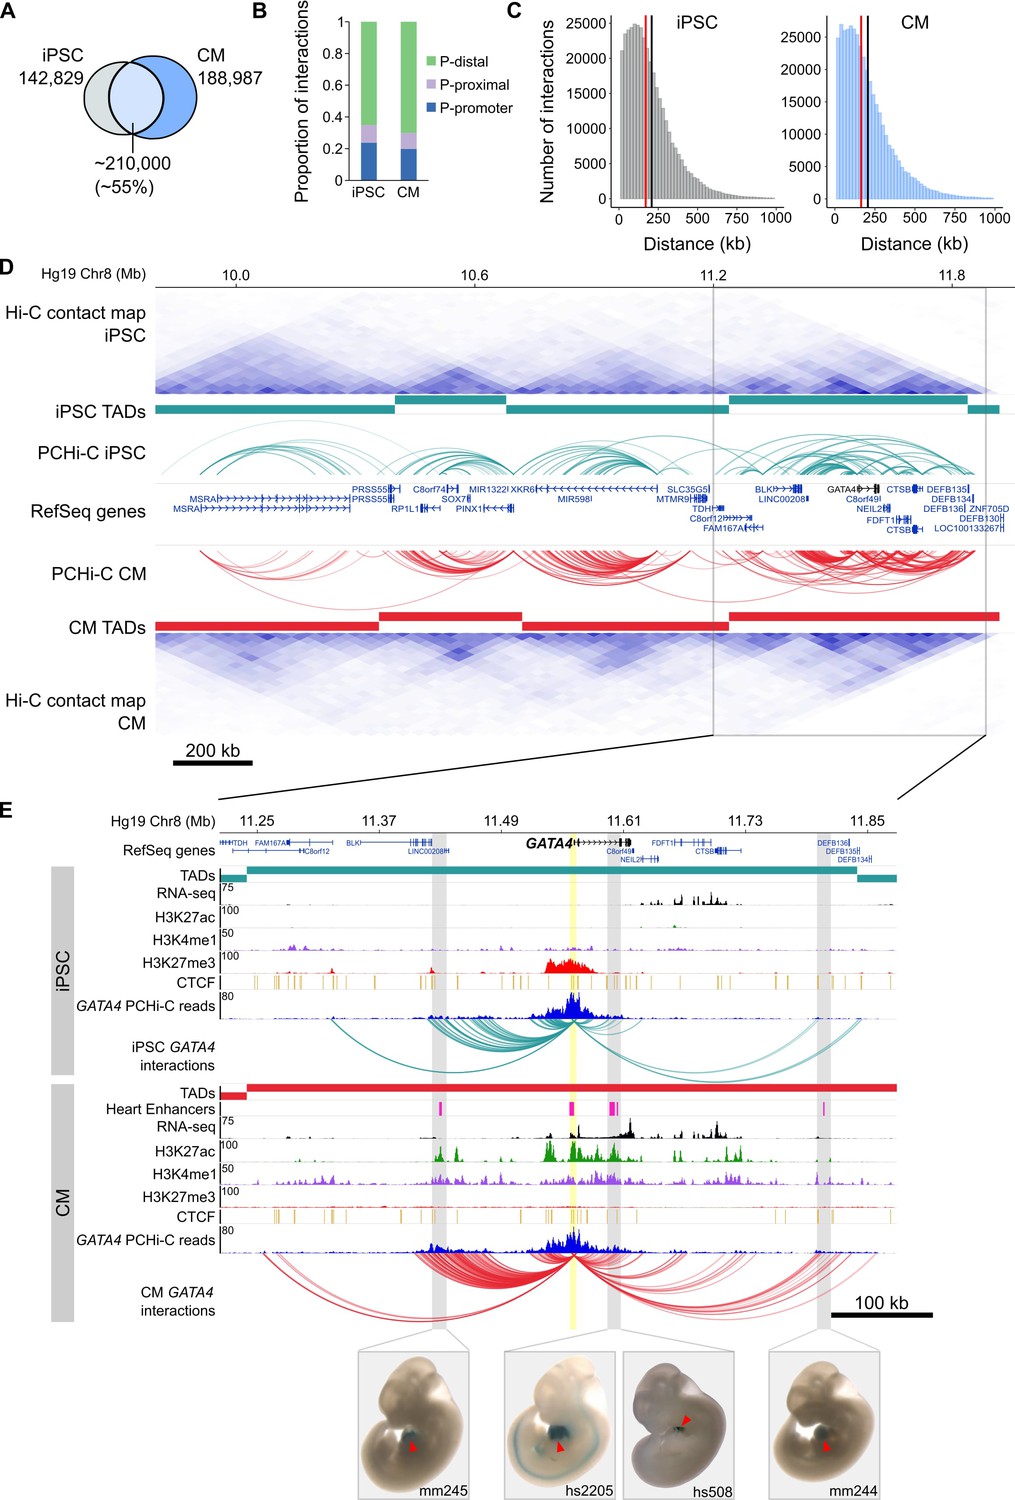
General features of promoter interactions.
(A) Venn diagram displaying the number of cell-type-specific and shared promoter interactions in each cell type. (B) Proportion of interactions in each distance category: promoter (P)-promoter (both interacting ends overlap a transcription start site (TSS)); P-proximal (non-promoter end overlaps captured region but not the TSS); P-distal (non-promoter end is outside of captured region). Note that all promoter interactions are separated by at least 10 kb. (C) Distribution of the distances spanning each interaction in iPSCs and CMs. The red line depicts the median (170 kb in iPSCs, 164 kb in CMs); the black line depicts the mean (208 kb in iPSCs, 206 kb in CMs). (D) A ~ 2 Mb region of chromosome 8 encompassing the GATA4 gene is shown along with pre-capture (whole genome) Hi-C interaction maps at 40 kb resolution for iPSCs (top) and CMs (bottom). TADs called with TopDom are shown as colored bars (median TAD size = 640 kb in both cell types, mean TAD size = 742 kb in iPSCs and 743 kb in CMs) and significant PCHi-C interactions as colored arcs. (E) Zoomed-in view of the GATA4 locus (promoter highlighted in yellow) in iPSCs (top) and CMs (bottom) along with corresponding RNA-seq data generated as part of this study, and ChIP-seq data for H3K27ac, H3K4me1, H3K27me3 and CTCF from the Epigenome Roadmap Project/ENCODE (H1 and left ventricle for iPSC and CM, respectively). Filtered GATA4 read counts used by CHiCAGO are displayed in blue with the corresponding significant interactions shown as arcs. For clarity, only GATA4 interactions are shown. Gray highlighted regions show interactions overlapping in vivo validated heart enhancers (pink boxes), with representative E11.5 embryos for each enhancer element (Visel et al., 2007). Red arrowhead points to the heart.
Figure 1—figure supplement 1
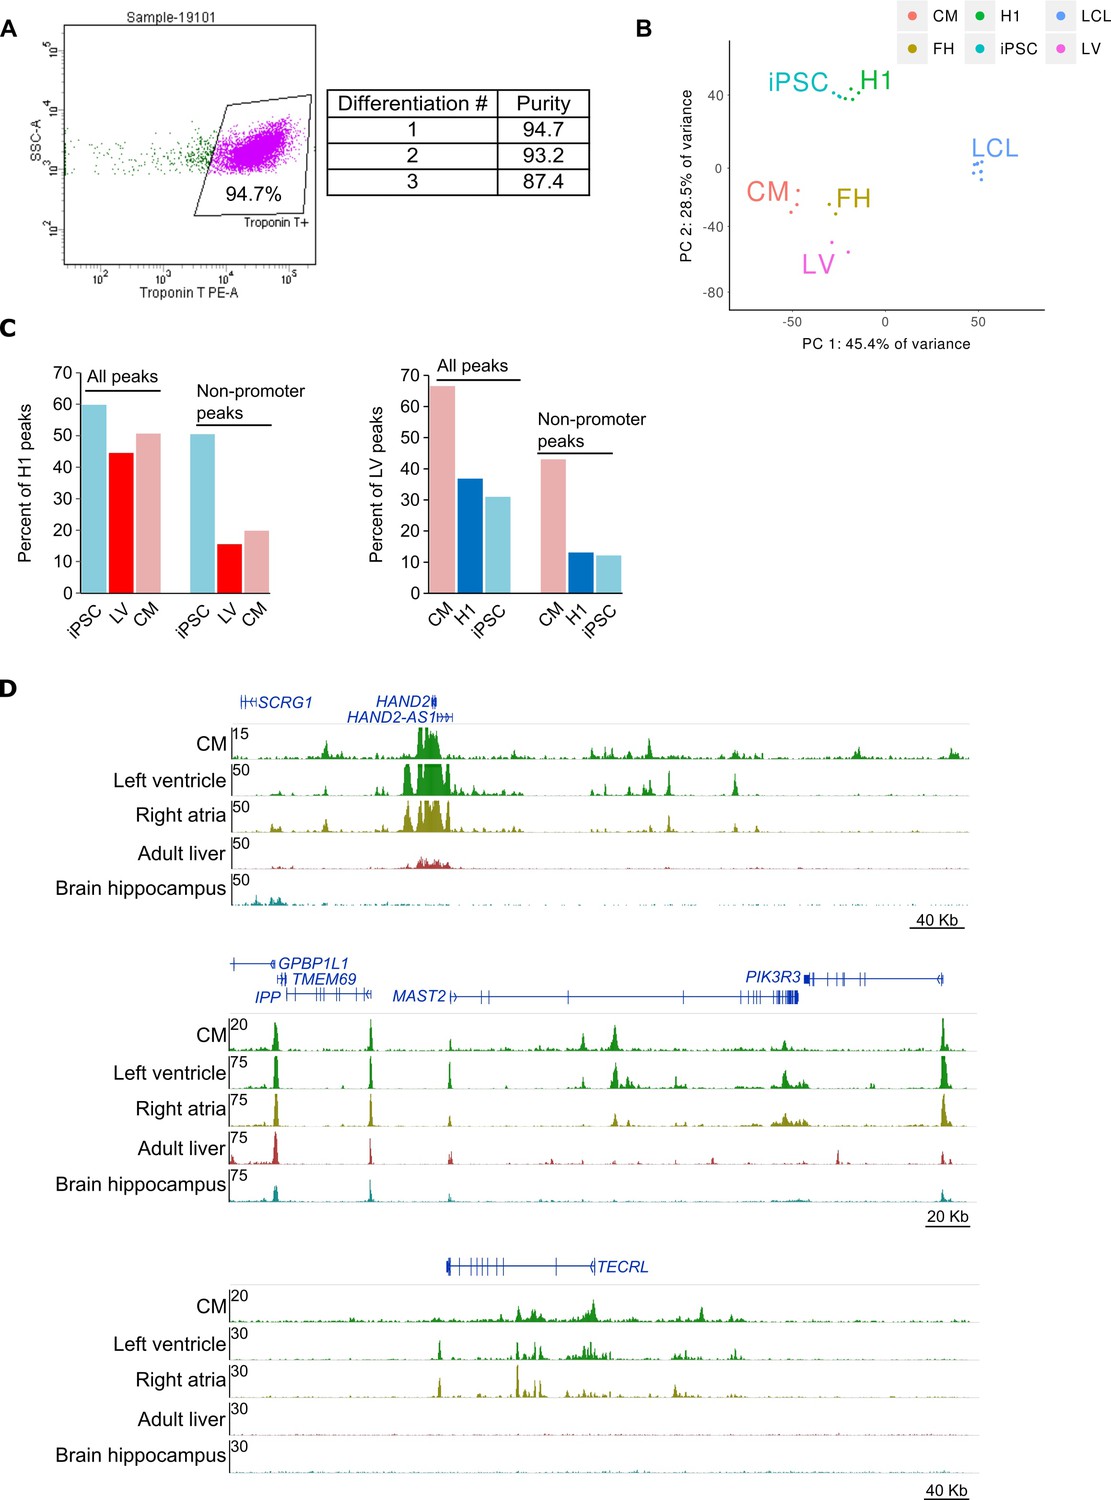
Quality control of iPSC-CMs.
(A) Flow cytometry of iPSC-derived cardiomyocytes. Representative image of flow data for cardiomyocytes (left) and percent cardiac troponin T (cTnT) positive for each differentiation (right). Cells were first gated on live/dead and then on cTnT staining. (B) Principle component analysis of RNA-seq data in iPSCs and CMs along with H1 embryonic stem cells, left ventricular cells (LV), fetal heart cells (FH), and lymphoblastoid cell line cells (LCL). LCLs cluster independently from iPSC and CM, indicating that iPSCs were faithfully reprogrammed. (C) Percentage of Epigenome Roadmap H3K27ac ChIP-seq peaks overlapping iPSC and CM H3K27ac peaks. Overlaps for all peaks and only non-promoter peaks are shown. LV, left ventricle; H1, H1 embryonic stem cell line. (D) Three genome browser snap-shots displaying the epigenetic landscape in CMs compared to left ventricle, right atria, adult liver and brain hippocampus from the Epigenome Roadmap.
Figure 1—figure supplement 2
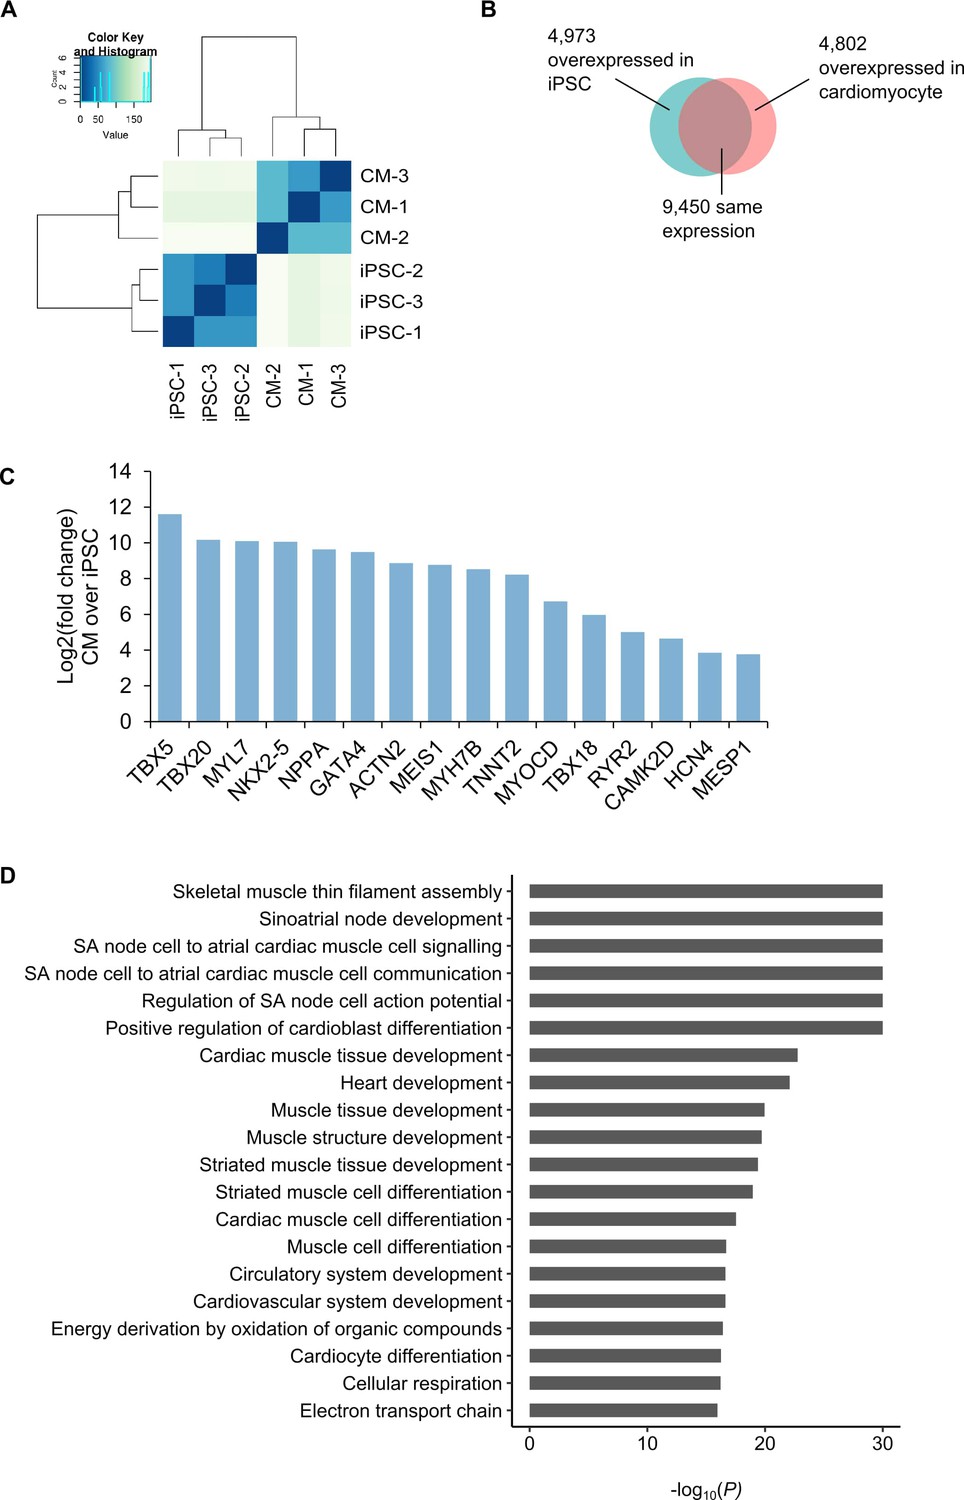
Analysis of RNA-seq in iPSCs and iPSC-CMs.
(A) Cluster analysis of RNA-seq data from each triplicate of iPSC and CM. (B) Number of genes differentially expressed in each cell type. (C) Selected genes overexpressed in CMs relative to iPSCs. (D) Gene Ontology enrichment analysis of the biological processes associated with the 4802 genes overexpressed in cardiomyocytes.
Figure 1—figure supplement 3

Analysis of PCHi-C interactions in the context of TADs.
In this analysis, interactions were classified as intra-TAD (both ends of the interaction fully within a single TAD) or inter-TAD (each end of the interaction is in a different TAD). Interactions falling partially or wholly within TAD ‘boundaries’ or ‘gaps’ as defined by TopDom were omitted (see Materials and methods). (A) Proportion of interactions that are intra-TAD at different cut-offs. All analyses used interactions that were 100% within a TAD. (B) Proportion of promoter-promoter interactions in the set of intra-TAD and inter-TAD interactions. (C,D) Fold enrichment for intra-TAD and inter-TAD interactions to overlap CTCF (C) or H3K27ac peaks (D). Only promoter-distal ChIP-seq peaks were analyzed. ***p<2.2 × 10⁻¹⁶, Z-test. (E) CHiCAGO score and (F) interaction span of intra- vs. inter-TAD interactions. ***p<2.2 × 10⁻¹⁶, Wilcoxon rank-sum test. (G,H) Considering promoters with an intra-TAD interaction, an inter-TAD interaction, or exclusively intra-TAD or inter-TAD interactions: (G) distance from the promoter TSS to the nearest TAD boundary and (H) average TPM value of the promoter. ***p<2.2 × 10⁻¹⁶, **p<0.01, *p<0.05, NS = not significant, Wilcoxon rank-sum test.
Figure 2

Transcription factor motif enrichment in distal interacting regions.
(A,B) Selected transcription factor (TF) motifs identified using HOMER in the promoter-distal interacting sequences for all over-expressed genes in (A) iPSCs and (B) CMs (fold change > 1.5, Padj < 0.05). ‘% sites’ refers to the percent of distal interactions overlapping the motif; rank is based on p-value significance. (C) To compare motif ranks across gene sets, the inverse of the rank is plotted for selected motifs identified in distal interactions from over- or under-expressed genes in both iPSCs and CMs. (D) The top 50 motifs identified in cell-type-specific interactions. OSN, OCT4-SOX2-TCF-NANOG motif.
Figure 3 with 1 supplement
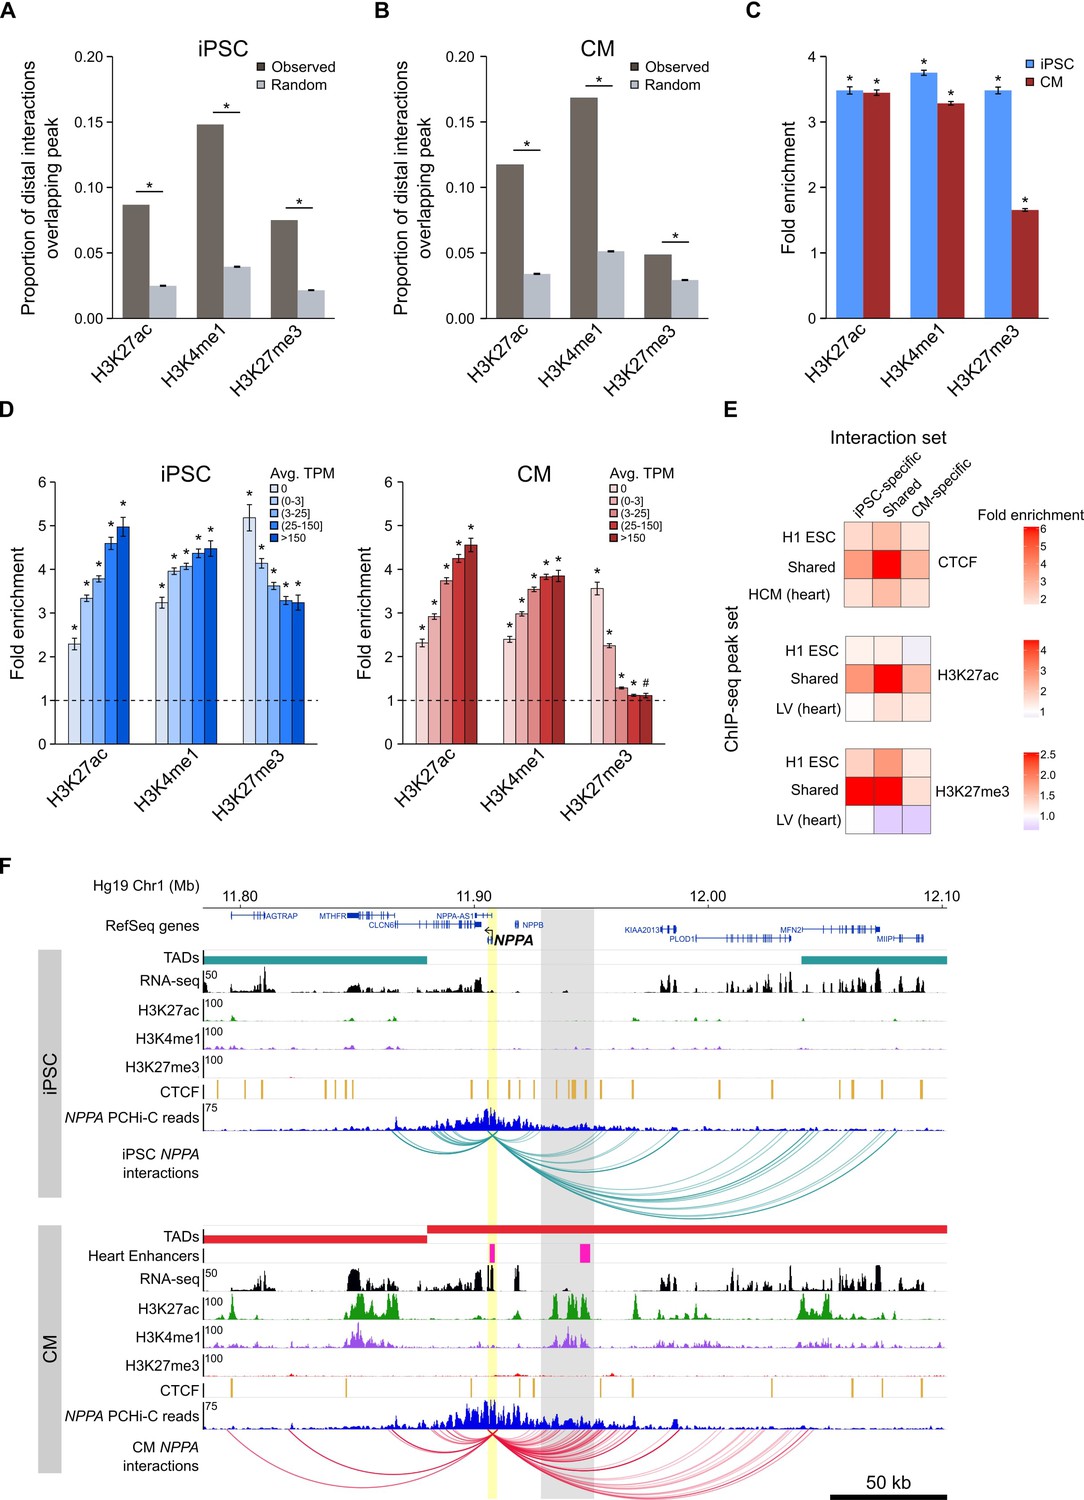
Enrichment of promoter interactions to distal regulatory features.
(A,B) Proportion of promoter-distal interactions overlapping a histone ChIP-seq peak compared to random control MboI fragments (see Materials and methods). iPSC interactions were overlapped with H1 ESC ChIP-seq data; CM interactions were overlapped with left ventricle ChIP-seq data from the Epigenome Roadmap Project (Supplementary file 10). (C) Fold enrichment of the data presented in (A) and (B). (D) Fold enrichment of promoter-distal interactions based on the expression level of the promoter. Promoters were grouped into five bins according to their average TPM values. Dashed line indicates no enrichment. (E) Fold enrichment of cell-type-specific and shared interactions (columns) to tissue-specific and shared chromatin features (rows). (F) Example of the NPPA gene in iPSCs (top) and CMs (bottom). Gray box highlights CM-specific interactions to CM-specific chromatin marks and an in vivo heart enhancer (Visel et al., 2007). For clarity, only interactions for NPPA are shown. *p<0.00001, #p=0.0017, Z-test.
Figure 3—figure supplement 1
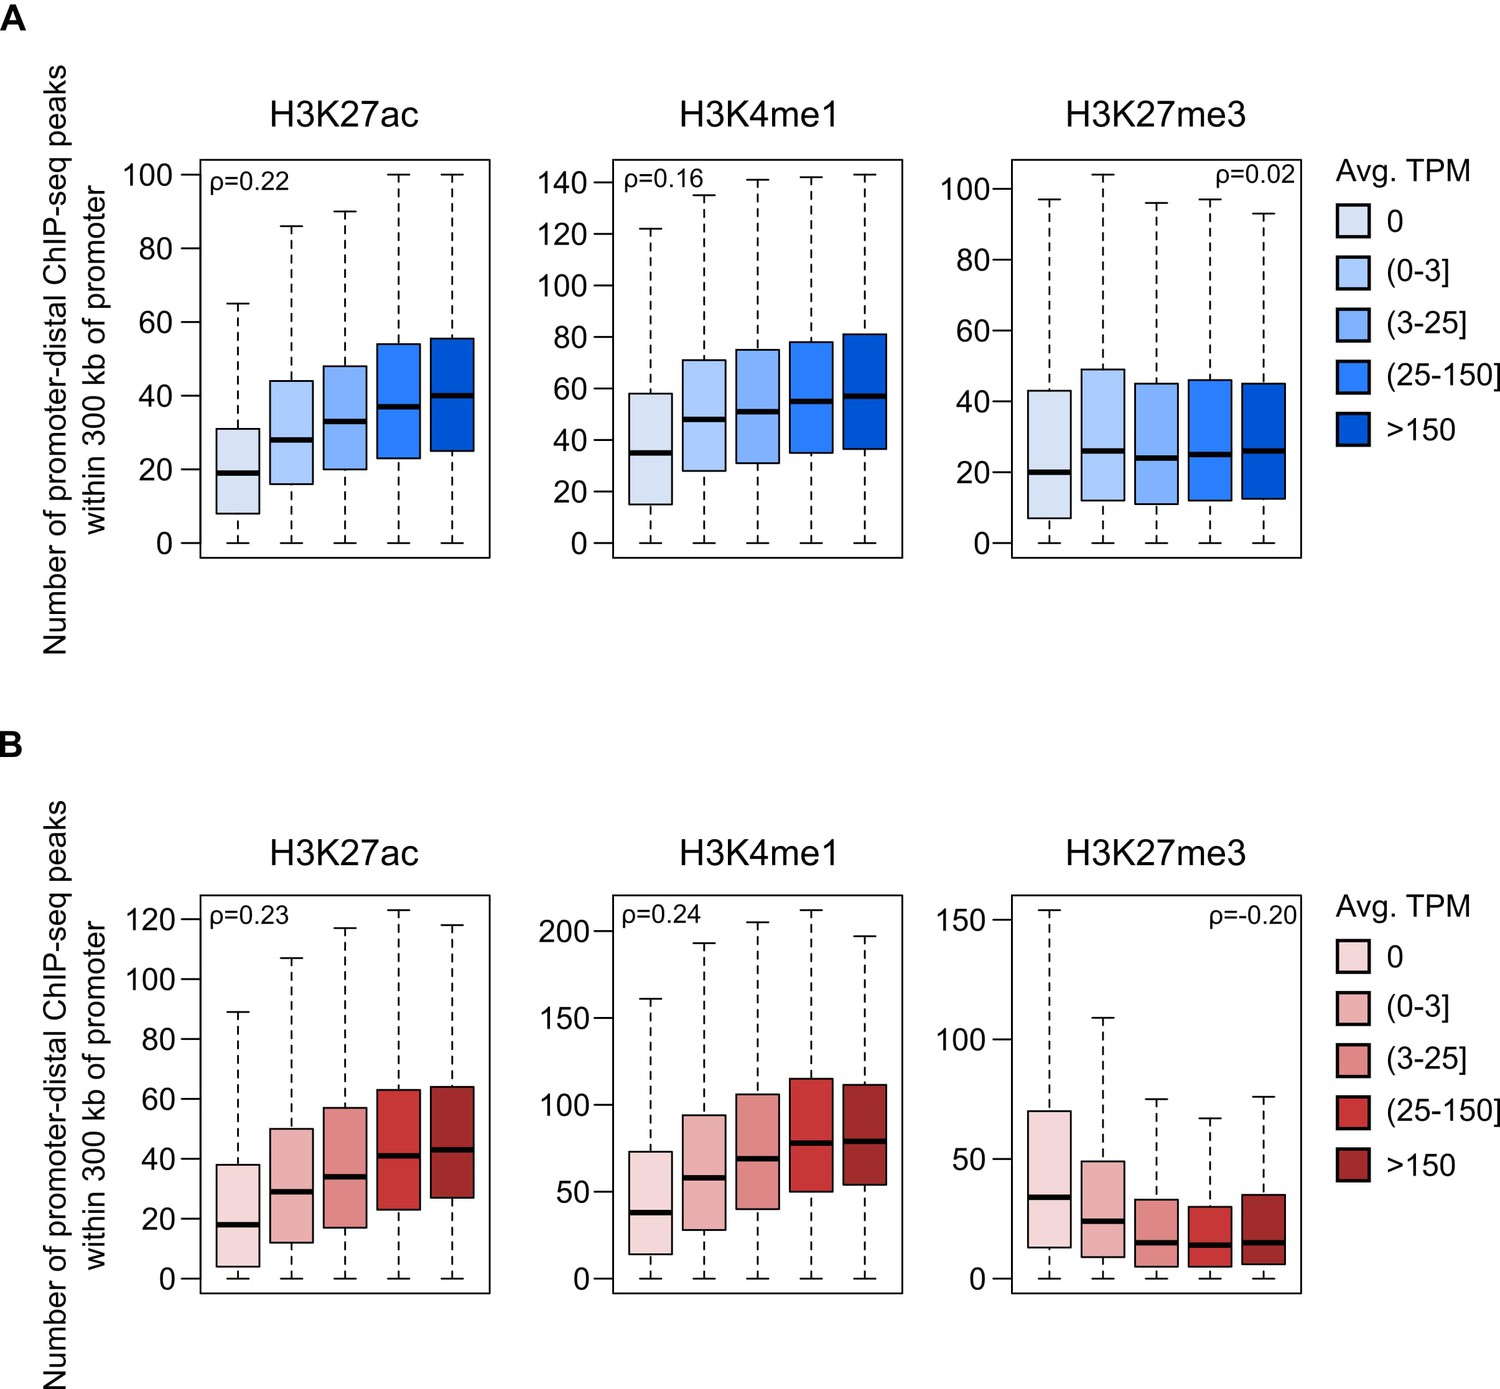
Correlation between the number of histone ChIP-seq peaks within 300 kb of promoters and gene expression level.
Number of promoter-distal histone ChIP-seq peaks within 300 kb of promoters in iPSC (A) and CM (B). Spearman’s rho (ρ) was calculated on the full set of promoter expression values/peak counts for all promoters with at least one significant interaction in the respective cell type (12,926 genes for iPSC and 13,555 genes for CM; see Materials and methods). Data are grouped by expression category to emphasize the trend. Horizontal bars indicate the median for each expression category. All correlation estimates are significant at p<2.2 × 10⁻¹⁶ except for H3K27me3 in iPSCs (p=0.06).
Figure 4 with 3 supplements
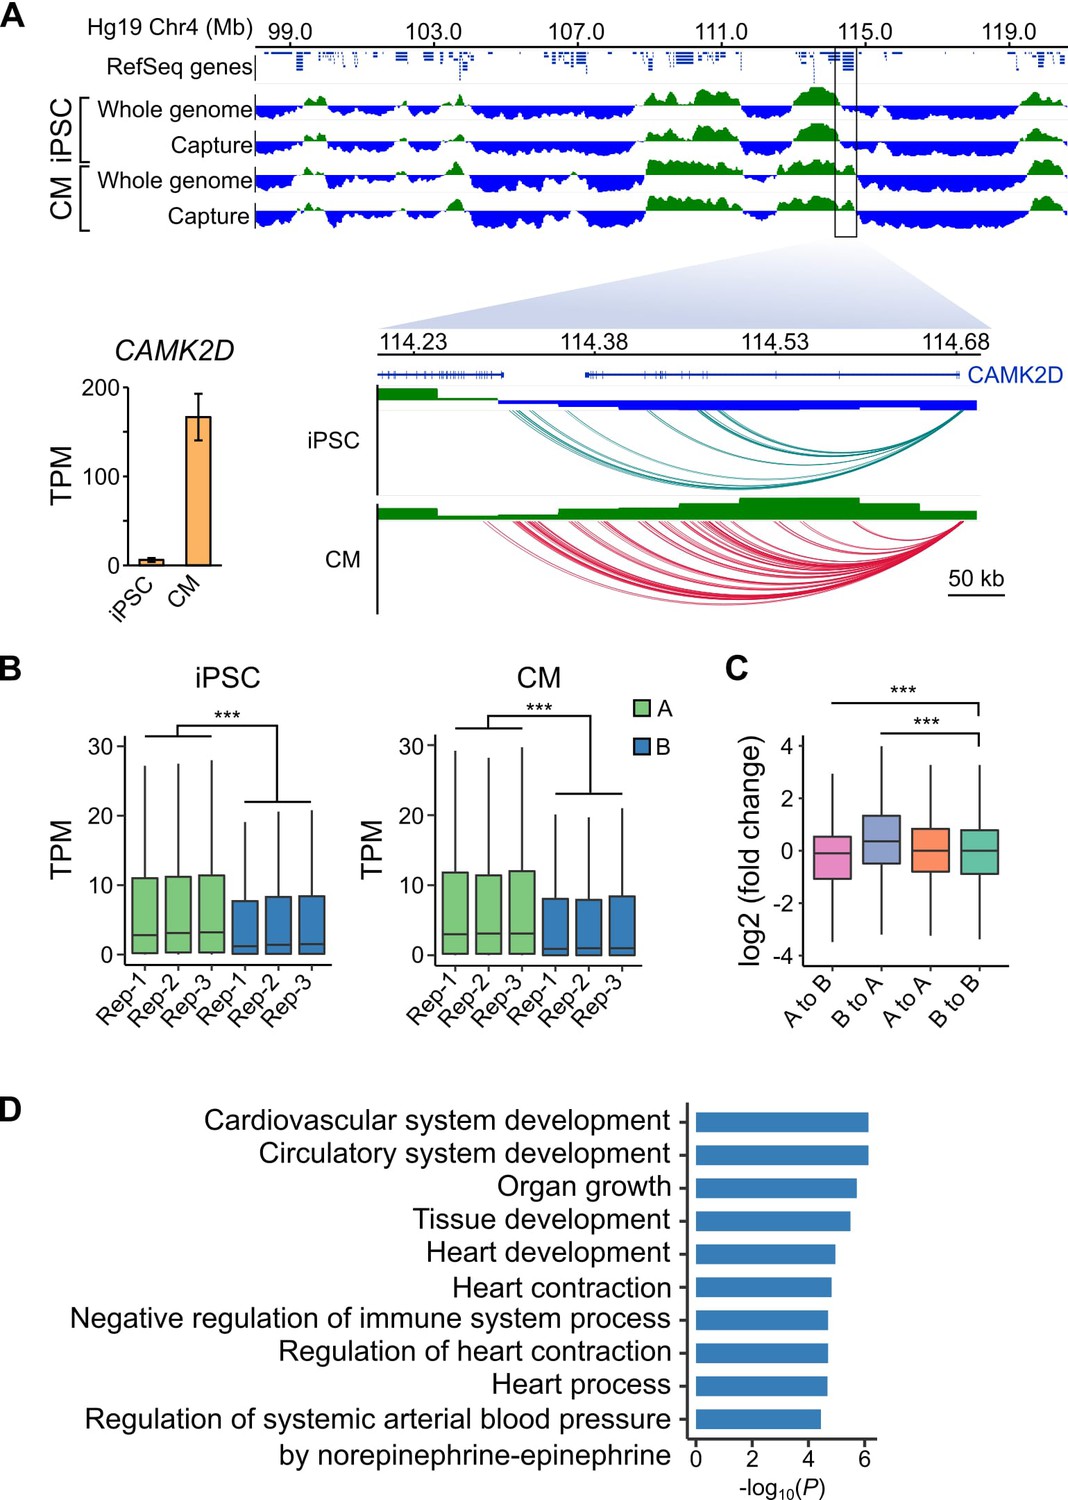
A/B compartment switching corresponds to activation of tissue-specific genes.
(A) Top panel: 10 Mb region on chromosome four showing A (green) and B (blue) compartments based on the first principle component analysis calculated by HOMER (Heinz et al., 2010) of the whole-genome Hi-C and capture Hi-C interaction data. Bottom panel: zoomed in on the CAMK2D locus; only capture Hi-C A/B compartments shown. Inset: expression level of CAMK2D in iPSCs and CMs across the three replicates. (B) Expression level (TPM) of genes located in the A (green) or B (blue) compartment in each replicate of iPSC (left) or CM (right). (C) Difference in expression level (log2 fold change relative to iPSCs) of genes switching compartments from iPSC to CM or remaining in stable compartments. (D) Gene Ontology analysis of biological processes associated with genes switching from B to A compartments during iPSC-CM differentiation. ***p<2.2 × 10⁻¹⁶, Wilcoxon rank-sum test.
Figure 4—figure supplement 1

Comparison of A/B compartments in Hi-C and PCHi-C.
Correlation between the A/B compartment score (principle component analysis of interaction data, PC-1) in whole-genome Hi-C (y-axis) and promoter capture Hi-C (x-axis) in iPSCs (top) and CMs (bottom). Spearman’s ρ > 0.98, p<2.2 × 10⁻¹⁶ in all cases.
Figure 4—figure supplement 2
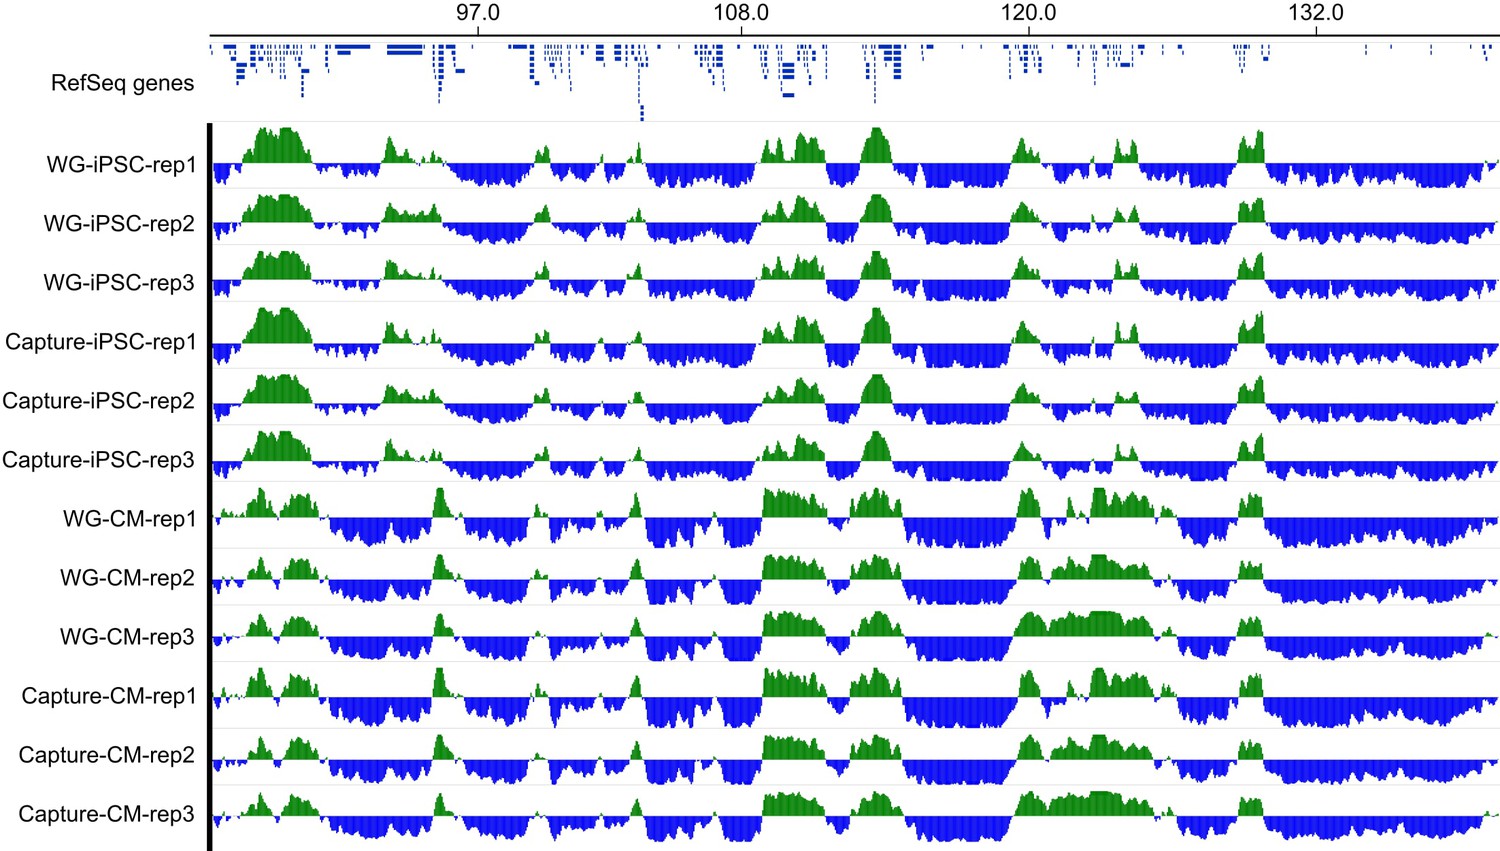
Example of A/B compartments.
Genome browser snapshot of a ~53 Mb region on chromosome four showing A/B compartments in all three replicates of iPSCs and CMs using both whole-genome (WG) and promoter capture Hi-C data.
Figure 4—figure supplement 3
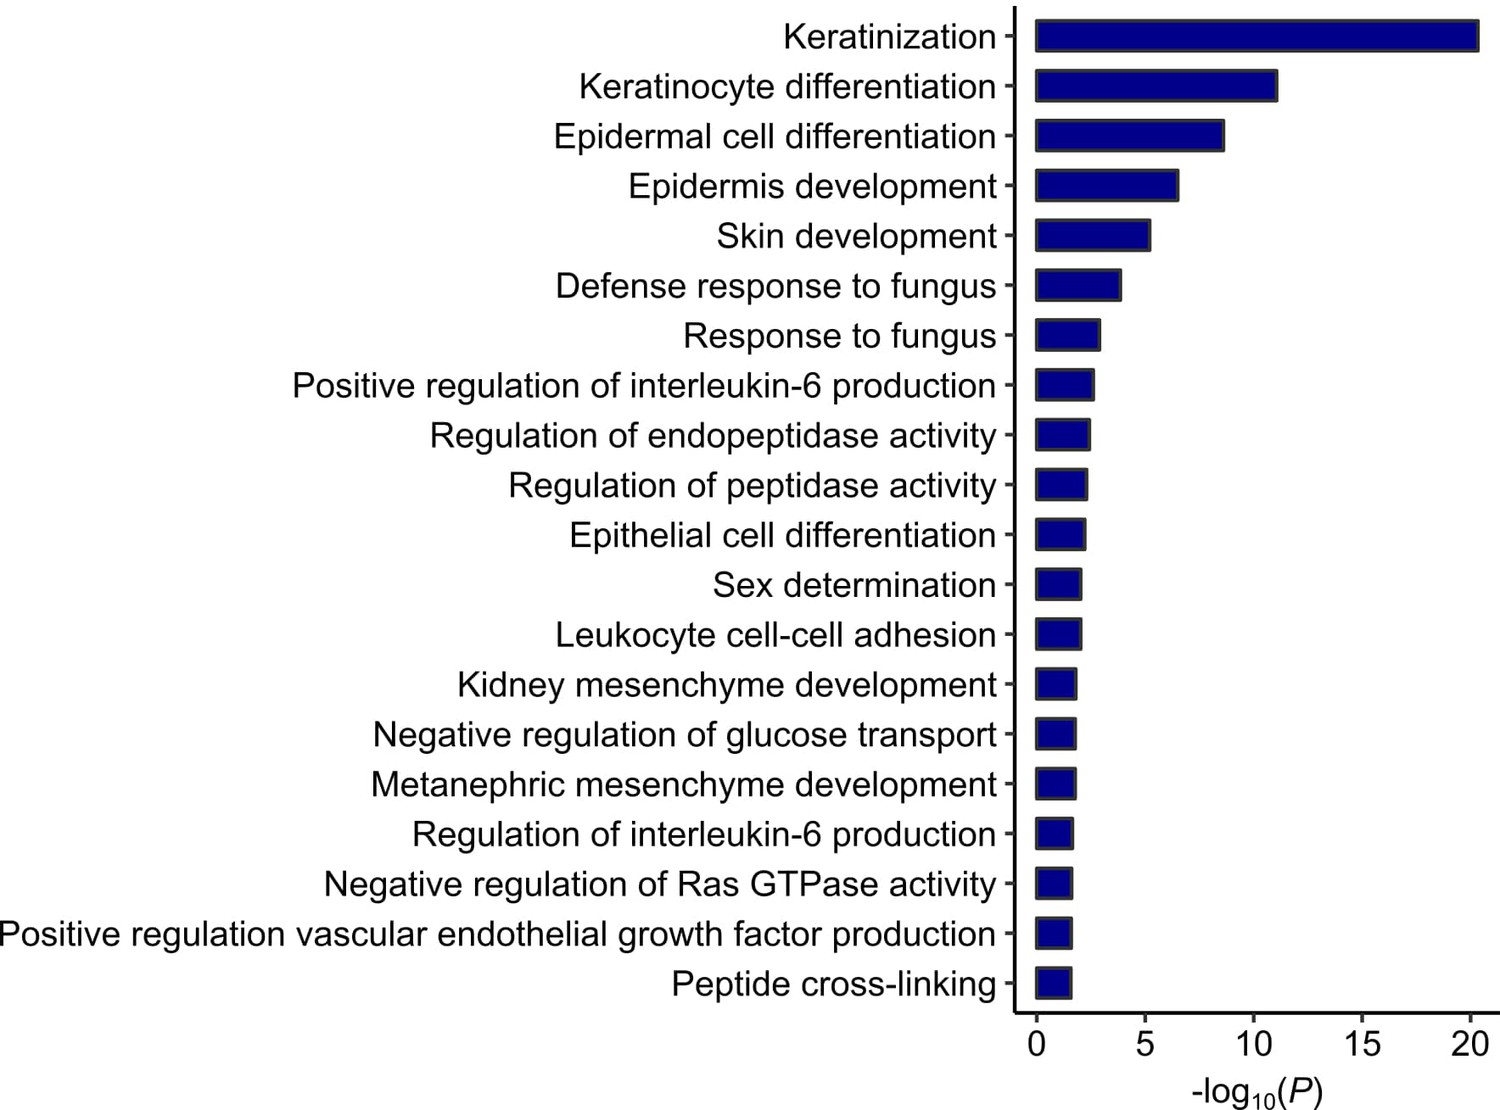
GO analysis on the genes switching from active A compartments in iPSCs to inactive B compartments in CMs.
https://doi.org/10.7554/eLife.35788.014
Figure 5
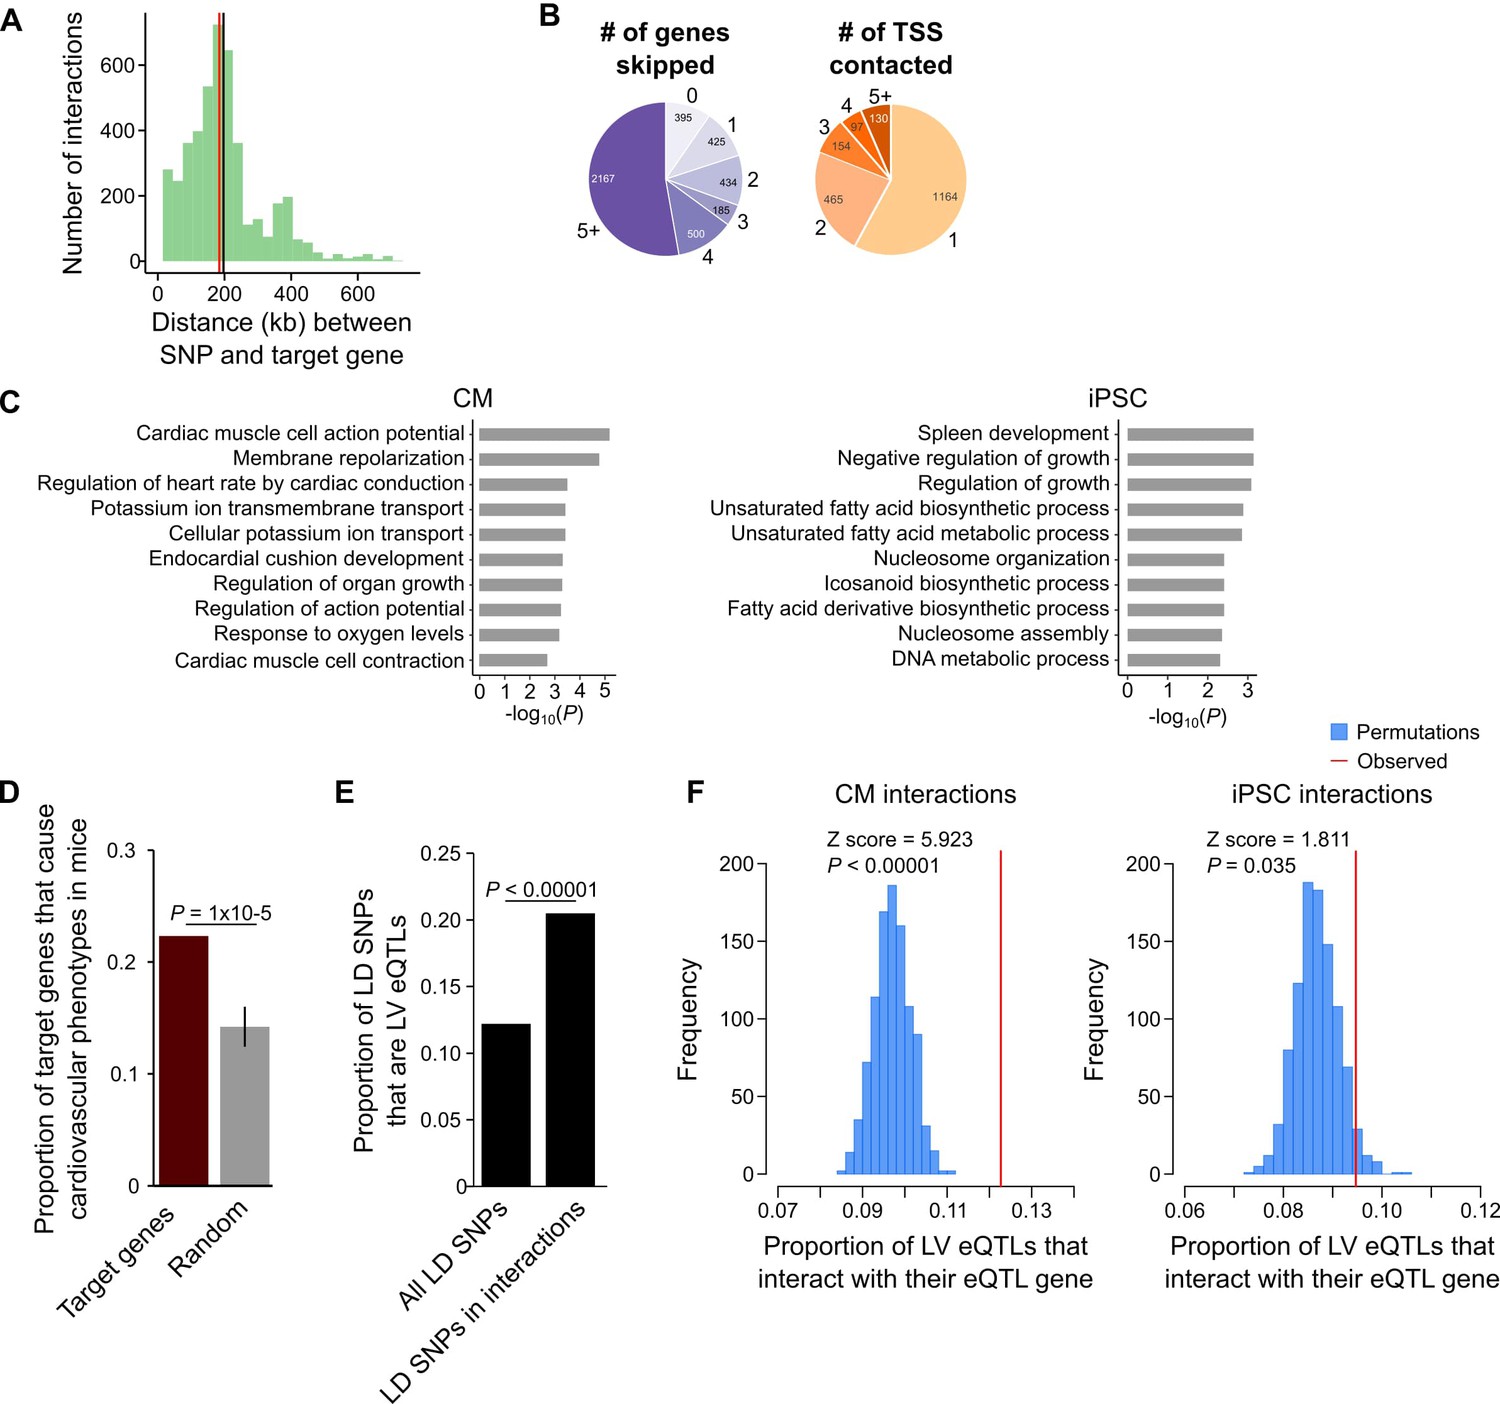
CM promoter interactions link CVD GWAS SNPs to target genes.
(A) Distribution of genomic distances separating SNP-target gene interactions (red line, median = 185 kb; black line, mean = 197 kb). (B) Pie chart showing the number of TSS’s skipped for each SNP-target gene interaction (left) and the number of genes contacted by each SNP (right). (C) GO enrichment analysis for genes looping to LD SNPs using the CM promoter interaction data (left panel) or the iPSC promoter interaction data (right panel). (D) Proportion of target genes that result in a cardiovascular phenotype when knocked-out in the mouse (MGI database [Blake et al., 2017]), compared to a random control set. p-Value calculated with a Z-test. (E) Proportion of GWAS LD SNPs that are eQTLs in left ventricle (LV) when considering either the full set of LD SNPs, or the subset that overlap CM promoter interactions. p-Value calculated with Fisher’s exact test. (F) Proportion of LV eQTLs (genome-wide) that map within a promoter interaction for the eQTL-associated gene (indicated by the red line). Random permutations were obtained by re-assigning each promoter’s set of interactions to a new promoter and calculating the proportion of eQTLs in random interactions that interact with their eQTL-associated gene. Proportions only consider eQTLs that overlap a promoter-distal interaction. P-values calculated with a Z-test.
Figure 6
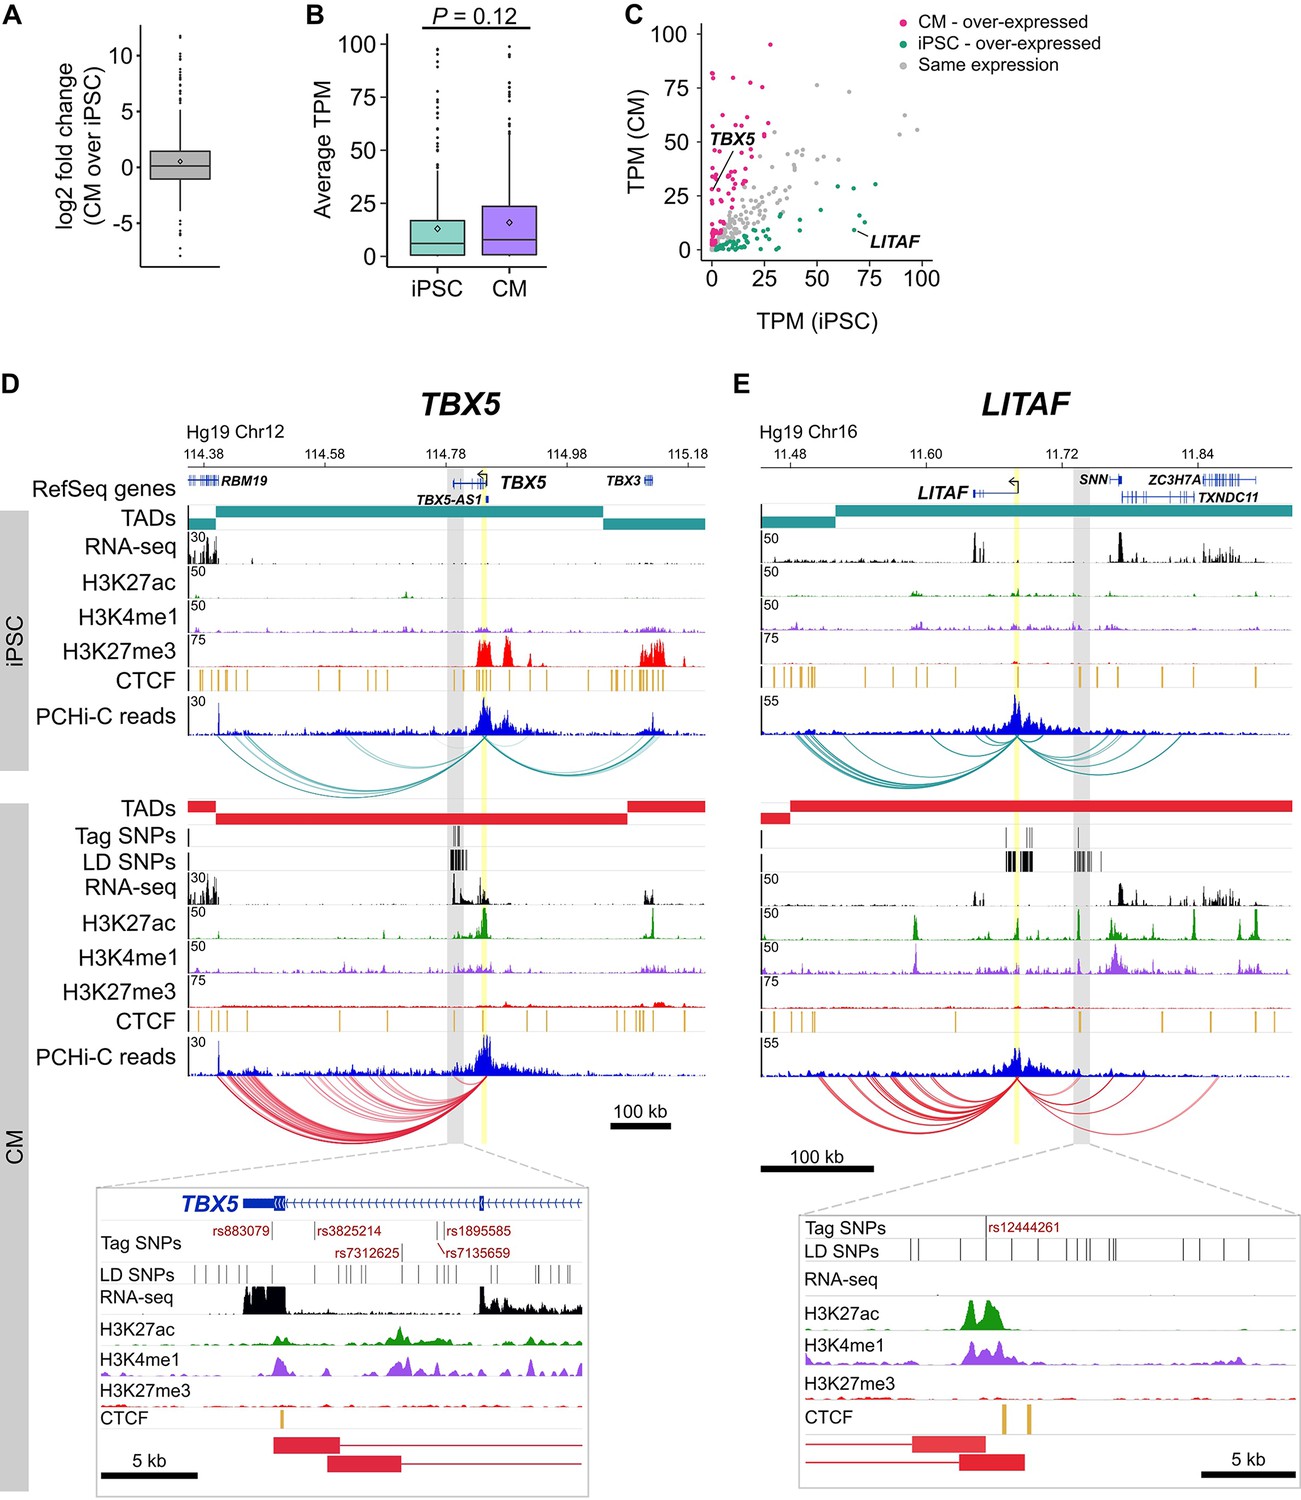
Characterizing target genes based on expression level.
(A) Log2 fold change of the expression level of target genes in CMs compared to iPSCs (horizontal bar indicates median, 1.08; diamond indicates mean, 1.44). (B) Average TPM values of target genes in iPSCs and CMs (p=0.12, Wilcoxon rank-sum test). Diamonds indicate the mean value (40.6 for iPSC, 60.1 for CM). (C) Comparison of average TPM values for target genes in CMs and iPSCs. See Supplementary file 8 for full list of genes and TPM values. (D,E) Examples of genes looping to cardiac arrhythmia GWAS SNPs in CMs. (D) The TBX5 gene interacts with a functionally validated arrhythmia locus (Smemo et al., 2012). (E) The LITAF gene interacts with a locus identified in (Arking et al., 2014). Yellow highlighted region indicates the promoter; gray box and zoom panel show the promoter-interacting regions (pink boxes) overlapping arrhythmia SNPs. For clarity, only interactions for the indicated promoter are shown.
Figure 7
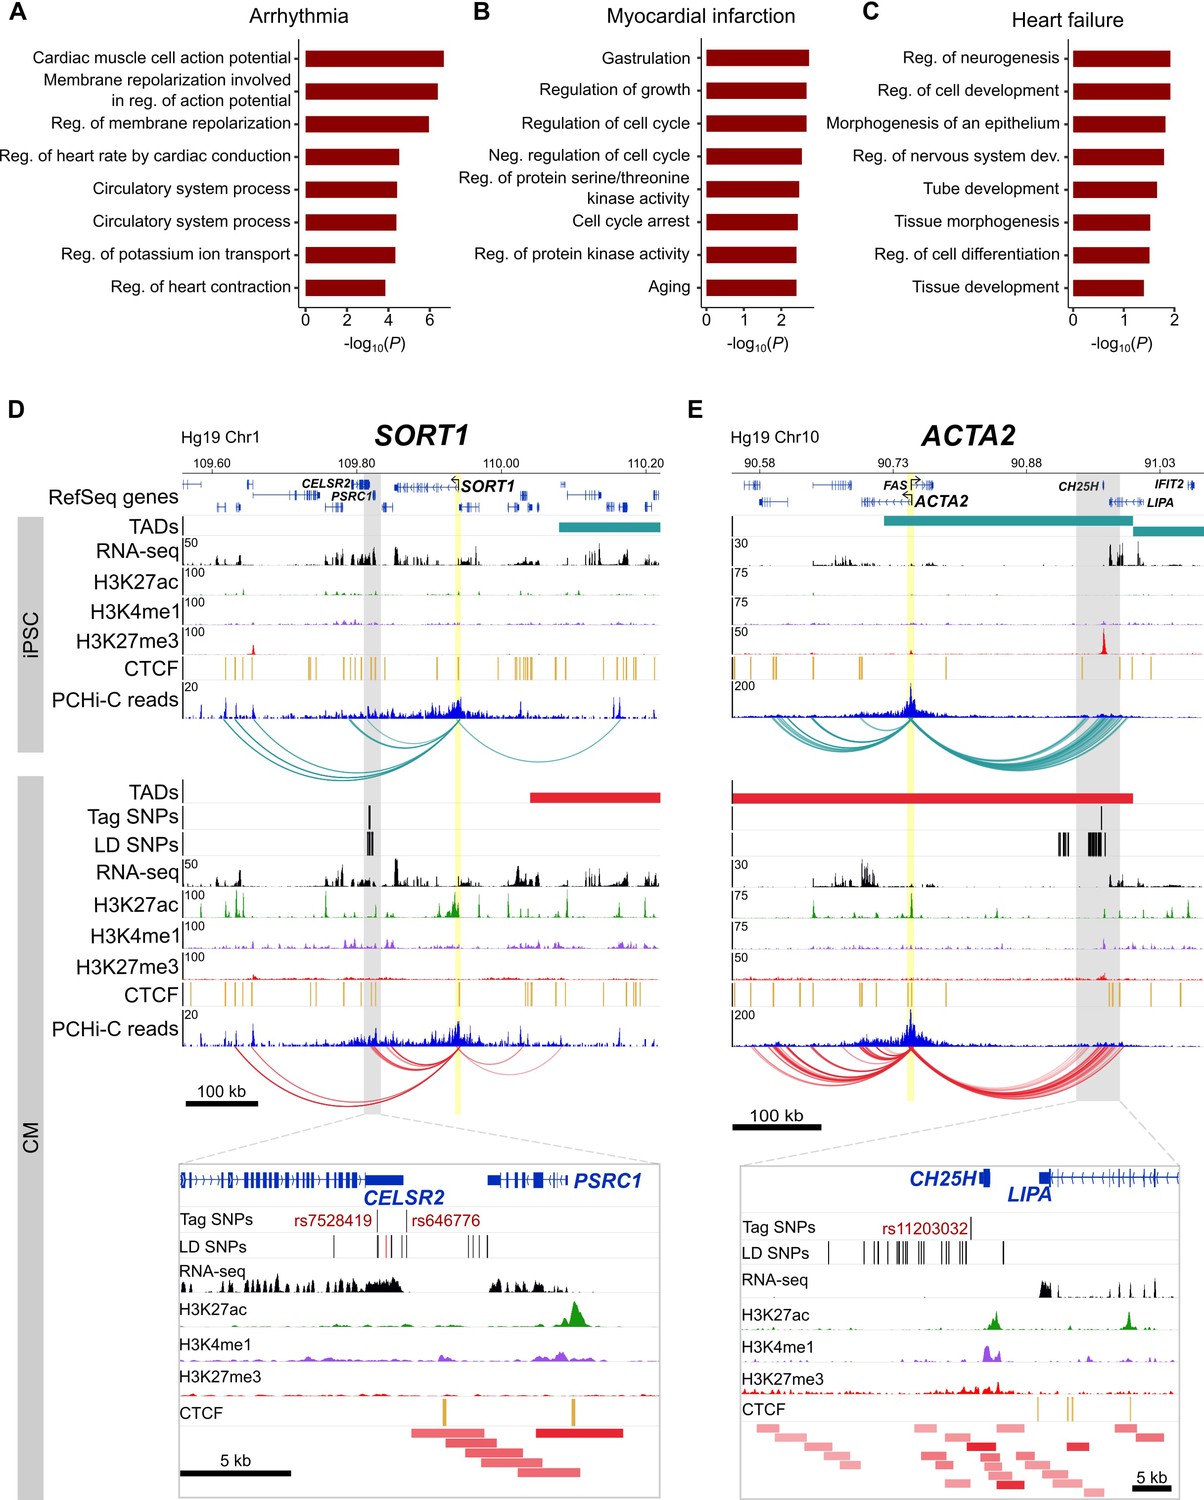
Relevance of CM promoter interactions for cardiac arrhythmia, myocardial infarction and heart failure.
(A–C) Gene Ontology analysis for target genes looping to (A) cardiac arrhythmia SNPs, (B) myocardial infarction SNPs, and (C) heart failure SNPs. (D) The SORT1 promoter loops to a distal myocardial infarction locus (Musunuru et al., 2010). The rs12740374 SNP shown to disrupt a C/EBP binding site in (Musunuru et al., 2010) is colored red. (E) The ACTA2 promoter loops to the 10q21 heart failure locus (Smith et al., 2010). Zoom plots depict the full interacting region overlapping GWAS LD SNPs. For clarity, only interactions for the indicated gene are shown.
Author response image 1
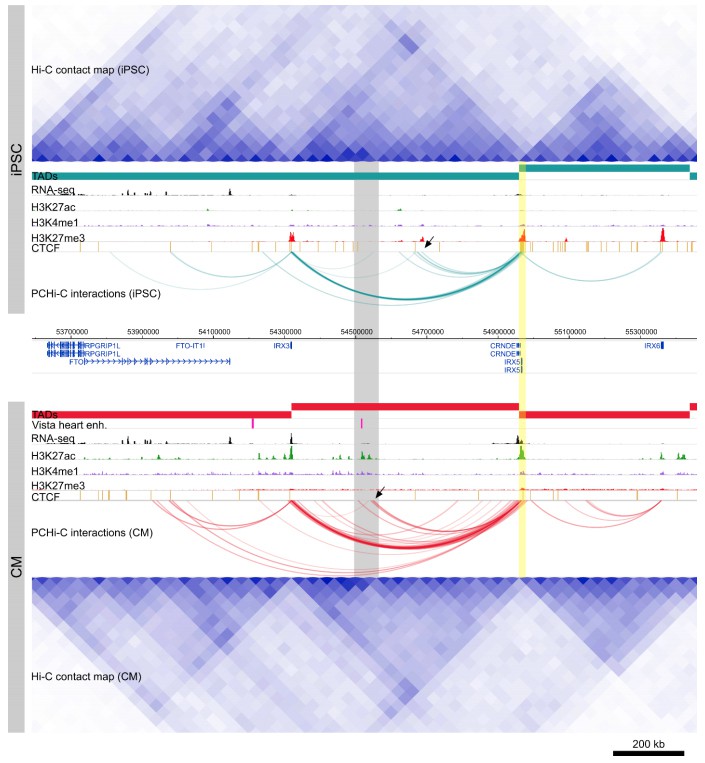
Cis-regulation within TADs.
Genome browser snapshot of the IRX5 locus in iPSCs (top) and CMs (bottom). Yellow highlighted region is the IRX5 promoter. CM-specific interactions to a Vista heart enhancer and H3K27ac peaks are highlighted in gray. Note the relatively invariant TAD structure over this region, compared to the dynamic within-TAD IRX5 promoter interactions between the two cell types (black arrowheads).
Author response image 2
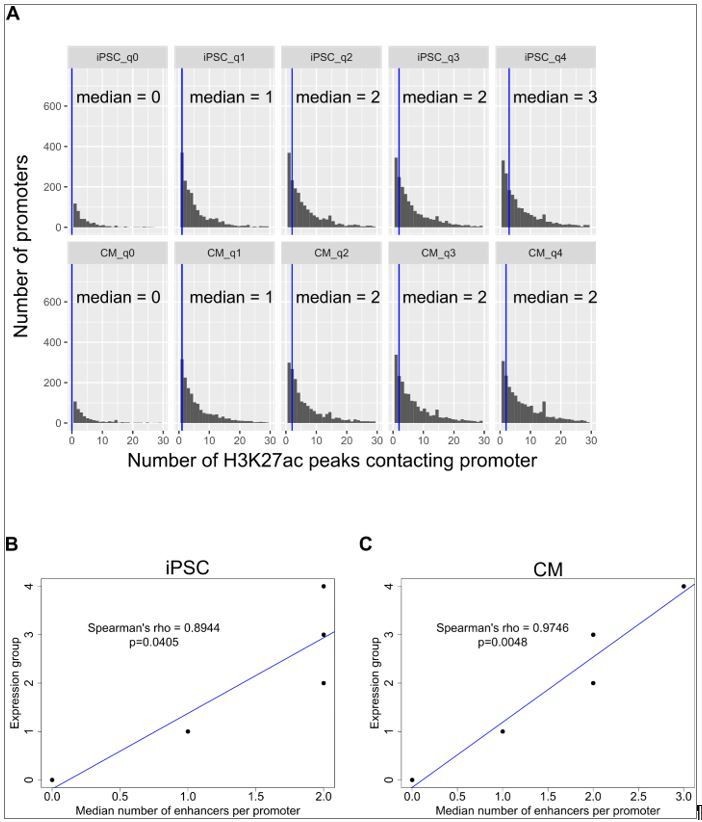
Correlation of expression with number of enhancer contacts.
(A) Genes were grouped into 5 categories according to expression levels (q0=TPM 0, q1=TPM 0-3, q2=TPM 3-25, q3=TPM 25-150, q4=TPM>150) and the number of promoter-distal H3K27ac ChIP-seq peaks contacted by each promoter is displayed. The blue vertical bar indicates the median. (B,C) The median number of H3K27ac peaks contacted by promoters in each expression group is plotted against the expression group value for iPSC (B) and CM (C). Only promoter-distal interactions were considered. Spearman’s rho values are shown for the correlation estimate between expression and number of enhancers contacted. The same correlations were obtained when grouping genes by hard quantile cut-offs instead of TPM values, as in Schoenfelder et al. Genome Research 2015.
Author response image 3
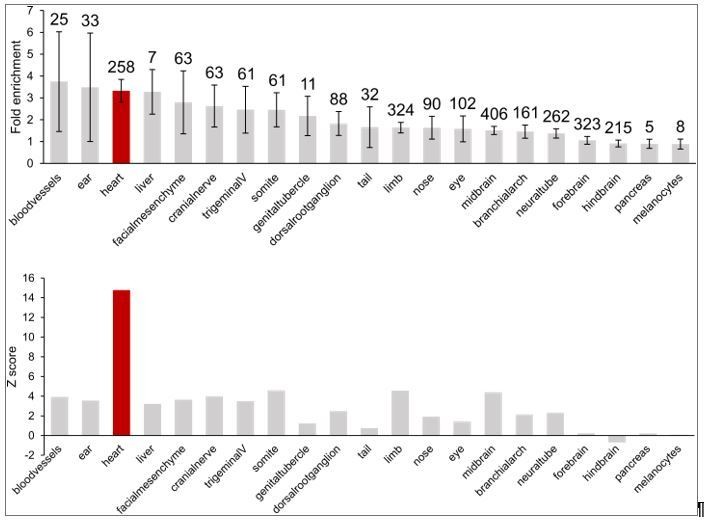
Enrichment of in vivovalidated enhancers (from the Vista Enhancer Browser) in CM promoter-distal interactions.
Top, fold-enrichment of the observed number of enhancers compared to 1000 permutations of enhancer locations. Numbers above the error bars indicate the number of enhancer elements in each group. Bottom, corresponding Z-score for each enrichment. Heart enhancer data is highlighted in red.
Videos
Video 1
Video of iPSC-derived cardiomyocytes exhibiting spontaneous beating at day 20 of the differentiation (day of cell harvesting).
https://doi.org/10.7554/eLife.35788.007Tables
Table 1
Summary of the SNPs and target genes characterized in each disease class.
Summary values for each disease group are depicted along with the total number of GWAS, SNPs, and target genes (‘Combined’ column). Tag SNPs were identified from the published GWAS in the NHGRI-EBI database; SNPs in LD are the total number of non-promoter SNPs (including tag SNPs) in LD (r2 > 0.9) with the tag SNPs in each disease group; SNPs looping to genes are the SNPs in LD that are in a distal promoter interaction; Target genes are all genes with an interaction to a promoter-distal SNP. See Supplementary file 8 for a complete list of all GWAS, coordinates of each SNP and its assigned target gene, expression level in iPSC and CM, and mouse knock-out phenotype where available.
| Arrhythmia | Myocardial infarction | Heart failure | Combined | |
|---|---|---|---|---|
| Number of studies | 30 | 11 | 11 | 50 |
| Tag SNPs | 358 | 86 | 80 | 524 |
| SNPs in LD | 6555 | 1822 | 2098 | 10,475 |
| SNPs looping to genes | 1152 | 357 | 490 | 1999 |
| Target genes | 237 | 72 | 53 | 347 |
Key resources table
| Reagent type (species) or resource | Designation | Source or reference | Identifiers | Additional information |
|---|---|---|---|---|
| Cell line (H. sapiens, Male) | H19101 iPSC | 10.1101/gr.224436.117 | ||
| Antibody | Anti-acetyl Histone H3 (Lys27) (mouse monoclonal) | Wako Chemicals (USA) | 306–34849 | H3K27ac ChIP-seq |
| Antibody | Anti-cardiac troponin T (mouse monoclonal) | BD Biosciences | 564767 | CM flow cytometry |
| Chemical compound, drug | ROCK Y-27632 dihydrochloride | Abcam | ab120129, 10 mg | iPSC tissue culture |
| Chemical compound, drug | CHIR-99021 trihydrochloride | Tocris | 4953 | CM differentiation |
| Chemical compound, drug | Wnt-C59 | Tocris | 5148 | CM differentiation |
| Commercial assay or kit | TruSeq RNA libarary prep kit V2 | Illumina | RS-122–2001 | RNA-seq |
| Commercial assay or kit | NEBNext Multiplex Oligos for Illumina | NEB | E7335S | Hi-C |
| Commercial assay or kit | MEGAshortscript T7 Transcription Kit | Thermo Fisher | AM135 | Probe generation |
| Sequence-based reagent | Primer A | IDT | 5′-CTGGGAATCGCACCAGCGTGT-3′ | Probe generation |
| Sequence-based reagent | Primer B | IDT | 5′-CGTGGATGAGGAGCCGCAGTG-3′ | Probe generation |
| Sequence-based reagent | Primer A T7 | IDT | 5’-GGATTCTAATACGACTCACT ATAGGGATCGCACCAGCGTGT-3’ | Probe generation |
| Sequence-based reagent | blocking primer P5 | IDT | 1016184 | Hi-C capture |
| Sequence-based reagent | blocking primer P7 | IDT | 1016186 | Hi-C capture |
Additional files
-
Supplementary file 1
PCHi-C interactions for iPSC.
Significant interactions in iPSC (identified in at least two out of three replicates) are presented in paired bed format. Column seven is the CHiCAGO score; Column eight contains the gene information (gene name, identifier, strand, TSS position). If the interaction involves another promoter, the second gene name information is provided.
- https://doi.org/10.7554/eLife.35788.019
-
Supplementary file 2
PCHi-C interactions for CM.
Significant interactions in CM (identified in at least two out of three replicates) are presented in paired bed format. Column seven is the CHiCAGO score; Column eight contains the gene information (gene name, identifier, strand, TSS position). If the interaction involves another promoter, the second gene name information is provided.
- https://doi.org/10.7554/eLife.35788.020
-
Supplementary file 3
CVD SNPs.
All SNPs in high LD (r2 > 0.9) with CVD tag SNPs are provided. The first four columns indicate the tag SNP position; columns 5–8 indicate the SNPs in LD with the tag SNP; column nine is the degree of LD (r2 value).
- https://doi.org/10.7554/eLife.35788.021
-
Supplementary file 4
HOMER motif analysis for the distal interacting regions of promoter interactions.
For each analysis presented in Figure 2, the full output of motifs identified in interacting fragments are listed.
- https://doi.org/10.7554/eLife.35788.022
-
Supplementary file 5
Gene Ontology enrichment output.
The full output of the GO enrichment analysis is provided.
- https://doi.org/10.7554/eLife.35788.023
-
Supplementary file 6
Gene Ontology input gene lists.
The list of genes used as input for GO analysis is provided.
- https://doi.org/10.7554/eLife.35788.024
-
Supplementary file 7
GWAS terms used to compile studies.
The list of trait terms used to filter GWAS studies is provided.
- https://doi.org/10.7554/eLife.35788.025
-
Supplementary file 8
GWAS summary table.
Table 8.1 contains information related to the CVD GWAS used in this paper, including PubMed ID, first author, date of publication, journal, study title, tag SNP chromosome position, rsID, trait. Table 8.2 contains information on each LD SNP-target gene interaction (tag SNP and corresponding LD SNP, target gene, interaction coordinates, target gene expression in iPSC and CM, MGI cardiovascular phenotype information.
- https://doi.org/10.7554/eLife.35788.026
-
Supplementary file 9
Hi-C read information.
Table 9.1 contains the probe sequences used for promoter capture, along with the corresponding gene name. Table 9.2 contains the total number of sequenced and processed/filtered reads for each Hi-C experiment. Table 9.3 contains the number of reads mapping to each promoter and the corresponding number of significant (present in at least two replicates) interactions called.
- https://doi.org/10.7554/eLife.35788.027
-
Supplementary file 10
Public datasets used.
ChIP-seq and RNA-seq datasets used in our analyses are listed.
- https://doi.org/10.7554/eLife.35788.028
-
Transparent reporting form
- https://doi.org/10.7554/eLife.35788.029
Download links
A two-part list of links to download the article, or parts of the article, in various formats.
Downloads (link to download the article as PDF)
Open citations (links to open the citations from this article in various online reference manager services)
Cite this article (links to download the citations from this article in formats compatible with various reference manager tools)
A promoter interaction map for cardiovascular disease genetics
eLife 7:e35788.
https://doi.org/10.7554/eLife.35788


