Cryo-EM structure of the adenosine A2A receptor coupled to an engineered heterotrimeric G protein
- MRC Laboratory of Molecular Biology, United Kingdom
Figures
Figure 1
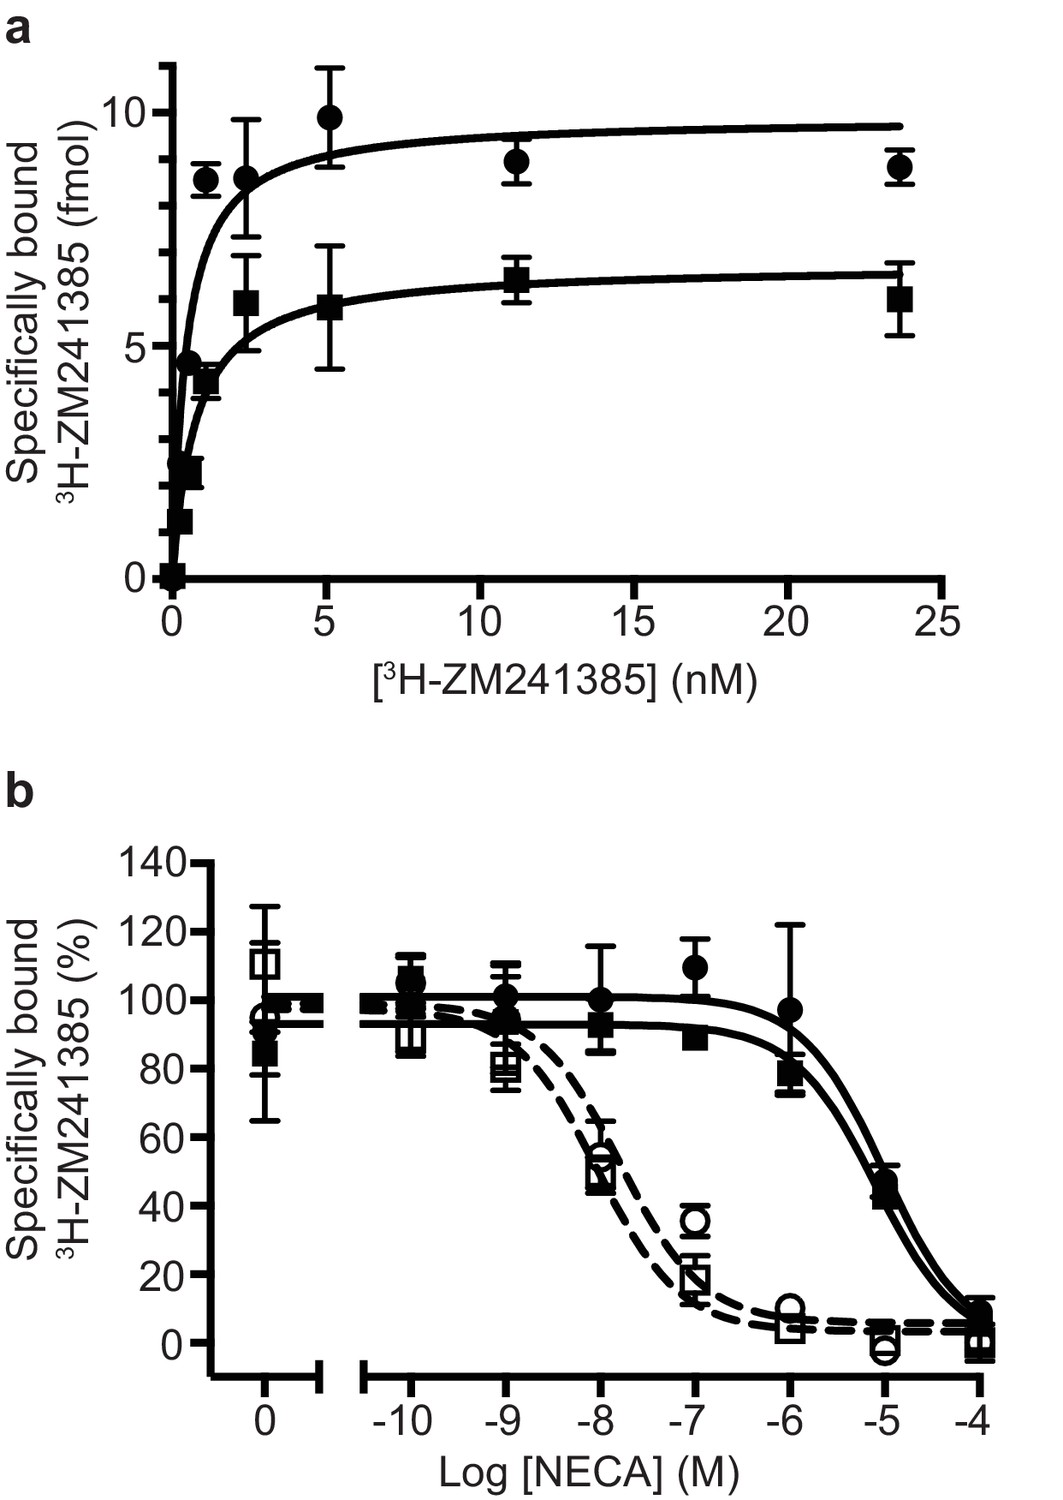
Pharmacological analyses of A2AR.
(a) Saturation binding of the inverse agonist 3H-ZM241385 to A2AR constructs gave the following apparent KDs: A2AR (circles), 0.5 ± 0.1 nM; TrxA-A2AR (squares), 0.8 ± 0.2 nM. (b) Competition binding curves measuring the displacement of 3H-ZM241385 with increasing concentrations of NECA gave the following Kis for NECA; A2AR (filled circles), 1.0 ± 0.5 µM; A2AR + mini-GS (open circles, dashed line), 2.6 ± 1.8 nM; TrxA-A2AR (filled squares), 1.1 ± 0.4 µM; TrxA-A2AR + mini-GS (open squares, dashed line), 1.8 ± 1.2 nM. Data plotted are the average from two independent experiments performed in duplicate with error bars shown as the SD.
-
Figure 1—source data 1
Raw data for A2aR competition binding curves.
- https://doi.org/10.7554/eLife.35946.003
Figure 2
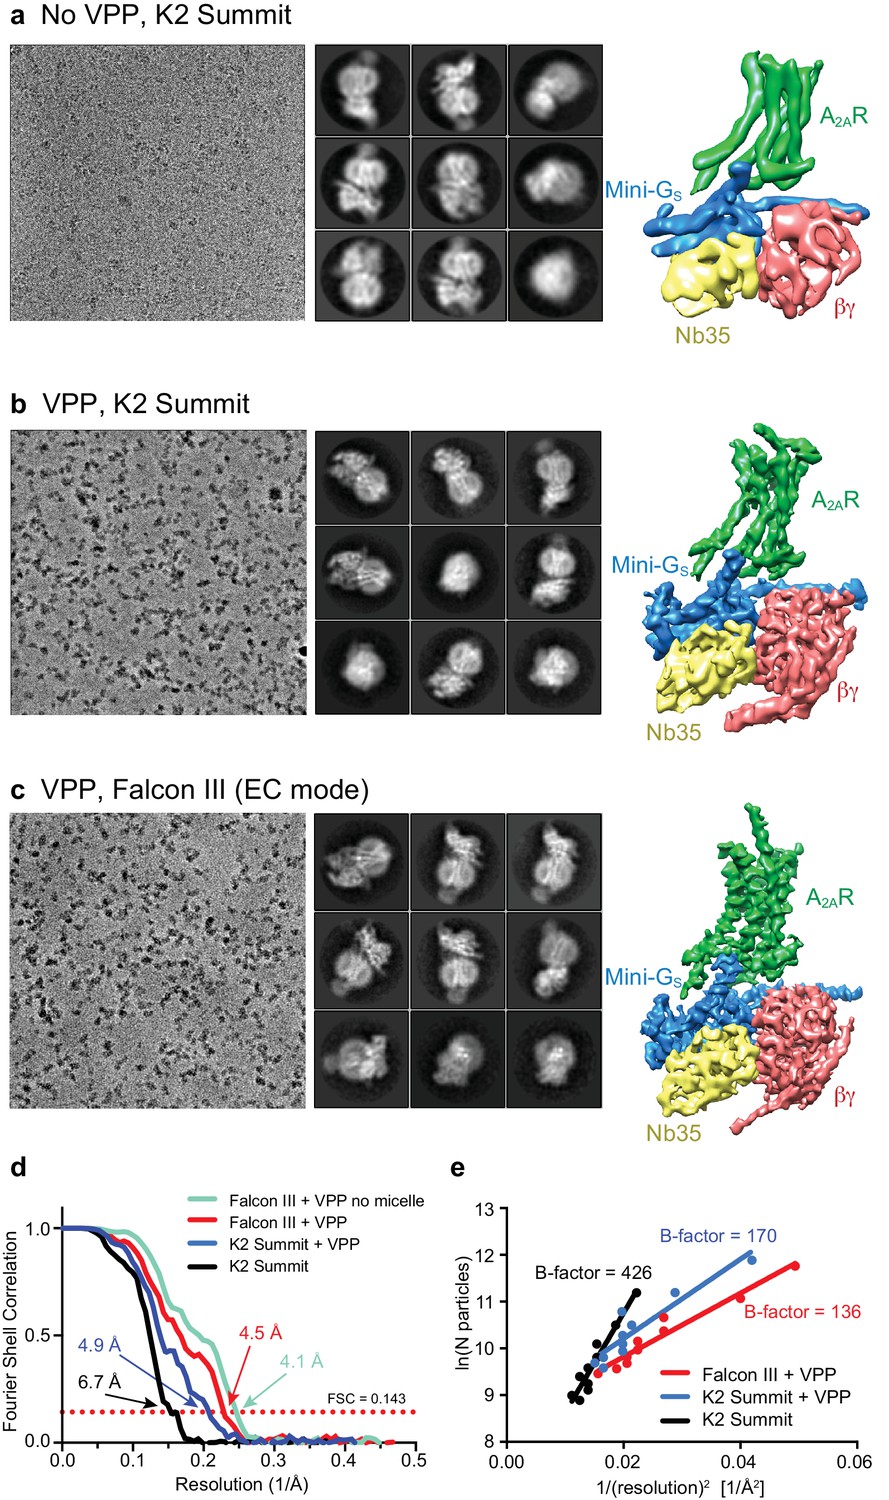
Cryo-EM of the A2AR complex in the presence and absence of a VPP.
(a-c) Each panel contains three sections, with the left-hand section showing a representative micrograph obtained on a Titan Krios, the central section depicting 2D class averages and the right-hand section the refined 3D reconstruction obtained from the data collected. (a) Data collected without using a VPP on a K2 Summit detector. (b) Data collected using a VPP on a K2 Summit detector. (c) Data collected using a VPP on a Falcon III detector in electron counting (EC) mode. (d) Gold-standard FSC curves for the three 3D reconstructions with resolutions estimated at 0.143. (e) Difference in B-factors between the three datasets.
Figure 3
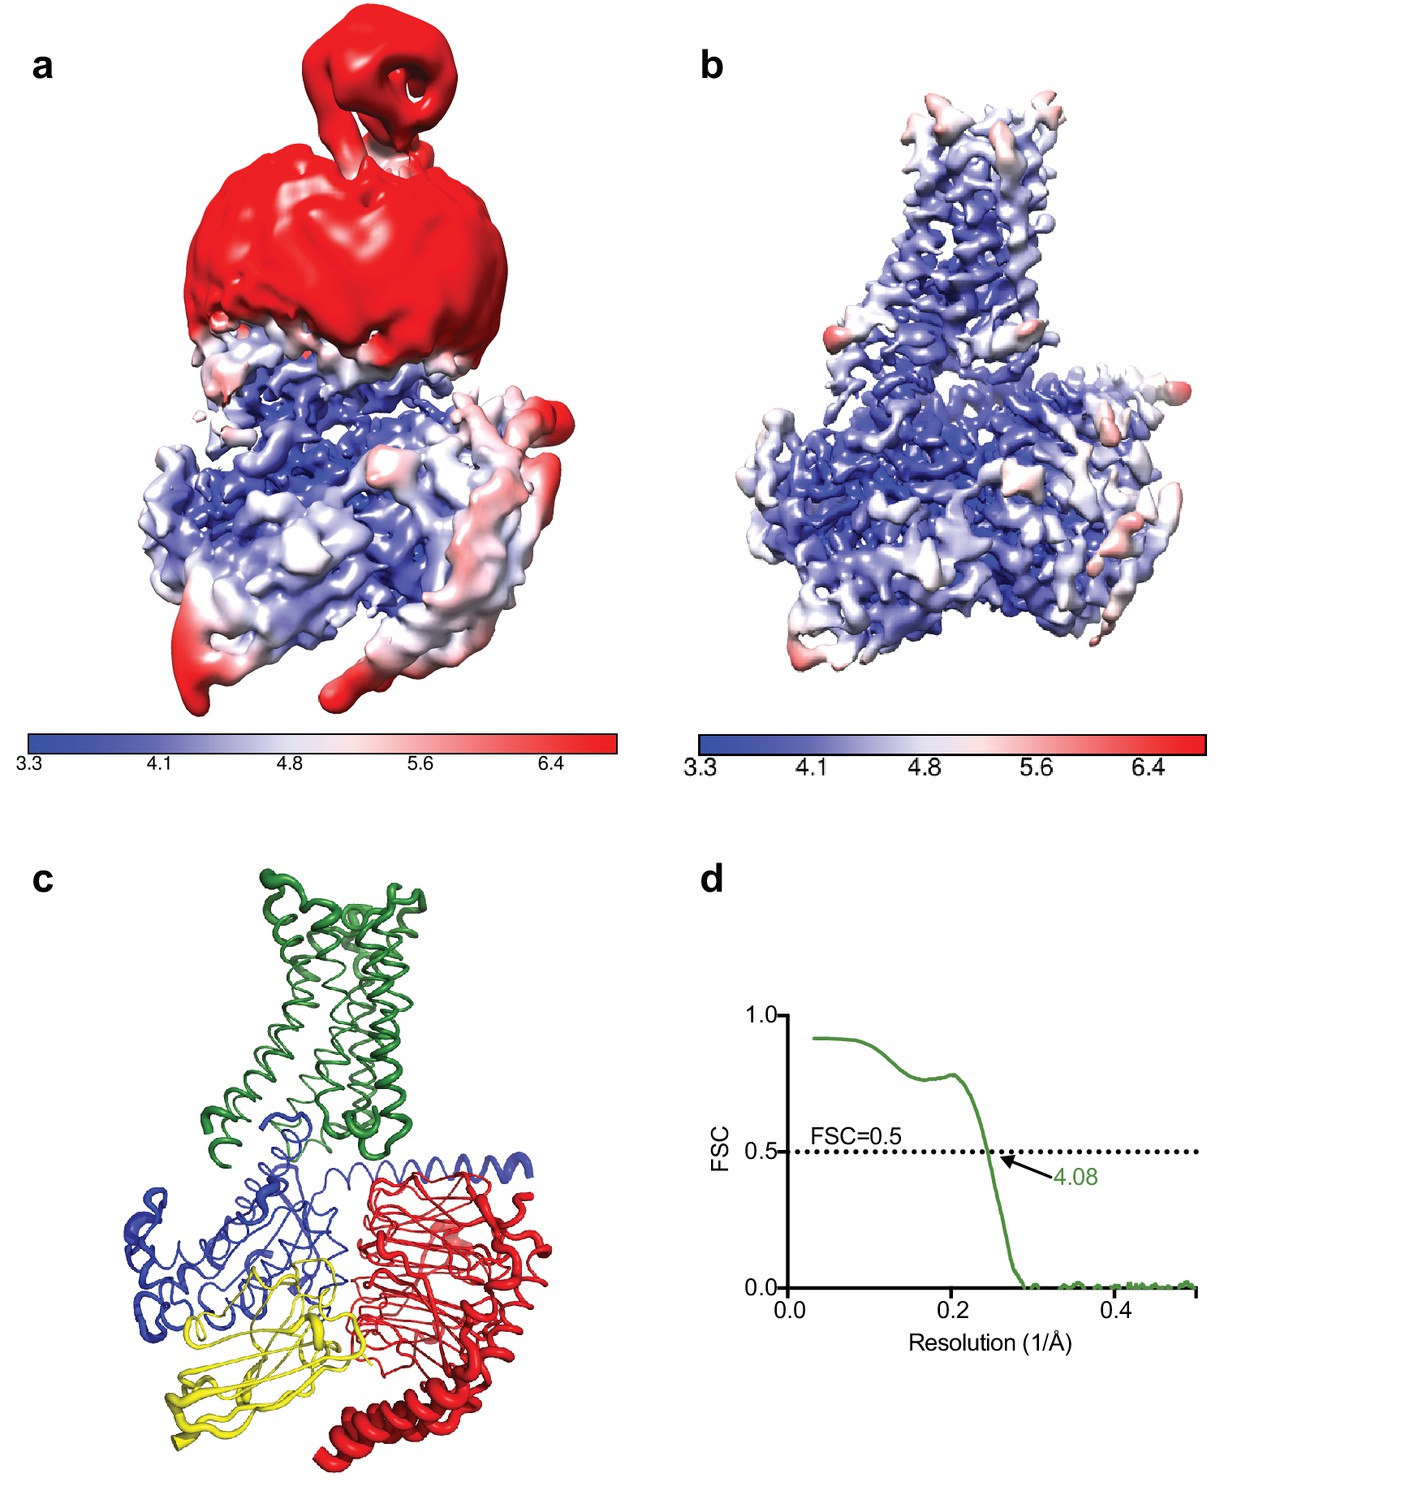
Local resolution cryo-EM map.
(a) Local resolution map of the Falcon III + VPP model prior to refinement with signal subtracted particles as calculated with RELION. (b) Local resolution of the same model after refinement of signal subtracted particles (also calculated with RELION) (c) A2AR complex displayed as putty cartoons, where B-factor of the coordinates relates to the thickness of the tube. (d) Fourier shell correlation of the refined model versus the map.
Figure 4
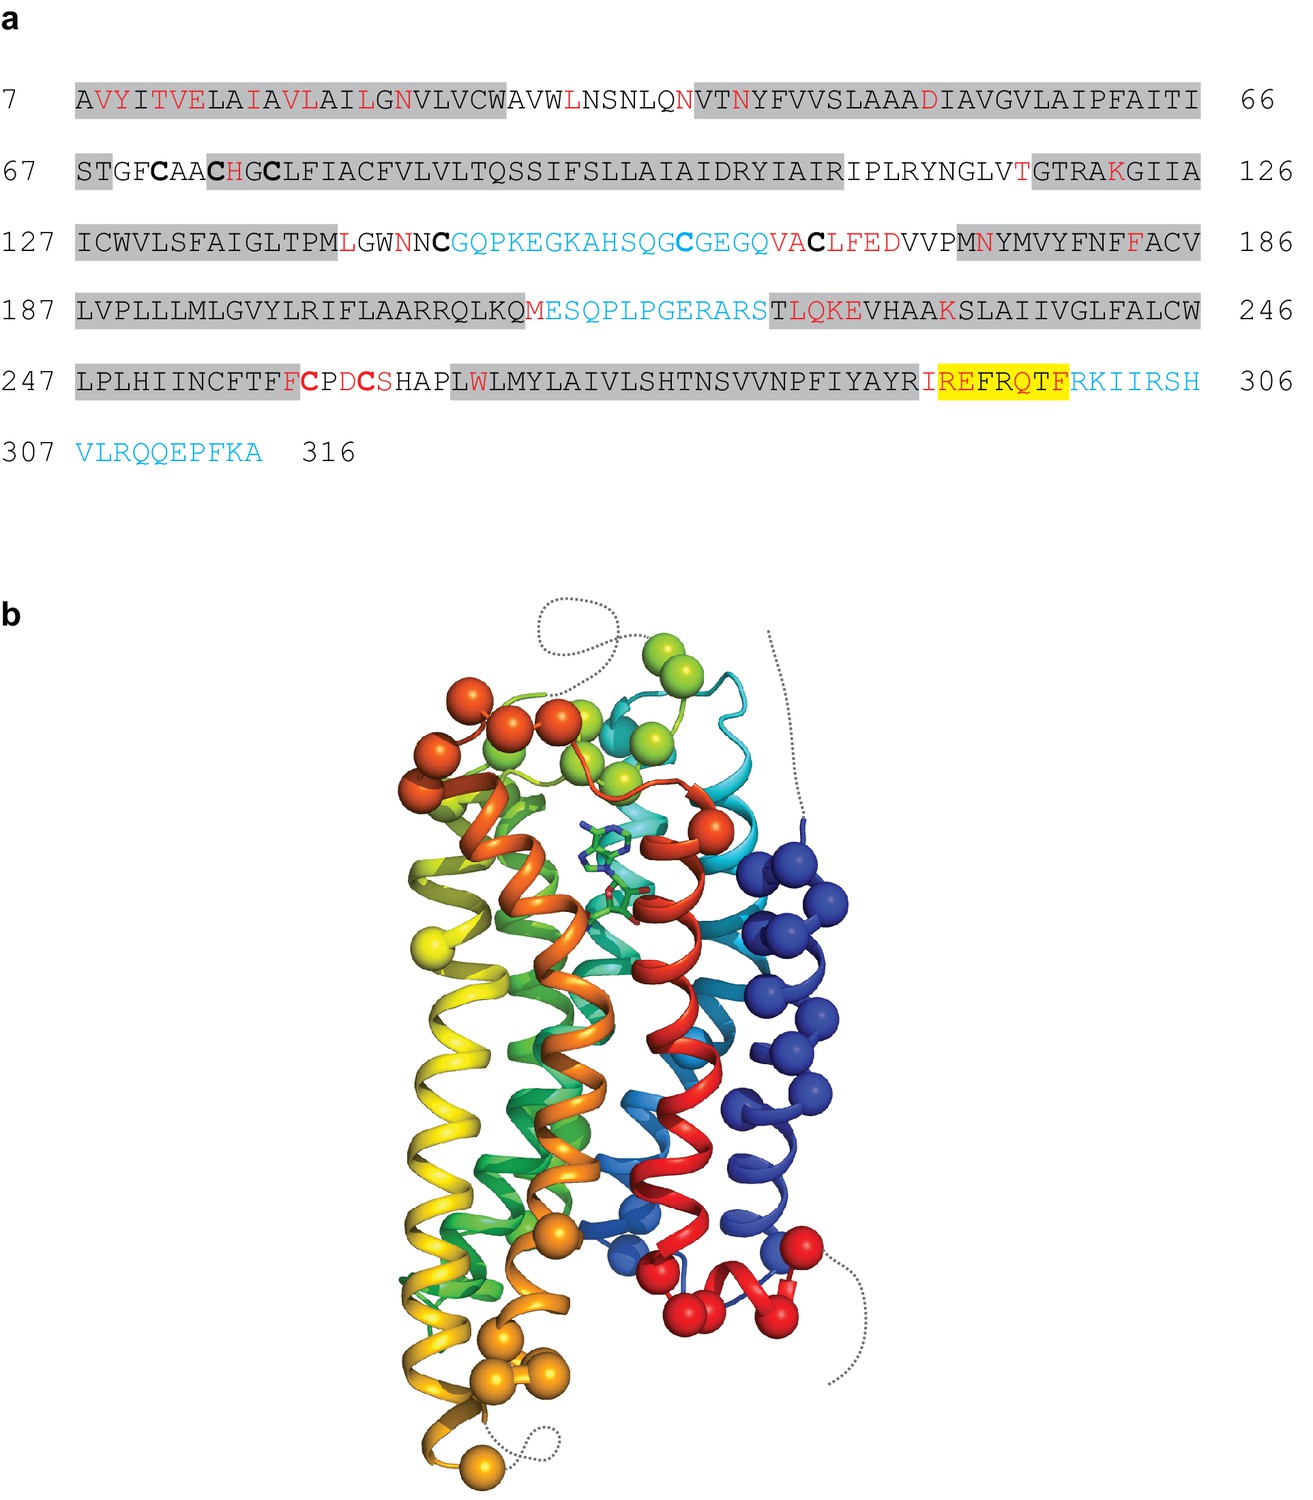
Modelling quality of the A2AR structure.
(a) Amino acid sequence of A2AR used in the cryo-EM structure determination. Residues are coloured according to how they have been modelled: black, good density allows the side chain to be modelled; red, limited density for the side chain present and therefore the side chain has been truncated to Cβ; blue, no density observed and therefore the residue was not modelled. Regions highlighted in grey represent the transmembrane α-helices and amphipathic helix eight is highlighted in yellow. Cys residues involved in the formation of disulphide bonds are in bold. In the cryo-EM structure densities for the disulphide bonds Cys74-Cys146 and Cys77-Cys166 are observed. Densities corresponding to the disulphide bonds Cys71-Cys159 and Cys259-Cys262 are not observed in the cryo-EM data. The sequence of A2AR is from residue 8–316, with the initial Ala residue at position seven being part of the linker between the N-terminal thioredoxin fusion and A2AR. (b) Model of A2AR showing the Cα positions of amino acid residues with poor density (spheres) and regions unmodelled (dotted lines).
Figure 5
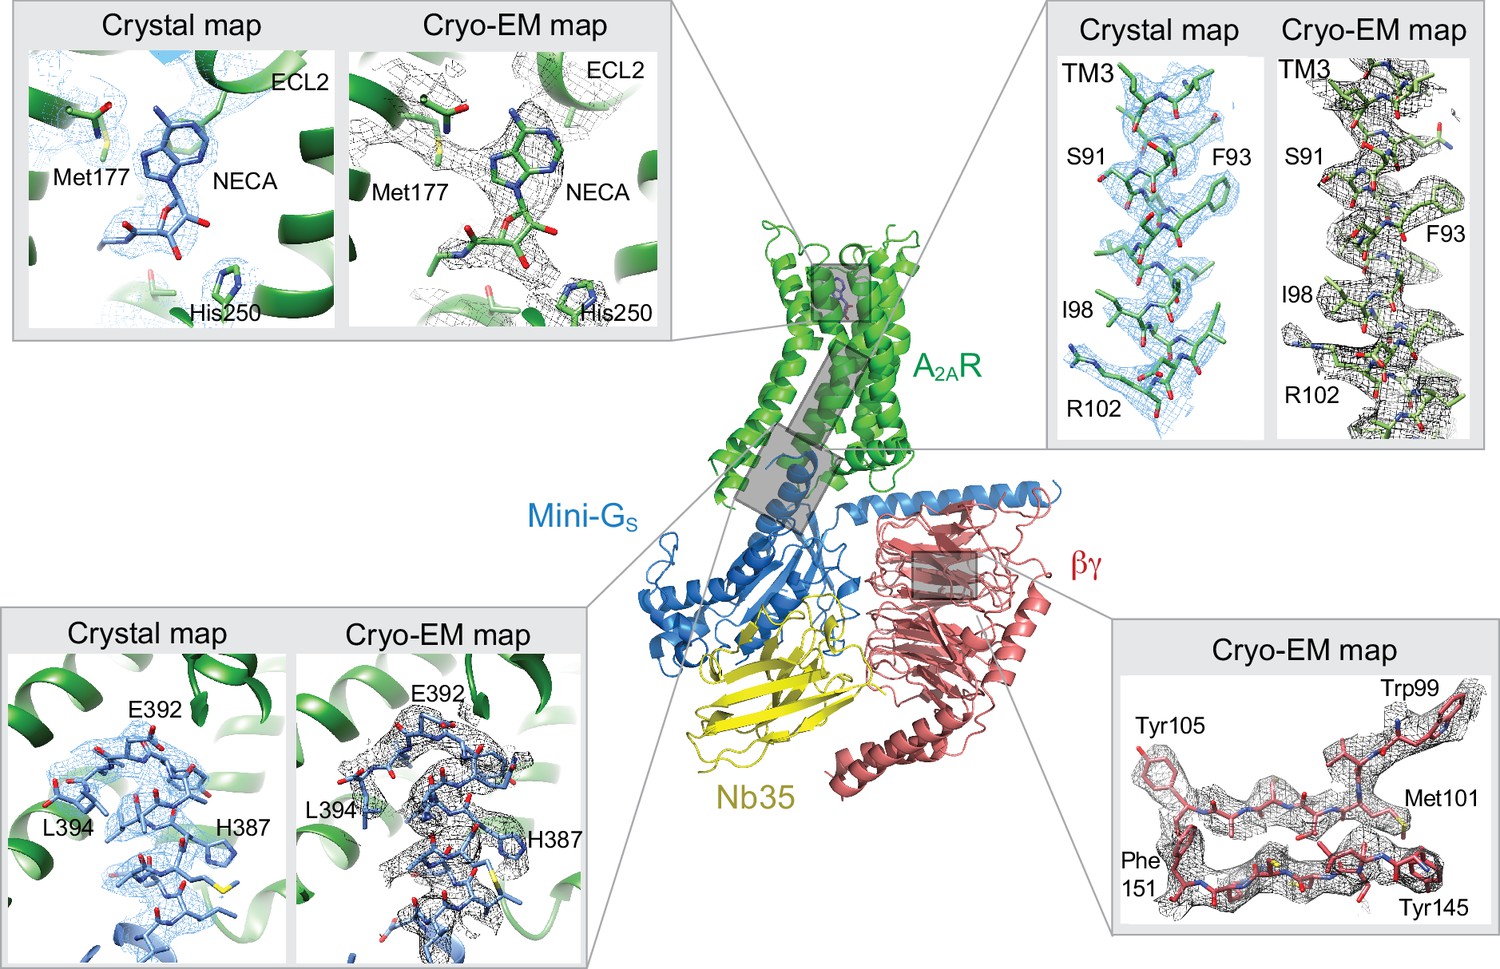
Comparison of map densities from the cryo-EM data and X-ray diffraction data.
The structure of the A2AR–heterotrimeric G protein complex determined by cryo-EM is depicted as a cartoon. The four panels show regions of the structure and the associated density maps from the cryo-EM data and, where present, electron density (2Fo-Fc) from the X-ray structure of the A2AR–mini-GS (PDB code 5g53). Densities for the maps shown in the panels were sharpened using the following B factors (resolution of filtering in parentheses): β subunit and A2AR, −170 Å2 (3.7 Å); mini-GS–A2AR interface, −130 Å2 (3.7 Å); NECA, −130 Å2 (4.1 Å).
Figure 6
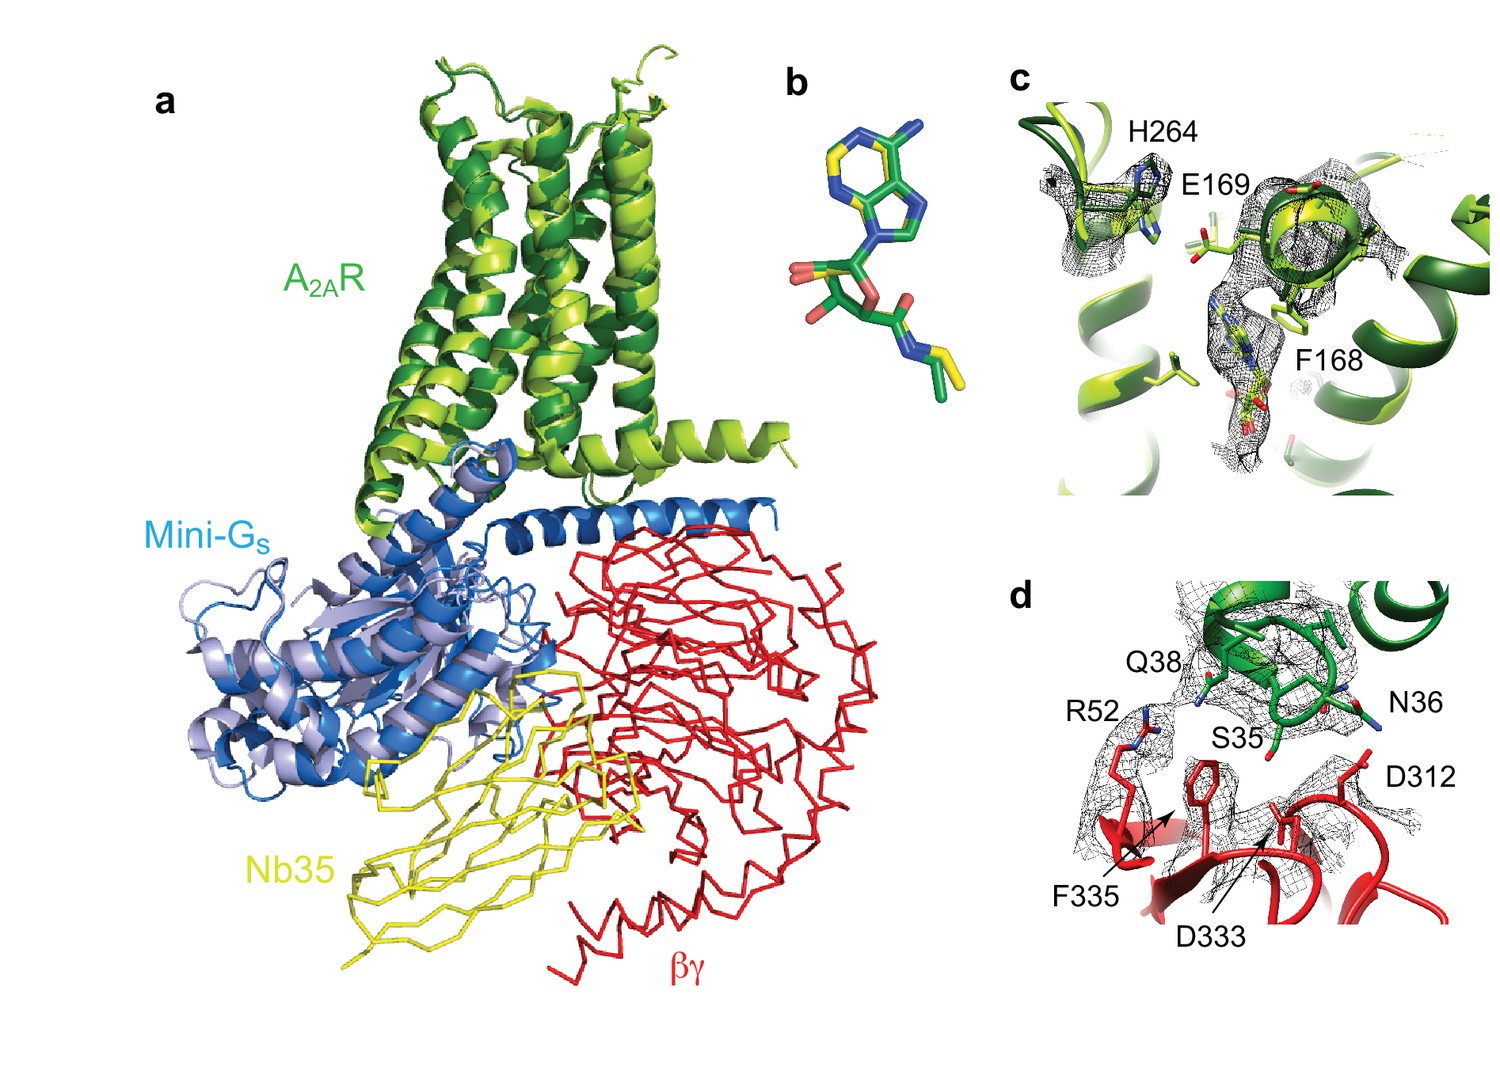
Structure of A2AR–heterotrimeric GS.
(a) Superposition of A2AR (pale green) coupled to mini-Gs (pale blue) with A2AR (dark green) coupled to mini-GS (dark blue), βγ (red) and Nb35 (yellow). (b) Superposition of NECA bound to A2AR in the cryo-EM and X-ray structures after alignment of A2AR (PyMol). (c) The position of His264 in the cryo-EM structure (dark green, density shown by black mesh), differs from its position in the X-ray structure (light green). No density is observed for the side chain of Glu169 in the cryo-EM structure, but when modelled it would be too far away to make a contact with His264. (d) The interface between ICL1 of A2AR (dark green) and the β subunit (red) is depicted, with density shown as a black mesh.
Figure 7
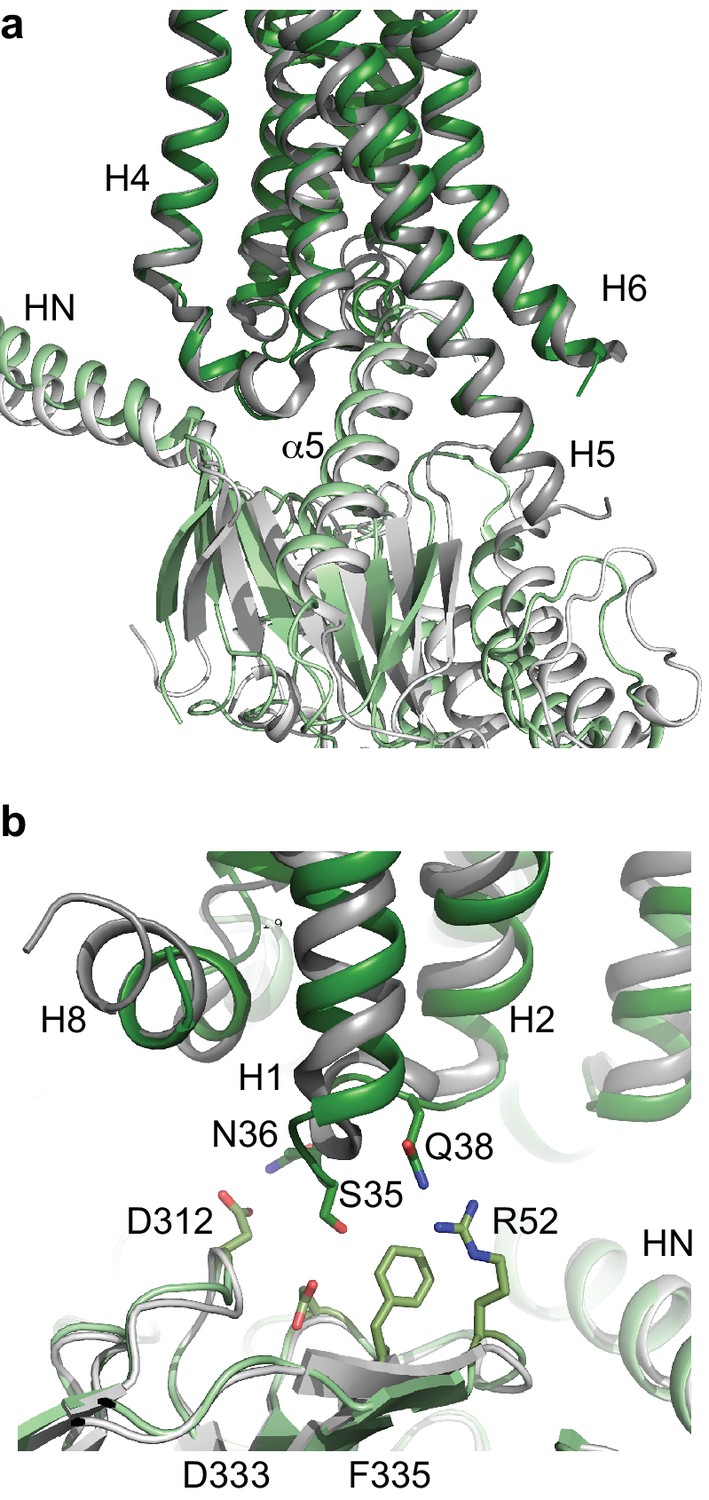
Comparison of A2AR and β2AR coupled to heterotrimeric GS.
(a) A2AR (dark green) and β2AR (dark grey) were aligned using regions of the receptors predicted to be within the cytoplasmic leaflet of the lipid bilayer. The position of mini-GS (pale green) coupled to A2AR is compared to the position of the GTPase domain of the α subunit (pale grey) coupled to β2AR. The βγ subunits and Nb35 have been omitted for clarity. (b) Transmembrane region H1 and ECL1 in A2AR (dark green) extends closer to the β subunit (pale green), whereas β2AR (dark grey) is too far away from the β subunit (pale grey) to make extensive contacts.
Tables
Table 1
Data collection and refinement statistics
https://doi.org/10.7554/eLife.35946.006| Data collection | |||
|---|---|---|---|
| Microscope | FEI titan krios | FEI titan krios | FEI titan krios |
| Detector | Falcon III + VPP | K2 Summit + VPP | K2 Summit |
| Pixel size (Å) | 1.07 | 1.14 | 0.66 |
| Voltage (kV) | 300 | 300 | 300 |
| Total electron dose (e-/Å2) | 30 | 40/40/30 | 50 |
| Micrographs collected | 827 | 906 | 2800 |
| Number of frames | 75 | 40/23/30 | 40 |
| Exposure time (s) | 60 | 10/4.6/6.5 | 10 |
| Electron dose per frame (e-/Å2) | 0.4 | 1/1.7/1 | 1.25 |
| Dose rate (e-/pixel/s) | 0.5 | 5.2/9/6 | 2 |
| Frame exposure (s) | 0.8 | 0.25/0.115/0.216 | 0.25 |
| Total number of particles (after 2D classification) | 232,739 | 313,879 | 166,313 |
| cryo-EM 3D Refinement | |||
| Resolution (Å) | 4.11 | 4.88 | 6.71 |
| Map sharpening B-factor (Å2) | −130 | −150 | −529 |
| Fourier shell correlation criterion | 0.143 | 0.143 | 0.143 |
| Particles used in final 3D refinement | 128,002 | 145,169 | 72,487 |
| Defocus (μm) | −0.2 to −1 | −0.3 to −1.2 | −1.2 to −3.5 |
| Coordinate Refinement and Validation | |||
| R.m.s. deviations | |||
| Bonds (Å) | 0.07 | ||
| Angles (°) | 0.984 | ||
| Ramachandran Favoured (%) | 94.6 | ||
| Ramachandran Allowed (%) | 4.89 | ||
| Ramachandran Outliers (%) | 0.51 | ||
| Molprobity score | 1.36 | ||
| Clashcore, all atoms | 0.79 | ||
| Favoured rotamers | 91.12 | ||
| EMRinger score | 1.93 | ||
| FSC (model vs map - 0.5 cut-off) (Å) | 4.08 | ||
| PDB and map deposition | |||
| PDB ID | 6GDG | ||
| EMDB ID | 4390 | ||
Additional files
-
Transparent reporting form
- https://doi.org/10.7554/eLife.35946.011
Download links
A two-part list of links to download the article, or parts of the article, in various formats.
Downloads (link to download the article as PDF)
Open citations (links to open the citations from this article in various online reference manager services)
Cite this article (links to download the citations from this article in formats compatible with various reference manager tools)
Cryo-EM structure of the adenosine A2A receptor coupled to an engineered heterotrimeric G protein
eLife 7:e35946.
https://doi.org/10.7554/eLife.35946


