Functional trade-offs and environmental variation shaped ancient trajectories in the evolution of dim-light vision
- University of Toronto, Canada
Figures
Figure 1 with 2 supplements
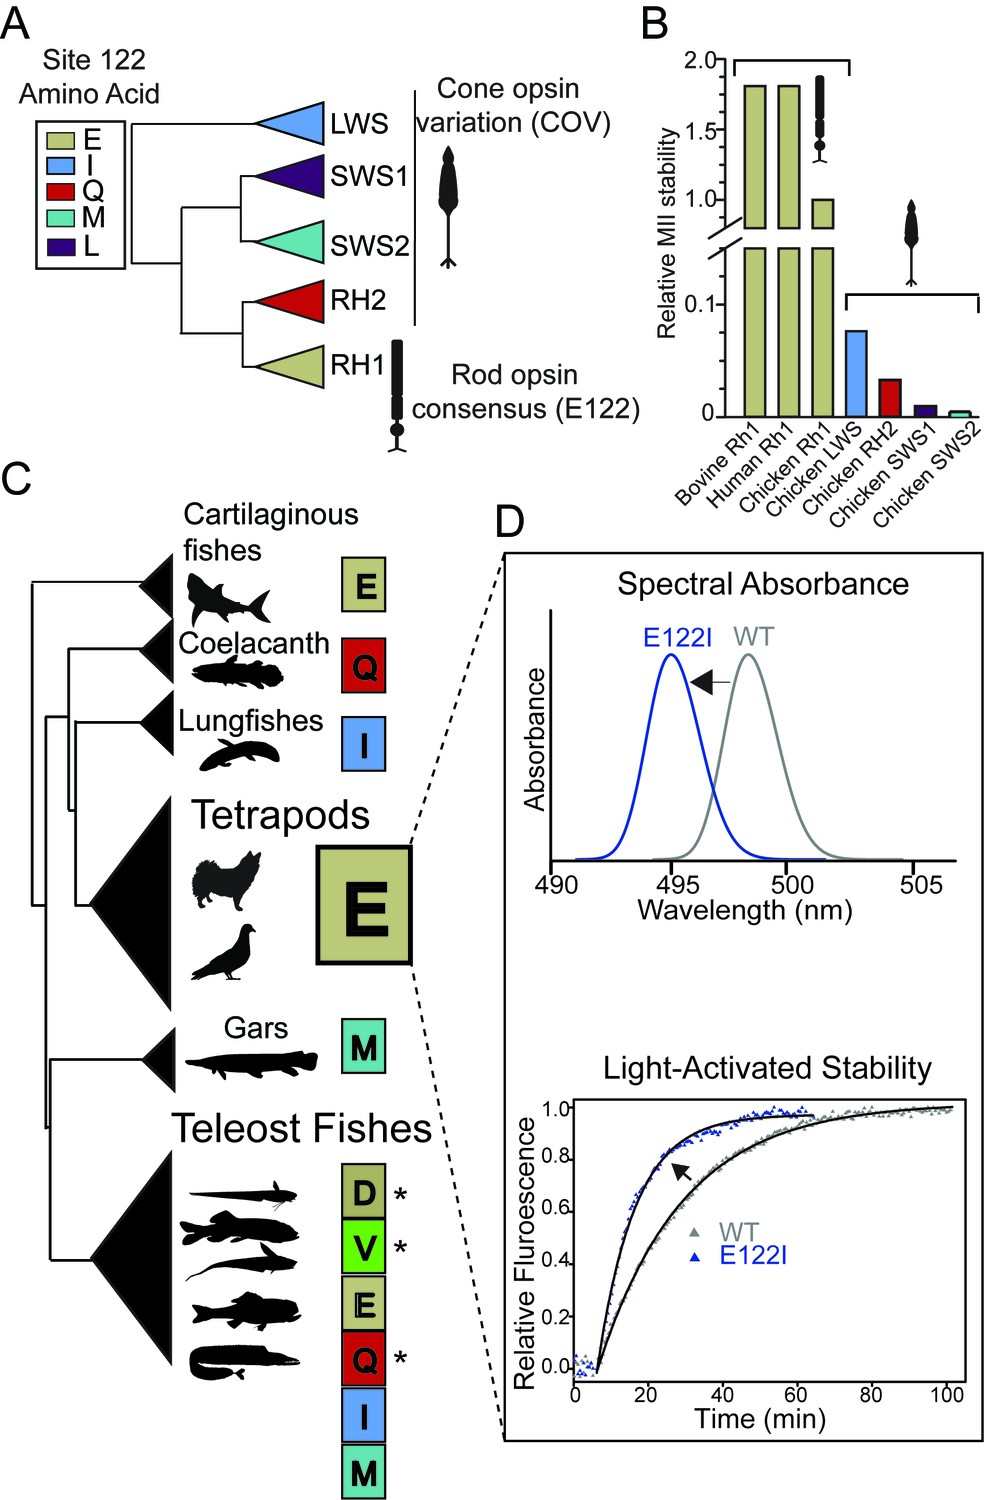
Natural variation at site 122 determines rhodopsin function and stability.
(A) Amino acid consensus residues at site 122 across vertebrate rod opsins (rhodopsin; RH1) and the cone opsins (long-wave (LWS), short-wave (SWS1 and SWS2) and middle-wave (RH2) sensitive). Modified from (Lamb et al., 2007). (B) Relative stability of the rod and cone opsin active-conformation (MII) in different vertebrates (Imai et al., 2005). (C) Schematic representation of naturally occurring cone opsin variants (COVs) and other amino acids across vertebrate RH1 (see Figure 1—figure supplements 1–2; Tables 1–2, Supplementary files 1–2). E122 is invariant in all Tetrapod RH1 genes sequenced to date. Natural deep-sea amino acid variants (Hunt et al., 2001; Yokoyama et al., 1999) are identified with an asterisk (*; Table 2). (D) Introduction of the ancestral cone opsin (LWS) variant I122 blue shifts tetrapod RH1 spectral absorbance and accelerates decay of the MII light-activated conformation.
Figure 1—figure supplement 1
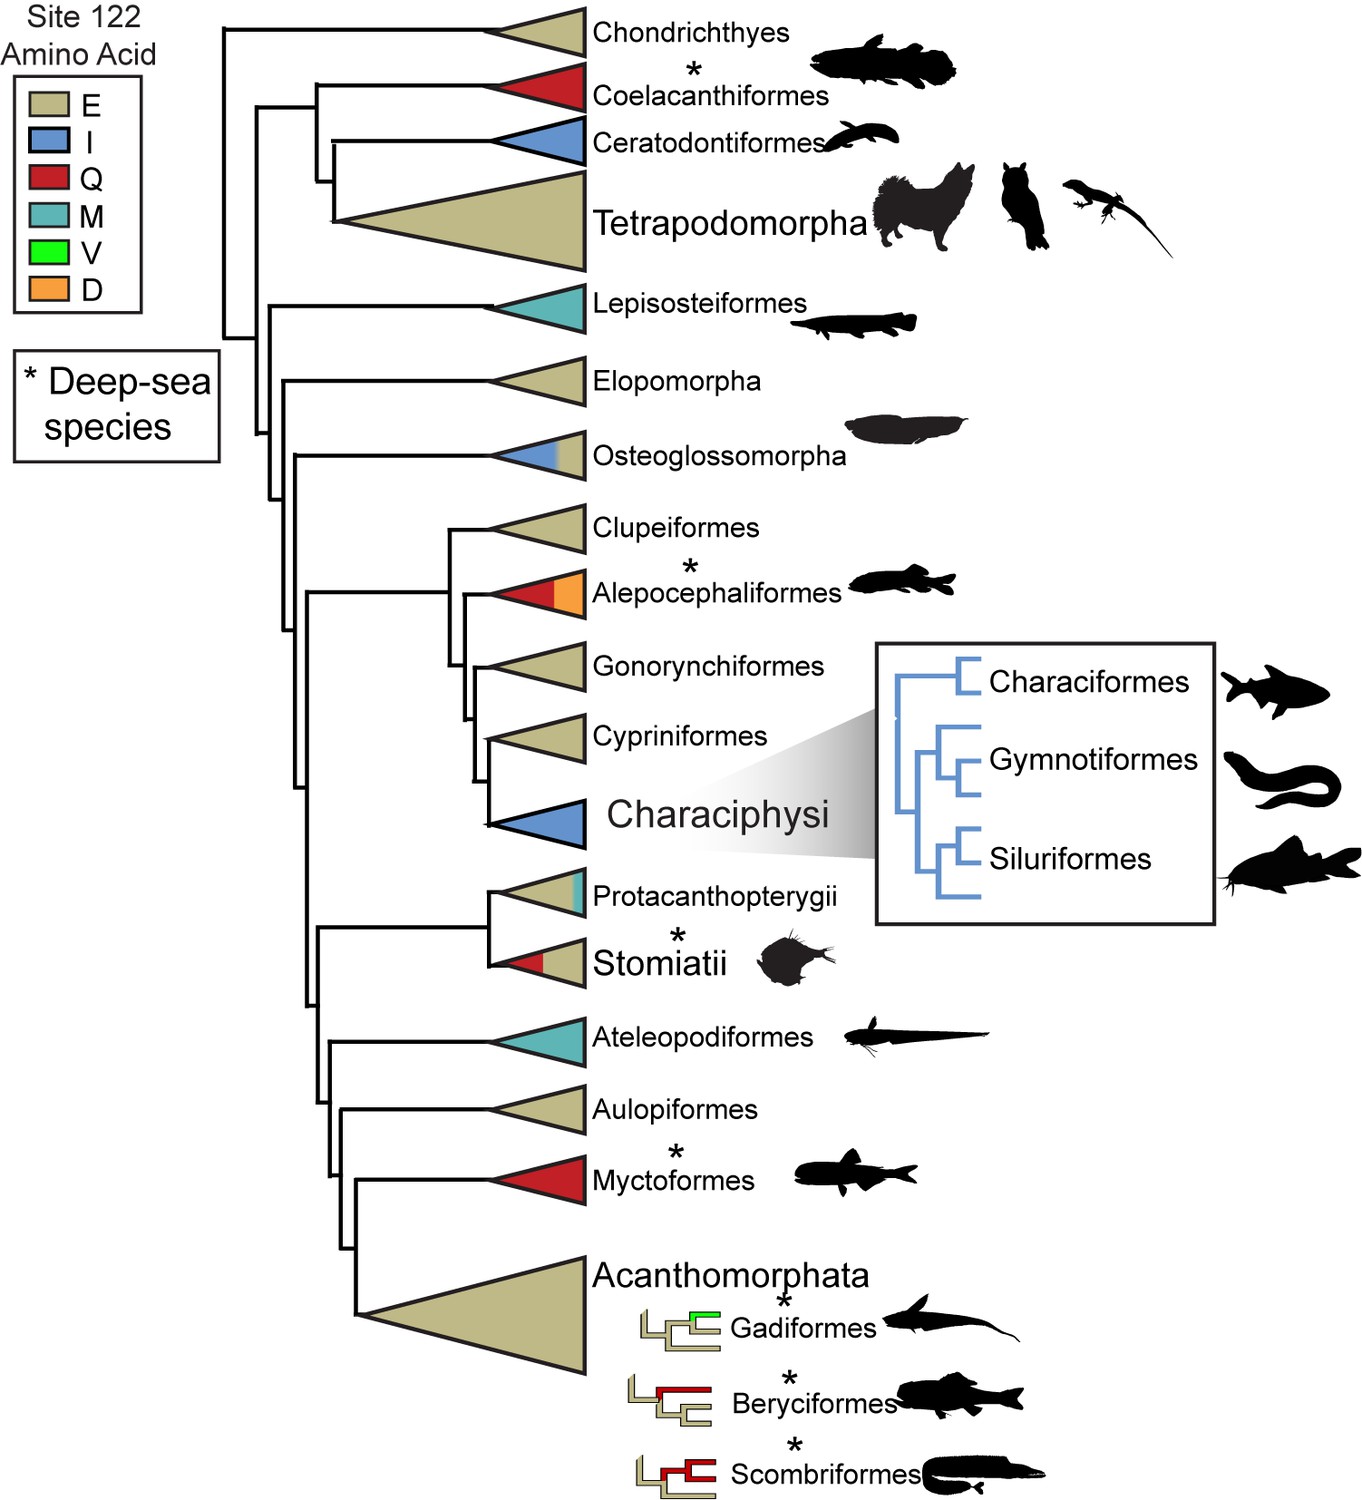
Schematic of RH1 site 122 variation across the vertebrate phylogeny.
All known tetrapod RH1 is conserved as E122. Asterisks indicate the presence of deep-dwelling species within a clade (Hunt et al., 2001; Yokoyama et al., 1999) (Table 2).
Figure 1—figure supplement 2
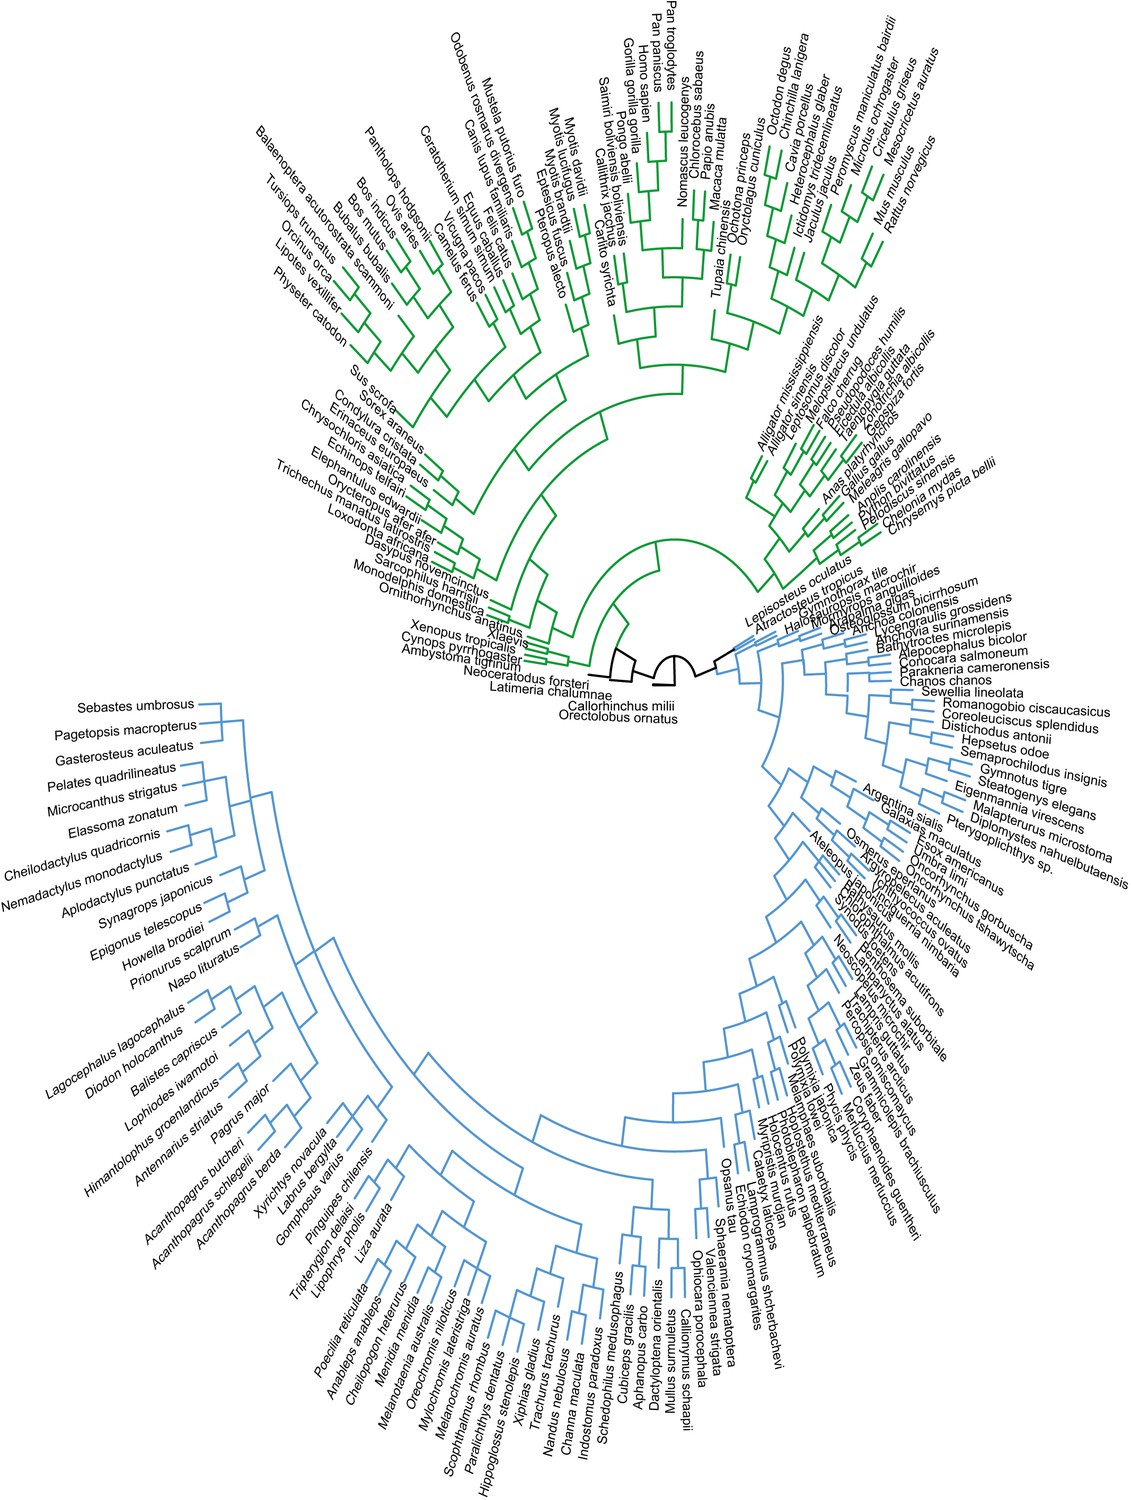
Vertebrate phylogeny used in computational analyses.
Tetrapods (green) and Teleost fishes (blue) along with outgroups (black) relationships were constructed according to species relationships (see Materials and methods).
Figure 2 with 1 supplement
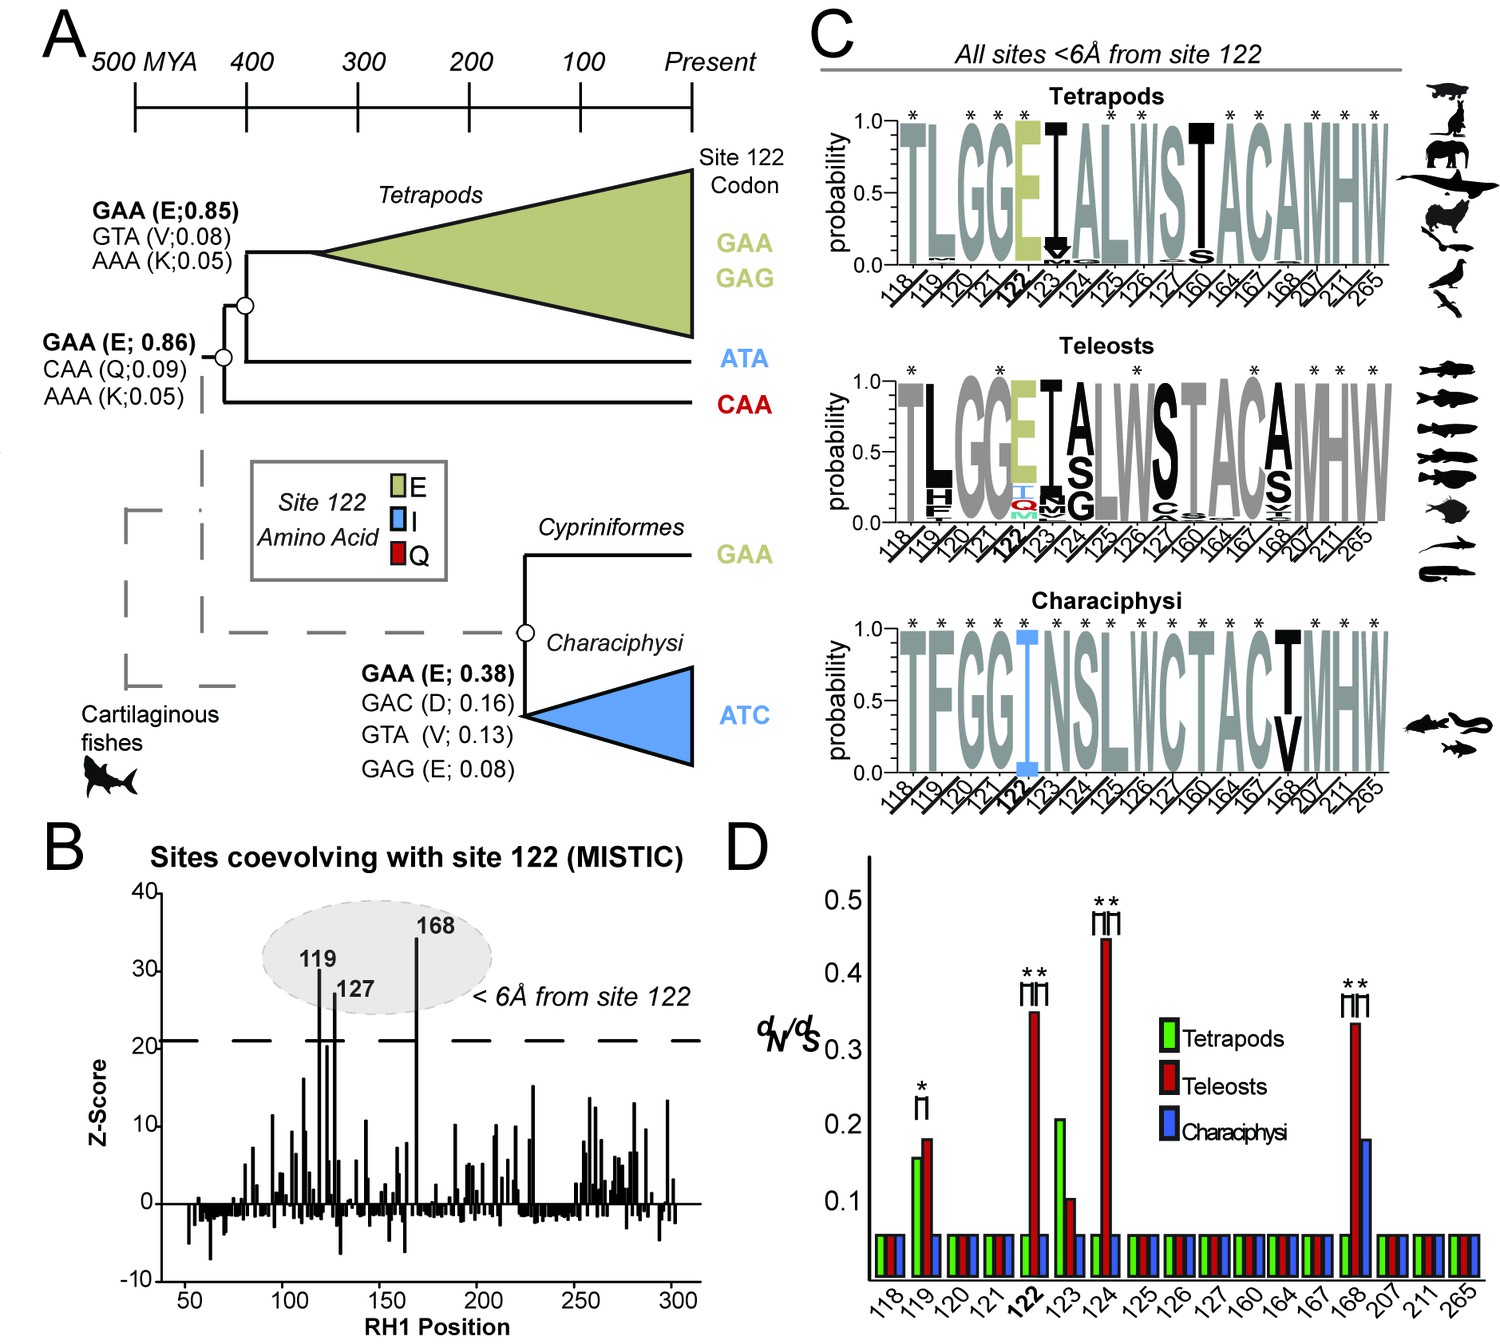
Local coevolutionary forces govern the evolution of site 122 differentially between tetrapods and fish (teleost) RH1.
(A) Extant and reconstructed codon variation at site 122 (Materials and methods). Despite a variety of residues at site 122 across the Coelacanth (Q122), Lungfish (I122; Ceratodontiformes), and Tetrapods (E122), GAA codons encoding for E122 are nevertheless predicted as the ancestral state with high posterior probabilities (shown in parentheses). E122 (GAA/GAG) is also likely to have been present in the last common ancestor of Cypriniformes and the Characiphysi, although with low posterior probabilities and therefore high uncertainty. I122 codon ATC is fixed in all Characiphysi rhodopsin to our knowledge (Supplementary file 3). Approximate divergence times are from (Hedges et al., 2015). (B) Mutual information (MI) analyses (MISTIC [Simonetti et al., 2013]) reveal all sites coevolving with site 122 are within 6 Å. Significance thresholds were determined by reference to the highest MI z-score from all sites across analyses of randomized datasets (n = 150; z-score cut-off = 21.6), as previously described (Ashenberg and Laub, 2013). (C) Sites within this radius displayed decreased amino acid variation in tetrapod and characiphysi RH1, where E122 and I122 are fixed, respectively (asterisks). (D) In tetrapods and characiphysi RH1, reduction in amino acid variation (relative to teleosts) at positions within the 6 Å radius were driven by increases in purifying selection on non-synonymous codons. Statistically significant gene-wide increases in purifying selection (*) between lineages were detected by likelihood ratio tests of alternative (Clade model C [Bielawski and Yang, 2004]) and null (M2a_REL [Weadick and Chang, 2012]) model analyses of codon substitution rates (dN/dS) ((p<0.001); Tables 3–5). Sites estimated to be under this increase in purifying selection (*) were those identified in the divergent site class of the CmC model analyses through a Bayes empirical Bayes analysis as previously described (Castiglione et al., 2017. Site-specific dN/dS estimates are from M8 analyses on phylogenetically pruned datasets (Tables 8–10; Figure 1—figure supplement 2; Figure 2—figure supplement 1).
Figure 2—figure supplement 1
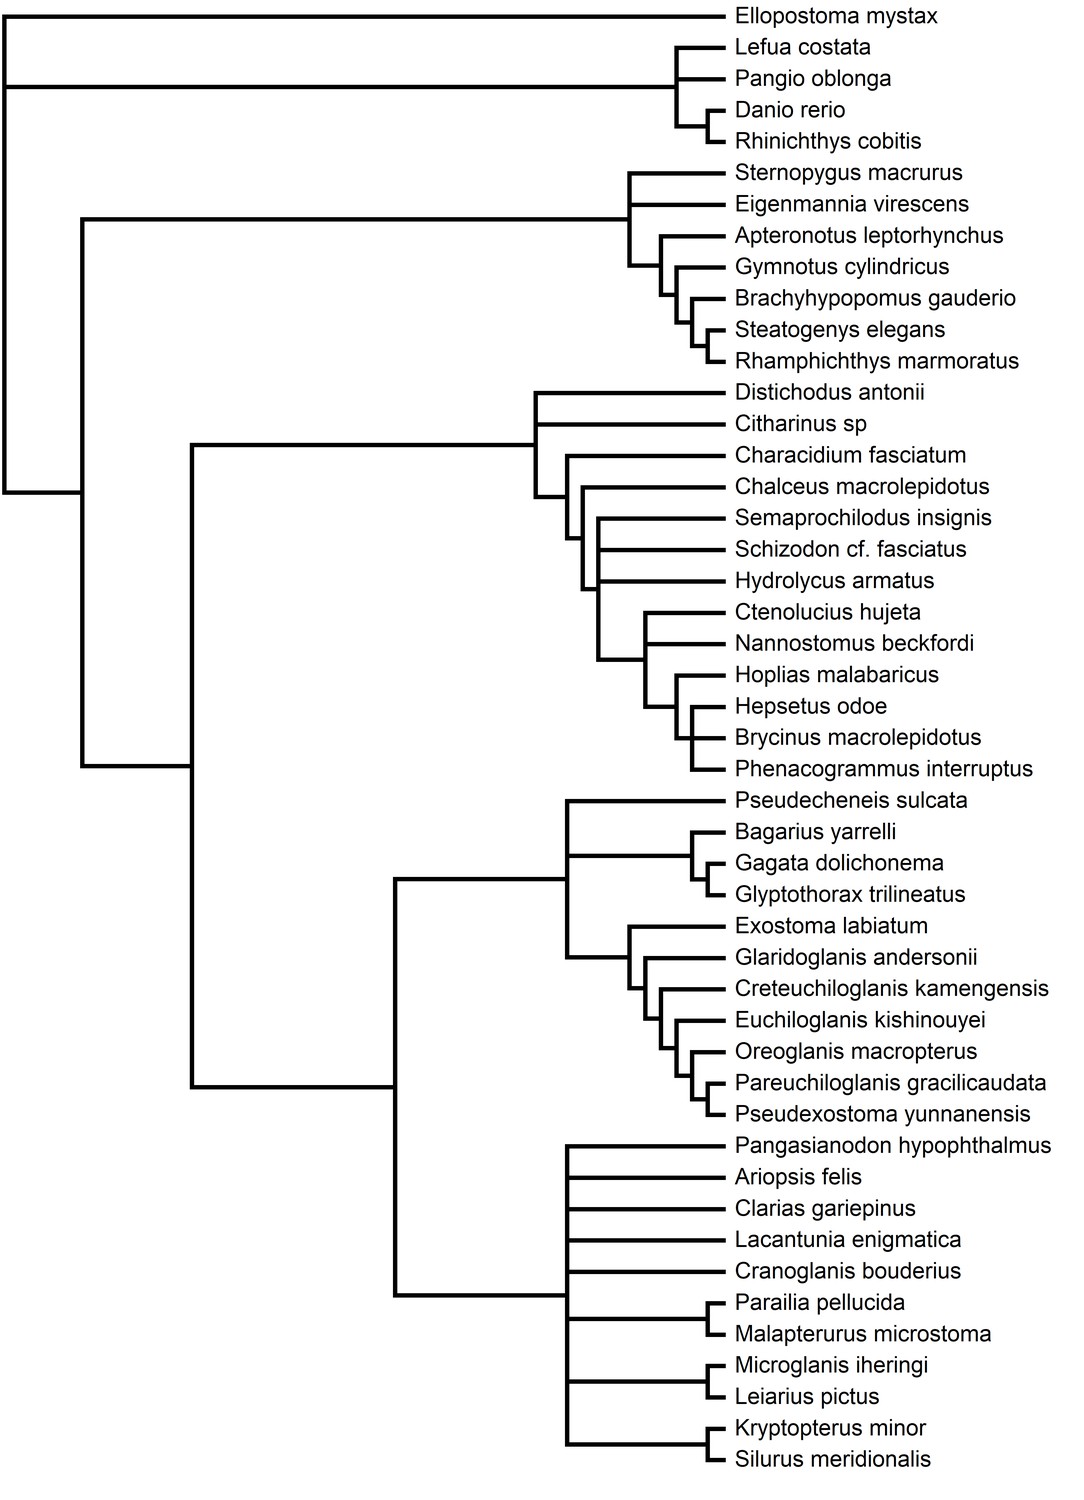
Phylogeny used in PAML computational analyses of Characiphysi rhodopsin coding-sequences, along with outgroups (Table 10; Supplementary file 3).
Relationships were constructed according to species relationships (see Materials and methods).
Figure 3
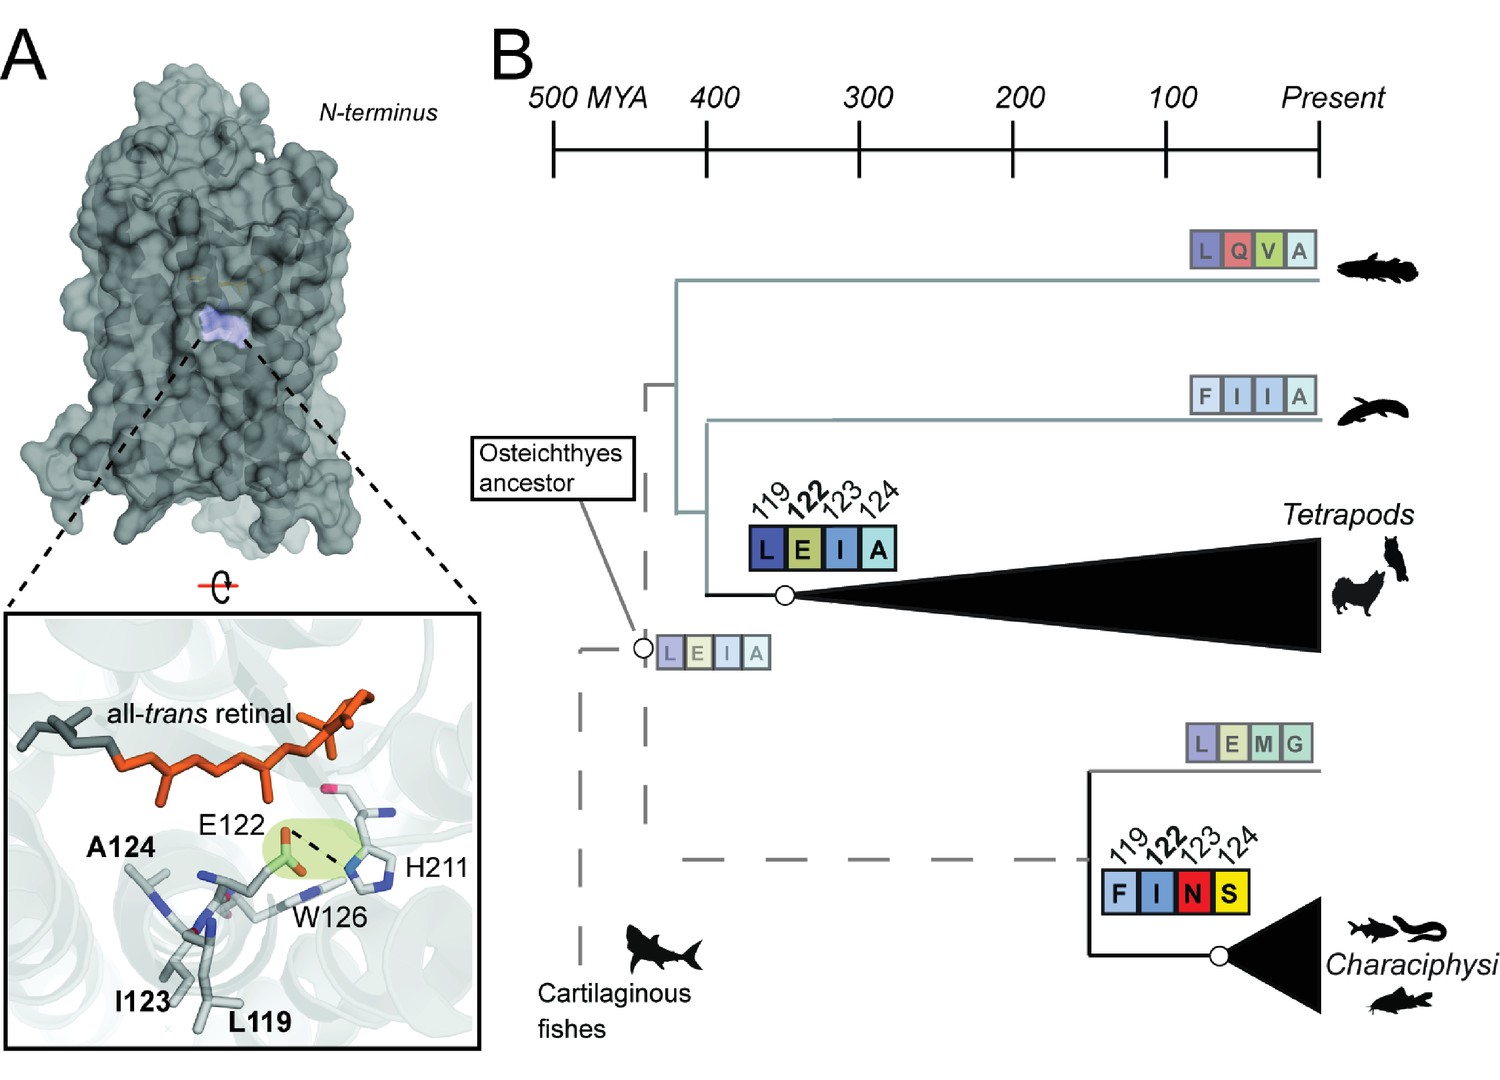
Coevolving sites form the LxxEIA and FxxINS motifs.
(A) Overview of tetrapod RH1 MII rhodopsin crystal structure (Choe et al., 2011 with coevolving sites. The green highlight and dashed line indicate the stabilizing hydrogen bond between E122-H211. (B) Reconstruction of residues at site 122 (Figure 2—figure supplement 1) and coevolving positions for ancestral characiphysi, tetrapod and outgroup rhodopsins indicates the entrenchment of two structural motifs centering around site 122 (Materials and methods). The LxxEIA (or LEIA) motif was also predicted as present within the ancestral Osteichthyes. Approximate divergence times are from (Hedges et al., 2015.
Figure 4 with 1 supplement
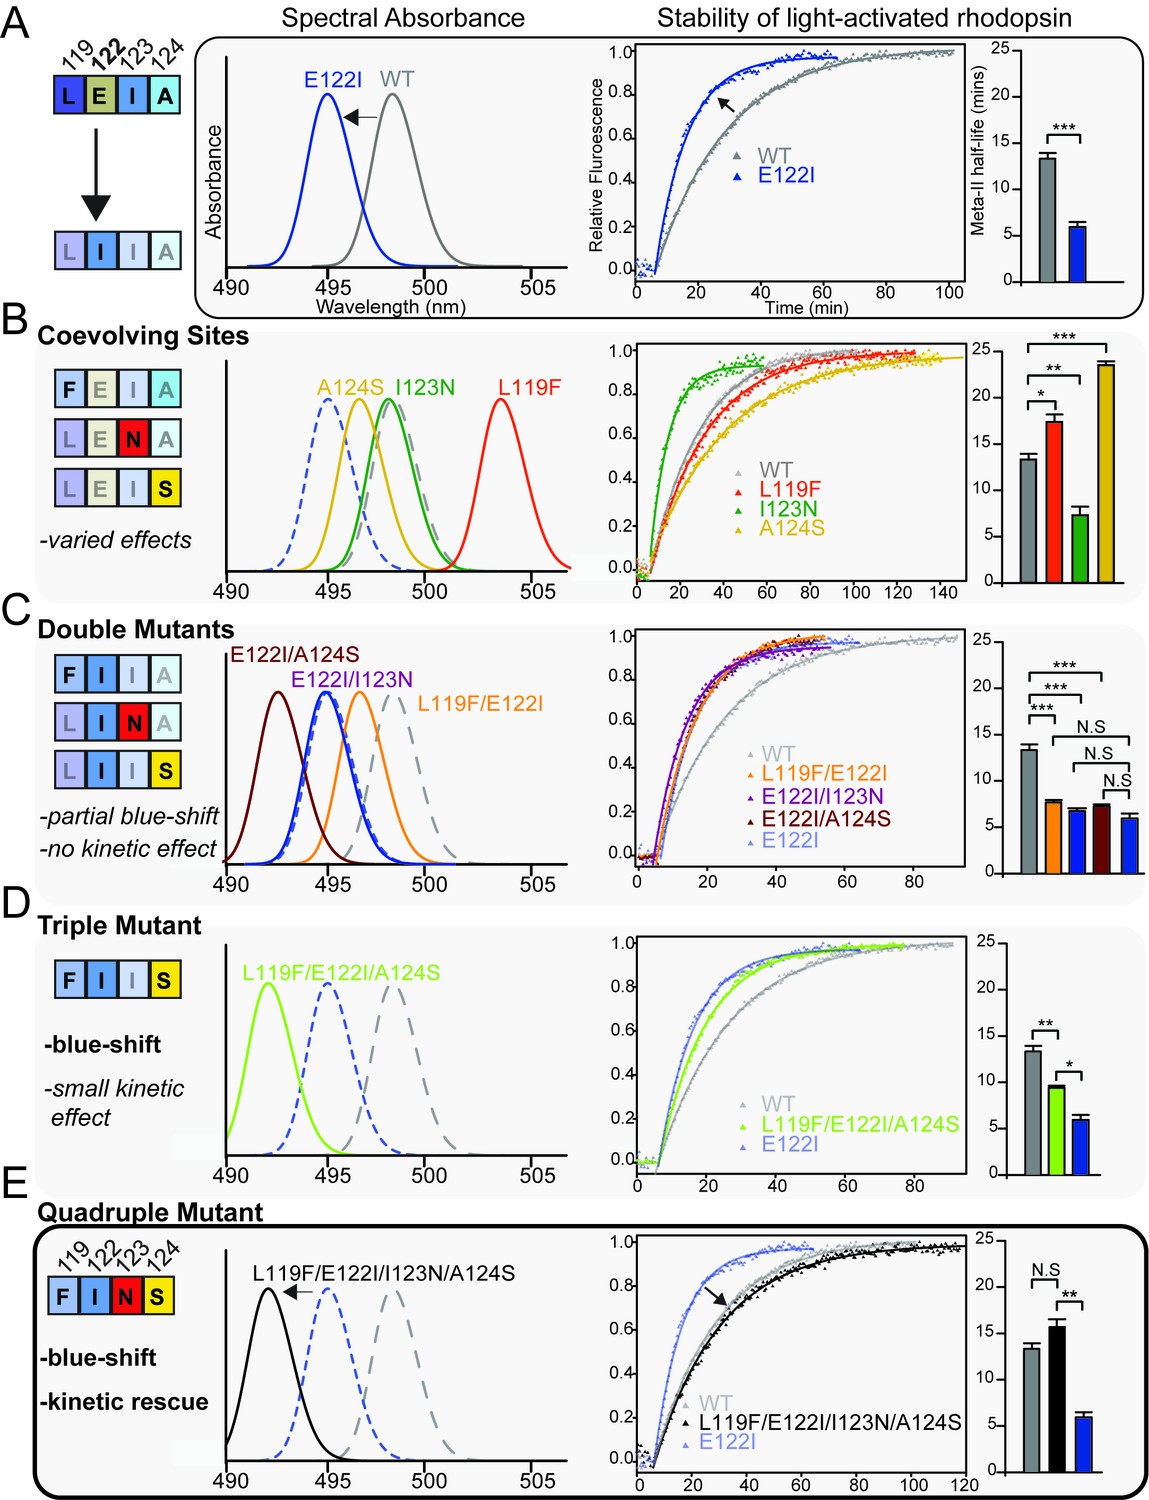
Coevolving sites modulate the pleiotropic functional effects of site 122.
The LEIA and FINS motifs are convergent solutions for high tetrapod RH1 active state (MII) stability but with different spectral absorbances. (A) The introduction of the ancestral cone opsin variant into tetrapod RH1 (E122I) blue-shifts rhodopsin absorbance λMAX and dramatically destabilizes the MII active-conformation (Figure 4—figure supplement 1; Table 6). Bar graphs show retinal release half-life values. (B) Substituting FINS motif residues into coevolving sites have varied effects on rhodopsin spectral tuning and the stability of the active-conformation. (C) Within the E122I background, FINS motif substitutions at coevolving sites have marked effects on spectral tuning, but no rescue effect on MII active-conformation stability. (D) Partial incorporation of the FINS motif within tetrapod rhodopsin produces further blue-shifting effects and has a significant but small stabilizing effect within the E122I background. (E) Full incorporation of the FINS motif into tetrapod RH1 maintains the absorbance blue-shift while fully rescuing the destabilizing effects of E122I on tetrapod RH1. Statistically significant differences in MII stability were calculated using two-tailed t-tests with unequal variance, with standard error reported in bar graphs (*p<0.05; **p<0.01; ***p<0.001). The number of biological replicates (i.e. separate elutions and/or purifications of rhodopsin) are described in Table 6.
Figure 4—figure supplement 1
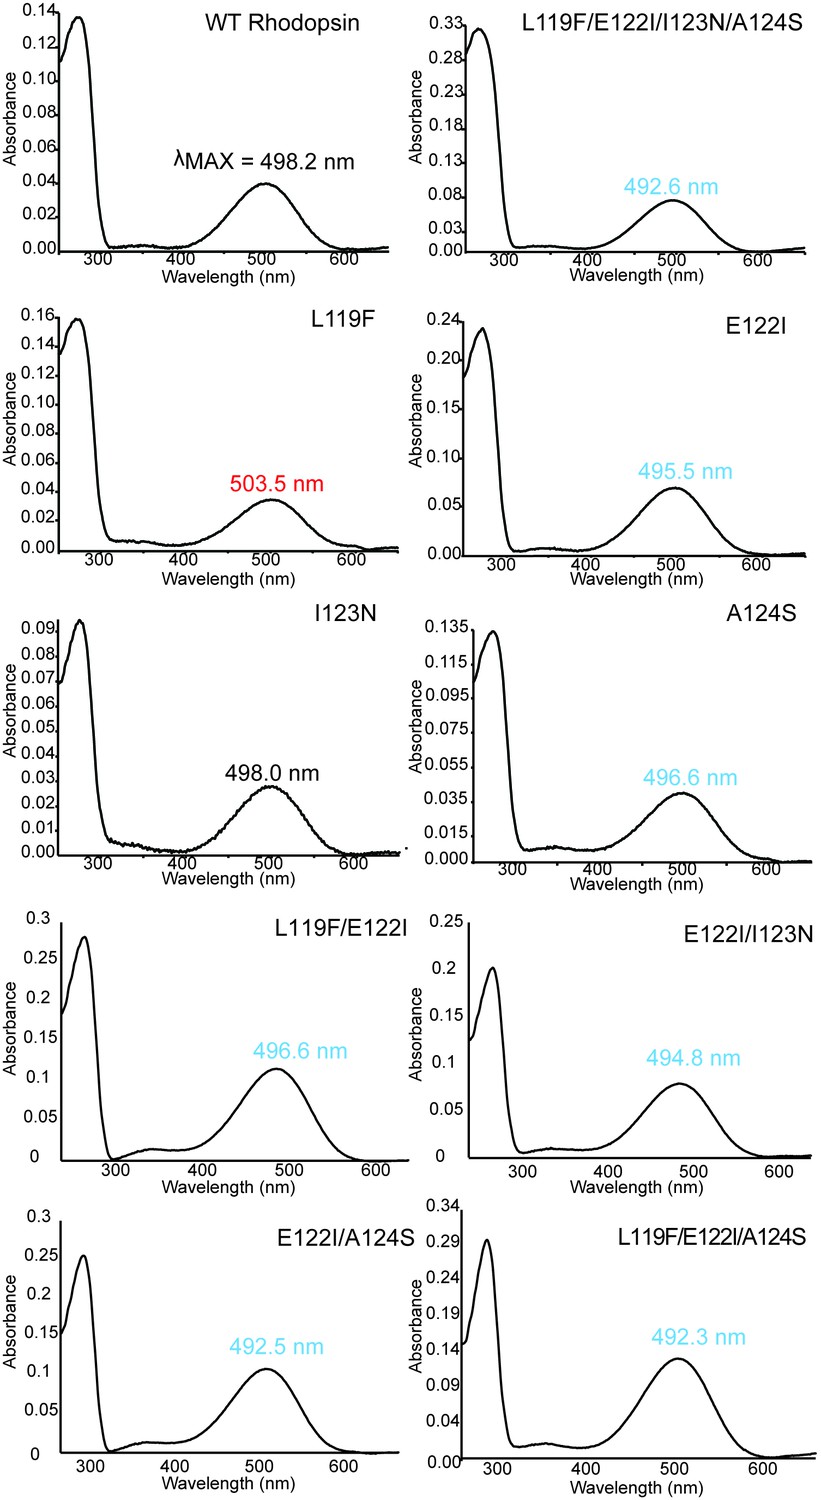
Absorbance spectra of dark-state WT and mutant rhodopsins with wavelength of maximum absorbance (λMAX) shown.
https://doi.org/10.7554/eLife.35957.015
Figure 5 with 1 supplement
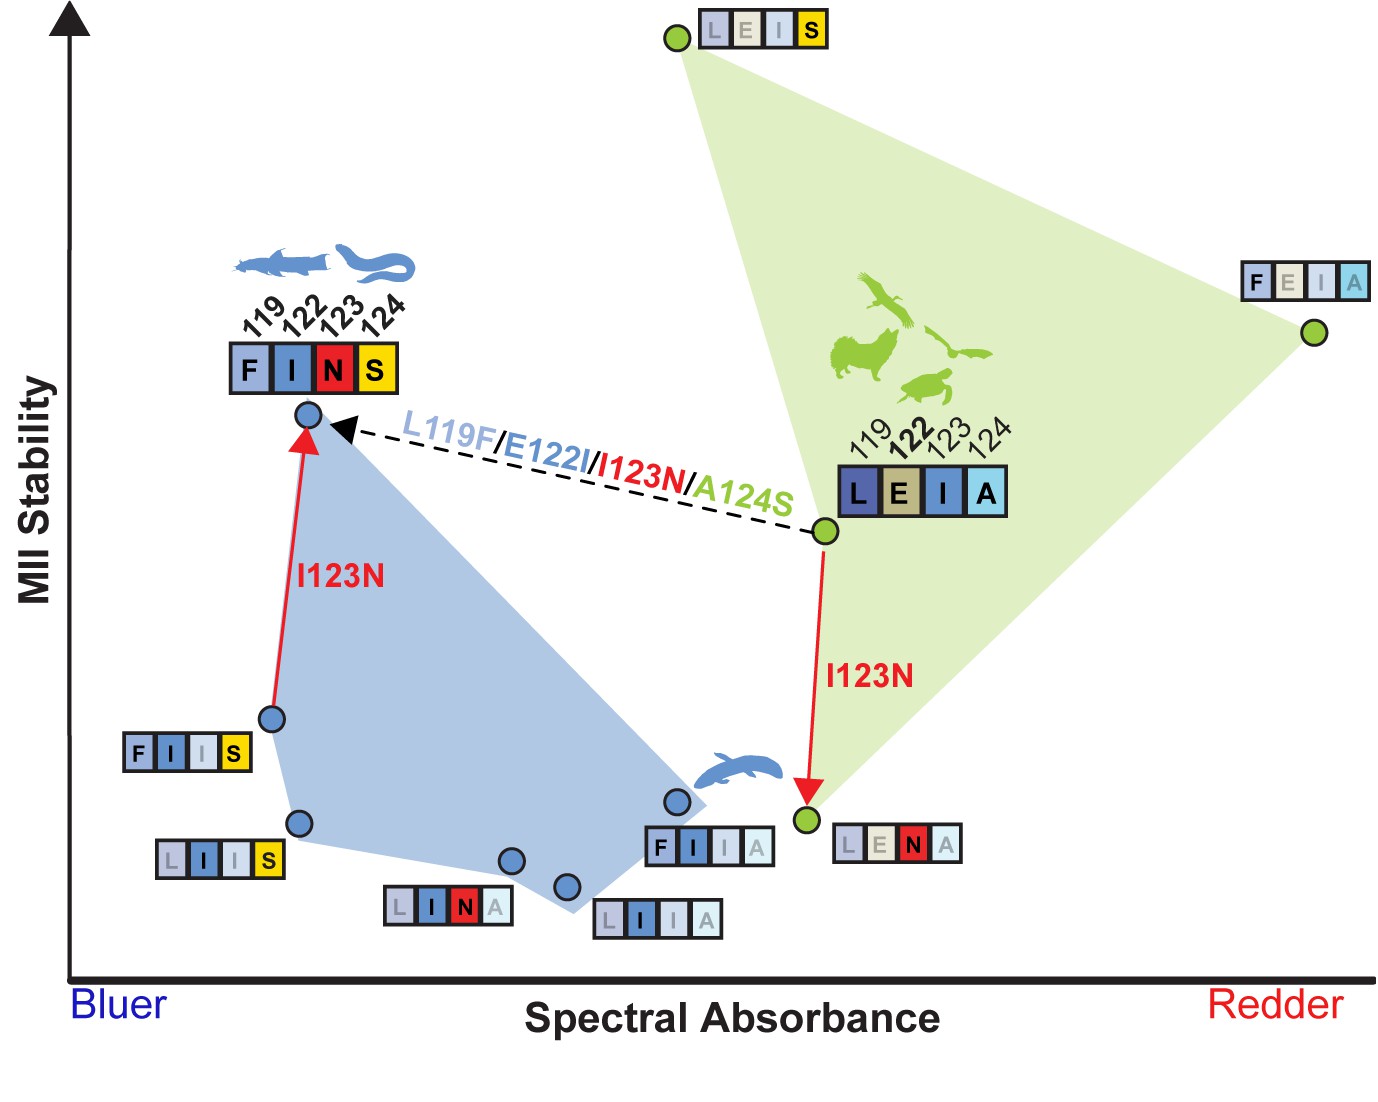
LEIA and FINS motifs are alternative solutions for high tetrapod RH1 MII stability within a limited sequence-function landscape.
Spectral absorbance (λMAX) and stability of the active-conformation (MII) of wild type and mutant tetrapod RH1 with E122 (green) and I122 (blue), respectively. The only natural intermediate between the wild-type tetrapod consensus motif (LEIA) and the wild-type Characiphysi motif (FINS) is ‘FIIA’ from Lungfish RH1. The mutation I123N has opposite effects on MII stability depending on background sequence (sign-epistasis), which may have closed the LEIA to FINS motif evolutionary trajectory (dashed line) for tetrapod RH1.Although reflecting a limited experimental dataset, these epistatic effects may have created indirect routes to the high MII stability of the FINS motif via intermediates with low MII stability.
Figure 5—figure supplement 1
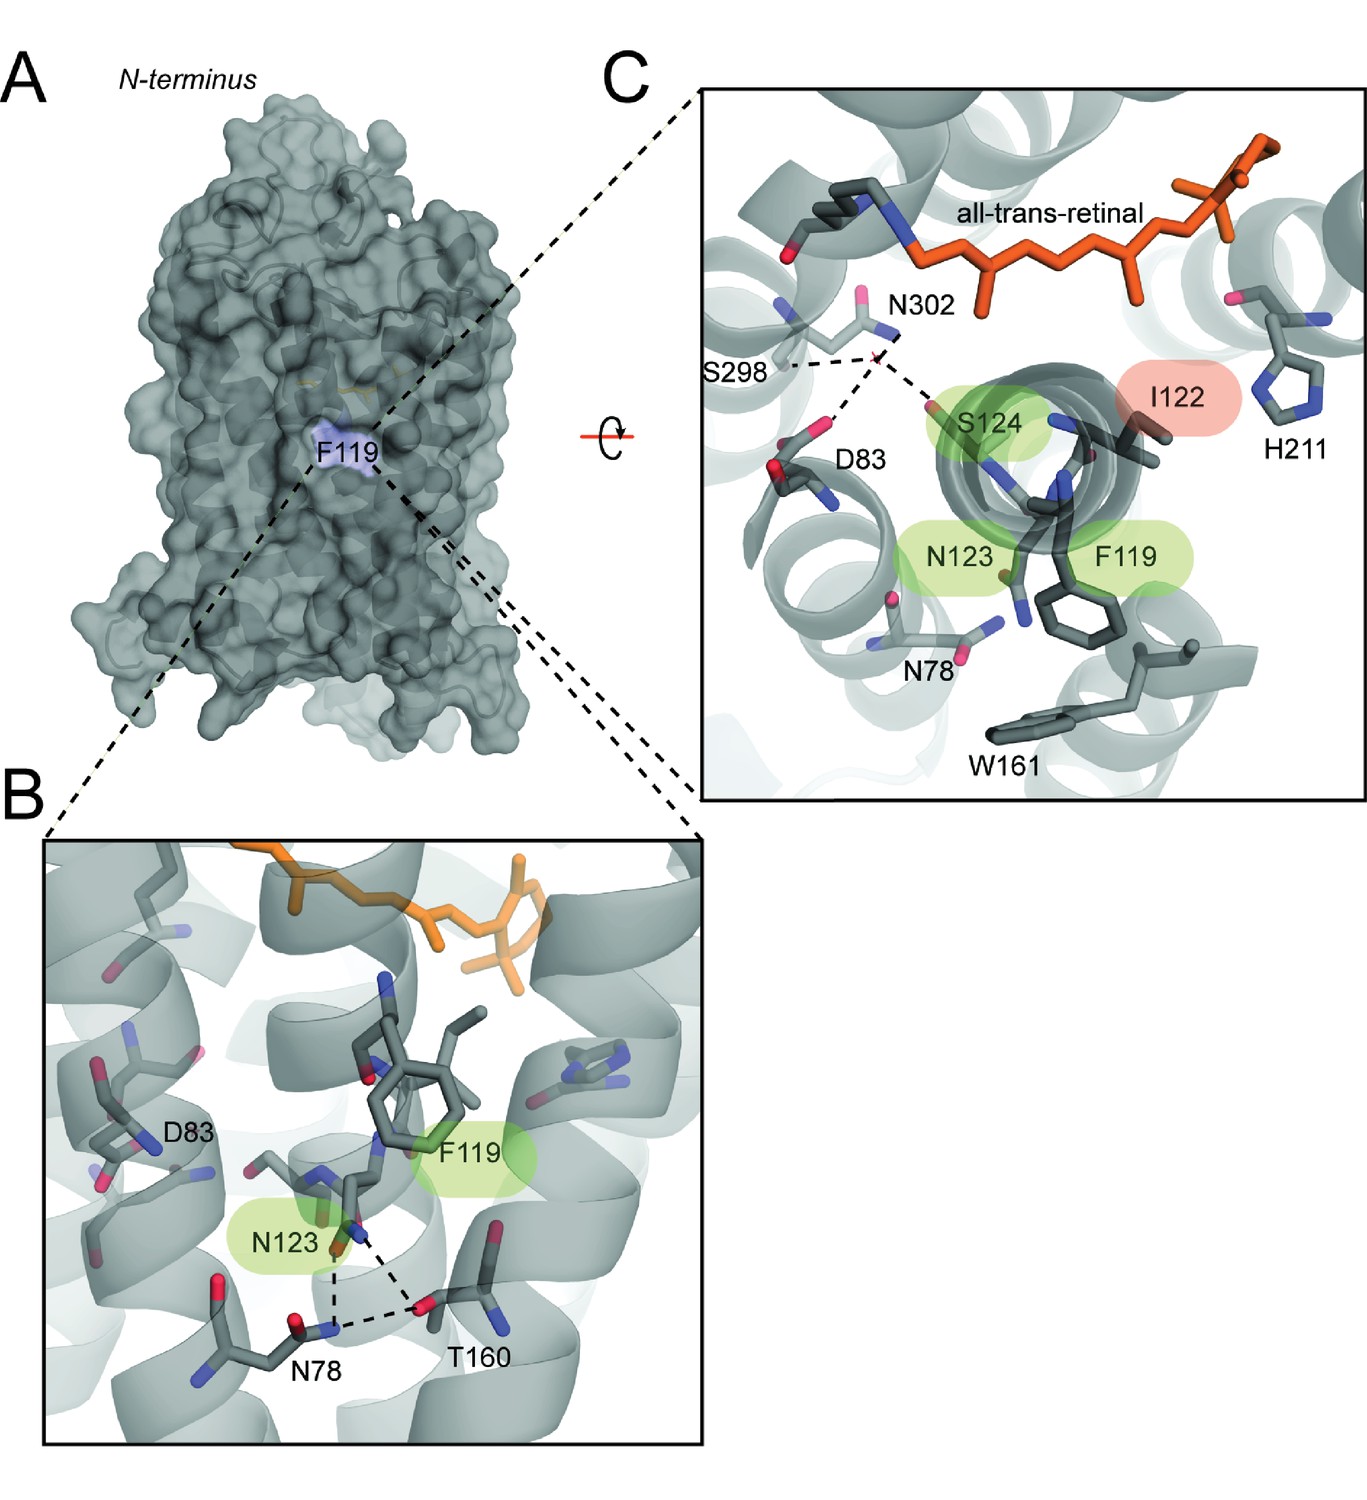
Compensatory effects at coevolving sites are mediated by a diversity of possible structural mechanisms.
(A) Overview of a homology modeled mutant rhodopsin MII structure containing the FINS motif (Materials and methods) (Choe et al., 2011. F119 is membrane-facing (blue). (B) Zoom-in of F119 and buried-site N123, which may form novel hydrogen bonds with nearby conserved residues N78 and T160. These interactions may alter the conformation of residues near S124, as shown in (C) where D83, S298 and N302 participate in a hydrogen bond network stabilizing the active-conformation (Choe et al., 2011). Cascading structural alterations from F119, to N123 to S124 (green) may therefore increase active-conformation stability by integrating into existing stabilizing motifs, therefore compensating for the loss of the E122-H211 hydrogen bond (red).
Tables
Table 1
Variation at sites 119-122-123-124 in Tetrapods and Outgroup rh1.
Sites with variation relative to the Vertebrate consensus (LEIA) are in bold and highlighted grey. Subterranean species are denoted (*).
| Species | Accession | Common name | 119 | 122 | 123 | 124 | |
|---|---|---|---|---|---|---|---|
| Outgroups | Callorhinchus milii | XP_007888679 | Elephant shark | L | E | I | G |
| Orectolobus ornatus | AFS63882 | Ornate wobbegong | L | E | V | S | |
| Latimeria chalumnae | XP_005997879 | Coelacanth | L | Q | V | A | |
| Neoceratodus forsteri | ABS89278 | Australian lungfish | F | I | I | A | |
| Mammals | Dasypus novemcinctus | XP_004477303 | 9-banded armadillo* | I | E | I | A |
| Eptesicus fuscus | XP_008150514 | Big brown bat | L | E | V | A | |
| Chrysochloris asiatica | XP_006868732 | Cape golden mole* | M | E | I | A | |
| Sorex araneus | XP_004613289 | Common Shrew* | L | E | V | A | |
| Tupaia chinensis | XP_006160726 | Tree Shrew | L | E | V | A | |
| Ictidomys tridecemlineatus | XP_005333841 | 13-line ground squirrel | L | E | V | A | |
| Rattus norvegicus | NP_254276 | brown rat | L | E | I | G | |
| Sarcophilus harrisii | XP_003762497 | Tasmanian devil | T | E | V | A | |
| Reptiles | Alligator mississippiensis | XM_006274155 | American alligator | L | E | V | A |
| Alligator sinensis | XP_006039462 | Chinese alligator | L | E | V | A | |
| Anolis carolinensis | NP_001278316 | Carolina anole | L | E | M | G | |
| Python bivittatus | XP_007423324 | Burmese python | L | E | M | A | |
| Amphibians | Ambystoma tigrinum | U36574 | Tiger salamander | M | E | I | A |
| Cynops pyrrhogaster | BAB55452 | Jap. Fire belly newt | L | E | I | G | |
| Xenopus tropicalis | NP_001090803 | Western clawed frog | L | E | M | A | |
| Xenopus laevis | NP_001080517 | African clawed frog | L | E | V | A |
Table 2
Fish rh1 with variation at site 122 do not necessarily have variation at coevolving sites 119, 123, and 124.
Sites with variation relative to the Vertebrate consensus (LEIA) are in bold and highlighted grey.
| Order | Species | Accession | Common name | 119 | 122 | 123 | 124 | Ecology notes from FishBase |
|---|---|---|---|---|---|---|---|---|
| Lepisosteiformes | Lepisosteus oculatus | JN230969.1 | spotted gar | L | M | I | S | Freshwater; brackish; demersal. (Ref. 2060) |
| Atractosteus tropicus | JN230970.1 | Tropical Gar | L | M | L | S | Freshwater; demersal | |
| Osteoglossiformes | Mormyrops anguilloides | JN230973.1 | Cornish Jack | T | I | I | A | Freshwater; demersal; potamodromous (Ref. 51243) |
| Osteoglossum bicirrhosum | KY026030.1 | Silver arowana | T | I | I | A | Freshwater; benthopelagic | |
| Alepocephalifromes | Alepocephalus bicolor | JN230974.1 | Bicolor slickhead | L | Q | I | A | Marine; bathydemersal; depth range 439–1080 m (Ref. 44023). |
| Bathytroctes microlepis | JN544540.1 | Smallscale smooth-head | L | D | I | A | Marine; bathypelagic; depth range 0–4900 m (Ref. 58018) | |
| Conocara salmoneum | JN412577.1 | Salmon smooth-head | L | Q | I | A | Marine; bathypelagic; depth range 2400–4500 m (Ref. 40643) | |
| Galaxiiformes | Galaxias maculatus | JN231000.1 | Inanga | L | M | I | G | Marine; freshwater; brackish; benthopelagic; catadromous (Ref. 51243). |
| Stomiatiformes | Argyropelecus aculeatus | JN412571.1 | Lovely Hatchetfish | H | Q | I | A | Marine; bathypelagic; depth range 100–2056 m (Ref. 27311) |
| Vinciguerria nimbaria | JN412570.1 | Oceanic lightfish | H | Q | V | A | Marine; bathypelagic; depth range 20–5000 m (Ref. 4470) | |
| Ateleopodiformes | Ateleopus japonicus | KC442218.1 | Pacific Jellynose Fish | L | M | I | S | Marine; bathydemersal; depth range 140–600 m (Ref. 44036). |
| Myctophiformes | Benthosema suborbitale | JN412576.1 | Smallfin lanternfish | H | Q | V | G | Marine; bathypelagic; oceanodromous; depth range 50–2500 m (Ref. 26165) |
| Lampanyctus alatus | JN412575.1 | Winged lanternfish | H | Q | V | A | Marine; bathypelagic; oceanodromous; depth range 40–1500 m (Ref. 26165) | |
| Neoscopelus microchir | KC442224.1 | Shortfin neoscopelid | L | Q | I | A | Marine; bathypelagic; depth range 250–700 m (Ref. 4481) | |
| Gadiiformes | Coryphaenoides guentheri | JN412578.1 | Gunther’s grenadier | L | V | I | A | Marine; bathydemersal; depth range 831–2830 (Ref. 1371) |
| Beryciformes | Melamphaes suborbitalis | JN231006.1 | Shoulderspine bigscale | L | Q | I | A | Marine; brackish; bathypelagic; depth range 500–1000 m (Ref. 31511). |
| Holocentriformes | Holocentrus rufus | KC442230.1 | Longspine squirrelfish | L | M | I | S | Marine; reef-associated; depth range 0–32 m (Ref. 3724). |
| Myripristis murdjan | KC442231.1 | Pinecone soldierfish | L | M | I | G | Marine; reef-associated; depth range 1–50 m (Ref. 9710) | |
| Scombriformes | Aphanopus carbo | EU637938.1 | Black scabbardfish | H | Q | I | G | Marine; bathypelagic; oceanodromous (Ref 108735); 200–2300 m (Ref. 108733) |
| Cubiceps gracilis | EU637952.1 | Driftfish | - | Q | I | A | Marine; pelagic-oceanic; oceanodromous (Ref. 51243); |
Table 3
Results of Clade Model C (CmC) analyses of vertebrate rh1 under various partitions.
https://doi.org/10.7554/eLife.35957.010| Model and Foreground† | ΔAIC‡ | lnL | Parameters | Null | P [df] | ||
|---|---|---|---|---|---|---|---|
| ω0 | ω1 | ω2/ωd | |||||
| M2a_rel | 225.5 | −47185.37 | 0.02 (69%) | 1 (3%) | 0.20 (28%) | N/A | - |
| CmC_Tetrapod Branch | 97.44 | −47119.33 | 0.20 (28%) | 1 (3%) | 0.02 (69%) Tetra Br: 0.00 | M2a_rel | 0.000 [1] |
| CmC_Tetrapod | 4.92 | −47073.06 | 0.02 (67%) | 1 (3%) | 0.24 (30%) Tetra: 0.13 | M2a_rel | 0.000 [1] |
| CmC_Teleost | 1.88 | −47071.54 | 0.02 (67%) | 1 (3%) | 0.14 (30%) Teleost: 0.24 | M2a_rel | 0.000 [1] |
| CmC_Teleost vs Tetrapod | 0* | −47069.60 | 0.02 (67%) | 1 (3%) | 0.17 (30%) Tetra: 0.13 Teleost: 0.24 | M2a_rel | 0.000 [2] |
-
†The foreground partition is listed after the underscore for the clade models and consists of either: the clade of Teleost fishes (Teleost); the clade Tetrapods (Tetrapod;Tetra) or branch leading to tetrapods (Tetrapod branch; Tetra Br); or the clades of both the teleost fishes and tetrapods as two separate foregrounds (Teleost vs Tetrapods). In any partitioning scheme, the entire clade was tested, and all non-foreground data are present in the background partition.
‡All ΔAIC values are calculated from the lowest AIC model. The best fit is shown with an asterisk (*).
-
ωd is the divergent site class, which has a separate value for the foreground and background partitions.
¶Significant p-values (α ≤0.05) are bolded. Degrees of freedom are given in square brackets after the p-values.
-
Abbreviations—lnL, ln Likelihood; p, p-value; AIC, Akaike information criterion.
Table 4
Analyses used to elucidate sites coevolving with site 122 in Vertebrate rhodopsins (rh1).
In bold are the results of interest described in the main text, including: elevated dN/dS, long-term shifts in selection between teleosts and tetrapods, amino acid statistical covariation with site 122 in the teleost dataset, and phylogenetically correlated amino acid variation with site 122.
| Site | Distance to site 122 (Å)* | Tetrapod M8 dN/dS† | Teleost M8 dN/dS† | Characiphysi M8 dN/dS† | Posterior probability of long-term shift in selection (tetrapod/characiphysi)‡ | Z-score covariation§ | Significant correlated evolution? |
|---|---|---|---|---|---|---|---|
| 118 | 5 | 0.05 | 0.05 | 0.05 | 0.00/0.00 | −1.54 | No |
| 119 | 3.5 | 0.14 | 0.168 | 0.05 | 0.57/0.19 | 30.2 | Yes |
| 120 | 3.1 | 0.05 | 0.05 | 0.05 | 0.00/0.00 | −1.91 | No |
| 121 | N/A | 0.05 | 0.05 | 0.05 | 0.00/0.00 | −0.94 | No |
| 122 | N/A | 0.05 | 0.322 | 0.05 | 1.00/1.00 | N/A | N/A |
| 123 | N/A | 0.19 | 0.094 | 0.05 | 0.00/0.00 | 20.4 | No |
| 124 | 3.2 | 0.05 | 0.411 | 0.05 | 1.00/1.00 | 5.53 | No |
| 125 | 3.4 | 0.05 | 0.05 | 0.05 | 0.00/0.00 | 1.19 | No |
| 126 | 3.7 | 0.05 | 0.05 | 0.05 | 0.00/0.00 | −1.60 | No |
| 127 | 4.9 | 0.05 | 0.065 | 0.05 | 0.00/0.00 | 27.1 | Yes |
| 160 | 5.1 | 0.05 | 0.05 | 0.05 | 0.00/0.00 | 3.90 | No |
| 164 | 4.2 | 0.05 | 0.05 | 0.05 | 0.00/0.00 | 7.88 | No |
| 167 | 3.8 | 0.05 | 0.05 | 0.05 | 0.00/0.00 | −1.38 | No |
| 168 | 5.9 | 0.05 | 0.308 | 0.192 | 1.00/1.00 | 34.2 | No |
| 207 | 4.9 | 0.05 | 0.05 | 0.05 | 0.00/0.00 | −1.21 | No |
| 211 | 2.7 | 0.05 | 0.05 | 0.05 | 0.00/0.00 | −1.38 | No |
| 265 | 5.1 | 0.05 | 0.05 | 0.05 | 0.00/0.00 | −1.44 | No |
-
∗From structural analysis of distances between amino acids and site 122 within the MII crystal structure 3PQR (Choe et al., 2011).
-
‡Bayes empirical Bayes posterior probability of long-term shift in selection calculated in Clade model C (CmC) (Yang, 2007) analyses (CmC_Teleost vs Tetrapod/CmC_Characi clade) described in Tables 3 and 5, respectively.
§Phylogenetically corrected MI z-scores (MISTIC; [Simonetti et al., 2013]) of covariation with site 122 from analyses on Teleost RH1 dataset. Values were considered significant if greater than the top absolute z-score (21.6) from all site-wise comparisons from all analyses of 150 randomized datasets, as described (Ashenberg and Laub, 2013).
-
¶Tests of correlated evolution in amino acid variation (Pagel, 1994) between a given site and site 122. p-values were calculated by performing Monte Carlo tests using data from simulations (n > 1000) in MESQUITE (Maddison and Maddison, 2017). p-Values were subjected to a Bonferroni-correction to determine significance (p<0.002).
Table 5
Results of Clade Model C (CmC) analyses of teleost rh1 under various partitions.
https://doi.org/10.7554/eLife.35957.012| Model and Foreground† | ΔAIC‡ | lnL | Parameters | Null | P [df] | ||
|---|---|---|---|---|---|---|---|
| ω0 | ω1 | ω2/ωd | |||||
| M2a_rel | 17.1 | −30987.99 | 0.01 (60%) | 1 (5%) | 0.19 (35%) | N/A | - |
| CmC_Characi branch | 19.05 | −30986.96 | 0.01 (60%) | 1 (5%) | 0.19 (35%) Char Br: 0.20 | M2a_rel | 0.794 [1] |
| CmC_Characi clade | 0* | −30977.43 | 0.00 (60%) | 1 (5%) | 0.20 (20%) Char Cl: 0.10 | M2a_rel | 0.000 [1] |
-
The foreground partition is listed after the underscore for the clade models and consists of either: the ancestral branch leading to the Characiphysi (Characi branch; Char Br) or the entire Characiphysi clade (Characi clade; Char Cl). In any partitioning scheme, the entire clade was tested, and all non-foreground data are present in the background partition.
‡All ΔAIC values are calculated from the lowest AIC model. The best fit is bolded with an asterisk (*).
-
§ωd is the divergent site class, which has a separate value for the foreground and background partitions.
Significant p-values (α ≤0.05) are bolded. Degrees of freedom are given in square brackets after the p-values.
-
Abbreviations—lnL, ln Likelihood; p, p-value; AIC, Akaike information criterion.
Table 6
Summary of spectroscopic assays on wild-type and mutant rhodopsins.
https://doi.org/10.7554/eLife.35957.016| 119-122-123-124 motif | λMAX (nm)∗,† | Half-life of retinal release1,2 | |
|---|---|---|---|
| Wild-type Bovine rhodopsin | LEIA | 498.2 ± 0.1 (4) | 13.3 ± 0.6 (4) |
| L119F | FEIA | 503.5 ± 0.8 (3) | 17.4 ± 0.8 (3) |
| E122I | LIIA | 495.4 ± 0.2 (4) | 5.93 ± 0.6 (3) |
| I123N | LENA | 498.0 ± 0.3 (3) | 7.31 ± 0.9 (4) |
| A124S | LEIS | 496.6 ± 0.2 (3) | 23.5 ± 0.4 (3) |
| L119F/E122I | FIIA | 496.6 ± 0.4 (3) | 7.68 ± 0.3 (3) |
| E122I/I123N | LINA | 494.8 | 6.47 ± 0.3 (3) |
| E122I/A124S | LIIS | 492.5 ± 0.5 (3) | 7.24 ± 0.2 (3) |
| L119F/E122I/A124S | FIIS | 492.2 ± 0.1 (3) | 9.40 ± 0.2 (3) |
| L119F/E122I/I123N/A124S | FINS | 492.6 ± 0.3 (4) | 15.7 ± 0.8 (3) |
-
∗Standard error is shown.
†Number of biological replicates (i.e. separate elutions and/or purifications of rhodopsin) is shown in brackets.
Key resources table
| Reagent type (species) or resource | Designation | Source or reference | Identifiers | Additional information |
|---|---|---|---|---|
| gene (Bos taurus) | RH1(Rho) | N/A | Accession: M12689 | |
| cell line (Homo sapiens) | HEK293T | Dr. David Hampson, University of Toronto | Authenticated by STR profiling | |
| transfected construct | pIRES-hrGFP II | Stratagene | ||
| antibody | 1D4 monoclonal antibody | doi: 10.1007/978-1-4939-1034-2_1 | fixed to Ultralink Resin (5mg 1D4:7mL Resin) | |
| commercial assay or kit | Lipofectamine 2000 | ThermoFisher Scientific | Catalog Number: 11668019 | |
| Commercial assay or kit | Ultralink Hydrazide Resin | ThermoFisher Scientific | Catalog Number: 53149 | |
| Chemical compound, drug | 11-cis retinal | other | Dr. Rosalie Crouch, Medical University of South Carolina | |
| sSoftware, algorithm | PAML 4.7 | https://doi.org/10.1093/molbev/msm088 | ||
| sSoftware, algorithm | MISTIC | doi: 10.1093/nar/gkt427 | ||
| Software, algorithm | MODELLER | doi: 10.1002/cpbi.3 |
Table 7
Analyses of selection on Vertebrate rhodopsin (rh1) using PAML random sites models.
https://doi.org/10.7554/eLife.35957.019| Model | lnL | Parameters1 | Null | P [df]2 | Δ AIC§ | ||
|---|---|---|---|---|---|---|---|
| ω0/p | ω1/q | ω2/ωp | |||||
| M0 | −49624.89 | 0.08 | - | - | N/A | - | 5516.80 |
| M1a | −48355.44 | 0.05 (89%) | 1.00 (11%) | - | M0 | 0.000 [1] | 2979.91 |
| M2a | −48355.44 | 0.05 (89%) | 1.00 (3%) | 1.00 (8%) | M1a | 1 [2] | 2983.91 |
| M3 | −47104.84 | 0.01 (58%) | 0.11 (30%) | 0.44 (12%) | M0 | 0.000 [4] | 484.71 |
| M7 | −46906.24 | 0.24 | 1.19 | - | N/A | - | 81.51 |
| M8a | −46864.60 | 0.32 | 3.10 | 1.00 | N/A | - | 0.230 |
| M8 | −46863.49 | 0.32 | 2.94 | 1.14 | M7 | 0.000 [2] | 0* |
| M8a | 0.135 [1] | ||||||
-
1ω values of each site class are shown are shown for model M0-M3 (ω0– ω2) with the proportion of each site class in parentheses. For M7 and M8, the shape parameters, p and q, which describe the beta distribution are listed instead. In addition, the ω value for the positively selected site class (ωp, with the proportion of sites in parentheses) is shown for M8.
2Significant p-values (α ≤0.05) are bolded. Degrees of freedom are given in square brackets after the p-values.
-
3#Model fits were assessed by Akaike information criterion differences to the best fitting model (asterisk).
Abbreviations—lnL, ln Likelihood; p, p-value; N/A, not applicable.
Table 8
Analyses of selection on Teleost rhodopsin (rh1) using PAML random sites models.
https://doi.org/10.7554/eLife.35957.020| Model | lnL | Parameters1† | Null | P [df]† | Δ AIC§ | ||
|---|---|---|---|---|---|---|---|
| ω0/p | ω1/q | ω2/ωp | |||||
| M0 | −32949.46 | 0.10 | - | - | N/A | - | 4489.79 |
| M1a | −31605.10 | 0.05 (86%) | 1.00 (14%) | - | M0 | 0.000 [1] | 1803.10 |
| M2a | −31605.10 | 0.05 (86%) | 1.00 (10%) | 1.00 (4%) | M1a | 1 [2] | 1807.10 |
| M3 | −30887.40 | 0.01 (58%) | 0.13 (29%) | 0.57 (13%) | M0 | 0.000 [4] | 373.67 |
| M8a | −30790.44 | 0.28 | 3.05 | 1.00 | N/A | - | 173.76 |
| M7 | −30767.11 | 0.19 | 0.68 | - | N/A | - | 127.10 |
| M8 | −30702.57 | 0.25 | 1.62 | 1.92 | M7 | 0.000 [2] | 0* |
| M8a | 0.000 [1] | ||||||
-
1ω values of each site class are shown are shown for model M0-M3 (ω0– ω2) with the proportion of each site class in parentheses. For M7 and M8, the shape parameters, p and q, which describe the beta distribution are listed instead. In addition, the ω value for the positively selected site class (ωp, with the proportion of sites in parentheses) is shown for M8.
2Significant p-values (α ≤0.05) are bolded. Degrees of freedom are given in square brackets after the p-values.
-
3#§Model fits were assessed by Akaike information criterion differences to the best fitting model (asterisk).
Abbreviations—lnL, ln Likelihood; p, p-value; N/A, not applicable.
Table 9
Analyses of selection on Tetrapod rhodopsin (rh1) using PAML random sites models.
https://doi.org/10.7554/eLife.35957.021| Model | lnL | Parameters† | Null | P [df]‡ | Δ AIC§ | ||
|---|---|---|---|---|---|---|---|
| ω0/p | ω1/q | ω2/ωp | |||||
| M0 | −15541.64 | 0.05 | - | - | N/A | - | 1154.78 |
| M1a | −15345.33 | 0.03 (93%) | 1.00 (7%) | - | M0 | [1] | 764.17 |
| M2a | −15345.33 | 0.03 (93%) | 1.00 (0%) | 1.00 (7%) | M1a | 1 [2] | 768.17 |
| M3 | −14981.40 | 0.00 (61%) | 0.06 (28%) | 0.29 (11%) | M0 | 0.000 [4] | 42.31 |
| M7 | −14971.78 | 0.19 | 2.76 | - | N/A | - | 17.10 |
| M8 | −14961.25 | 0.20 | 3.55 | 1.00 | M7 | 0.000 [2] | 0* |
-
1ω values of each site class are shown are shown for model M0-M3 (ω0– ω2) with the proportion of each site class in parentheses. For M7 and M8, the shape parameters, p and q, which describe the beta distribution are listed instead. In addition, the ω value for the positively selected site class (ωp, with the proportion of sites in parentheses) is shown for M8.
2Significant p-values (α ≤0.05) are bolded. Degrees of freedom are given in square brackets after the p-values.
-
3#Model fits were assessed by Akaike information criterion differences to the best fitting model (bolded asterisk).
Abbreviations—lnL, ln Likelihood; p, p-value; N/A, not applicable.
Table 10
Analyses of selection on Characiphysi rhodopsin (rh1) using PAML random sites models.
https://doi.org/10.7554/eLife.35957.022| Model | lnL | Parameters1 | Null | P [df]2 | Δ AIC§ | ||
|---|---|---|---|---|---|---|---|
| ω0/p | ω1/q | ω2/ωp | |||||
| M0 | −10819.13 | 0.06 | - | - | N/A | - | 842.6 |
| M1a | −10586.68 | 0.03 (91%) | 1.00 (9%) | - | M0 | 0.000 [1] | 379.73 |
| M2a | −10586.68 | 0.03 (91%) | 1.00 (9%) | 9.07 (0%) | M1a | 1 [(2 | 383.7 |
| M3 | −10403.20 | 0.00 (60%) | 0.08 (29%) | 0.40 (11%) | M0 | 0.000 4) | 18.8 |
| M7 | −10401.45 | 0.17 | 1.77 | - | N/A | - | 9.27 |
| M8a | −10395.82 | 0.18 | 2.27 | 1.00 | N/A | - | 0.23 |
| M8 | −10394.82 | 0.18 | 2.22 | 1.50 | M7 | 0.000 (2] | 0* |
| M8a | 0.136 [1] | ||||||
-
∗†ω values of each site class are shown are shown for model M0-M3 (ω0– ω2) with the proportion of each site class in parentheses. For M7 and M8, the shape parameters, p and q, which describe the beta distribution are listed instead. In addition, the ω value for the positively selected site class (ωp, with the proportion of sites in parentheses) is shown for M8.
‡Significant p-values (α ≤0.05) are bolded. Degrees of freedom are given in square brackets after the p-values.
-
Model fits were assessed by Akaike information criterion differences to the best fitting model (asterisk).
Abbreviations—lnL, ln Likelihood; p, p-value; N/A, not applicable.
Additional files
-
Supplementary file 1
Tetrapods and non-tetrapod Sarcopterygian outgroups with their respective rhodopsin coding-sequence (rh1) accession numbers.
- https://doi.org/10.7554/eLife.35957.023
-
Supplementary file 2
Teleost fishes and cartilaginous outgroups with their respective rhodopsin coding-sequence (rh1) accession numbers.
- https://doi.org/10.7554/eLife.35957.024
-
Supplementary file 3
Characiphysi (Siluriformes, Gymnotiformes, and Characiformes) with Cypriniforme outgroups with their respective rhodopsin coding-sequence (rh1) accession numbers.
- https://doi.org/10.7554/eLife.35957.025
-
Transparent reporting form
- https://doi.org/10.7554/eLife.35957.026
Download links
A two-part list of links to download the article, or parts of the article, in various formats.
Downloads (link to download the article as PDF)
Open citations (links to open the citations from this article in various online reference manager services)
Cite this article (links to download the citations from this article in formats compatible with various reference manager tools)
Functional trade-offs and environmental variation shaped ancient trajectories in the evolution of dim-light vision
eLife 7:e35957.
https://doi.org/10.7554/eLife.35957


