JNK signaling triggers spermatogonial dedifferentiation during chronic stress to maintain the germline stem cell pool in the Drosophila testis
- New York University School of Medicine, United States
Figures
Figure 1 with 2 supplements
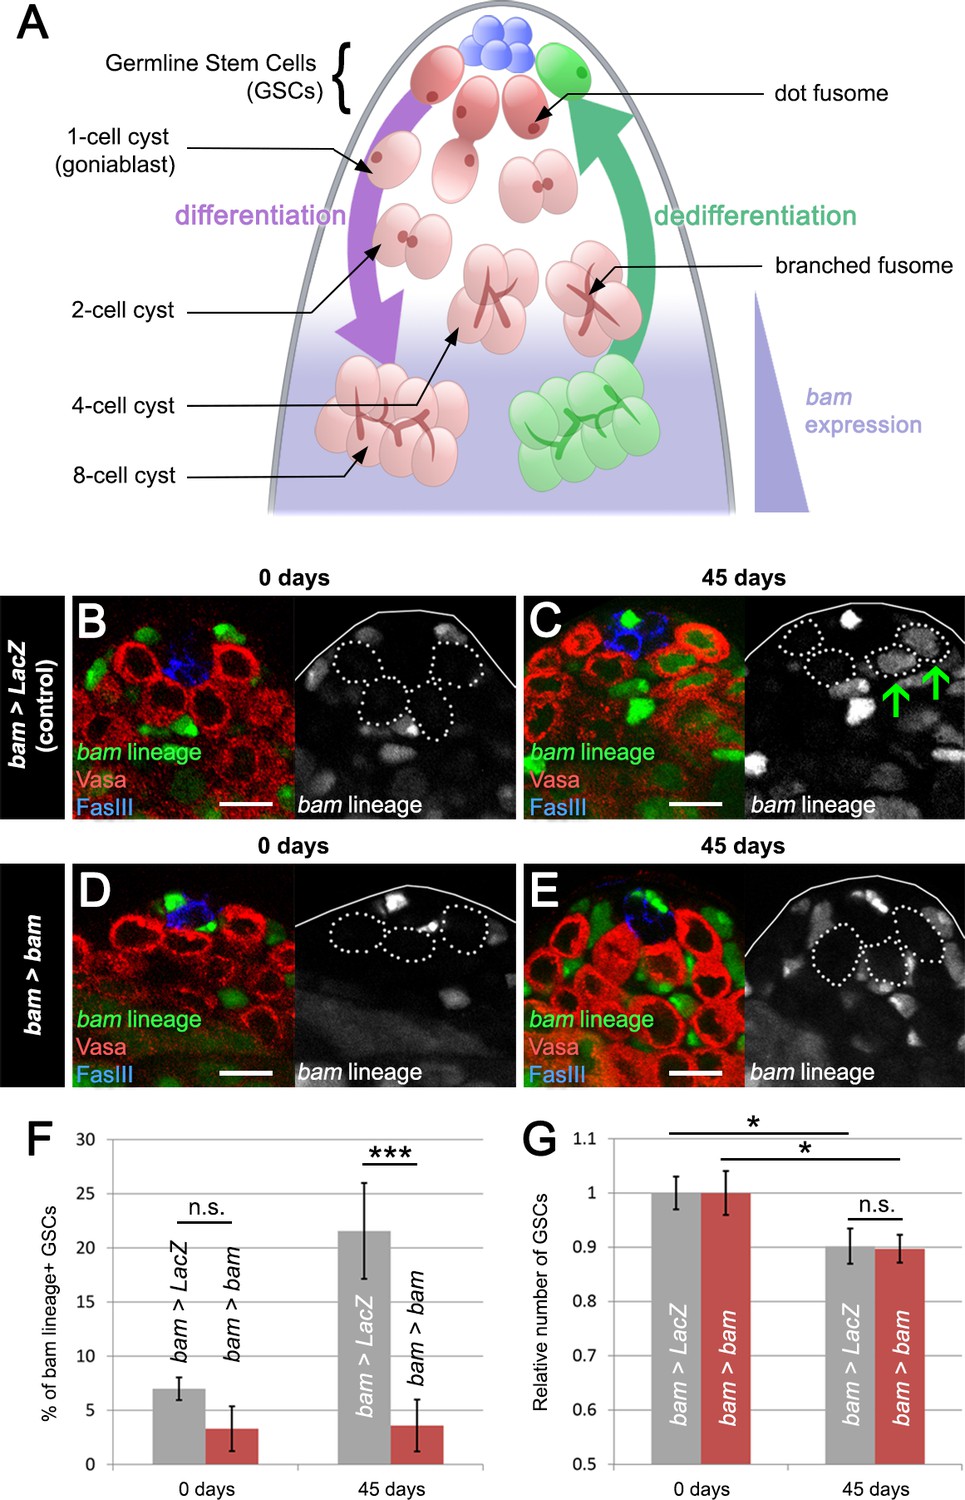
Blocking bam-lineage dedifferentiation does not protect the GSC pool under normal laboratory conditions.
(A) Schematic of the Drosophila testis. Germline stem cells (GSCs) undergo differentiation through several rounds of mitotic divisions with incomplete cytokinesis (the cells remain connected through a structure, the fusome). During the transition from 4- to 8-cell stage, cells acquire the expression of the differentiation factor bam. Germline cells at these stages can undergo dedifferentiation returning to a stem cell state. (B–E) Representative images of the testis stem cell niche in control bam-Gal4, UAS-LacZ (bam > LacZ, B, C) or bam-Gal4, UAS-bam (bam > bam, D, E), where we blocked bam-lineage dedifferentiation at 0 days and 45 days under normal aging conditions. The bam lineage is labeled in green, the germline (Vasa) is red and the niche (FasIII) is blue. Each GSC is outlined by a dashed line. There are no GSCs derived from the bam lineage in the control or bam > bam testis at 0 days (B, D). At day 45, the control contains bam-lineage positive GSCs (indicating that they arose through dedifferentiation) (C, arrows). However, at the same age, there are no bam-lineage positive GSCs in the bam > bam testis, demonstrating the efficacy of our technique (E). (F) Percentage of bam-lineage dedifferentiated GSCs in bam > LacZ (gray bars) and bam > bam (red bars) testes at 0 and 45 days. The proportion of bam-lineage GSCs significantly increases in the control bam > LacZ at 45 days, while this value remains unchanged in bam > bam flies. (G) Relative number of GSCs at 0 and 45 days (see Materials and methods for details). In control bam > LacZ testes (gray bars), the relative number of GSCs declines from 0 to 45 days. If bam-lineage dedifferentiation contributes to the maintenance of a robust GSC pool during aging, we predict that blocking dedifferentiation would enhance the decline in total GSC number. However, there is no statistical difference between the control and bam > bam genotypes at 45 days. Scale bars represent 10 µm. Bars on charts represent mean ± SE. *p<0.05, ***p<0.001.
Figure 1—figure supplement 1
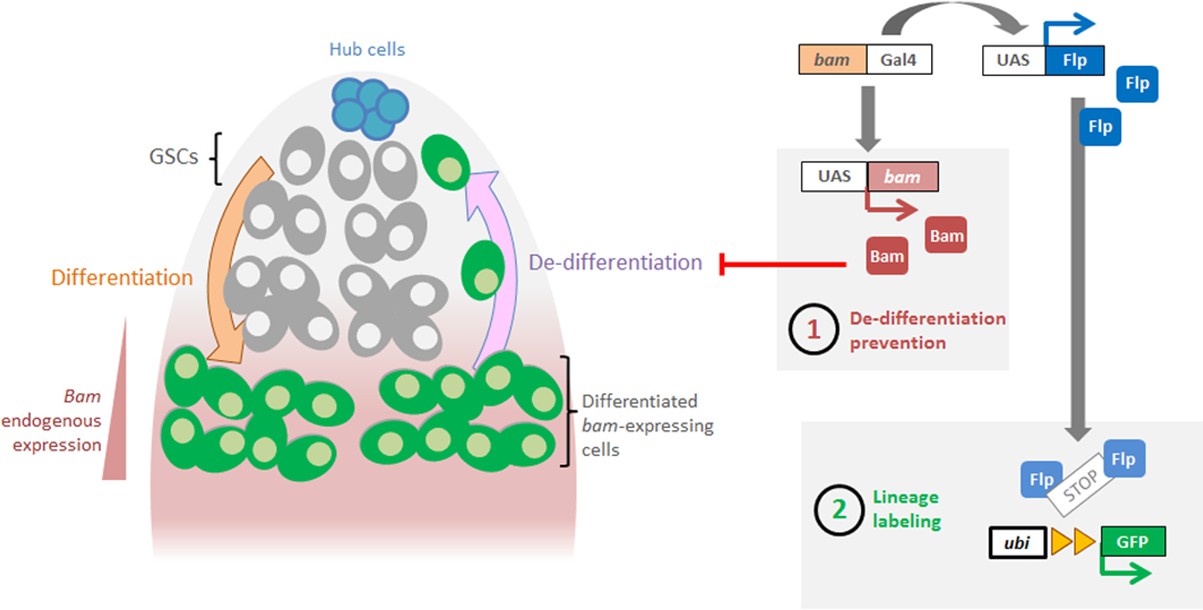
Methodology used for blocking and labeling bam-lineage dedifferentiation.
GSCs undergo four rounds of mitotic divisions, and the 4- to 8-cell spermatogonia activate the bam-Gal4 driver. This Gal4 drives expression of UAS-bam, resulting in the production of more Bam differentiation factor in these cells. This ectopic Bam prevents dedifferentiation (‘1’). For controls, UAS-bam is replaced by a UAS-LacZ. Concomitantly, bam-Gal4 also drives the expression of Flippase (Flp), which then recombines irreversibly the ubiP63E-FRT-stop-FRT-GFP cassette (‘2’). This indelibly labels with GFP bam-lineage cells and allows the tracking of bam-lineage dedifferentiated GSCs.
Figure 1—figure supplement 2

Lineage and real-time expression analysis of bam-Gal4 in aging and starvation.
(A–A”) bam-Gal4 driving the expression ubiP63E-FRT-stop-FRT-GFP lineage tracing cassette marker (A’) and of UAS-RFP for real-time expression analysis (A”) in 0 day-old flies. Note the absence of bam-lineage-positive (i.e., dedifferentiated) cells among the GSCs (dotted lines) in contact with the niche (asterisk). (B–B”) The same analysis as in (A) but for 45-day-old unmated flies. Note the presence of bam-lineage-positive (i.e., dedifferentiated) cells among the GSCs (arrow) actively proliferating and giving rise to spermatogonial cysts (bracket). Note also that the bam-lineage-positive GSC has become negative for real-time expression of bam-Gal4, as it does not express RFP (B”). (C–C”) Example of spurious somatic real-time expression of bam in somatic support cells (CySCs, arrows) at 0 days. Scale bars represent 20 µm.
Figure 2 with 1 supplement

bam-lineage dedifferentiation accelerates the recovery of the GSC pool after starvation.
(A) 9-day time course of the proportion of bam-lineage dedifferentiated GSCs during refeeding following 15 days of starvation in control bam > LacZ testes. (B) The total number of GSCs in bam > LacZ testes at 0 days prior to starvation and refeeding. (B’) Using the same data set as in (A), we counted the average total number of GSCs in all testes at each time point (dashed line). We then analyzed this data set according to whether bam-lineage dedifferentiated GSCs were present (light blue line) or absent (dark blue line). We observed two key features. First, there were significantly more total GSCs at nearly every time point in testes that contained bam-lineage dedifferentiated GSCs (light blue line). Second, the original 0 day total GSC number was recovered much faster in testes with bam-lineage GSCs, at 3 days of refeeding. By contrast, testes lacking bam-lineage GSCs required 7 days to fully recover the GSC pool (dark blue line). (C–F) Examples of testes from control bam > LacZ (C,D) and bam > bam (E,F) flies at 0 days and after 15 days of starvation and 5 days of refeeding. The bam lineage is labeled in green, the germline (Vasa) is red and the niche (FasIII) is blue. GSCs are outlined by the dashed line. There are no GSCs derived from bam-lineage germ cells in the control or bam > bam testis at 0 days (C,E). After 15 days starvation and 5 days refeeding, the control contains GSCs positive for the bam-lineage (D, arrows). However, at the same time point, there are no bam-lineage positive GSCs in the bam > bam testis (F). (G) Proportion of bam-lineage cells in the GSC pool in the aforementioned genotypes and time points. After starvation and refeeding, there is a significant reduction in the proportion of bam-lineage GSCs in bam > bam testes (red bar) compared to the control (gray bar). (H) Relative number of GSCs after 0, 3 or 5 days of refeeding following starvation. Light blue line indicates control bam > LacZ testes containing bam-lineage GSCs, whereas the dark blue line represents control testes lacking bam-lineage dedifferentiation. The red line represents bam > bam testes where dedifferentiation was blocked. Note that blocking dedifferentiation (red line) significantly delays the recovery of the GSC pool compared to testes with bam-lineage dedifferentiation (light blue line), in a manner similar to what happens in the control testes lacking dedifferentiated GSCs (dark blue line). Scale bars represent 10 µm. Bars on charts represent mean ±SE. *p<0.05, **p<0.01, ****p<0.0001.
Figure 2—figure supplement 1
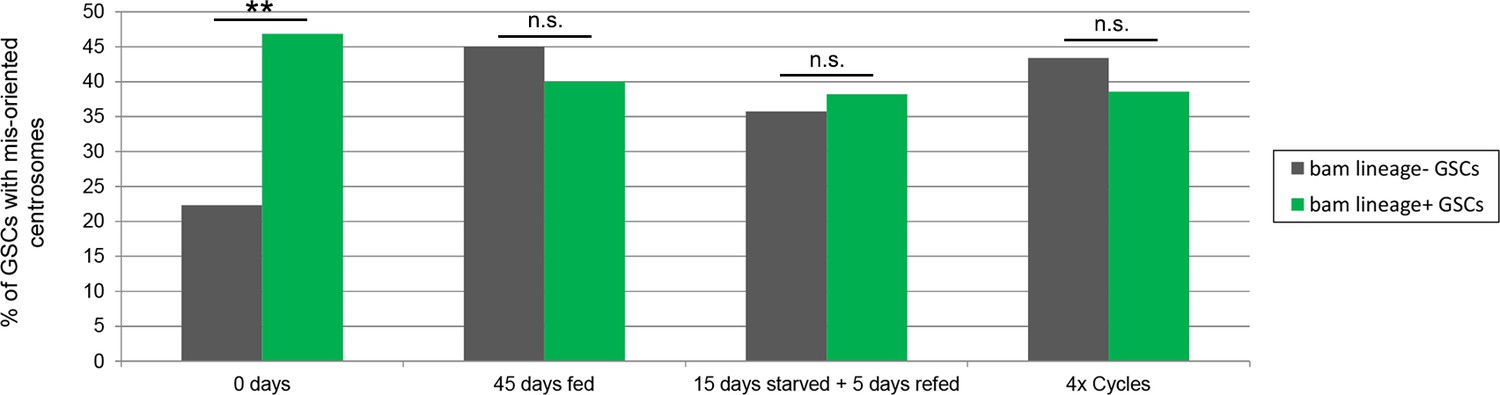
Centrosome mis-orientation is not increased in bam-lineage GSCs compared to lineage-negative GSCs in aging and after challenging conditions.
Centrosome orientation in GSCs in testes from bam > LacZ control males was assessed at day 0, at 45 days fed and unmated, after 15 days of starvation and 5 days of refeeding, and after 4 cycles of starvation, refeeding and mating. Testes were stained with an antibody to γ-Tubulin, which marks the centrosome. At day 0, the rate of centrosome mis-orientation was significantly higher in bam-lineage GSCs (green bar) compared to lineage-negative GSCs (gray bar). However, in all of the other conditions, there was no statistical difference between these two types of GSCs with respect to centrosome mis-orientation. N = 57, 49, 47, and 50 testes scored, respectively. **p<0.01.
Figure 3 with 1 supplement

bam-lineage dedifferentiation is required for maintaining a robust GSC pool under chronic challenging conditions.
(A–D) Representative images of the testis stem cell niche in control bam > LacZ (A,B) and bam > bam (C,D) testes at 0 days (A,C) and after 4 cycles of starvation, refeeding and mating (B,D). The bam lineage is labeled in green, the germline (Vasa) is red and the niche (FasIII) is blue. GSCs are outlined by the dashed line. After four cycles, bam > LacZ testes contain several bam-lineage GSCs (B, arrows). In the same conditions, bam > bam testes have fewer GSCs and none of them are dedifferentiated (D). (E) Proportion of bam-lineage GSCs in the indicated genotypes and conditions. The proportion of bam-lineage GSCs soars to nearly 50% in control testes (gray bars), and this process is completely abrogated in bam > bam testes (red bars). (F) The relative number of GSCs in control bam > LacZ and bam > bam testes. After 4 cycles of challenging conditions, there is a significant decline (33%) in the GSC pool in testes where dedifferentiation is prevented. Scale bars represent 10 µm. Bars represent mean ± SE. ****p<0.0001.
Figure 3—figure supplement 1
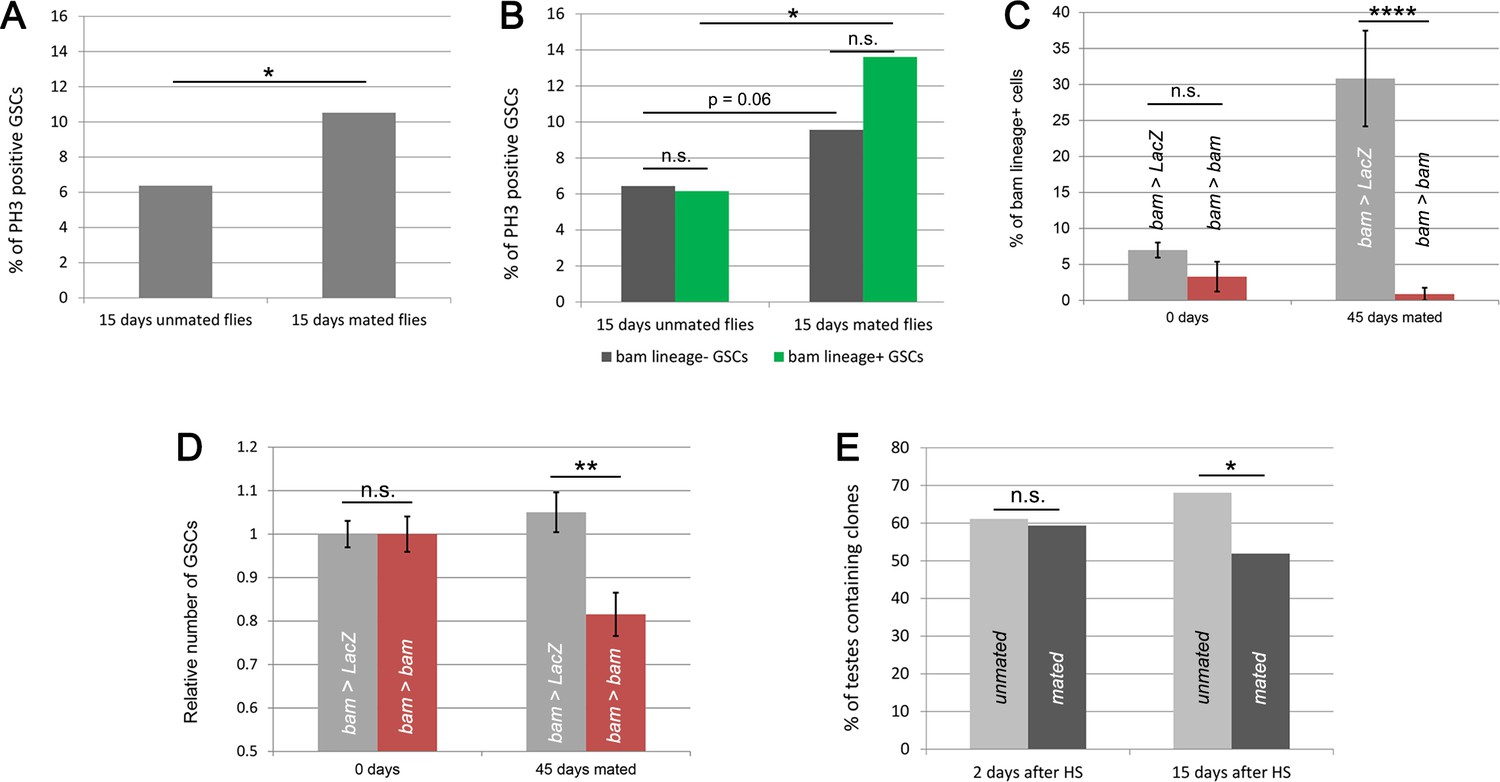
bam-lineage dedifferentiation is required for maintaining a robust GSC pool under conditions of continuous mating.
(A) Percentage of phospho-Histone3 (pH3)-positive GSCs in testes from unmated or mated males after 15 days of adulthood. There are significantly more pH3-positive GSCs in testes from mated males compared to unmated males. See Supplementary file 2 for the number of GSCs and testes analyzed. (B) Percentage of pH3-positive bam-lineage GSCs and pH3-positive lineage-negative GSCs in testes from (A). There are significantly more pH3-positive GSCs in both lineages in testes from mated males compared to those from unmated males. (C) Percentage of bam-lineage GSCs in bam > LacZ (gray bars) and bam > bam (red bars) testes at 0 and 45 day-old males reared continuously with females (referred to as ‘mated’). The proportion of bam-lineage GSCs significantly increases in the control (bam > LacZ) mated males, while this value remains unchanged in bam > bam flies. (D) Relative number of GSCs in bam > LacZ (gray bars) and bam > bam (red bars) males at 0 day and at 45 days after being reared continuously with females. There is a significant difference between these two genotypes, with fewer GSCs in the bam > bam flies, when males are continuously mating. (E) Clone retention rates at 2 and 15 days post clone induction (dpci) in testes from unmated (light gray bars) or mated (dark gray bars) males. As expected, neutral MARCM clones were generated at equal frequency in both unmated and mated conditions as assessed by the 2 dpci time point. However, at 15 dpci, there was a significant difference in clone retention with fewer clones retained in testes from mated males. Bars represent mean ± SE. *p<0.05, **p<0.01,****p<0.0001.
Figure 4
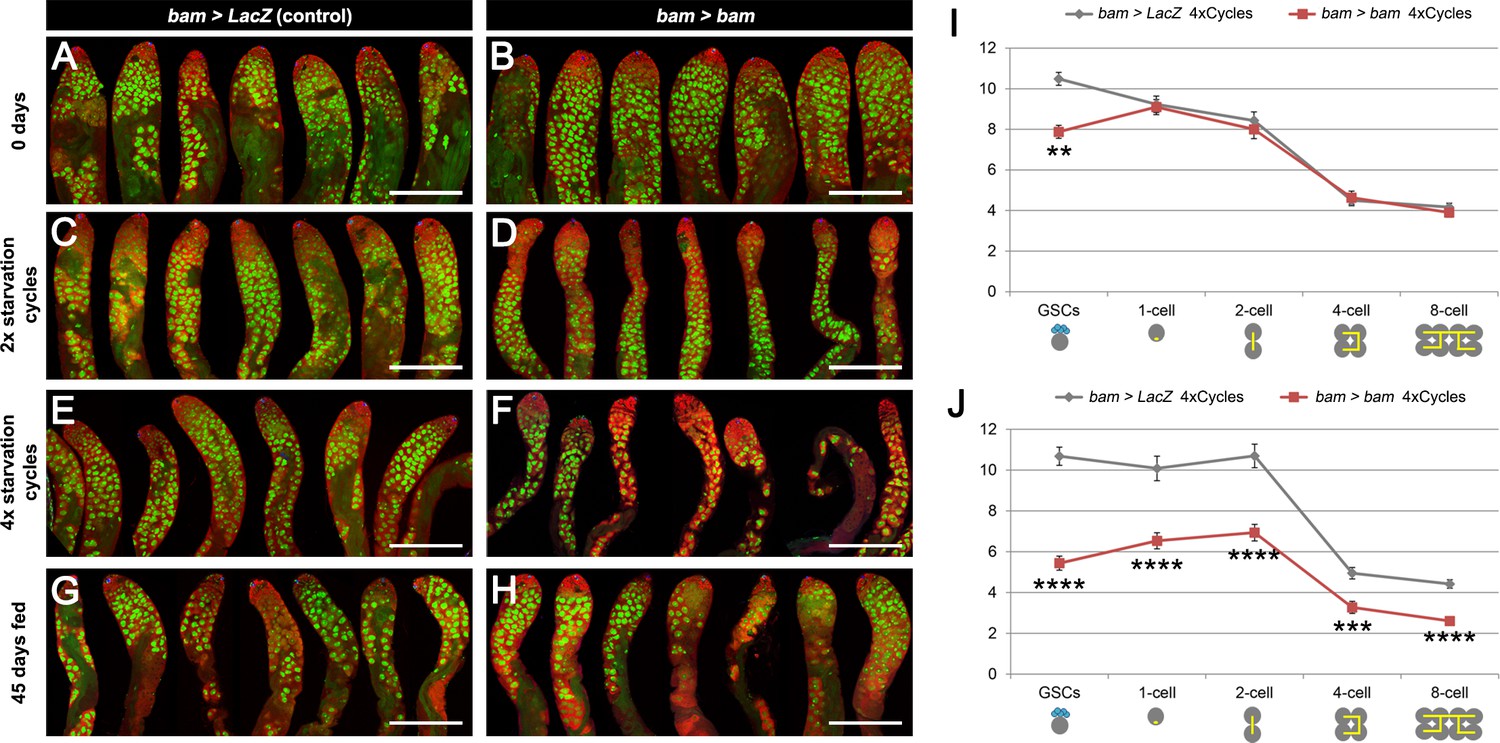
Spermatogenesis is compromised under chronic challenging conditions when bam-lineage dedifferentiation is inhibited.
(A–H) Representative images of control bam > LacZ (A,C,E,G) and bam > bam (B,D,F,H) testes at 0 days (A,B), after 2 (C,D) or 4 (E,F) cycles of challenging conditions or in 45-day-old fed unmated males (G,H). The bam lineage is labeled in green and the germline (Vasa) is red. Note when preventing dedifferentiation and subjecting the animals to challenging conditions, the testes appear involuted, and visual inspection revealed fewer transit-amplifying spermatogonia and fewer pre-meiotic spermatocytes (D,F). These phenotypes were not observed in 45-day-old fed unmated bam > bam testes (H), indicating that they do not arise simply as a result of aging. (I–J) Quantification of the number of GSCs and 1-, 2-, 4- and 8-cell spermatogonial cysts at 0 days (I) and after 4 cycles of challenging conditions (J) in bam > LacZ (gray line) and bam > bam (red line) males. Spermatogonial staging was determined using an antibody to αSpectrin, which marks the fusome/spectrosome. After four cycles, there were significantly fewer spermatogonia of each class in testes where dedifferentiation was inhibited (bam > bam). Scale bars represent 200 µm. Data points represent mean ±SE. **p<0.01, ***p<0.001, ****p<0.0001.
Figure 5
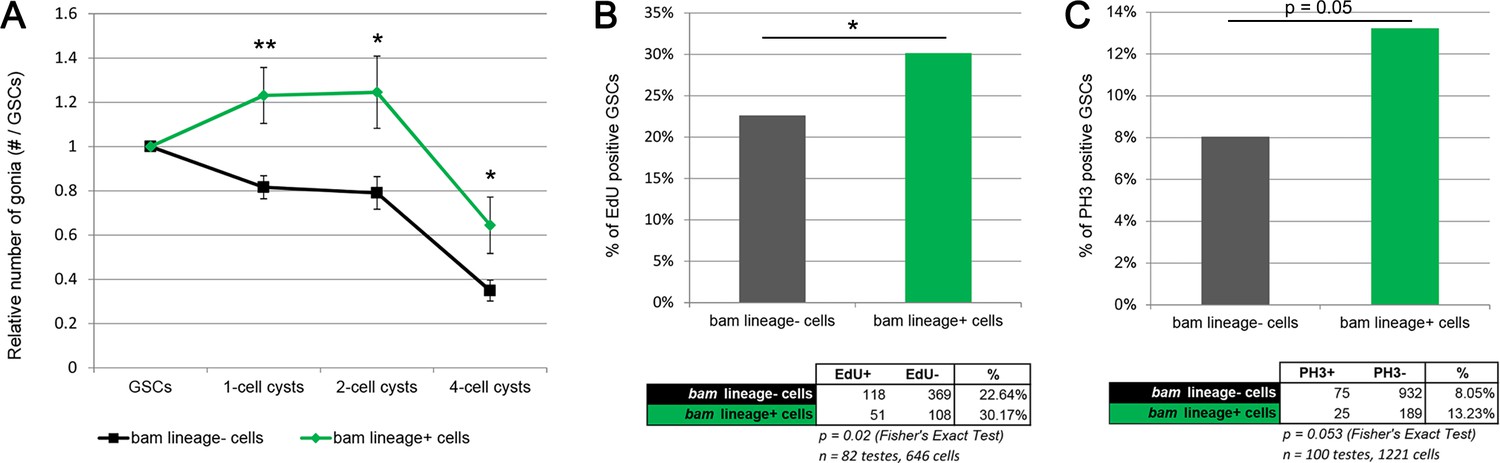
bam-lineage GSCs are more proliferative than their lineage-negative siblings.
(A) Relative contribution to 1-, 2- or 4-cell spermatogonial cysts of bam-lineage GSCs (green line) and lineage-negative sibling GSCs (black line) in the same bam > LacZ testis (see Materials and methods for details). bam-lineage GSCs have significantly more spermatogonial offspring than lineage-negative sibling GSCs. (B) EdU incorporation in bam-lineage GSCs (green bar) and lineage-negative sibling GSCs (gray bar) in the same bam > LacZ testis. There are significantly more EdU-positive lineage-positive GSCs than EdU-positive lineage-negative sibling GSCs. (C) pH3 labeling in bam-lineage GSCs (green bar) and lineage-negative sibling GSCs (gray bar) in the same bam > LacZ testis. There are significantly more pH3-positive bam-lineage GSCs than pH3-positive lineage-negative sibling GSCs. The raw data are presented in the chart below the graph. Data points represent mean ±SE. *p<0.05, **p<0.01.
Figure 6 with 2 supplements
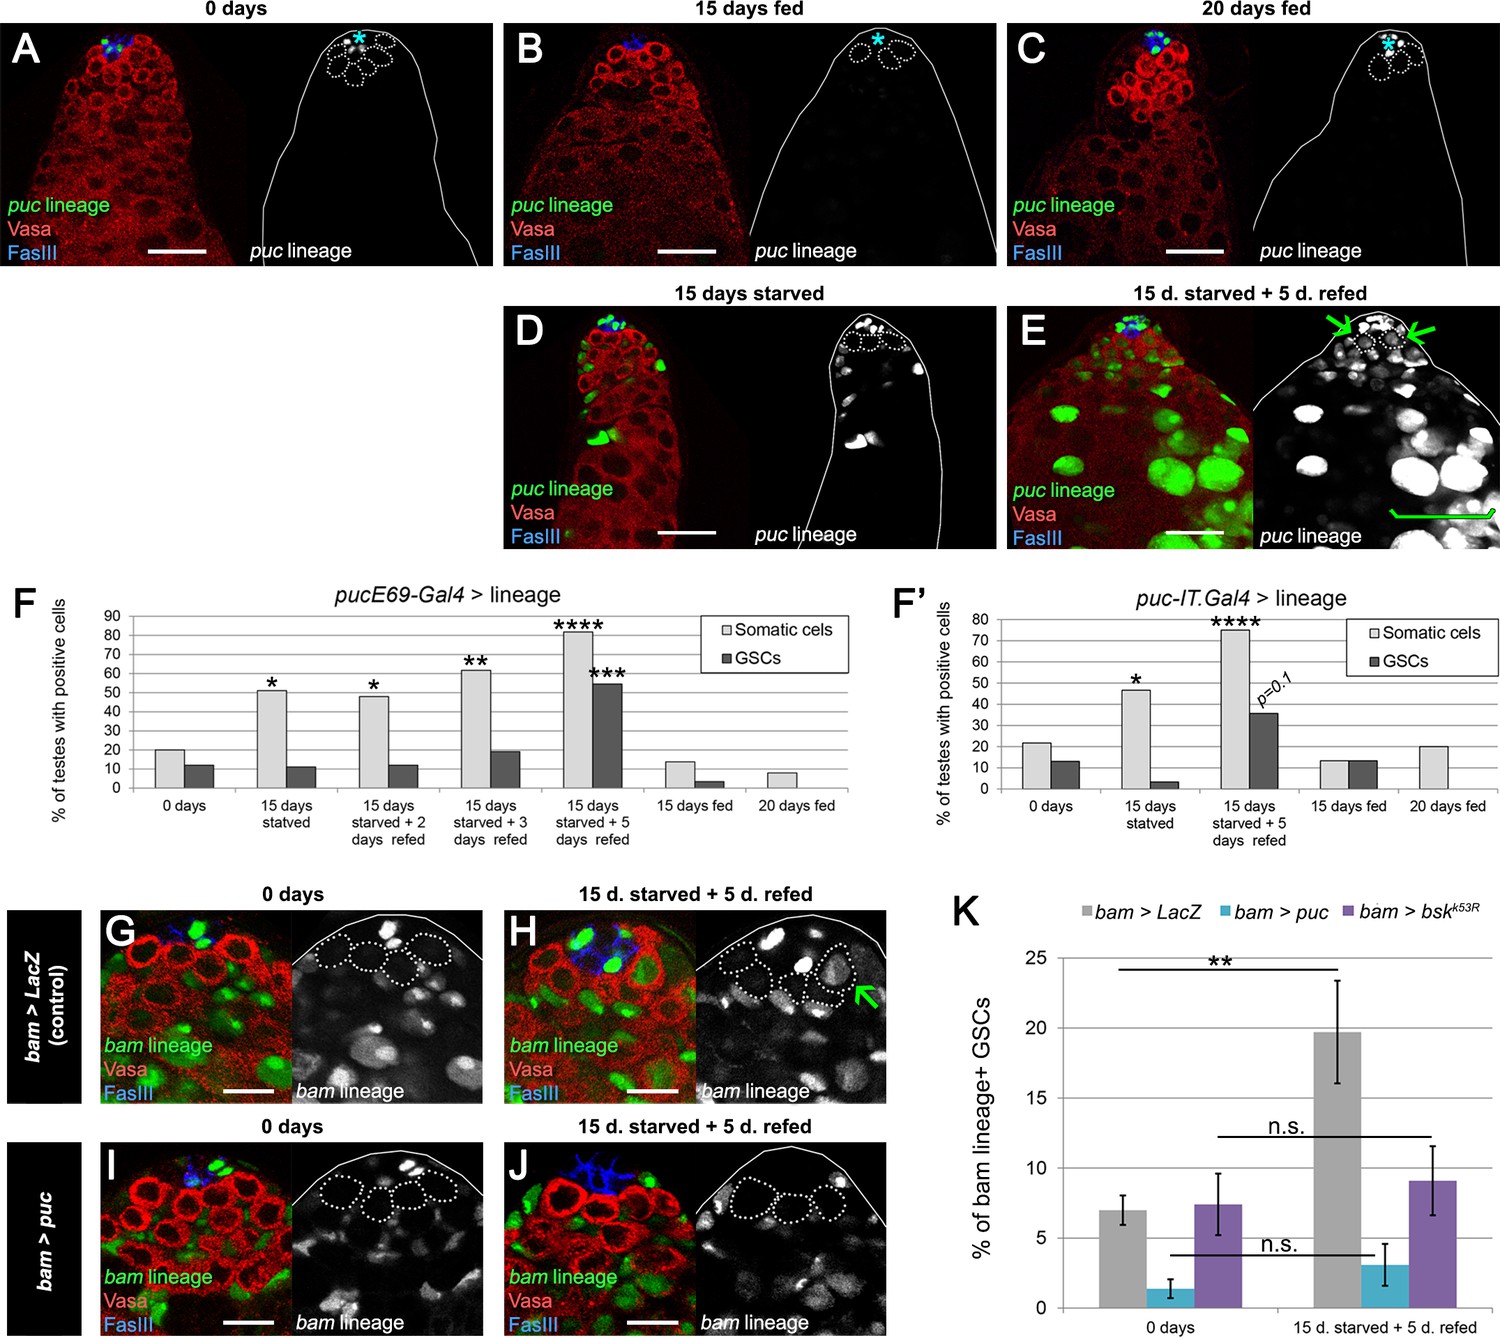
JNK pathway activity is required for bam-lineage spermatogonial dedifferentiation.
(A–E) Representative images of testes where puckeredE69 (puc)-Gal4 was lineage-traced at 0 days fed (A), 15 days fed (B), 20 days fed (C), after 15 days starved (D) and after 15 days starved and 5 days refed (E). Under fed conditions, puc-lineage cells were restricted to some niche cells (asterisk) (A–C). After 15 days of starvation, most testes had puc-lineage labeling of somatic cells (quantified in F) (D). Only during the refeeding phase were puc-lineage germline cells observed (quantified in F) (E). Arrows in E mark puc-lineage-positive GSCs and the bracket in E marks puc-lineage-positive spermatogonia. (F, F’) Graphs indicating the percentage of testes that had pucE69-Gal4- (F) or puc-IT.Gal4- (F’) lineage positive somatic cells (light gray bars) or germline cells including GSCs (dark gray bars) at the time points indicated in A-E, as well as at 2 and 3 days of refeeding in (F). (G–J) Representative images of the testis stem cell niche in control bam-Gal4, UAS-LacZ (bam > LacZ, G, H) or bam-Gal4, UAS-puc (bam > puc, I, J), where we blocked JNK signaling, at 0 days (G,I) of after 15 days of starvation and 5 days of refeeding (H,J). The bam lineage is labeled in green, the germline (Vasa) is red and the niche (FasIII) is blue. GSCs are outlined by the dashed line. There are no GSCs derived from the bam-lineage cells in the control or bam > puc testes at 0 days (G, I). After starvation and refeeding, the control (bam > LacZ) contains GSCs positive for the bam-lineage (indicating that they arose through dedifferentiation) (H, arrow). However, under the same conditions, there are no bam-lineage positive GSCs in the bam > puc testis (J), indicating that JNK signaling is required for dedifferentiation. (K) Quantification of the rate of bam-lineage dedifferentiation among GSCs in controls (gray bars) and after repressing the JNK pathway with either UAS-puc (blue bars) or a dominant negative form of basket (UAS-bskK53R) (purple bars). Both transgenes are able to block dedifferentiation, mimicking the effects of bam mis-expression. Scale bars in A-E represent 20 µm, while in G-J they represent 10 µm. Bars in the graphs represent mean ±SE. *p<0.05, **p<0.01, ***p<0.001, ****p<0.0001.
Figure 6—figure supplement 1
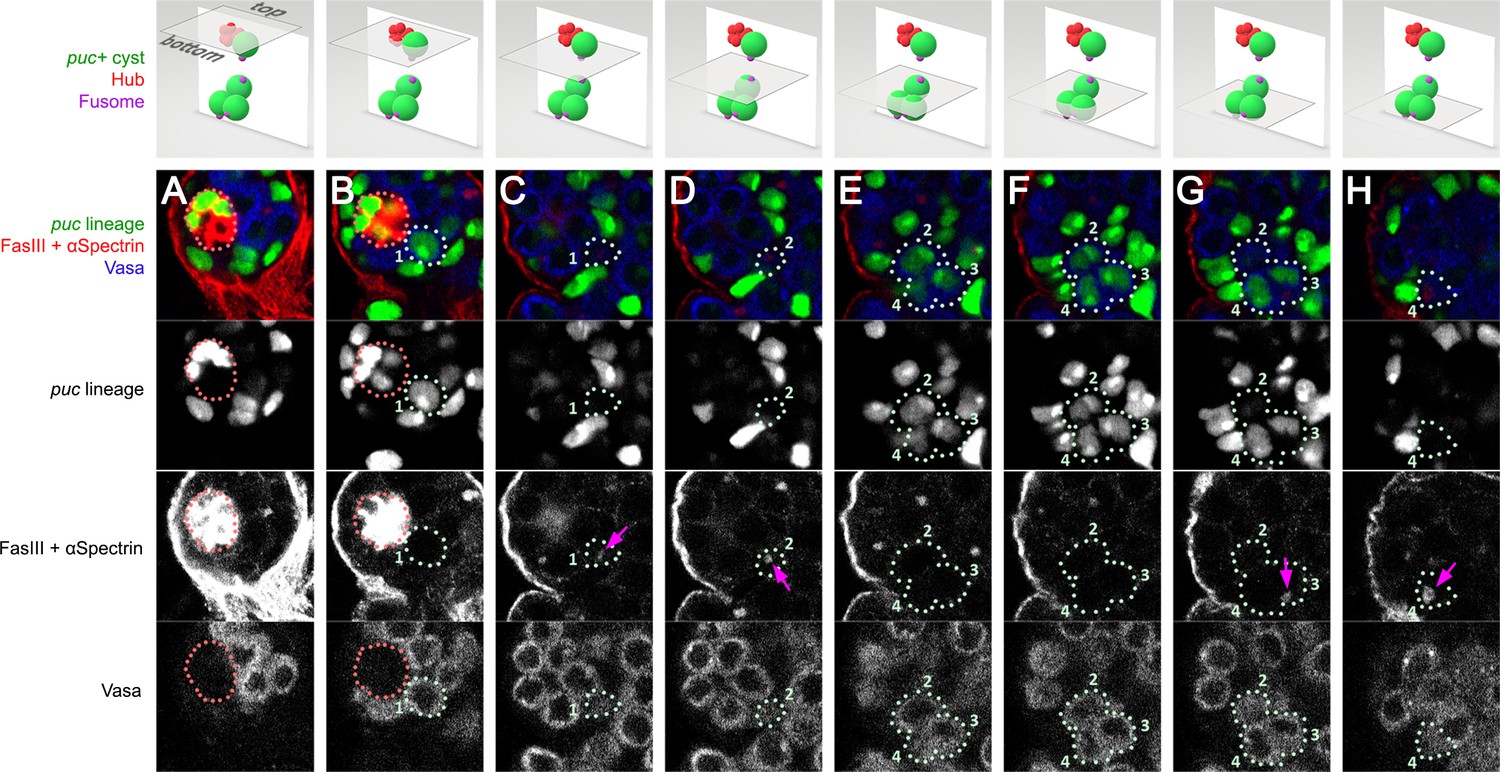
Example of fragmentation of 4-cell spermatogonia that experienced JNK activation.
Different planes of a 20 μm z-stack of a testis from a puc > GFP male after 15 days of starvation and 3 days of refeeding. Each plane is 1.0 μm thick. The cells of the fragmenting germ cyst are labeled 1–4 with ‘1’ being the cell at the niche (the presumed GSC) and ‘2’, ‘3’ and ‘4’ being the remaining cells that are not at the niche. The first row of the figure is a 3D model generated in Paint3D to illustrate the position of the plane in the z-stack as well as the position of the fragmenting germ cyst in the stack. (A–H) The puc-lineage is marked in green; FasIII, which marks the niche, and αSpectrin, which marks spectrosomes/fusomes, are labeled in red; Vasa, which labels the germline, is in blue. (B) shows the puc > GFP labeled GSC (cell ‘1’) at the niche. (C) shows the dot fusome (arrow) of cell ‘1’. (D–H) show the remaining three puc > GFP germ cells of the fragmented 4-cell spermatogonia (labeled ‘2’, ‘3’ and ‘4’). The dot fusome of cell ‘2’ is shown in (D, arrow). The dot fusome of cell ‘3’ is shown in (G, arrow). The dot fusome of cell ‘4’ is shown in (H, arrow).
Figure 6—figure supplement 2

puc or bskDN mis-expression does not perturb germ cell differentiation.
(A–B) Confocal slice of a bam > puc (A) or a bam > bskDN (labelled K53R) (B) testis after 15 days of starvation and 5 days of refeeding. Note the presence of pre-meiotic spermatocytes (lower bracket), indicating that mis-expression of puc or bskDN does not block the transition from transit-amplifying spermatogonia to pre-meiotic spermatocytes. The bam-lineage is marked in green; FasIII, which marks the niche is in blue; and Vasa, which labels the germline, is in red. Upper bracket indicates the bam-Gal4 expression domain, while the lower bracket indicates the position of spermatocytes.
Figure 7
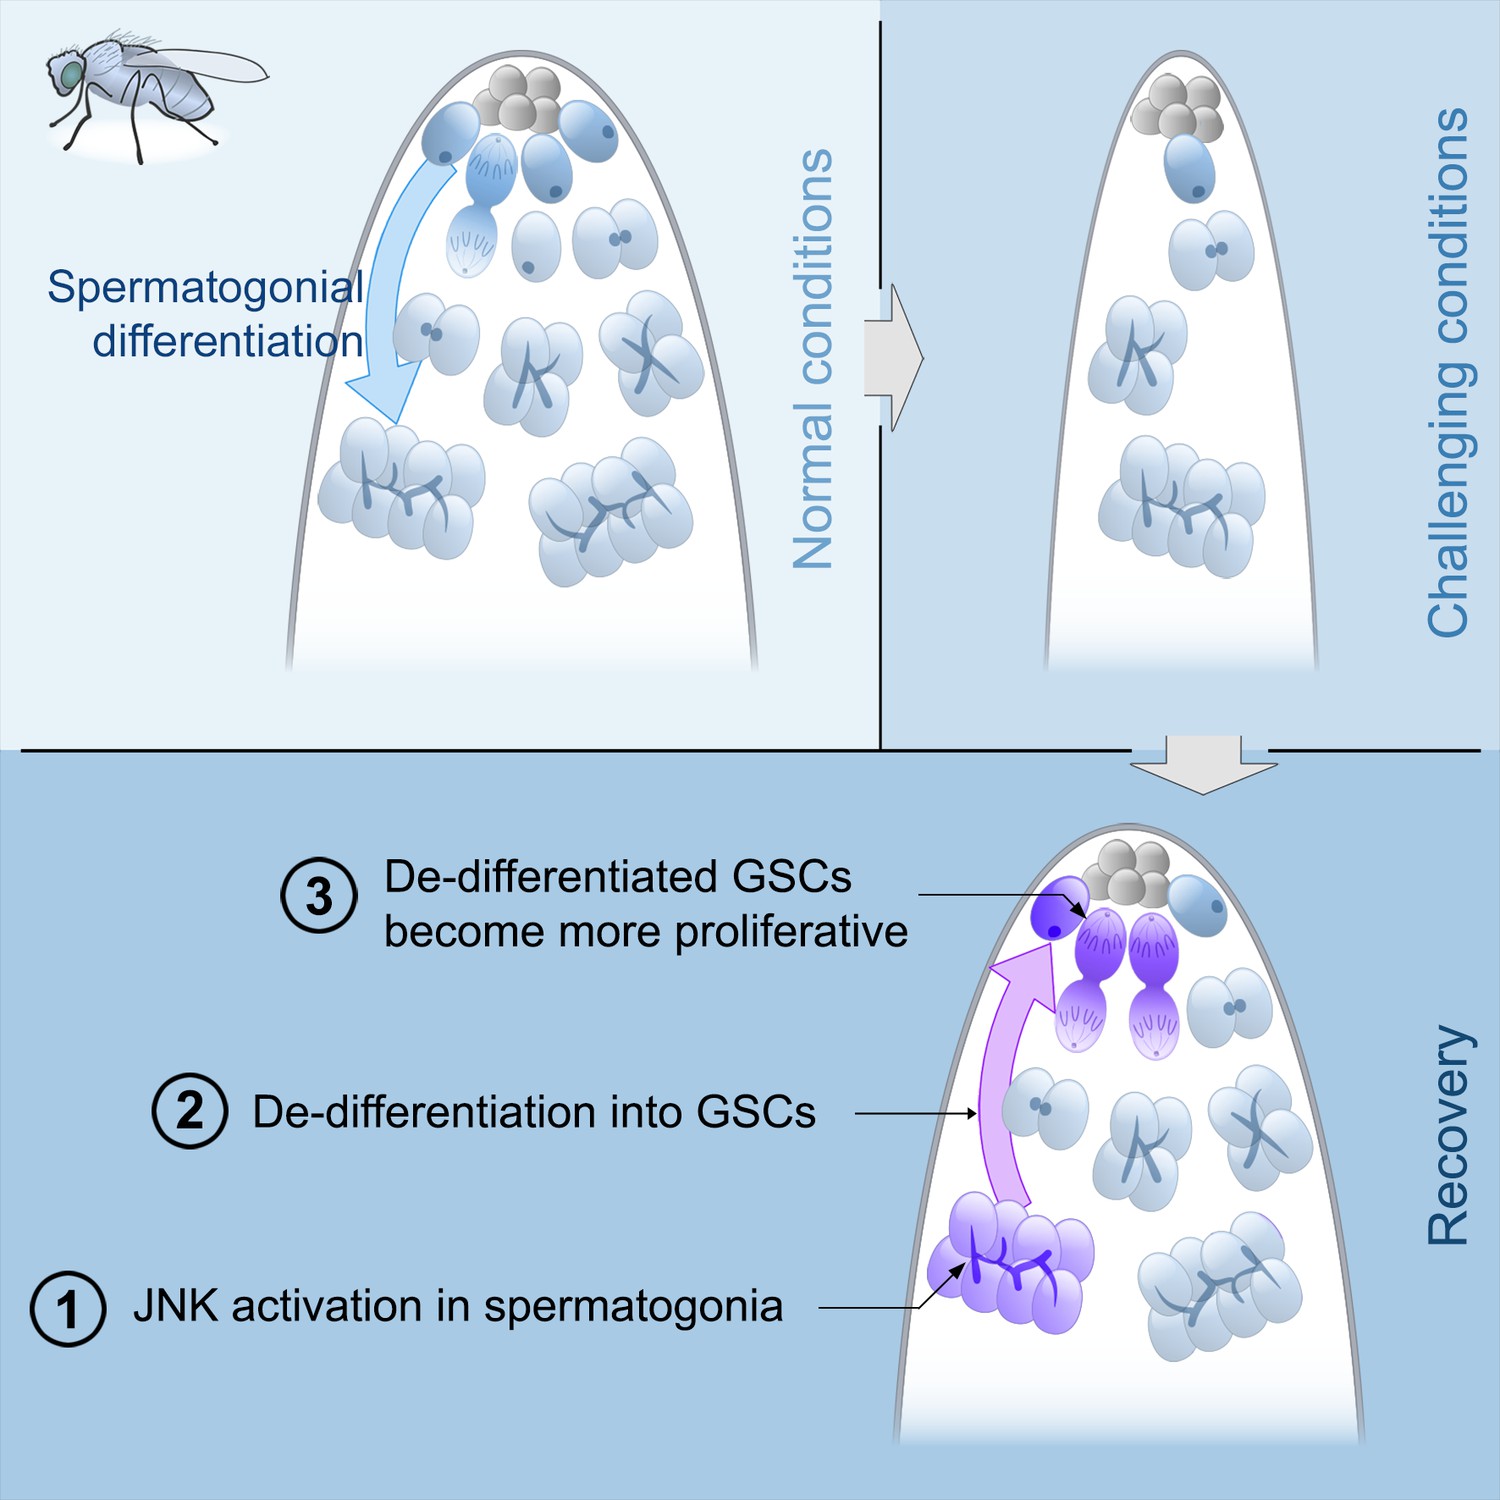
Model of spermatogonial dedifferentiation under chronic challenging conditions.
Top left, under normal conditions, GSCs divide and their offspring undergo normal differentiation into spermatogonia. Top right, under challenging conditions like starvation, there is a significant reduction in the number of GSCs and their offspring. Bottom, during the recovery phase, JNK signaling is triggered in spermatogonia (number 1), these cysts break apart and the germ cells dedifferentiate into GSCs (number 2). Dedifferentiated GSCs have higher proliferation rates than their wild type sibling GSCs and produce more offspring (number 3).
Tables
Key resources table
| Reagent type (species) or resource | Designation | Source or reference | Identifiers | Additional information |
|---|---|---|---|---|
| Strain, strain background (Drosophila melanogaster) | Oregon-R (Ore)R | Bloomington Drosophila Stock Center (BDSC) | stock number: 5 | |
| Strain, strain background (Drosophila melanogaster) | Ubi-p63E(FRT.STOP)Stinger | Bloomington Drosophila Stock Center (BDSC) | stock number: 28282 | |
| Strain, strain background (Drosophila melanogaster) | UAS-RedStinger | Bloomington Drosophila Stock Center (BDSC) | stock number: 28281 | |
| Strain, strain background (Drosophila melanogaster) | UAS-LacZ | Bloomington Drosophila Stock Center (BDSC) | stock number: 3955 | |
| Strain, strain background (Drosophila melanogaster) | UAS-bskK53R | Bloomington Drosophila Stock Center (BDSC) | stock number: 9311 | |
| Strain, strain background (Drosophila melanogaster) | pucE69-Gal4 | Bloomington Drosophila Stock Center (BDSC) | stock number: 6762 | |
| Strain, strain background (Drosophila melanogaster) | puc-IT.Gal4 | Bloomington Drosophila Stock Center (BDSC) | stock number: 63509 | |
| Strain, strain background (Drosophila melanogaster) | UAS-puc | pmid: 9472024 | ||
| Strain, strain background (Drosophila melanogaster) | bam-Gal4:VP16 | pmid: 12571107 | ||
| Strain, strain background (Drosophila melanogaster) | UAS-bam:GFP | pmid: 12571107 | ||
| Strain, strain background (Drosophila melanogaster) | FRT40A | pmid: 26807580 | ||
| Strain, strain background (Drosophila melanogaster) | ywhsFlp112; tubGal80,FRT40A | pmid: 26807580 | ||
| Antibody | goat anti‐Vasa | Santa Cruz | catalog number: dC-13 | ‘1:200’ |
| Antibody | mouse anti-Fas3 | DHSB | catalog number: 3A9 | ‘1:50’ |
| Antibody | mouse anti-α-Spectrin | DSHB | catalog number: 7G10 | ‘1:50’ |
| Antibody | mouse anti-γTubulin | Sigma | catalog number: T6557 | ‘1:100’ |
| Antibody | 5‐ethynyl‐2′ ‐deoxyuridine (EdU) | Invitrogen | catalog number: C10340 | ‘1:50’ |
| Antibody | rabbit anti-phospho Histone H3-Ser10 | Millipore | catalog number: #06–570 | ‘1:200’ |
| Software, algorithm | Fiji-ImageJ | pmid: 22743772 | ||
| Software, algorithm | Photoshop | Adobe | ||
| Software, algorithm | Excel | Microsoft | ||
| Software, algorithm | GraphPad Prism | GraphPad Software | ||
| Software, algorithm | Paint3D | Microsoft |
Additional files
-
Supplementary file 1
Raw data collected for this work.
Data are presented as the mean ± S.E.
- https://doi.org/10.7554/eLife.36095.016
-
Supplementary file 2
Raw data of proliferation markers analyzed for this work.
- https://doi.org/10.7554/eLife.36095.017
-
Supplementary file 3
Raw data collected for this work.
Data are presented as mean ± S.E.n.a is not applicable
- https://doi.org/10.7554/eLife.36095.018
-
Transparent reporting form
- https://doi.org/10.7554/eLife.36095.019
Download links
A two-part list of links to download the article, or parts of the article, in various formats.
Downloads (link to download the article as PDF)
Open citations (links to open the citations from this article in various online reference manager services)
Cite this article (links to download the citations from this article in formats compatible with various reference manager tools)
JNK signaling triggers spermatogonial dedifferentiation during chronic stress to maintain the germline stem cell pool in the Drosophila testis
eLife 7:e36095.
https://doi.org/10.7554/eLife.36095


