Optical detection of three modes of endocytosis at hippocampal synapses
- University of Texas Southwestern Medical Center, United States
Figures
Figure 1
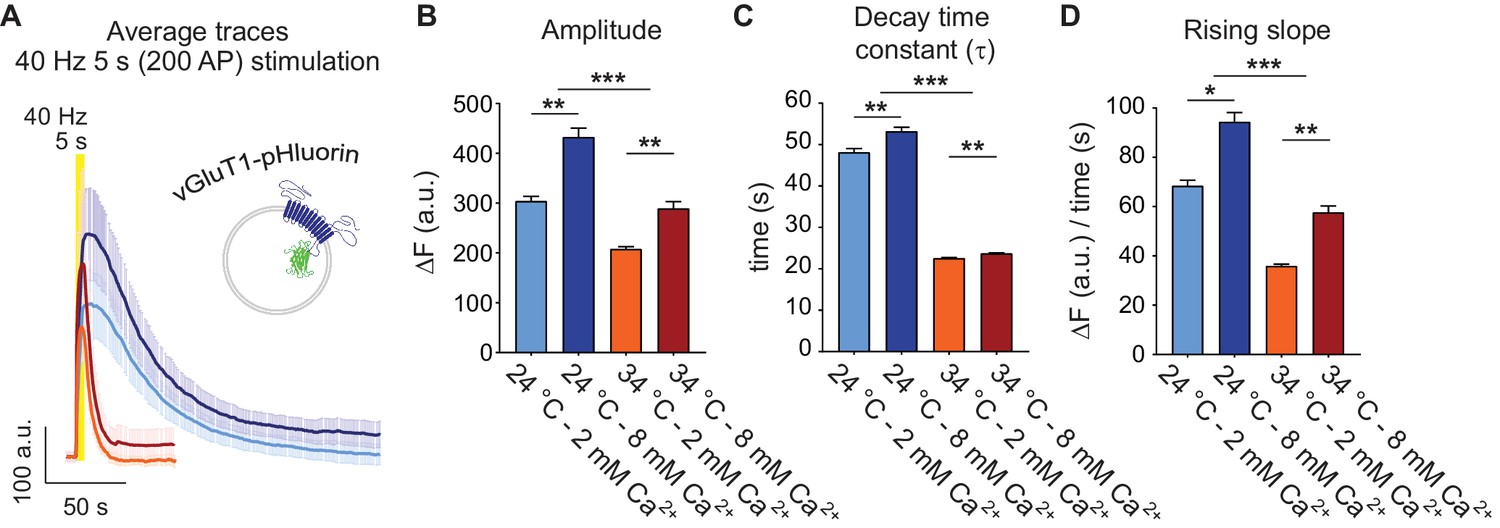
Physiological temperature synchronizes multivesicular release and accelerates bulk endocytosis, measured with vGluT1-pHluorin.
(A) Average non-normalized 40 Hz (200 AP) traces of vGluT1-pHluorin at 24°C and 2 mM (light-blue) or 8 mM extracellular Ca2+ (blue), or at 34°C and 2 mM (orange) or 8 mM Ca2+ (red). (B) Amplitude of fluorescence responses after 40 Hz stimulation. (C) Average decay time constants (τ) of the fluorescence return to baseline after 40 Hz stimulation, calculated with a single exponential decay fit. (D) Slope of the rise in fluorescence triggered by 40 Hz stimulation, expressed as change in fluorescence over time and calculated by linear regression. Statistical analysis was performed applying Kruskal-Wallis analysis (non-parametric ANOVA) with Dunn’s multiple comparisons post-test. *p<0.05; **p<0.01; ***p<0.001; ***p<0.0001.
Figure 2 with 1 supplement
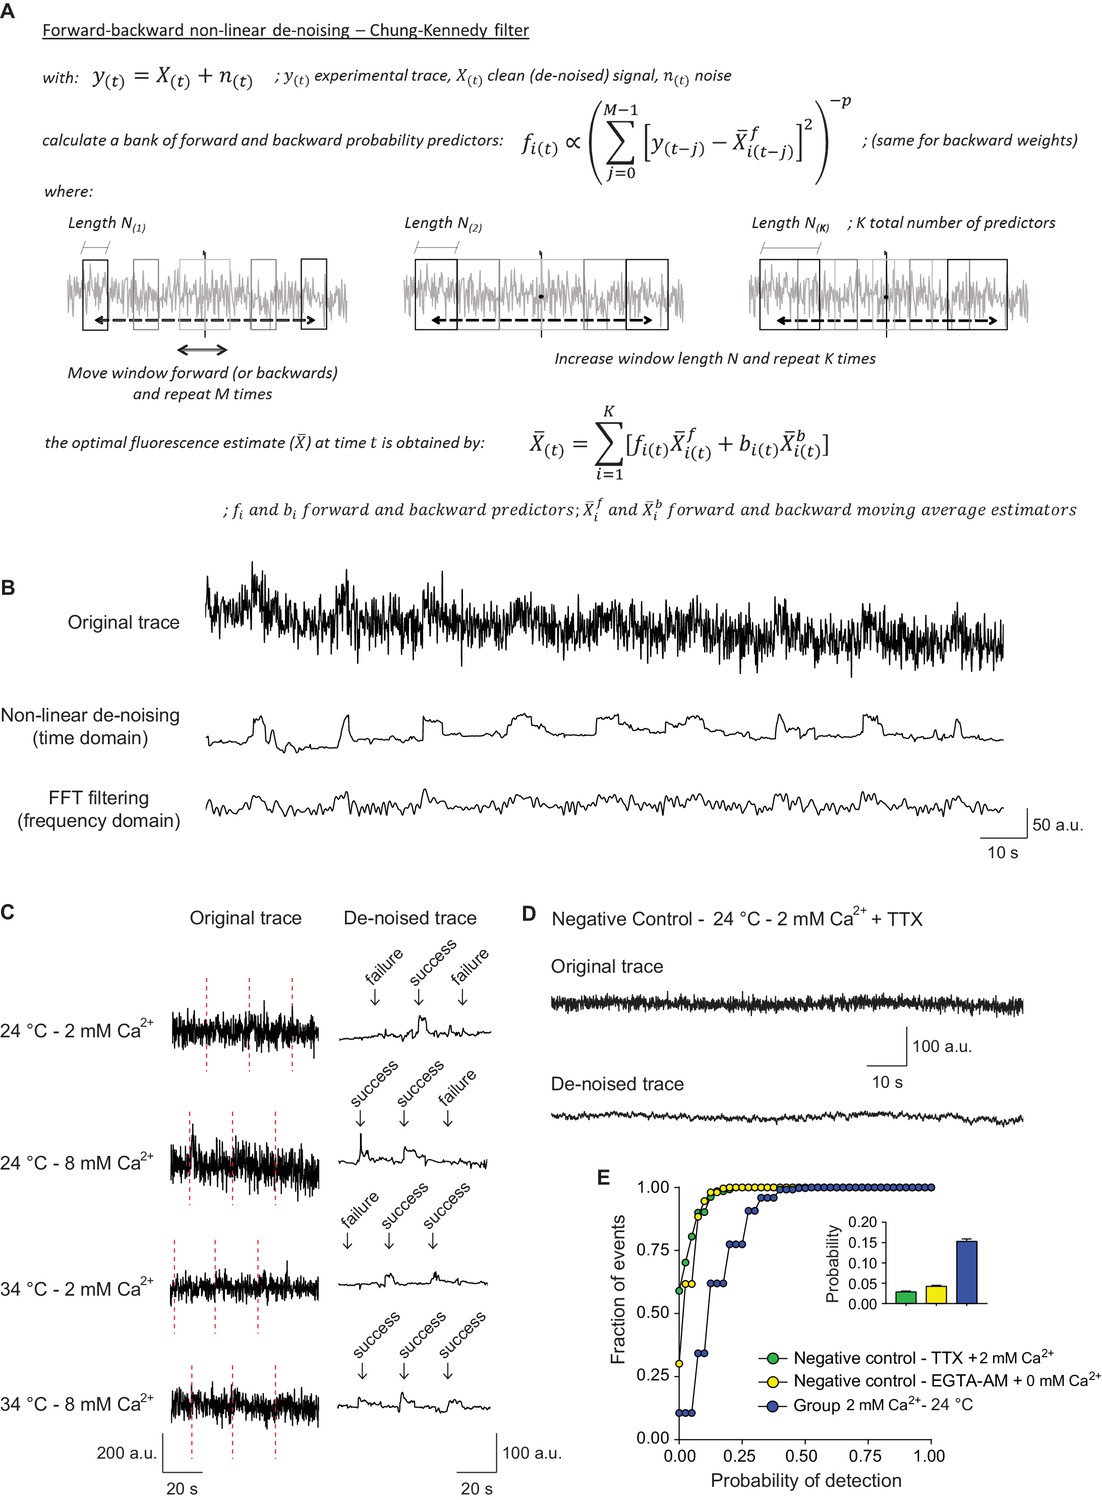
Signal de-noising increases the accuracy of detection and analysis of single synaptic vesicle fusion events.
(A) Formulas and schematic representation of the Chung – Kennedy non-linear filter (for detailed explanation see Chung and Kennedy, 1991). (B) Example fluorescence trace before (top) and after processing using the Chung – Kennedy de-noising (middle) or the fast Fourier transform (FFT) filtering at 2 Hz (bottom). Appreciate the reduction in peak amplitude caused by FFT. (C) Comparison of original not processed vGluT1-pHluorin traces with the result signal after bleaching, background and noise corrections, at different extracellular Ca2+ concentrations and temperatures. The failure analysis used to quantify probability of release is exemplified. (D) Example fluorescence trace over time, before and after de-noising, of a negative control bouton imaged at room temperature in the presence of tetrodotoxin (TTX). (E) Cumulative histogram of probability of release measured at room temperature, for positive control boutons (2 mM extracellular Ca2+) and two negative control groups: TTX group corresponds to boutons imaged in the presence of TTX, 2 mM Ca2+ and absence of electrical stimulation; EGTA-AM group corresponds to cultures pretreated with EGTA-AM 100 μM for 15 min in a 0 mM Ca2+ medium, and posteriorly imaged at room temperature with 0 mM extracellular Ca2+ and similar stimulation paradigm applied to the positive control group. The release probability for negative controls is <0.03, which corresponds to <20% of the mean release probability in the positive control group. Positive control: 368 boutons; Negative control – TTX: 401 boutons; Negative control – EGTA-AM: 260 boutons. All data are from 2 to 3 independent experiments. Also see Figure 2—figure supplement 1 for controls regarding recovery and analysis of simulated traces.
Figure 2—figure supplement 1
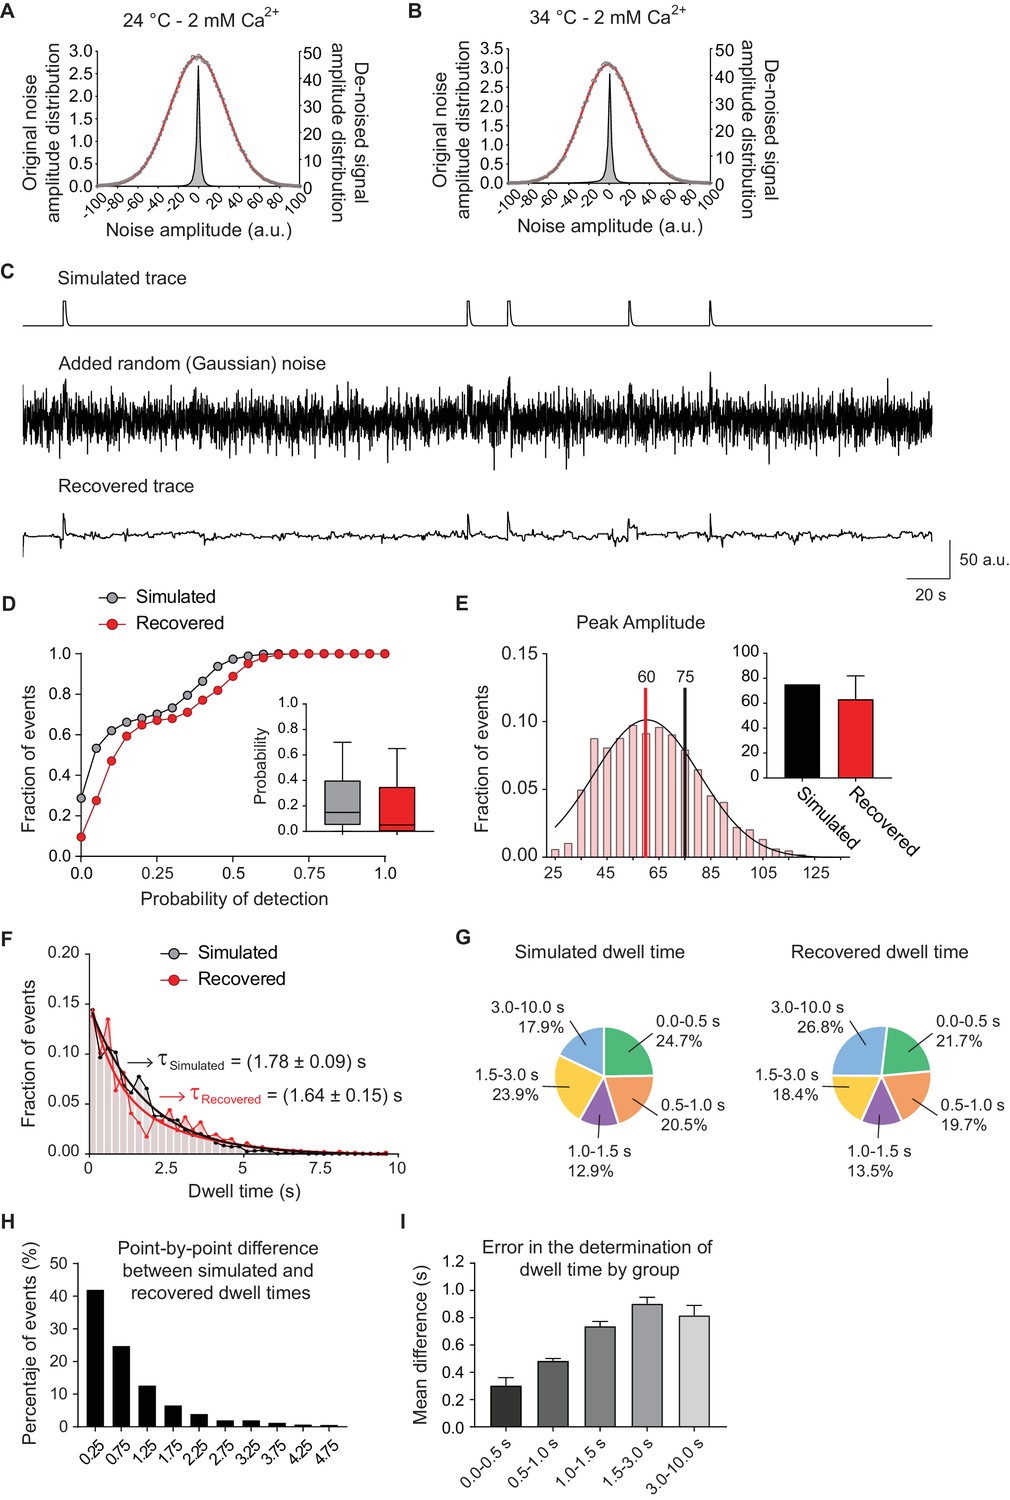
Analysis of simulated fluorescence traces.
(A) Distribution of noise amplitudes for experimental data (fluorescence traces) measured at room temperature and 2 mM extracellular Ca2+ concentration (empty circles) showing the Gaussian fit (red line). The distribution of the noise amplitude after de-noising is also shown (grey histogram). Note the dramatic effect of the filtering in noise reduction. (B) Distribution of noise amplitudes measured experimentally at 34°C and 2 mM extracellular Ca2+ concentration (empty circles) showing the Gaussian fit (red line) and the distribution of the noise amplitude after de-noising (grey histogram). (C) Top: simulated fluorescence trace with a release probability of 0.2. Middle: simulated trace with added random Gaussian noise with an amplitude of ~75% the amplitude of the signal (to properly simulate real experimental traces). Bottom: recovered trace after de-noising, note that most of the fusion events are recovered with minimal morphological alterations. (D) Comparison of cumulative histograms of probability of detection (comparable to release probability for real experimental data), for the original simulated trace (before adding noise, shown in grey) and for the recovered simulated trace after de-noising (shown in red). Insets: corresponding Tukey plots. (E) Distribution of recovered events’ amplitudes (red) in comparison with the simulated amplitude (black). Note the similitude between the averages, showing only a small reduction in amplitude determination after processing. (F) Distribution of dwell time lengths in the original simulated trace (black) and the recovered events (red), showing the exponential fit with the respective mean values (τ). (G) Proportion of different dwell time length ranges for the simulated events (left) and the recovered ones (right), showing similar sensitivity of detection for all types of dwell times. (H) Distribution of the error in dwell time determination, calculated as the absolute value of the difference between the simulated (original) event and the obtained one. ~ 40% of events were fitted with a dwell time with 0 to 0.5 s difference of the original, and ~75% of events had an error in determination of dwell time of 0 to 1 s. (I) Error in the determination of dwell time grouped by range. This error was smaller for faster events (~300 ms in average) and increased for longer dwell time events. Data from four independent simulations with 250 boutons (traces) per simulation and a total of ~9000 events.
Figure 3
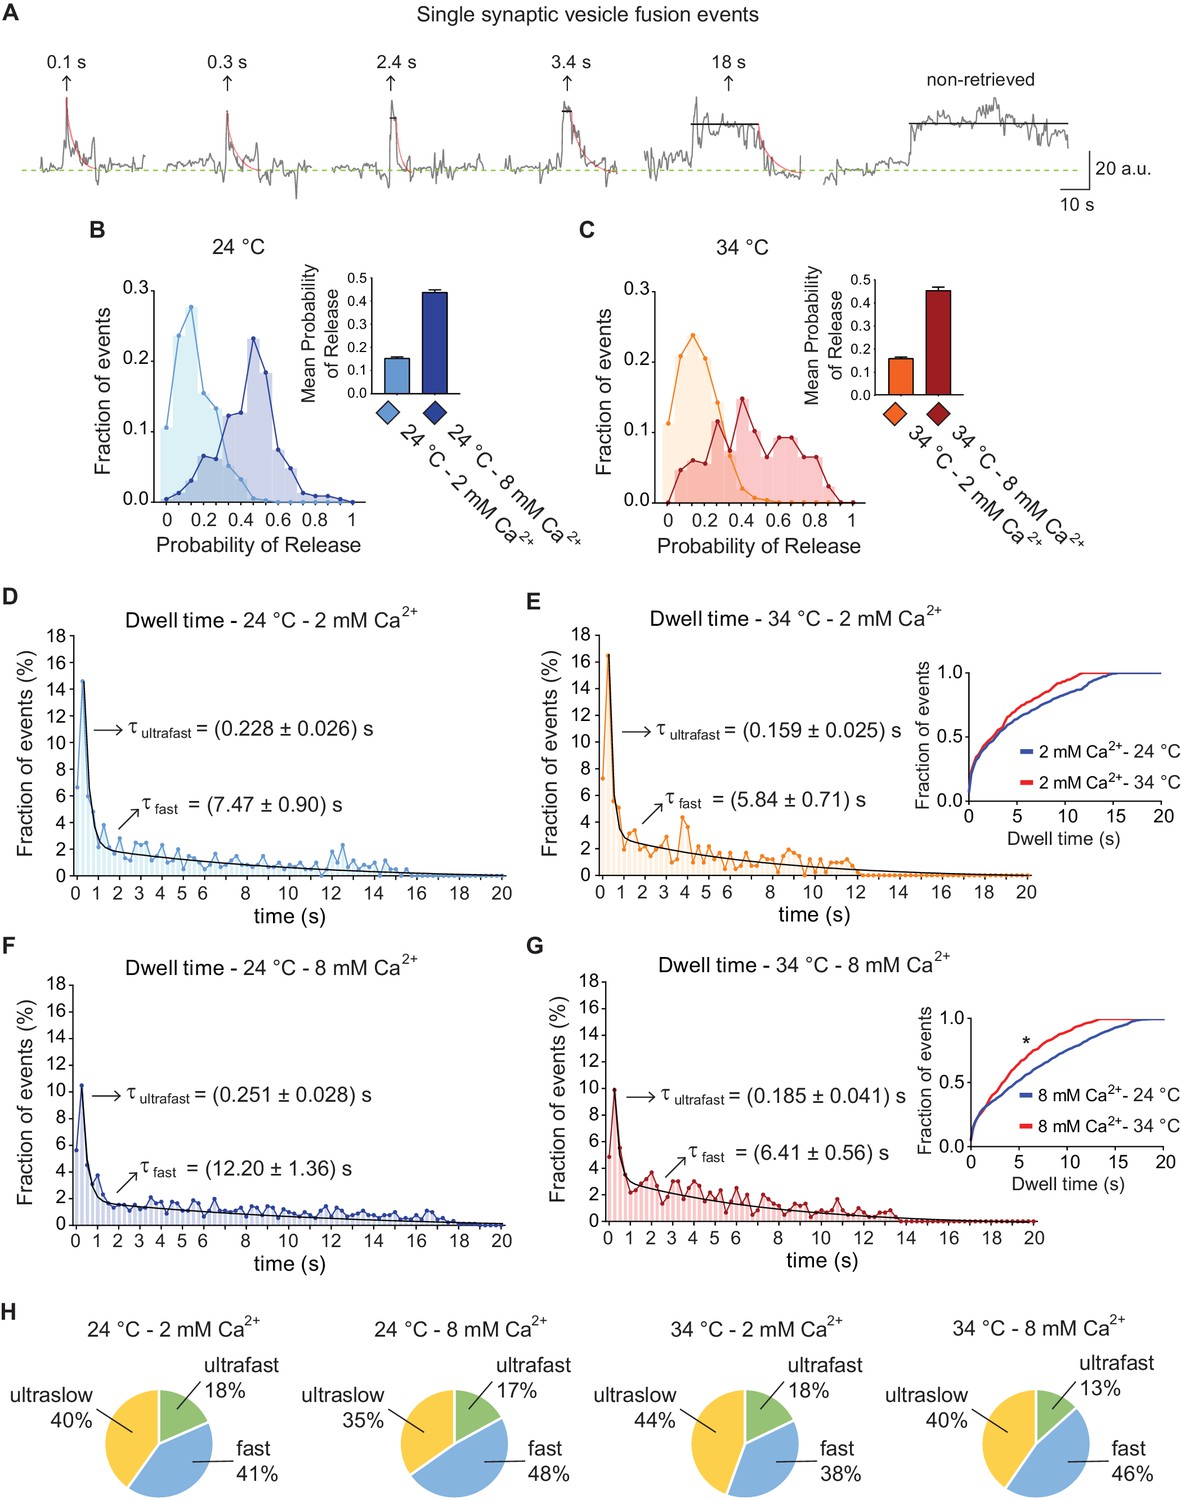
vGluT1-pHluorin reveals that endocytosis after single AP stimulation can occur through three kinetically distinct pathways.
(A) Example traces of de-noised single synaptic vesicle fusion events measured with vGluT1-pHluorin, showing different dwell time lengths. (B) Distribution of probabilities of release at 24°C with 2 mM (light-blue) or 8 mM (blue) extracellular Ca2+. Inset: mean release probability for each group. 2 mM Ca2+ 24°C: 0.15 ± 0.01. 8 mM Ca2+ 24°C: 0.44 ± 0.01. (C) Distribution of probabilities of release at 34°C with 2 mM (orange) or 8 mM (red) Ca2+. Inset: mean release probability for each group. 2 mM Ca2+ 34°C: 0.16 ± 0.01. 8 mM Ca2+ 34°C: 0.45 ± 0.02. Note that temperature does not affect release probability in the range tested. (D) Distribution of dwell time durations at 24°C and 2 mM extracellular Ca2+. Black line: double exponential decay fit (R-square = 0.921; RRS = 0.001741). Arrows: decay constants for the ultrafast and fast components of the exponential. (E) Distribution of dwell time durations at 34°C and 2 mM extracellular Ca2+. Black line: double exponential decay fit (R-square = 0.912; RRS = 0.002393). Arrows: decay constants for the ultrafast and fast component of the exponential. Inset: cumulative histogram comparing the effect of temperature on dwell times at 2 mM Ca2+, there are not significant differences. (F) Distribution of dwell time durations at 24°C and 8 mM extracellular Ca2+. Black line: double exponential decay fit (R-square = 0.921; RRS = 0.001059). Arrows: decay constants for the ultrafast and fast component of the exponential. (G) Distribution of dwell time durations at 34°C and 8 mM extracellular Ca2+. Black line: double exponential decay fit (R-square = 0.899; RRS = 0.001407). Arrows: decay constants for the ultrafast and fast component of the exponential. Inset: cumulative histogram comparing the effect of temperature on dwell times at 8 mM Ca2+, *=p < 0.05. (H) Pie charts depicting the relative contribution of the three modes of retrieval to total endocytosis for all experimental groups. Green: ultrafast retrieval (dwell time duration between 0 and 1 s). Blue: fast endocytosis (dwell time of 1 to 20 s). Yellow: ultra-slow retrieval (>20 s). Note that the percentage of each type of endocytosis is not greatly affected by changes in Ca2+ or temperature. For D to G. Kolmogorov-Smirnov test: 24°C 2 mM Ca2+ vs. 24°C 8 mM Ca2+: p=0.0026; 34°C 2 mM Ca2+ vs. 34°C 8 mM Ca2+: p=0.0043; 24°C 2 mM Ca2+ vs 34°C 2 mM Ca2+: p=0.0265; 24°C 8 mM Ca2+ vs 34°C 8 mM Ca2+: p=0.0015. Kruskal-Wallis test: p<0.0001; Dunn’s post-test: 24°C 2 mM Ca2+ vs. 24°C 8 mM Ca2+: p<0.0001; 34°C 2 mM Ca2+ vs. 34°C 8 mM Ca2+: p<0.05; 24°C 2 mM Ca2+ vs 34°C 2 mM Ca2+: not-significant; 24°C 8 mM Ca2+ vs 34°C 8 mM Ca2+: p<0.0001. For all the data presented in this figure: 24°C – 2 mM Ca2+: 576 boutons from eight coverslips; 24°C – 8 mM Ca2+: 496 boutons from seven coverslips; 34°C – 2 mM Ca2+: 442 boutons from 10 coverslips; 34°C – 8 mM Ca2+: 370 boutons from nine coverslips. At least three independent experiments (cultures).
Figure 4
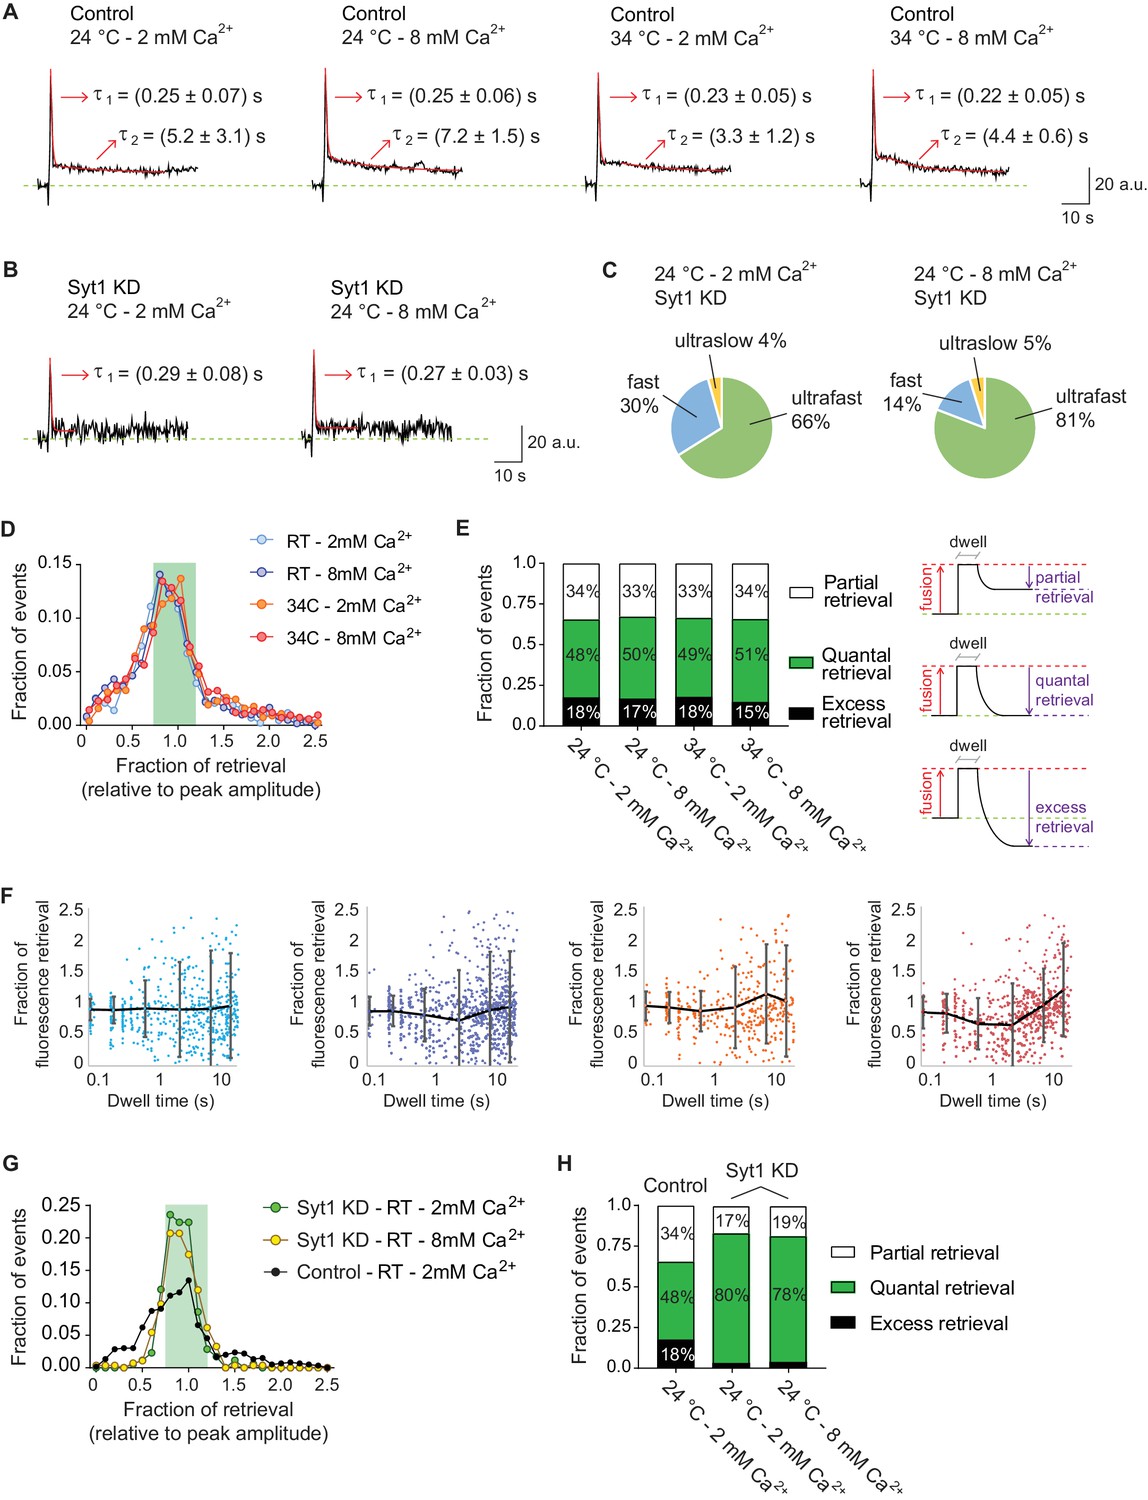
Ultrafast endocytosis is associated with quantal release, while fast endocytosis shows a wide variability in the fraction of retrieved vGluT1-pHluorin.
(A) Average of all fusion events measured with vGluT1-pHluorin at 24 and 34°C, and at 2 or 8 mM extracellular Ca2+ (N of events, boutons and experiments correspond to the ones presented in Figure 3). Red lines show the exponential fit, with two phases of decay: one ultrafast (τ1) and one fast (τ2). Arrows: values of the decay constants for the ultrafast and fast components. Note that values agree with the timescales obtained by fitting the distributions of individual dwell time durations (non-averaged). (B) Averaged traces of fusion events measured in syt1 KD hippocampal neurons, in 2 or 8 mM extracellular Ca2+. Red lines show the exponential fit, with only the ultrafast component present (τ1). Arrows: values of the decay constants. (C) Pie charts depicting the relative contribution of the three modes of retrieval to total endocytosis in syt1 KD neurons, measured using vGluT1-pHluorin. Green: ultrafast retrieval (dwell time duration between 0 and 1 s). Blue: fast endocytosis (dwell time of 1 to 20 s). Yellow: ultra-slow retrieval (>20 s). Note that 70–80% of endocytosis is mediated by an ultrafast mechanism in syt1 KD neurons. (D) Histogram showing the distribution of the level of retrieval (relative to the fluorescence amplitude of the fusion), showing similar distribution for all tested conditions in wild-type neurons. (E) Left: bar graph showing the percentage of each type of retrieval contributing to total retrieval. Note that regardless of Ca2+ concentration or temperature around 50% of fusion events are followed by quantal retrieval (fraction of retrieval in the range of 1.0 ± 0.2). Right: schematic representation of how the fraction of retrieval was calculated and the three types of retrieval found: partial retrieval (<0.8), quantal retrieval (1.0 ± 0.2), excess retrieval (>1.2). (F) Plots of fraction of retrieval as a function of dwell time duration, for 24 and 34°C at 2 or 8 mM extracellular Ca2+. Note the increase in the dispersion of fraction of retrieval as dwell time length increases. Dots: individual values from each fusion event. Black lines and error bars: average fraction of retrieval and standard deviation for the following groups. 2 mM Ca2+ at 24°C: 0.0–0.1 s dwell time – 0.9 ± 0.2 fraction of retrieval; 0.1–0.5 s dwell time – 0.9 ± 0.2 fraction of retrieval; 0.5–1.0 s dwell time – 0.9 ± 0.4 fraction of retrieval; 1–5 s dwell time – 0.9 ± 0.7 fraction of retrieval; 5–10 s dwell time – 0.9 ± 0.9 fraction of retrieval; 10–20 s dwell time – 0.9 ± 0.8 fraction of retrieval. 8 mM Ca2+ at 24°C: 0.0–0.1 s dwell time – 0.9 ± 0.2 fraction of retrieval; 0.1–0.5 s dwell time – 0.9 ± 0.2 fraction of retrieval; 0.5–1.0 s dwell time – 0.8 ± 0.4 fraction of retrieval; 1–5 s dwell time – 0.7 ± 0.8 fraction of retrieval; 5–10 s dwell time – 0.9 ± 0.9 fraction of retrieval; 10–20 s dwell time – 0.9 ± 0.8 fraction of retrieval. 2 mM Ca2+ at 34°C: 0.0–0.1 s dwell time – 0.9 ± 0.2 fraction of retrieval; 0.1–0.5 s dwell time – 0.9 ± 0.2 fraction of retrieval; 0.5–1.0 s dwell time – 0.8 ± 0.3 fraction of retrieval; 1–5 s dwell time – 0.9 ± 0.6 fraction of retrieval; 5–10 s dwell time – 1.0 ± 0.8 fraction of retrieval; 10–20 s dwell time – 1.0 ± 0.9 fraction of retrieval. 8 mM Ca2+ at 34°C: 0.0–0.1 s dwell time – 0.8 ± 0.3 fraction of retrieval; 0.1–0.5 s dwell time – 0.8 ± 0.3 fraction of retrieval; 0.5–1.0 s dwell time – 0.7 ± 0.4 fraction of retrieval; 1–5 s dwell time – 0.6 ± 0.7 fraction of retrieval; 5–10 s dwell time – 0.9 ± 0.6 fraction of retrieval; 10–20 s dwell time – 1.2 ± 0.7 fraction of retrieval. (G) Distribution of the level of retrieval (relative to the fluorescence amplitude of the fusion), showing a sharper distribution for syt1 KD neurons compared to wild type (control) neurons. (H) Bar graph showing the percentage of each type of retrieval contributing to total retrieval. Around 80% of fusion events are followed by quantal retrieval in syt1 KD, at either 2 or 8 mM extracellular Ca2+, contrasting with only 50% in control neurons. For B, C, G and H. Syt1 KD at 24°C and 2 mM Ca2+: 120 events from eight coverslips; Syt1 KD at 24°C and 8 mM Ca2+: 124 events from 14 coverslips. 4–5 independent experiments (cultures).
Figure 5
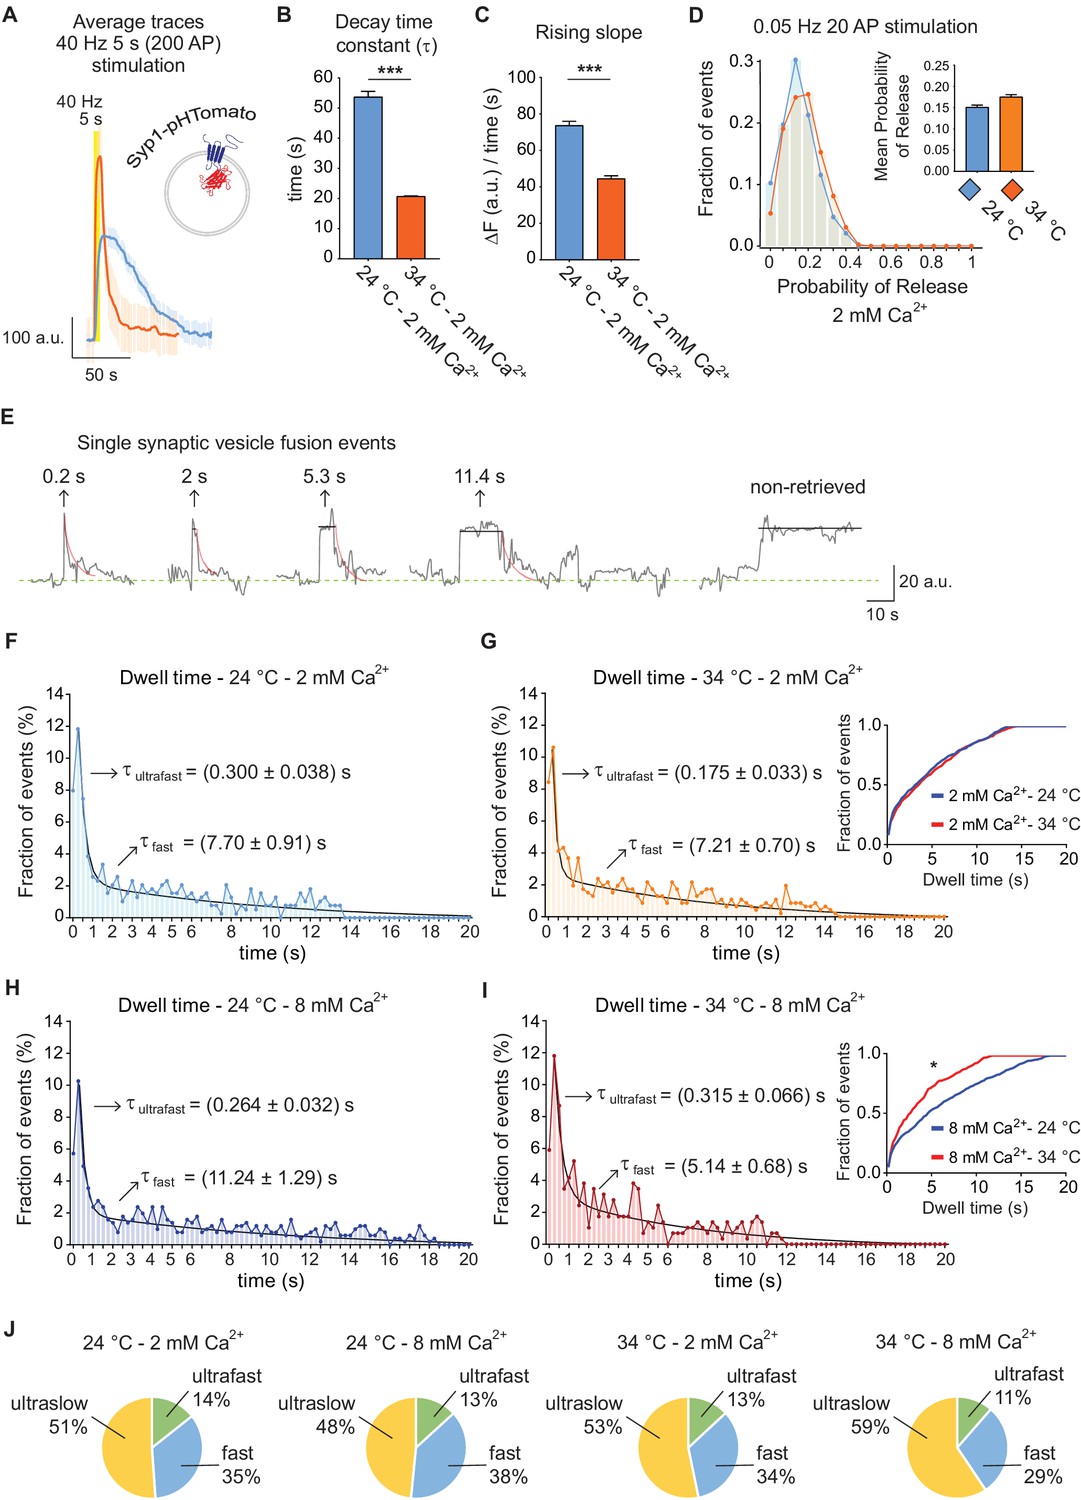
Trafficking of Syp1-pHTomato at different temperatures reproduces vGluT1-pHluorin behavior.
(A) Average non-normalized 40 Hz (200 AP) traces of Syp1-pHTomato at 24°C and 2 mM extracellular Ca2+ (blue), or at 34°C and 2 mM Ca2+ (orange). (B) Average decay time constants (τ) of the fluorescence return to baseline after 40 Hz stimulation, calculated with a single exponential decay fit. (C) Slope of the rise in fluorescence triggered by 40 Hz stimulation, expressed as change in fluorescence over time and calculated by linear regression. For B to D. Statistical analysis was performed applying Kruskal-Wallis analysis (non-parametric ANOVA) with Dunn’s multiple comparisons post-test. *p<0.05; **p<0.01; ***p<0.001; ***p<0.0001. (D) Distribution of probabilities of release at 24°C (blue) or 34°C (orange) and 2 mM extracellular Ca2+ concentration. Inset: mean release probability for each group. 2 mM Ca2+ at 24°C: 0.15 ± 0.01. 2 mM Ca2+ at 34°C: 0.17 ± 0.01. (E) Example traces of de-noised single synaptic vesicle fusion events measured with Syp1-pHTomato, showing different dwell time lengths. (F) Distribution of dwell time durations at 24°C and 2 mM extracellular Ca2+. Black line: double exponential decay fit (R-square = 0.922; RRS = 0.001336). Arrows: decay constants for the ultrafast and fast component of the exponential. (G) Distribution of dwell time durations at 34°C and 2 mM extracellular Ca2+. Black line: double exponential decay fit (R-square = 0.593; RRS = 0.001423). Arrows: decay constants for the ultrafast and fast component of the exponential. Inset: cumulative histogram comparing the effect of temperature on dwell times at 2 mM Ca2+, there are no significant differences. (H) Distribution of dwell time durations at 24°C and 8 mM extracellular Ca2+. Black line: double exponential decay fit (R-square = 0.911; RRS = 0.00122). Arrows: decay constants for the ultrafast and fast component of the exponential. (I) Distribution of dwell time durations at 34°C and 8 mM extracellular Ca2+. Black line: double exponential decay fit (R-square = 0.865; RRS = 0.002644). Arrows: decay constants for the ultrafast and fast component of the exponential. Inset: cumulative histogram comparing the effect of temperature on dwell times at 8 mM Ca2+, *=p < 0.05. (J) Pie charts showing the percentage of each mode of retrieval for all experimental groups. Green: ultrafast retrieval (dwell time duration between 0 and 1 s). Blue: fast endocytosis (dwell time of 1 s to 20 s). Yellow: ultra-slow retrieval (>20 s). Note that the ratio of each type of endocytosis does not change with Ca2+ or temperature. For H to K. Kolmogorov-Smirnov test: 24°C 2 mM Ca2+ vs. 24°C 8 mM Ca2+: p=0.0011; 34°C 2 mM Ca2+ vs. 34°C 8 mM Ca2+: p=0.0015; 24°C 2 mM Ca2+ vs 34°C 2 mM Ca2+: non-significant; 24°C 8 mM Ca2+ vs 34°C 8 mM Ca2+: p<0.0001. Kruskal-Wallis test: p<0.0001; Dunn’s post-test: 24°C 2 mM Ca2+ vs. 24°C 8 mM Ca2+: p<0.001; 34°C 2 mM Ca2+ vs. 34°C 8 mM Ca2+: non-significant; 24°C 2 mM Ca2+ vs 34°C 2 mM Ca2+: non-significant; 24°C 8 mM Ca2+ vs 34°C 8 mM Ca2+: p<0.0001. For all the data presented in this figure. 24°C – 2 mM Ca2+: 423 boutons from seven coverslips; 24°C – 8 mM Ca2+: 384 boutons from seven coverslips; 34°C – 2 mM Ca2+: 393 boutons from six coverslips; 34°C – 8 mM Ca2+: 361 boutons from seven coverslips. At least three independent experiments (cultures).
Figure 6 with 1 supplement
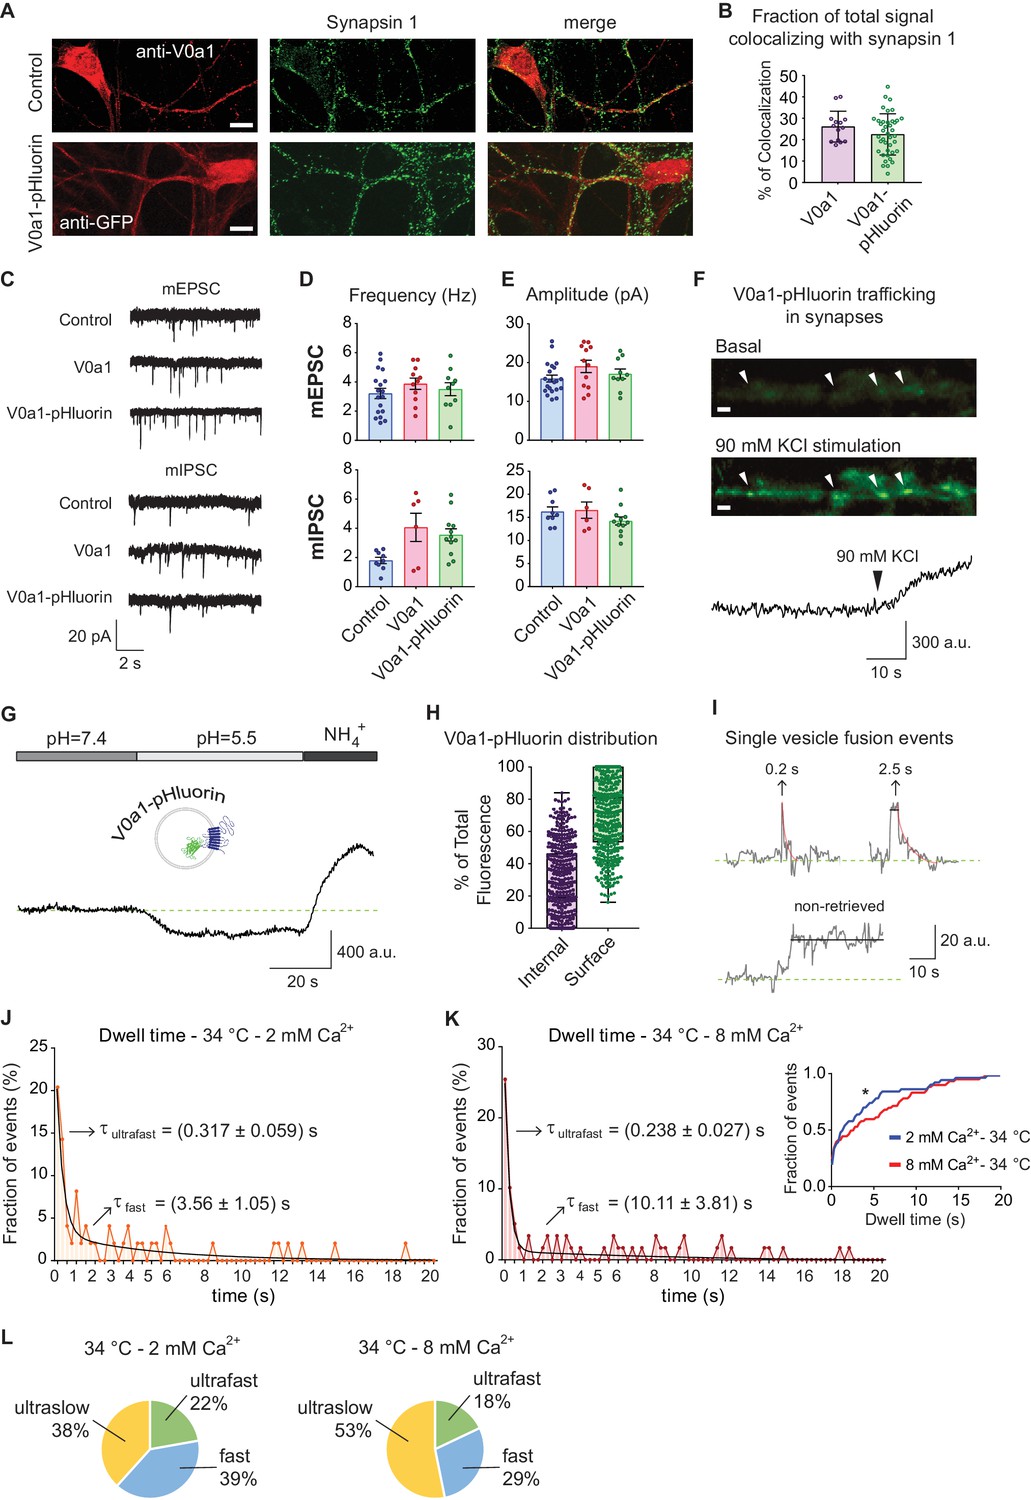
V0a1-pHluorin characterization and presynaptic trafficking.
(A) Immunofluorescence of control (empty vector) and V0a1-pHluorin expressing hippocampal neurons. Top: control neuron stained with anti-V0a1 antibody to reveal endogenous V0a1 levels and distribution in RED. Bottom: V0a1-pHluorin expressing neuron immunostained with anti-GFP to show levels and distribution of the fusion protein in RED. For both, in GREEN staining against synapsin one is shown. White scale bar = 10 μm. (B) Quantification of colocalizing signal between Synapsin one and V0a1 or V0a1-pluorin. Colocalization analysis was object based, using a custom macro for Fiji. Positive colocalization was defined as an overlap in the area with above threshold signal in both channels after image segmentation. The % of colocalizing area was calculated. (C) Example traces of miniature inhibitory (mIPSC) and excitatory (mEPSC) postsynaptic currents for control (mock virus transfected), V0a1 over-expression and V0a1-pHluorin groups. Current clamp experiments were performed at room temperature and recorded for 5 min. (D) Frequency (Hz) of mIPSC (top) and mEPSC (bottom) for control, V0a1 and V0a1-pHluorin groups. (E) Amplitude (pA) of mIPSC (top) and mEPSC (bottom) for control, V0a1 and V0a1-pHluorin groups. For D to F: mIPSC: control = 9 cells; V0a1 = 7 cells; V0a1-pHluorin = 13 cells; mEPSC: control = control = 18 cells; V0a1 = 12 cells; V0a1-pHluorin = 10 cells. 1–3 neurons were patched per coverslip, 4–5 independent experiments (cultures). Also see the analysis of evoked neurotransmission in V0a1 and V0a1-pHluorin groups in Figure 6—figure supplement 1. (F) Representative wide-field fluorescence image from V0a1-pHluorin expressing neurons, before (basal signal) and after stimulation with 90 mM KCl, showing exocytosis of the probe. White arrowheads: presynaptic boutons. The quantification of fluorescence intensity over time for one of the boutons is shown in below images. White scale bars = 2 μm. (G) Example trace (average from one experiment) of V0a1-pHluorin fluorescence changes after Tyrode’s buffer pH = 5.5 perfusion and NH4+ 50 mM application. (H) Quantification of the distribution (ratio) of V0a1-pHluorin in internal membranes (internal – purple) and plasma membrane (surface – green). 420 boutons analyzed from five coverslips (three independent experiments – cultures). (I) Example traces of de-noised single synaptic vesicle fusion events measured with V0a1-pHluorin, showing different dwell time lengths. Example traces after strong stimulation (40 Hz, 5 s) and folimycin treatment are shown in Figure 6—figure supplement 1. (J) Distribution of dwell time durations at 34°C and 2 mM extracellular Ca2+. Black line: double exponential decay fit (R-square = 0.837; RRS = 0.01181). Arrows: decay constants for the fast and slow component of the exponential. 95 boutons from six coverslips. (K) Distribution of dwell time durations at 34°C and 8 mM extracellular Ca2+. Black line: double exponential decay fit (R-square = 0.885; RRS = 0.009151). Arrows: decay constants for the fast and slow component of the exponential. (L) Pie charts depicting the ratio of each mode of retrieval respect to the total number of measured events, at 34°C and 2 or 8 mM extracellular Ca2+. Green: ultrafast retrieval (dwell time duration between 0 and 1 s). Blue: fast endocytosis (dwell time of 1 to 20 s). Yellow: ultra-slow retrieval (>20 s). For J to L. 140 boutons from six coverslips. Inset: cumulative histogram comparing the effect of different Ca2+ concentration at 34°C. Kolmogorov-Smirnov test of cumulative histogram: 34°C 2 mM Ca2+ vs. 34°C 8 mM Ca2+: p=0.0086.
Figure 6—figure supplement 1
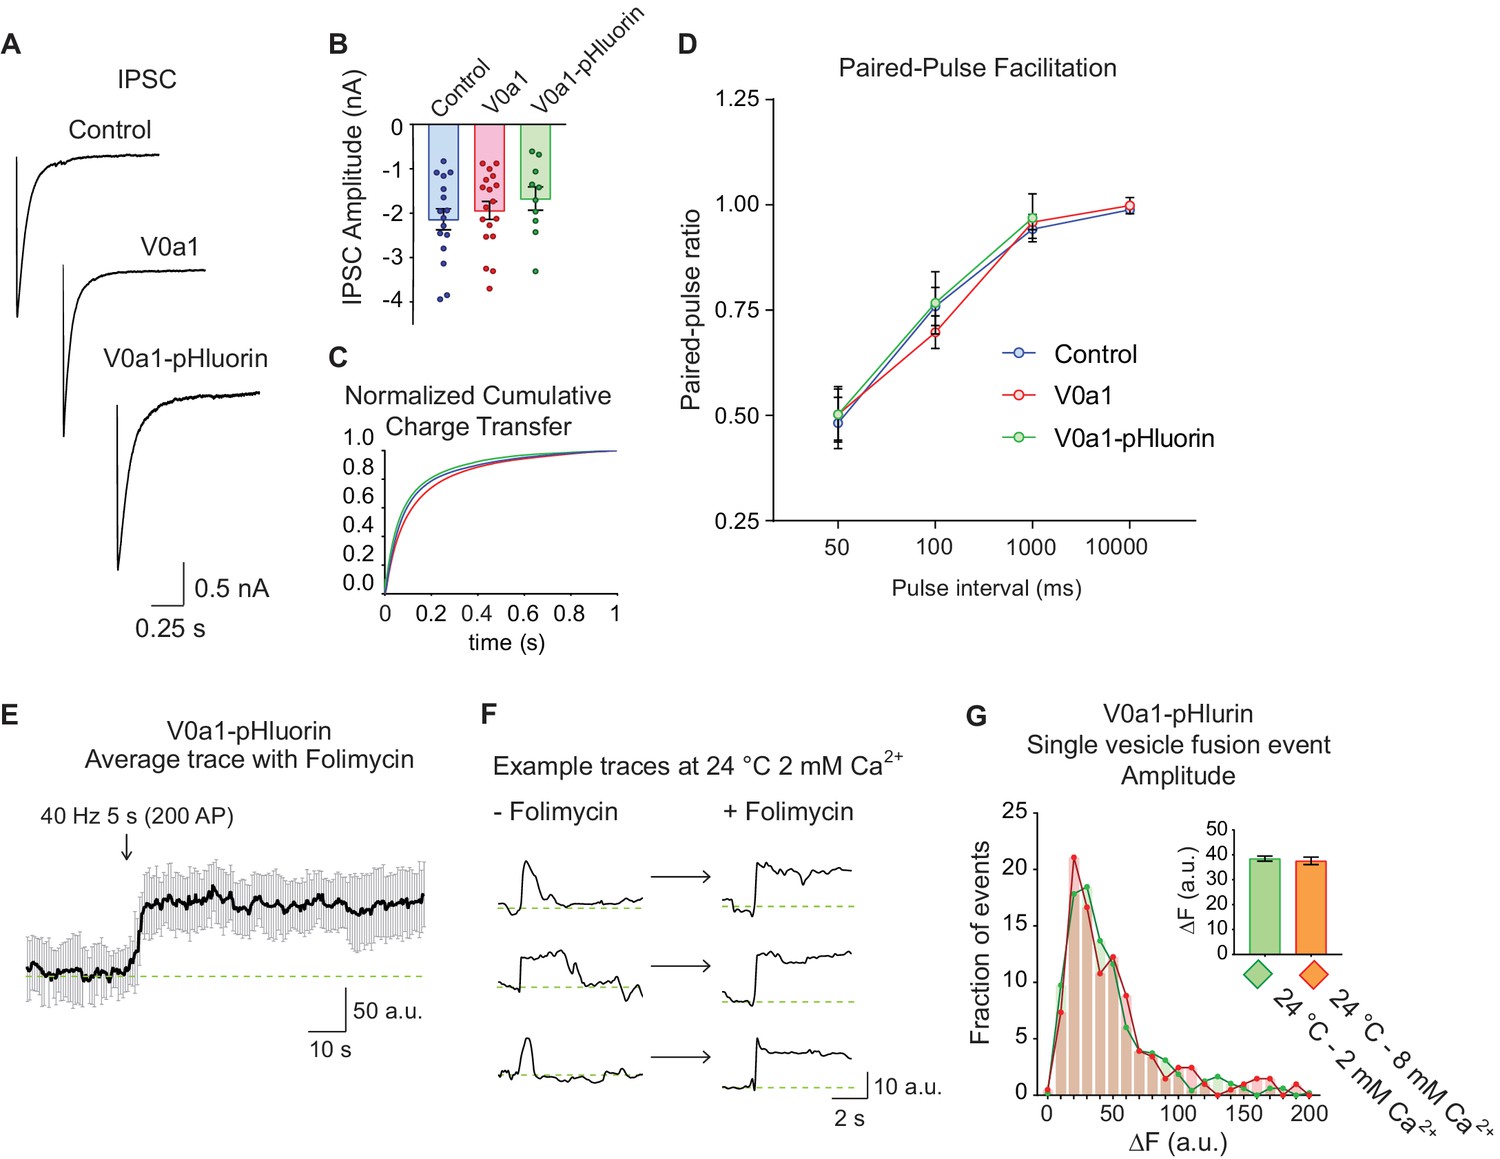
Neurotransmission is not altered by V0a1 or V0a1-pHluorin overexpression.
(A) Example single action-potential evoked inhibitory post-synaptic currents (IPSC) for control (mock lentivirus infected neurons), V0a1 overexpression and V0a1-pHluorin expression. (B) IPSC amplitudes for control, Va01 and Va01-pHluorin groups are similar. (C) Normalized cumulative charge transfer of IPSC for control (blue line), V0a1 (red line) and V0a1-pHluorin (green line) groups showing no differences in the synchronicity of neurotransmission. (D) Paired-pulse ratio for IPSC at different inter-stimuli intervals, the same behavior was observed for control (blue line), V0a1 (red line) and V0a1-pHluorin (green line) groups. For A to D. Data from 16 control pyramidal neurons (hippocampal), 16 neurons overexpressing V0a1 and 10 neurons expressing V0a1-pHluorin, from 5 to 8 coverslips and four independent experiments (cultures). (E) Average fluorescence trace of V0a1-pHluorin expressing boutons after 40 Hz 200 AP (5 s) stimulation in the presence of the v-ATPase inhibitor folimycin (200 μM). Data show the average of traces from 14 boutons from one representative experiment. (F) Example of single vesicle fusion events in the absence and presence of folimycin (200 μM), stimulated at 0.05 Hz and recorded at room temperature and 2 mM extracellular Ca2+. (G) Histogram of amplitudes of single vesicle fusion events measured with Va01-pHluorin in the presence of folimycin (200 μM), showing a quantal distribution for both, 2 and 8 mM Ca2+ groups. 24°C – 2 mM Ca2+: 482 boutons from eight coverslips; 24°C – 8 mM Ca2+: 204 boutons from five coverslips.
Figure 7 with 1 supplement

High-speed imaging of vGluT1-pHluorin corroborates the presence of ultrafast retrieval for single synaptic vesicle fusion events.
(A) Example traces for single vesicle fusion events after de-noising, measured with vGluT1-pHluorin imaging at a speed of 40 Hz. Arrows and insets: expansion of the peak showing dwell time lengths in detail. (B) Distribution of dwell time durations at 24°C and 2 mM extracellular Ca2+. Black line: double exponential decay fit (R-square = 0.8377; RRS = 0.00115). Arrows: decay constants for the ultrafast and fast component of the exponential. (C) Distribution of dwell time durations at 34°C and 2 mM extracellular Ca2+. Black line: double exponential decay fit (R-square = 0.7768; RRS = 0.00121). Arrows: decay constants for the ultrafast and fast component of the exponential. Inset: cumulative histogram comparing the effect of temperature on dwell times at 2 mM Ca2+, there is no significant effect. (D) Distribution of dwell time durations at 24°C and 8 mM extracellular Ca2+. Black line: double exponential decay fit (R-square = 0.8667; RRS = 0.00119). Arrows: decay constants for the ultrafast and fast component of the exponential. (E) Distribution of dwell time durations at 34°C and 8 mM extracellular Ca2+. Black line: double exponential decay fit (R-square = 0.770; RRS = 0.0023). Arrows: decay constants for the ultrafast and fast component of the exponential. Inset: cumulative histogram comparing the effect of temperature on dwell times at 8 mM Ca2+, **=p < 0.01. (F) Pie charts depicting the relative contribution of the three modes of retrieval to total endocytosis for all experimental groups. Green: ultrafast retrieval (dwell time duration between 0 and 1 s). Blue: fast endocytosis (dwell time of 1 to 20 s). Yellow: ultra-slow retrieval (>20 s). Note that the percentage of each type of endocytosis is not greatly affected by changes in Ca2+ or temperature. For B to E. Kolmogorov-Smirnov test: 24°C 2 mM Ca2+ vs. 24°C 8 mM Ca2+: p<0.0001; 34°C 2 mM Ca2+ vs. 34°C 8 mM Ca2+: p=0.0043; 24°C 2 mM Ca2+ vs 34°C 2 mM Ca2+: p=0.08271; 24°C 8 mM Ca2+ vs 34°C 8 mM Ca2+: p<0.0001. Kruskal-Wallis test: p<0.0001; Dunn’s post-test: 24°C 2 mM Ca2+ vs. 24°C 8 mM Ca2+: p<0.0001; 34°C 2 mM Ca2+ vs. 34°C 8 mM Ca2+: non-significant; 24°C 2 mM Ca2+ vs 34°C 2 mM Ca2+: non-significant; 24°C 8 mM Ca2+ vs 34°C 8 mM Ca2+: p<0.0001. For all the data presented in this figure: 24°C – 2 mM Ca2+: 558 boutons from eight coverslips; 24°C – 8 mM Ca2+: 474 boutons from seven coverslips; 34°C – 2 mM Ca2+: 327 boutons from seven coverslips; 34°C – 8 mM Ca2+: 209 boutons from five coverslips. At least three independent experiments (cultures). Also see Figure 7—figure supplement 1 for analysis of negative controls and simulated traces. Legends to the figure supplements.
Figure 7—figure supplement 1

False positive artifacts are negligible at fast (40 Hz) imaging speeds.
(A) Comparison of original not processed vGluT1-pHluorin traces imaged at 40 Hz with the resulting signal after bleaching, background and noise corrections, at different Ca2+ concentrations and temperatures. The failure analysis used to quantify probability of release is exemplified. (B) Example of a fluorescence trace over time, before and after de-noising, of a negative control bouton from neurons pretreated with EGTA-AM 100 μM for 15 min in a 0 mM Ca2+ medium, and then imaged at 34°C with 0 mM extracellular Ca2+ and similar stimulation paradigm applied to the positive control group. (C) Cumulative histogram of probability of release measured at 34°C, for positive control boutons (2 mM extracellular Ca2+) and negative control group measured as described in B. The release probability of the negative control is <0.02, which corresponds to <15% of the mean release probability in the positive control group. Positive control: 418 boutons; Negative control – EGTA-AM: 120 boutons. All data are from 2 to 3 independent experiments. (D) and (E) Distribution of experimental noise amplitudes (empty circles) measured at 2 mM extracellular Ca2+ and 24°C or 34°C, respectively. Red lines: Gaussian fit. The noise distribution after de-noising is superimposed (grey histogram). Note the dramatic effect of the filtering in noise reduction. (F) Top: simulated fluorescence trace with a release probability of 0.5. Middle: simulated trace with added random Gaussian noise with an amplitude of ~75% the amplitude of the signal (to properly simulate real experimental traces). Bottom: recovered trace after de-noising, note that most of the fusion events are recovered with minimal morphological alterations. (G) Comparison of cumulative histograms of dwell times for the original simulated trace (before adding noise, shown in black) and for the recovered simulated trace after de-noising (shown in red). Insets: corresponding Tukey plots of dwell times and probability of detection. (H) Relative proportion of different types of simulated events (with no dwell, with a dwell followed by retrieval – including fast and ultrafast events –, with no retrieval – similar to ultra-slow endocytosis –) before (original simulated trace) and after de-noising (recovered), showing similar distribution. Note the presence of <15% contribution of false detection or false positives (yellow). For G and H. Data from two independent simulations with 100 boutons (traces) and 47 events per simulation.
Author response image 1

a and b – Cumulative histograms of single vesicle fusion event amplitudes at room temperature (24 °C) and physiological temperature (34 °C), measured with vGluT1-pHluorin.
c and d – Plot of decay time constant as a function of dwell time duration at room temperature (24 °C) and physiological temperature (34 °C), measured with vGluT1-pHluorin. Solid black lines: linear fit, showing no correlation (R2 ~ 0). e – Cumulative distribution of decay time constants for single vesicle fusion events showing no differences at the two measured temperatures. Inset: mean value ± SEM. N of experiments are indicated in Figure 3 legend of the main manuscript.
Tables
Key resources table
| Reagent type | Designation | Source or reference | Identifiers | Additional information |
|---|---|---|---|---|
| Antibody | Mouse monoclonal anti-GFP | Cell Signaling | Catalog # 29565 | dil. 1:100 |
| Antibody | Rabbit polyclonal anti-V0a1 | Synaptic Systems | Catalog # 109 002 | dil. 1:100 |
| Antibody | Mouse monoclonal anti-Synapsin 1 | EMD Millipore | Catalog # MABN894 | dil. 1:1000 |
| Antibody | Mouse monoclonal anti-GDI | Synaptic Systems | Catalog # 130 011 | dil. 1:5000 |
| Chemical, compound, drug | 6-Cyano-7-nitroquinoxaline-2,3-dione disodium salt hydrate (CNQX) | Sigma-Aldrich | Catalog # C239 | 10 µM |
| Chemical, compound, drug | D(−)−2-Amino-5-phosphonopentanoic acid (AP-5) | Sigma-Aldrich | Catalog # A8054 | 50 µM |
| Chemical, compound, drug | Tetrodotoxin (TTX) | Enzo Life Sciences | Catalog # BML-NA120-0001 | 1 µM |
| Chemical, compound, drug | Picrotoxin (PTX) | Sigma-Aldrich | Catalog # P1675 | 50 µM |
| Chemical, compound, drug | Folimycin from Streptomyces sp. | Calbiochem/EMD | Catalog # 344085 | 200 nM |
| Chemical, compound, drug | Trypsin from bovine pancreas | Sigma-Aldrich | Catalog # T9935 | |
| Chemical, compound, drug | DNase | Sigma-Aldrich | Catalog # D5025-375KU | |
| Chemical, compound, drug | Matrigel | Corning | Catalog # 354234 | dil. 1:25 |
| Chemical, compound, drug | FuGENE 6 | Promega | Catalog # E2692 | |
| Chemical, compound, drug | QX-314 | EMD-Millipore | Catalog # 552233 | |
| Cell line | Highly transfectable derivative of human embryonic kidney-293 epithelial adherent cells (HEK293T) | ATCC | Catalog # CRL-1573 | |
| Organism/Strain | Sprague-Dawley rat pups (P2-P4) | |||
| Recombi-nant DNA | Plasmid: pRSV-REV (lentiviral packaging) | Addgene | Catalog # 12253 | |
| Recombi-nant DNA | Plasmid: pCMV-VSV-G (lentiviral packaging) | Addgene | Catalog # 8454 | |
| Recombi-nant DNA | Plasmid: pMDLg/pRRE (lentiviral packaging) | Addgene | Catalog # 12251 | |
| Recombi-nant DNA | Plasmid: pFUGW-vGlut1-pHGFP | Voglmaier et al. (2006) | N/A | |
| Recombi-nant DNA | Plasmid: pFU-Syp1-pHTomato | Li and Tsien (2012) Leitz and Kavalali (2011) | N/A | |
| Recombi-nant DNA | Plasmid: pFUGW-Va01 | (see Materials and methods section) | ||
| Recombi-nant DNA | Plasmid: pFUGW-Va01-pHluorin | (see Materials and methods section) | ||
| Software and Algorithms | Forward-backward non-linear filter: noise reduction (NoiseReduc) function for Matlab from Nigel Reuel | Chung and Kennedy (1991) Reuel et al. (2012) | http://web.mit.edu/stranogroup/index.php/resources/19-simulation-and-analysis-codes/norse-code-files/40-norse-algorithm.html | |
| Software and Algorithms | Single-vesicle-fusion-events | Present work | https://github.com/nchanaday/Single-vesicle-fusion-events | Copy archived at https://github.com/elifesciences-publications/Single-vesicle-fusion-events |
Additional files
-
Transparent reporting form
- https://doi.org/10.7554/eLife.36097.013
Download links
A two-part list of links to download the article, or parts of the article, in various formats.
Downloads (link to download the article as PDF)
Open citations (links to open the citations from this article in various online reference manager services)
Cite this article (links to download the citations from this article in formats compatible with various reference manager tools)
Optical detection of three modes of endocytosis at hippocampal synapses
eLife 7:e36097.
https://doi.org/10.7554/eLife.36097


