Down regulation of vestibular balance stabilizing mechanisms to enable transition between motor states
- University of British Columbia, Canada
- Utah State University, United States
- Monash University, Australia
Figures
Figure 1
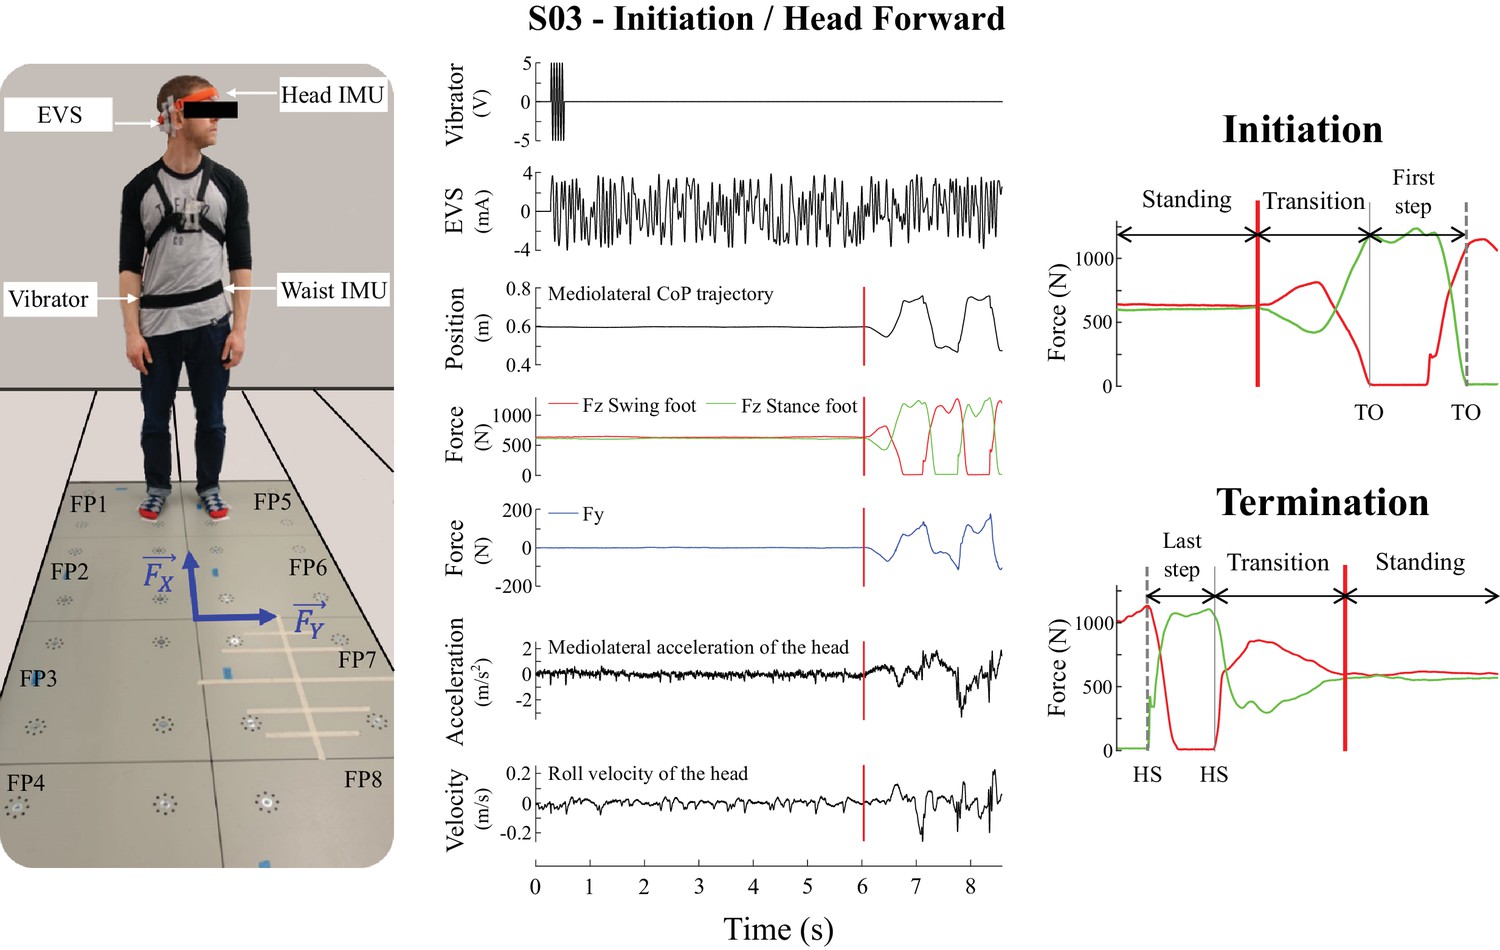
Experimental set-up and the signals recorded during the experiment used to detect the movement phases.
The left panel is a subject in the initial posture before locomotion initiation in the head left condition. The subject is standing on the forceplates and equipped with the electrodes on his mastoid processes, inertial measurement units (IMU, on the head and the waist) and vibrator, the laser mounted on the orange headband. and correspond to the shear forces measured in the anteroposterior and mediolateral directions, respectively. The middle panel illustrates single trial data from one representative subject during locomotion initiation in the head forward condition. From top to bottom: input signal to the vibrator, electrical vestibular stimulation (EVS) signal, mediolateral centre of pressure trajectory, vertical reaction forces (), shear force in the direction of the vestibular-induced perturbation (), linear acceleration of the head in the direction of the vestibular-induced perturbation, and roll angular velocity. The vertical red line is the onset of the transition period. The right panel shows the vertical force signals at initiation (top) and termination (bottom) used to define movement phases for statistical analysis: quiet standing (between first/last instant and vertical red line), transition (between vertical red line and vertical grey line), and first/last step (between vertical grey line and vertical dashed grey line). Abbreviations used: TO = toe-off; HS = heel-strike.
Figure 2

Averaged behavioral and time-frequency coherence results for one representative subject (n = 1, top) and across all subjects (n = 10, bottom) during locomotion initiation.
Time was normalized based on the duration (D) measured between transition onset and the third toe-off. In both lower and upper panels, the left panel is the head forward condition and the right panel is the head left condition. As in Figure 1, the vertical red line shows the transition onset and the vertical grey line shows the transition end. Individual results (top) represent the average ± one standard deviation (n = 100 trials) of (from top to bottom): mediolateral centre of pressure, vertical forces (), shear force in the direction of the vestibular-induced perturbation ( = mediolateral; = anteroposterior), root mean square (RMS) of that same shear force, horizontal acceleration in the direction of the vestibular-induced perturbation, angular roll velocity of the head, and time-frequency coherence. The pooled results (bottom), represent the average ± one standard deviation (n = 1000 trials) of (from top to bottom): vertical forces (), shear force in the direction of the vestibular-induced perturbation and time-frequency coherence. Solid lines represent the average value while the dashed line is one standard deviation. The grey-shaded areas represent the double support periods during locomotion, in the head forward condition only. In the time-frequency coherence graphs, all non-significant coherence values have been set to zero based on a 99% confidence limit (single subject = 0.045, pooled data = 0.005). For illustrative purposes, vertical forces of the swing and stance foot (red and green curves, respectively) have been plotted relative to the first step. Note that the scale of coherence level for all subjects is half the scale presented in coherence graphs for the individual subject.
Figure 3
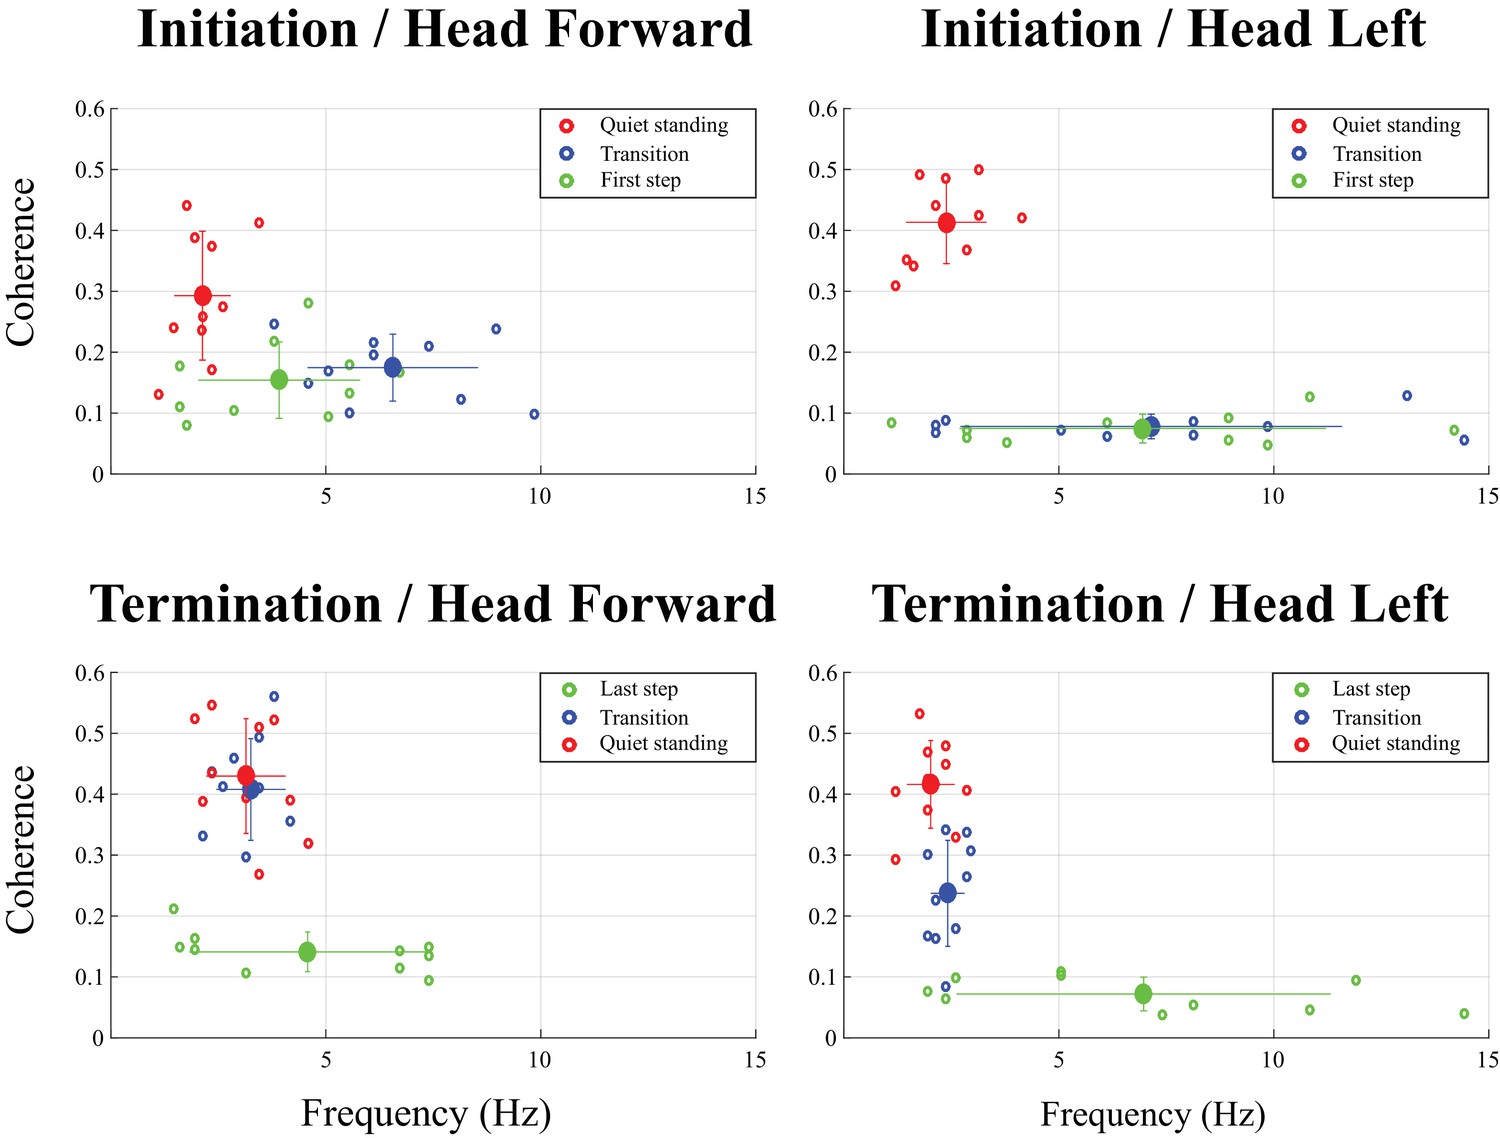
Magnitude and frequency of peak coherence measured at locomotion initiation (top) and termination (bottom) over three time periods: quiet standing (red dots), transition (blue dots) and first or last step (green dots).
The big dots represent average values across all subjects (n = 10) and each small dot represents individual subject (n = 1). The results presented on the left panel are for the head forward condition; those in right panel, for the head left condition. Error bars represent one standard deviation of peak coherence magnitude (vertical) and frequency (horizontal). Multivariate analysis of variance (MANOVA) revealed a significant effect of the movement period in each of the four conditions (all p<0.001). Multivariate analysis comparing results from two periods showed the quiet standing period was significantly different from the two other periods (transition and first/last step, p<0.001), except for the head left condition when subjects terminated locomotion (p=0.857). Results of a univariate t-test comparing coherence peak and frequency of that peak across the different movement periods are provided in Table 1. The high variability in the frequency at which maximal coherence was observed in the head left condition during the transition, the first step at initiation, and the last step at termination is due to the very low level of coherence measured during these periods.
Figure 4
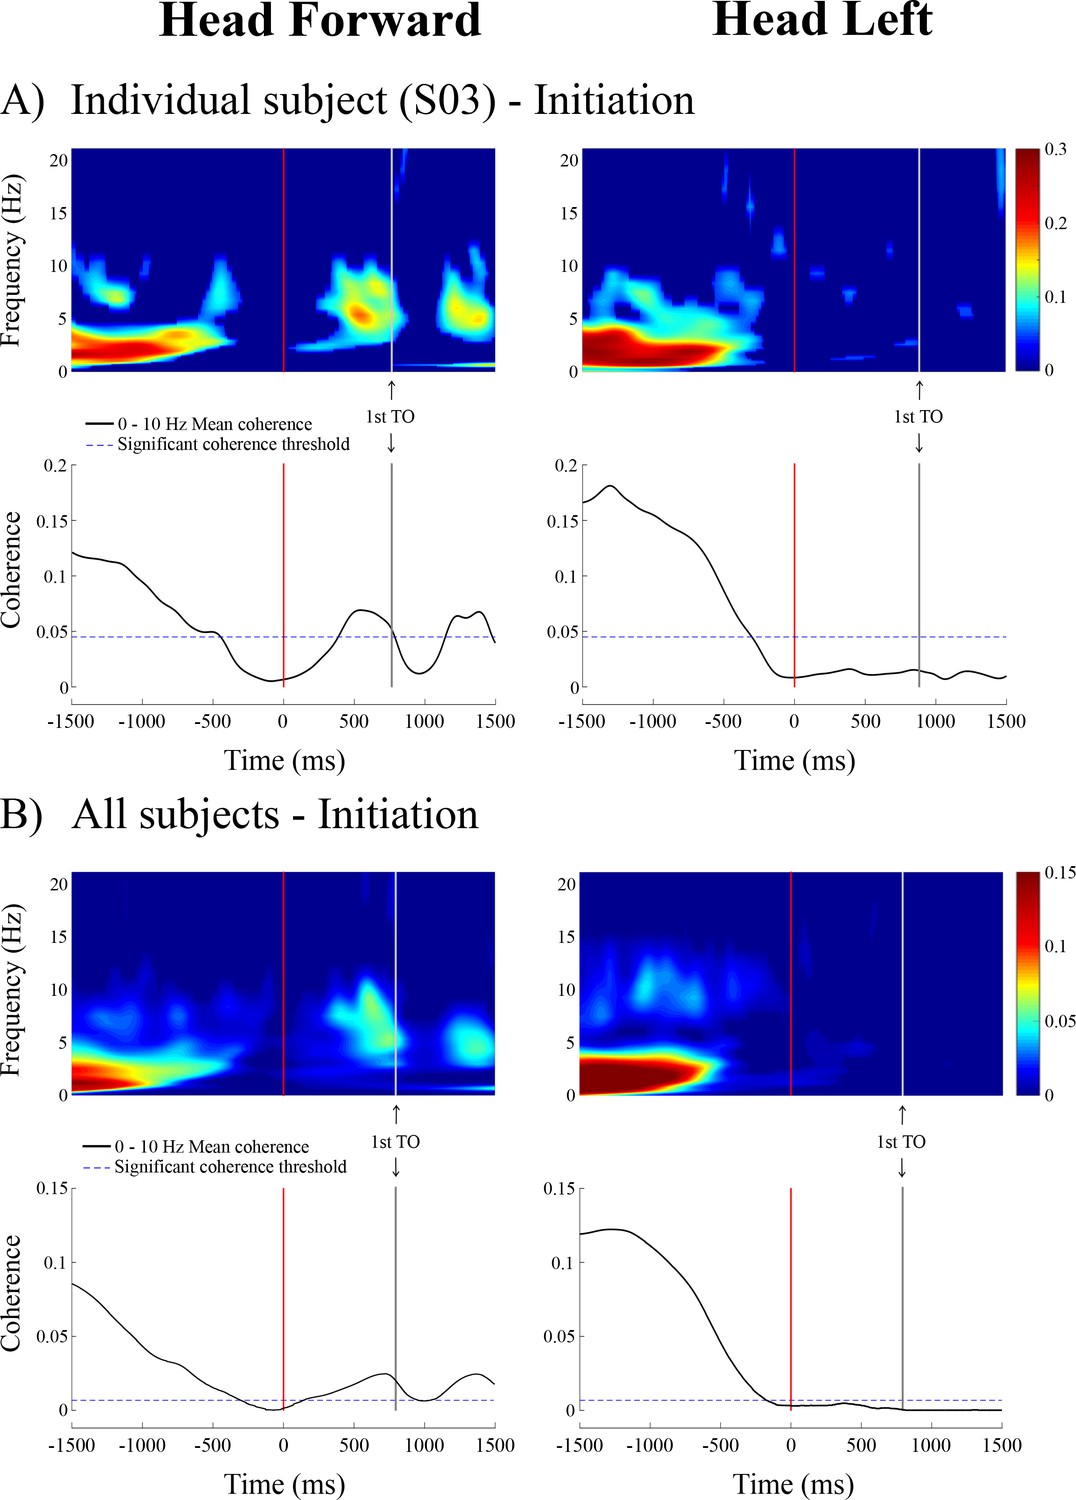
Time-frequency coherence and temporal evolution of the coherence averaged in the 0–10 Hz frequency bandwidth for a representative subject (n = 1, panel A, top) and averaged across all subjects (n = 10, panel B, bottom) at locomotion initiation in the non-normalized data segment.
As in Figure 1, the vertical red and grey lines show the onset and the end of the transition period, respectively. Data are only presented from the 1.5 s preceding the transition onset to the 1.5 s following it (because data are less synchronized the further they are from the transition onset). In the time-frequency coherence graphs, all non-significant coherence values have been set to zero based on a 99% confidence limit (single subject = 0.045; pooled data = 0.005). In both A) and B), the left panel is the head forward condition and the right panel is the head left condition. Note that the scale of coherence level for all subjects is half the scale presented in coherence graphs for the individual subject. TO = toe-off.
Figure 5
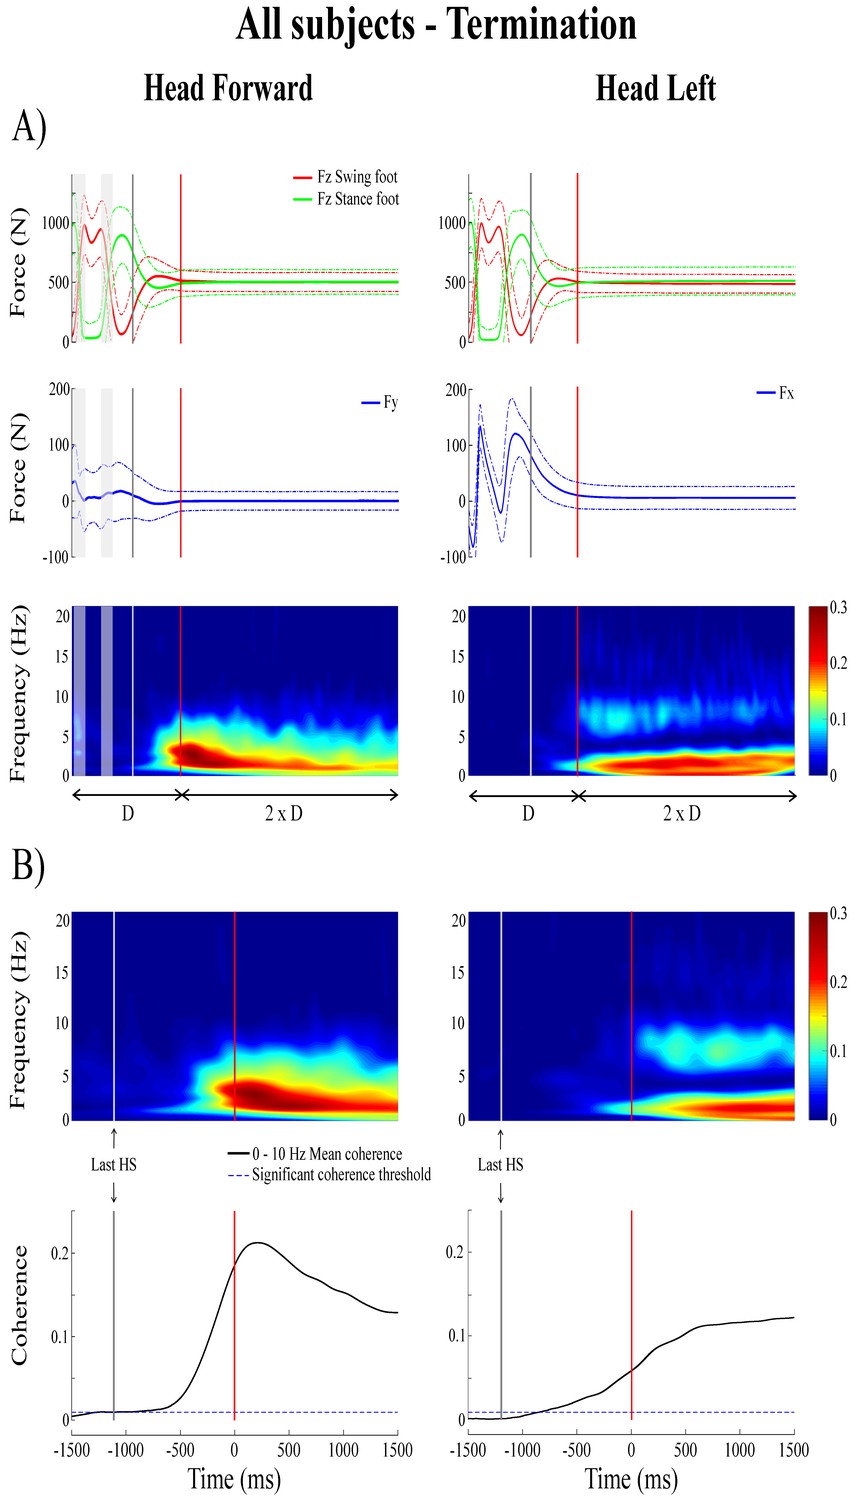
Forces and time-frequency coherence averaged across all subjects (n = 10) at locomotion termination.
Panel A presents average results (n = 1000 trials) in the normalized time segment based on the duration (D) measured between the third-to-last foot-strike and end of the transition phase; from top to bottom: vertical reaction forces (), shear force in the direction of the vestibular-induced perturbation ( = mediolateral; = anteroposterior) and time-frequency coherence. Panel B presents averaged time-frequency coherence (top, n = 1000) and temporal evolution of the coherence averaged in the 0–10 Hz frequency bandwidth (bottom) in the non-normalized time segment; as in Figure 4, data are only presented from the 1.5 s preceding the end of the transition phase to the 1.5 s following it. In the time-frequency coherence graphs, all non-significant coherence values have been set to zero based on a 99% confidence limit equal to 0.005. In both (A) and (B), the left panel is the head forward condition and the right panel is the head left condition. In both panels, the vertical grey line shows the onset of the transition period and the vertical red line shows the end of the transition period, solid lines represent the average value and dashed line shows one standard deviation. The grey shaded areas are the double support periods during locomotion, in the head forward condition only. For illustrative purposes, the vertical forces for the swing and stance foot (red and green curves, respectively) have been plotted relative to the last step. HS = heel-strike.
Figure 6
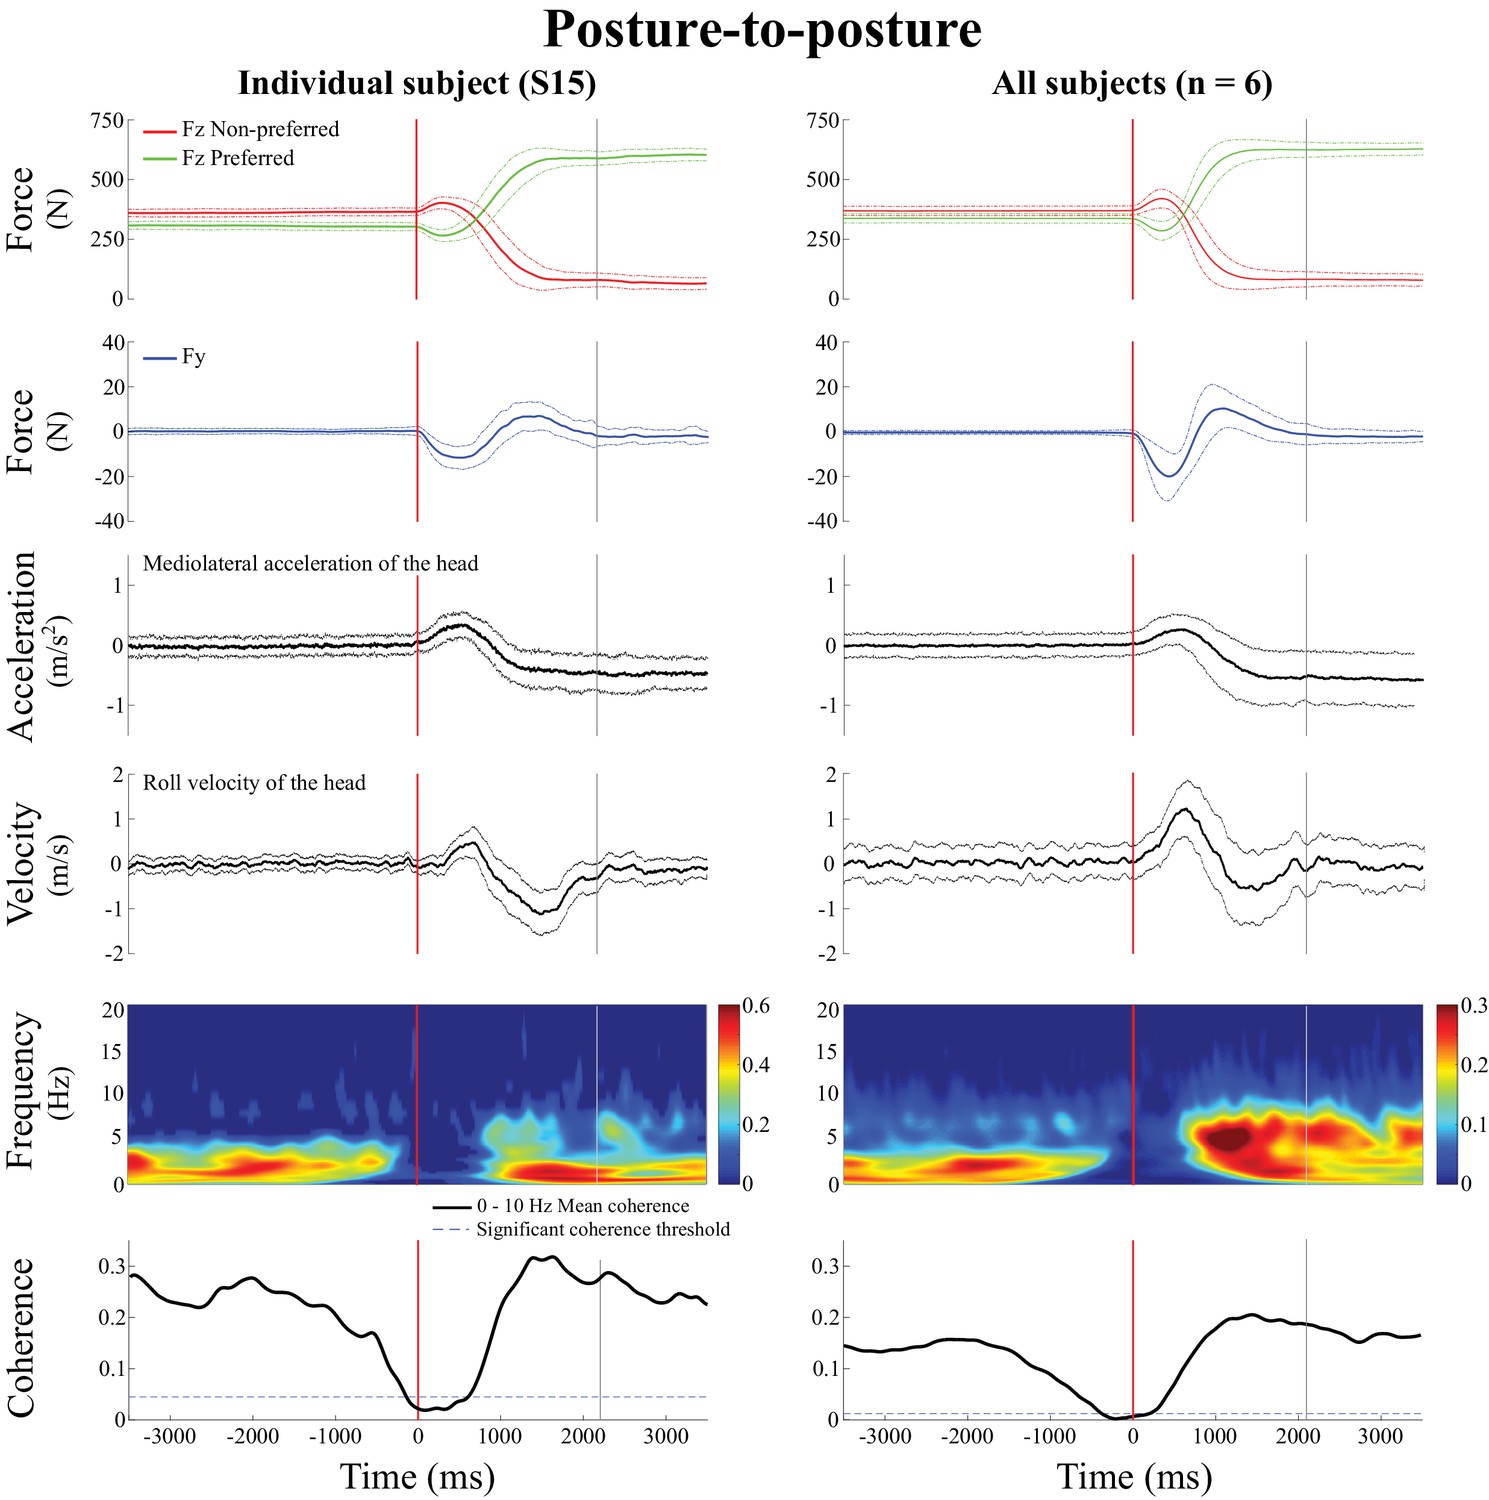
Behavioral signals and EVS-GRF time-frequency coherence during the posture-to-posture transition.
Data are presented in the non-normalized time segment, that is from 3.5 s preceding the transition onset to 3.5 s following it. In both panels, from top to bottom: vertical reaction forces (), shear force in the direction of the vestibular-induced perturbation (), lateral acceleration of the head, roll velocity of the head, time-frequency coherence and temporal evolution of the coherence averaged in the 0–10 Hz frequency bandwidth. The left panel presents the results from one representative subject (S15, n = 100 trials) and the right panel presents the results averaged across all six subjects (n = 600 trials). In both panels, the vertical red line shows the onset of the transition period and the vertical grey line shows the end of the transition period, solid lines represent the average value and dashed lines show one standard deviation. In the time-frequency-coherence graphs, all non-significant coherence values have been set to zero based on a 99% confidence limit (single subject = 0.045; pooled data = 0.008). Note that the scale of coherence level for all subjects is half the scale presented in coherence graphs for the individual subject.
Tables
Table 1
Summary of statistical tests used to compare coherence peak magnitude and its corresponding frequency for the two head positions during locomotion initiation (three time periods: quiet standing, transition and first step, top rows) and locomotion termination (three time periods: last step, transition and quiet standing, bottom rows).
Abbreviations used: HF = Head Forward; HL = Head Left; QS = Quiet Standing period; TR = transition period; FS = First Step period; LS = Last Step period; Peak = coherence peak magnitude; Freq = Frequency.
| MANOVA and post hoc tests results | ||||||||||||
|---|---|---|---|---|---|---|---|---|---|---|---|---|
| INITIATION | QS versus TR | QS versus FS | TR versus FS | |||||||||
| Period effect | Multi variate | Univariate | Multi variate | Univariate | Multi variate | Univariate | ||||||
| F | p-value | Peak | Freq | Peak | Freq | Peak | Freq | |||||
| HF | 14.15 | <0.001 | <0.001 | 0.009 | <0.001 | <0.001 | 0.012 | 0.015 | 0.073 | - | - | |
| HL | 103.76 | <0.001 | <0.001 | <0.001 | <0.001 | <0.001 | <0.001 | 0.011 | 0.947 | - | - | |
| TERMINATION | LS versus TR | LS versus QS | TR versus QS | |||||||||
| Period effect | Multi variate | Univariate | Multi variate | Univariate | Multi variate | Univariate | ||||||
| F | p-value | Peak | Freq | Peak | Freq | Peak | Freq | |||||
| HF | 21.20 | <0.001 | <0.001 | <0.001 | 0.228 | <0.001 | <0.001 | 0.215 | 0.857 | - | - | |
| HL | 30.23 | <0.001 | <0.001 | 0.001 | 0.007 | <0.001 | <0.001 | 0.007 | <0.001 | <0.001 | 0.148 | |
Additional files
-
Source code 1
MANOVA and Hotelling's t-square test in R.
- https://doi.org/10.7554/eLife.36123.010
-
Source code 2
Time frequency Coherence Analysis script in MATlab (Calls Morlet Wavelet Transform Functino and Total Coherence Function).
- https://doi.org/10.7554/eLife.36123.011
-
Source code 3
Morlet Wavelet Transform Function in MATlab.
- https://doi.org/10.7554/eLife.36123.012
-
Source code 4
Total Coherence Function in MATlab.
- https://doi.org/10.7554/eLife.36123.013
-
Transparent reporting form
- https://doi.org/10.7554/eLife.36123.014
Download links
A two-part list of links to download the article, or parts of the article, in various formats.
Downloads (link to download the article as PDF)
Open citations (links to open the citations from this article in various online reference manager services)
Cite this article (links to download the citations from this article in formats compatible with various reference manager tools)
Down regulation of vestibular balance stabilizing mechanisms to enable transition between motor states
eLife 7:e36123.
https://doi.org/10.7554/eLife.36123


