Cell-intrinsic and -extrinsic mechanisms promote cell-type-specific cytokinetic diversity
- Columbia University Medical Center, United States
- Université Paris Diderot, France
Figures
Figure 1 with 2 supplements
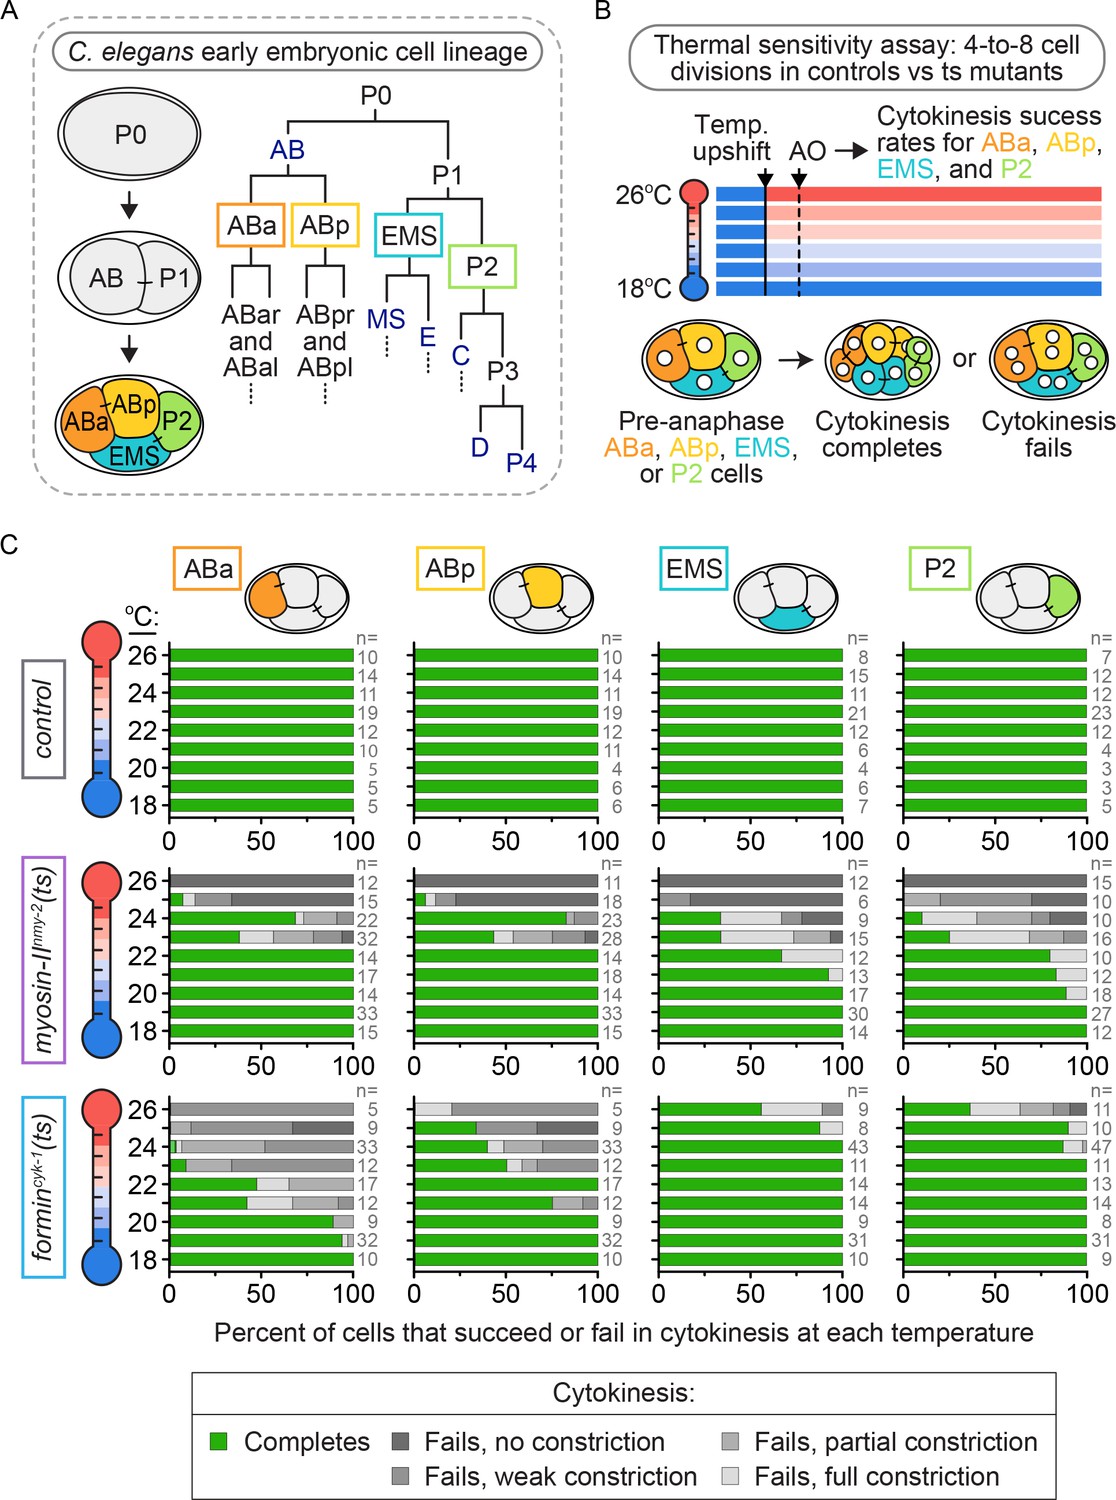
Cytokinetic variation with loss of forminCYK-1, but not myosin-IINMY-2, activity in individual blastomeres of the four-cell embryo.
(A) Lineage map showing the identity and division patterning that occurs during the early blastomere divisions in the C. elegans embryo. Founder cells AB, E, MS, C, D, and P4 are indicated in dark blue. (B) Schematic of the experimental protocol for the thermal sensitivity assay. Individual ts mutant (or control) four-cell embryos were upshifted from permissive temperature (16°C) to a higher temperature across a thermal range (18–26°C) prior to anaphase onset in each blastomere. (C) Graphs showing the cytokinetic outcome for control, myosin-IInmy-2(ts), and formincyk-1(ts) mutant embryos upshifted to specific temperatures prior to anaphase onset. AO = anaphase onset. The percent of cells exhibiting each cytokinetic phenotype at the indicated temperature is plotted for each cell type and genotype. n ≥ 81 for each cell type (detailed in Supplementary file 1).
Figure 1—figure supplement 1
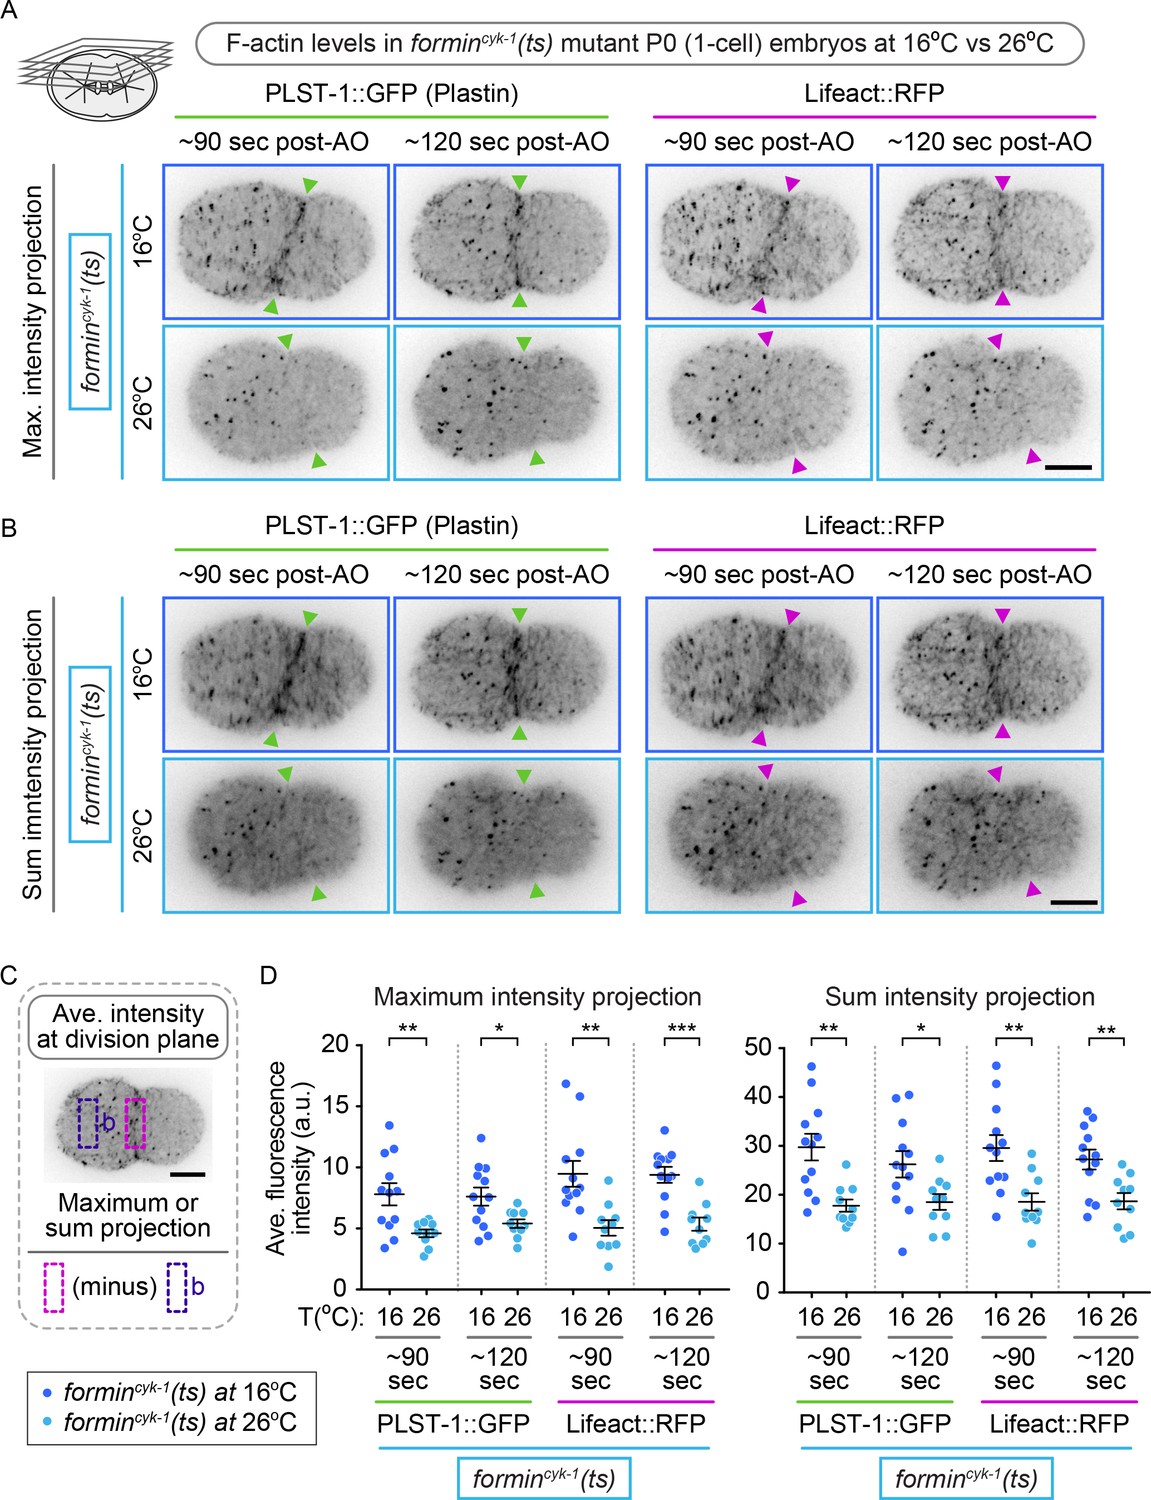
F-actin contractile ring assembly is disrupted in formincyk-1(ts) mutant embryos at restrictive temperature.
(A and B) PLST-1::GFP (left, green) and Lifeact::RFP (right, magenta) labeled F-actin on the cell cortex of the one-cell embryo (P0 cell) from formincyk-1(ts) mutant embryos at 16 and 26°C. Representative (A) maximum intensity projection and (B) sum intensity projection images showing contractile ring F-actin at 16°C but not at 26°C. Arrowheads indicate the division plane/site of initial furrowing. (C) Schematic showing how F-actin levels at the division plane were measured. (D) Graphs showing the average fluorescence intensity of PLST-1::GFP and Lifeact::RFP at the division plane during cytokinesis at the time of initial furrowing/membrane deformation and 30 s later in formincyk-1(ts) one-cell embryos at 16 and 26°C (right). In all cases, contractile ring F-actin levels are significantly reduced at 26°C, compared with at 16°C. Two-tailed t-test (Supplementary file 1); *p≤0.05; **p≤0.01; ***p≤0.001. Error bars, mean ± SEM; scale bar = 10 µm.
Figure 1—figure supplement 2
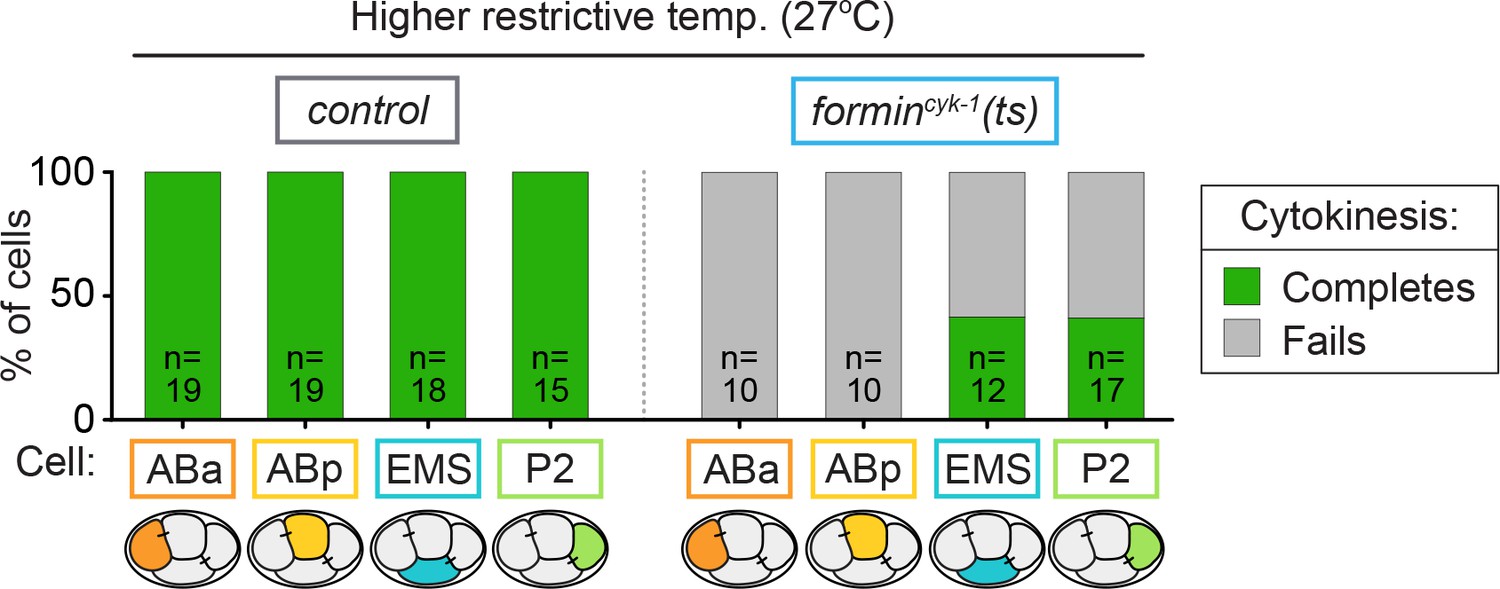
EMS and P2 can divide in the absence of forminCYK-1 activity.
Graph showing the frequency of successful cytokinesis for blastomeres in control and formincyk-1(ts) four-cell mutant embryos when upshifted to 27°C before anaphase onset. See also Supplementary file 1.
Figure 2 with 1 supplement
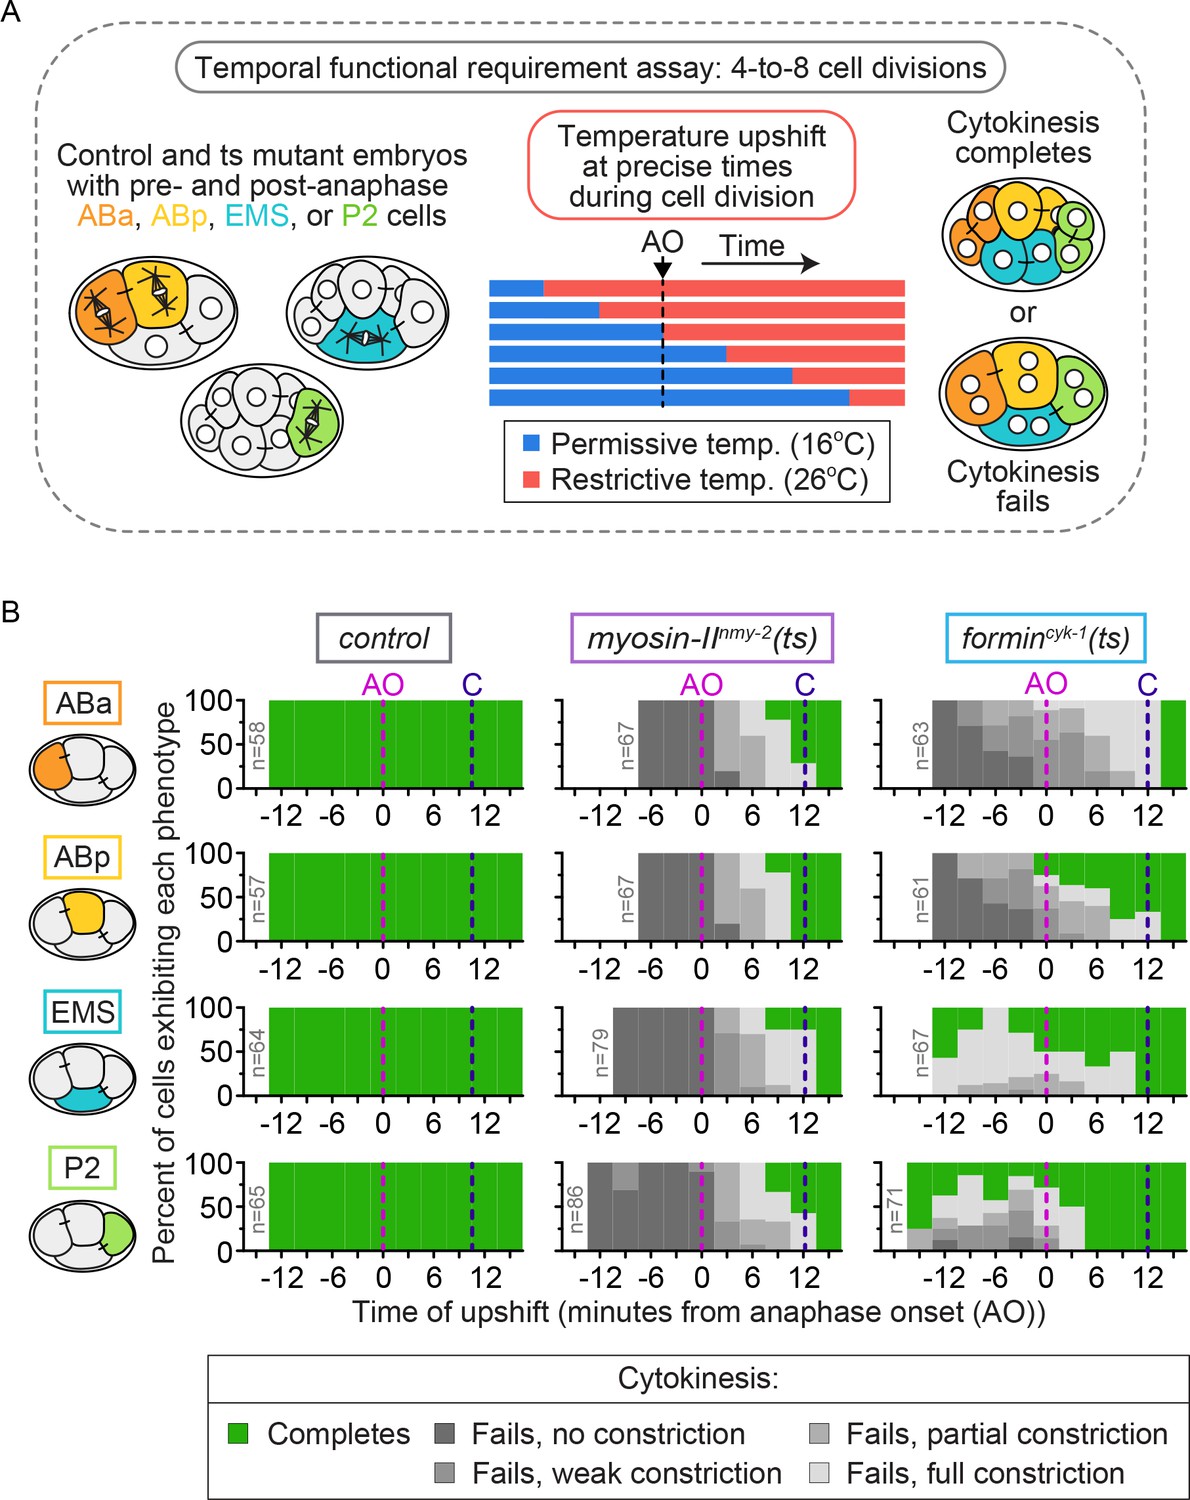
Cytokinetic variation in the temporal requirement for forminCYK-1, but not myosin IINMY-2, in individual blastomeres of the four-cell embryo.
(A) Schematic of the experimental protocol for the temporal functional requirement assay in which four-cell stage embryos were upshifted from permissive (16°C) to restrictive temperature (26°C) at defined time points relative to anaphase onset in each individual blastomere, then held at 26°C throughout cytokinesis. (B) Graphs showing the cytokinetic outcome for control, myosin-IInmy-2(ts), and formincyk-1(ts) mutant embryos upshifted from 16°C to 26°C at different times during cell division. The cytokinetic outcome of each cell is plotted as a percent of the total number of cells upshifted to 26°C at that time relative to anaphase onset. AO = anaphase onset (magenta dashed line); C = approximate time of contractile ring closure at 16°C (dark blue dashed line); n ≥ 57 for each cell type (see Supplementary file 1).
Figure 2—figure supplement 1
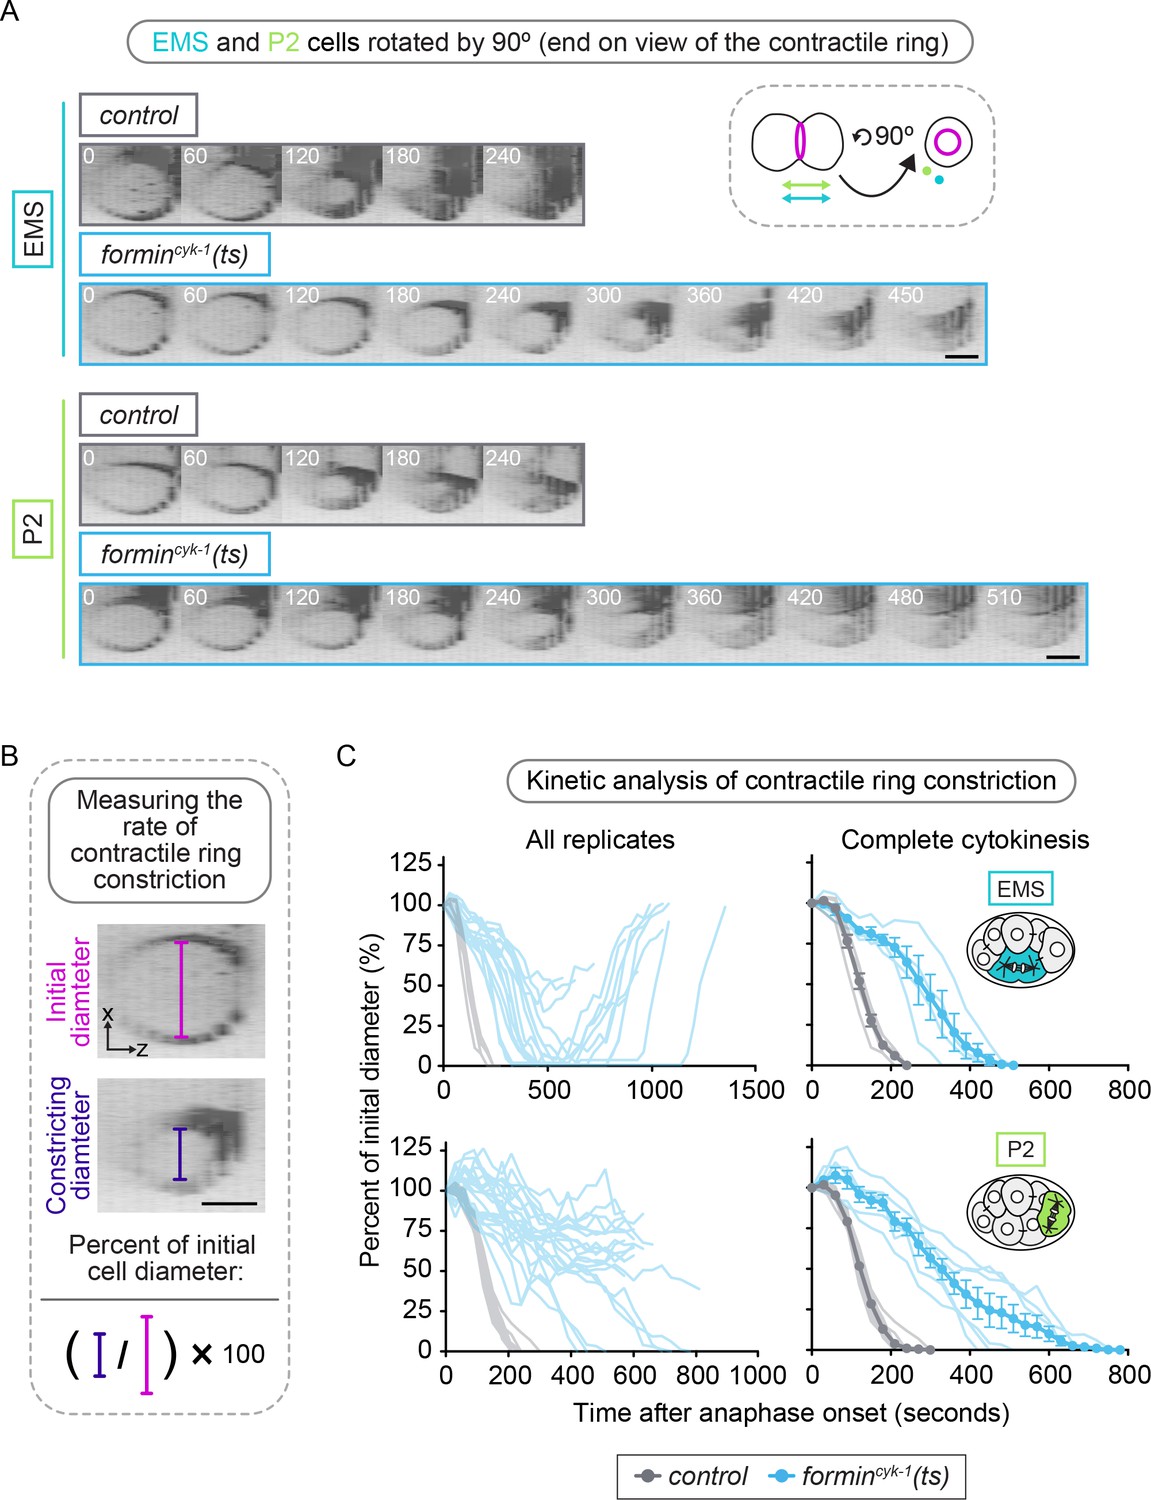
Loss of forminCYK-1 slows division in EMS and P2 cells.
(A) GFP::PH showing the plasma membrane during successful cell division in EMS and P2 cells from control and formincyk-1(ts) mutant embryos. 13 × 2.5 μm Z-sections were rotated 90° (see schematic) to show an X-Z projection of the division plane for each time point. White numbers = Time (sec) after anaphase onset. (B) Schematic showing measurement of contractile ring diameter and normalization relative to initial (metaphase) cell diameter. (C) Graphs showing contractile ring constriction over time for EMS and P2 cells in control and formincyk-1(ts) mutant embryos. All replicates are shown on the left. Cells that complete cytokinesis are shown on the right (individual replicates (thin lines); mean (thick lines)). EMS and P2 cells underwent contractile ring constriction more slowly in formincyk-1(ts) mutant embryos compared with in control embryos. Time 0 = last time point before anaphase onset; error bars, mean ± SEM; temperature, 16 or 26°C; scale bar = 10 µm. See also Supplementary file 1.
Figure 3 with 3 supplements
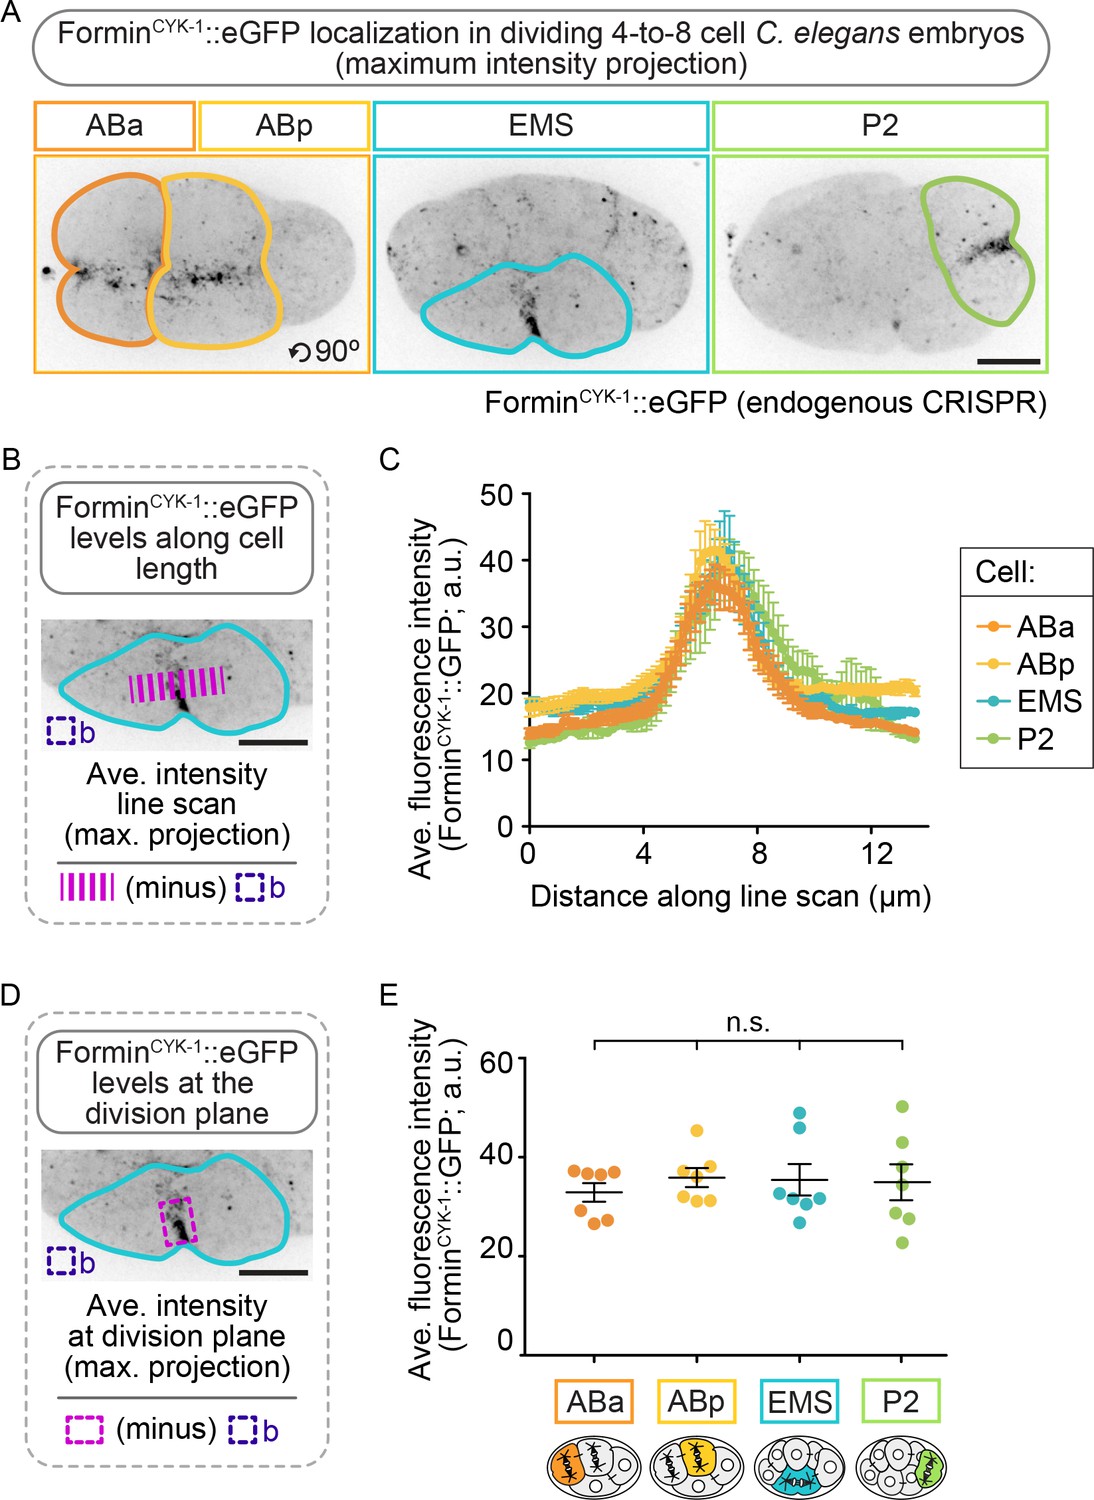
ForminCYK-1 localizes to the contractile ring at similar peak levels in the ABa, ABp, EMS and P2 cells.
(A) Representative maximum intensity projection images showing forminCYK-1::GFP localization at the division plane in ABa and ABp (left panel), EMS (center panel), and P2 (right panel). Images were acquired after observation of the onset of contractile ring constriction (initial furrowing). (B) Schematic showing how forminCYK-1::GFP levels were measured along a line scan across the division plane. (C) Graph showing all four cells show a local peak in the level of forminCYK-1::GFP at the division plane. (D) Schematic showing how forminCYK-1::GFP levels at the division plane were measured. (E) Graph showing the average fluorescence maximum intensity of forminCYK-1::GFP at the contractile ring is not significantly different between ABa, ABp, EMS, or P2. Two-tailed t-test (Supplementary file 1); n.s., no significance, p>0.05. Error bars, mean ± SEM; temperature, 21°C; scale bar = 10 µm.
Figure 3—figure supplement 1
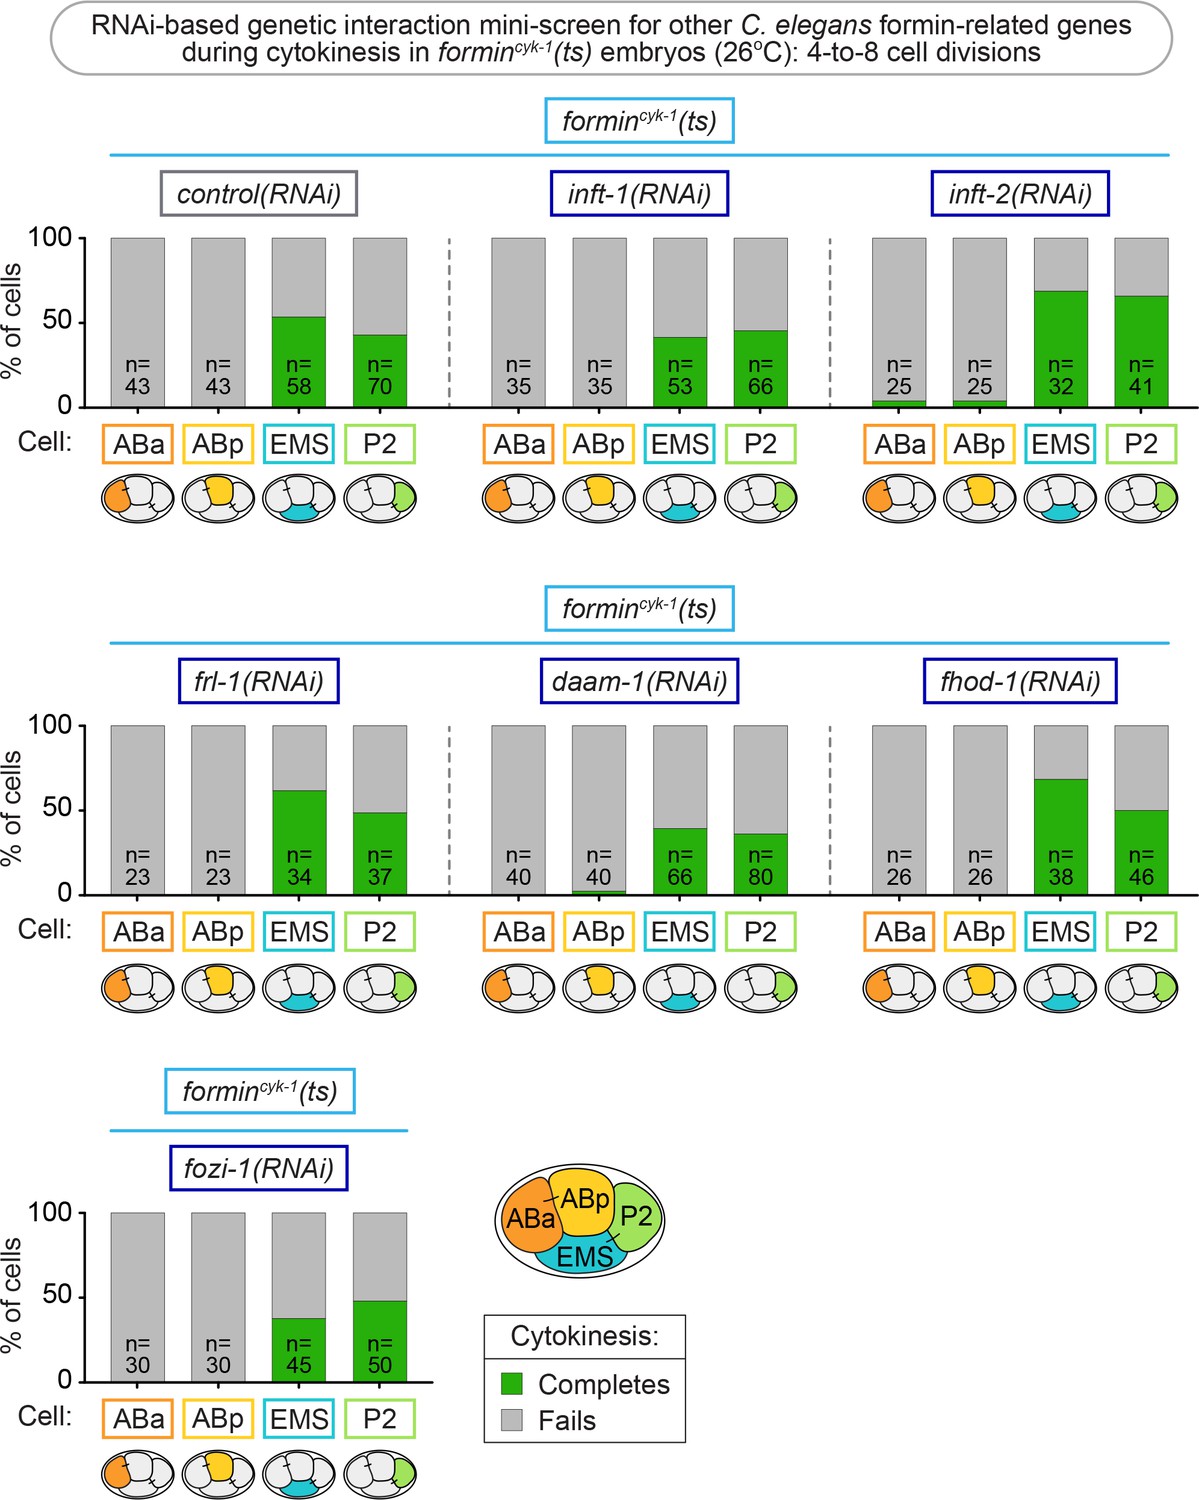
Depletion of other formin-related genes does not prevent cytokinesis in EMS and P2 cells following forminCYK-1 inhibition.
Graphs showing that RNAi-mediated depletion of six other C. elegans formin-related genes (inft-1, inft-2, frl-1, daam-1, fhod-1, and fozi-1) in formincyk-1(ts) mutant embryos did not prevent EMS and P2 cells from dividing at 26°C. In formincyk-1(ts) embryos from each individual formin RNAi treatment, the cytokinesis outcome for each cell type was compared with the cytokinesis outcome from the same cell type in formincyk-1(ts) embryos treated with control(RNAi), using Fisher’s exact text to examine the significance of any depletion. In all cases, the p-values were greater than 0.05, except for the P2 cell in inft-2(RNAi); formincyk-1(ts) embryos which showed increased cytokinesis success with a p-value of 0.0299 relative to in control(RNAi); formincyk-1(ts) embryos. However, using a Bonferroni correction to control for multiple comparisons adjusts alpha to 0.05/6 (or ~0.0083), suggesting this result is not significant. See also Supplementary file 1.
Figure 3—figure supplement 2
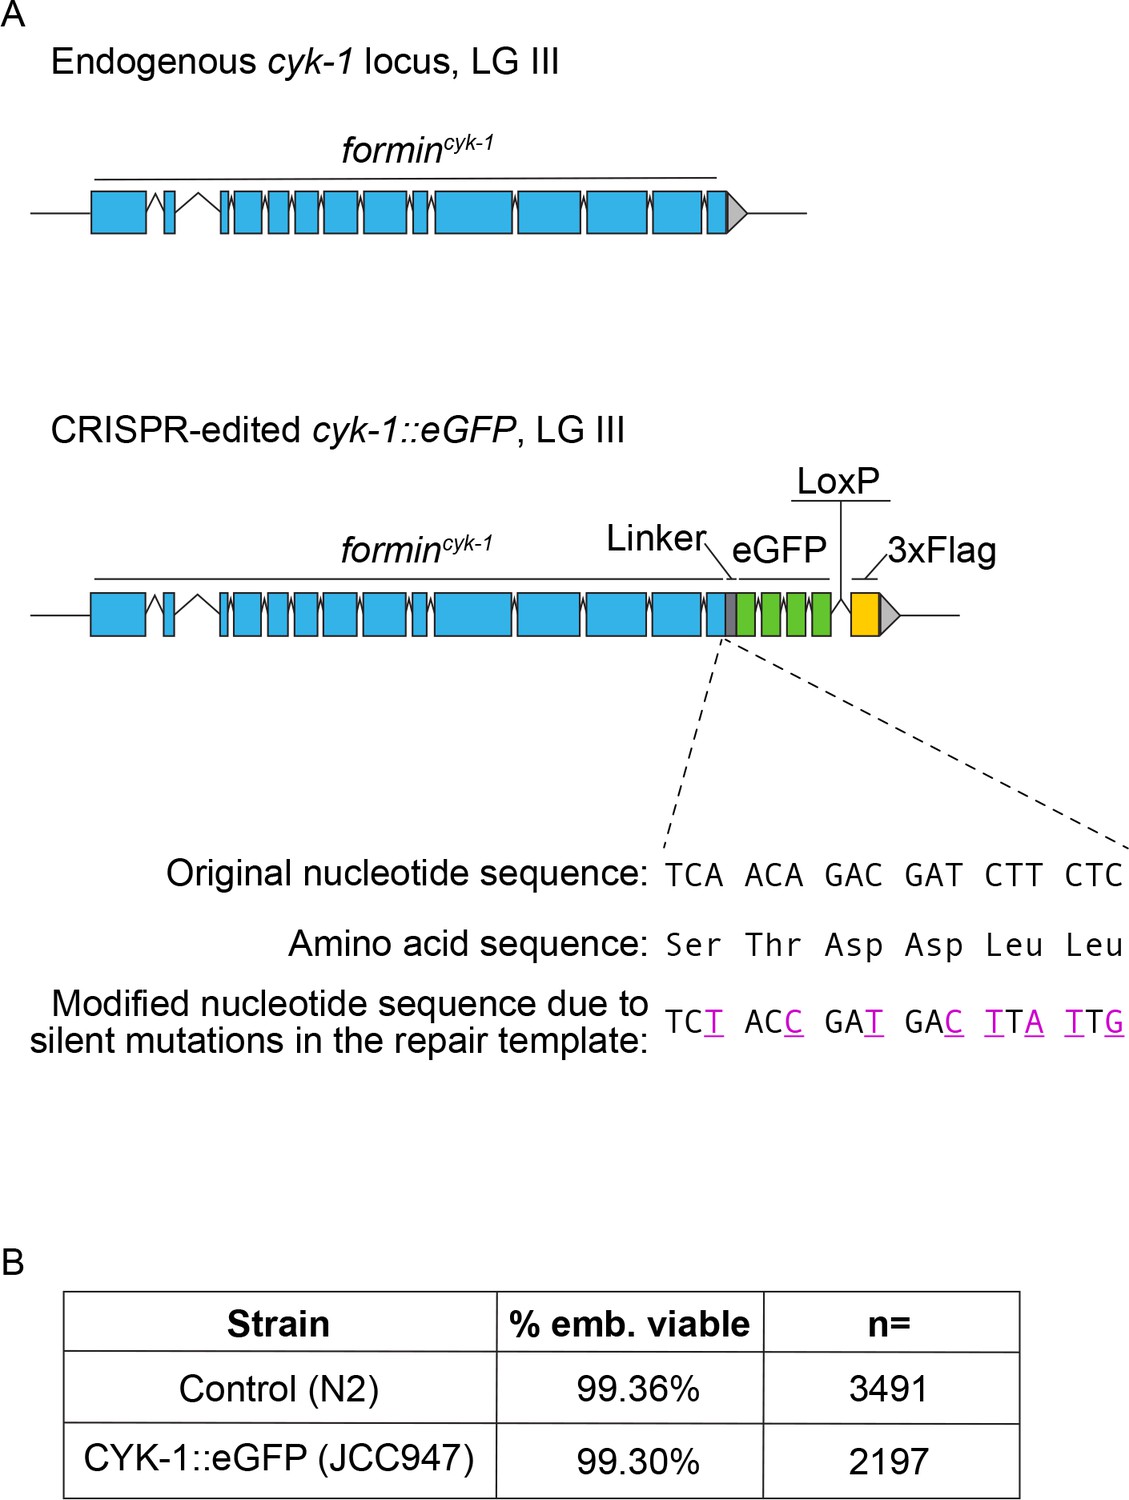
Generation of tagged forminCYK-1::eGFP at the endogenous locus.
(A) Schematic of the cyk-1 (formincyk−1) locus, and the CRISPR modified version with the sequence for eGFP inserted at the C-terminus of forminCYK-1. (B) The eGFP tag on forminCYK-1 does not cause embryonic lethality (relative to N2 controls). The progeny of at least 10 worms were scored for each genotype. n = number of progeny scored.
Figure 3—figure supplement 3
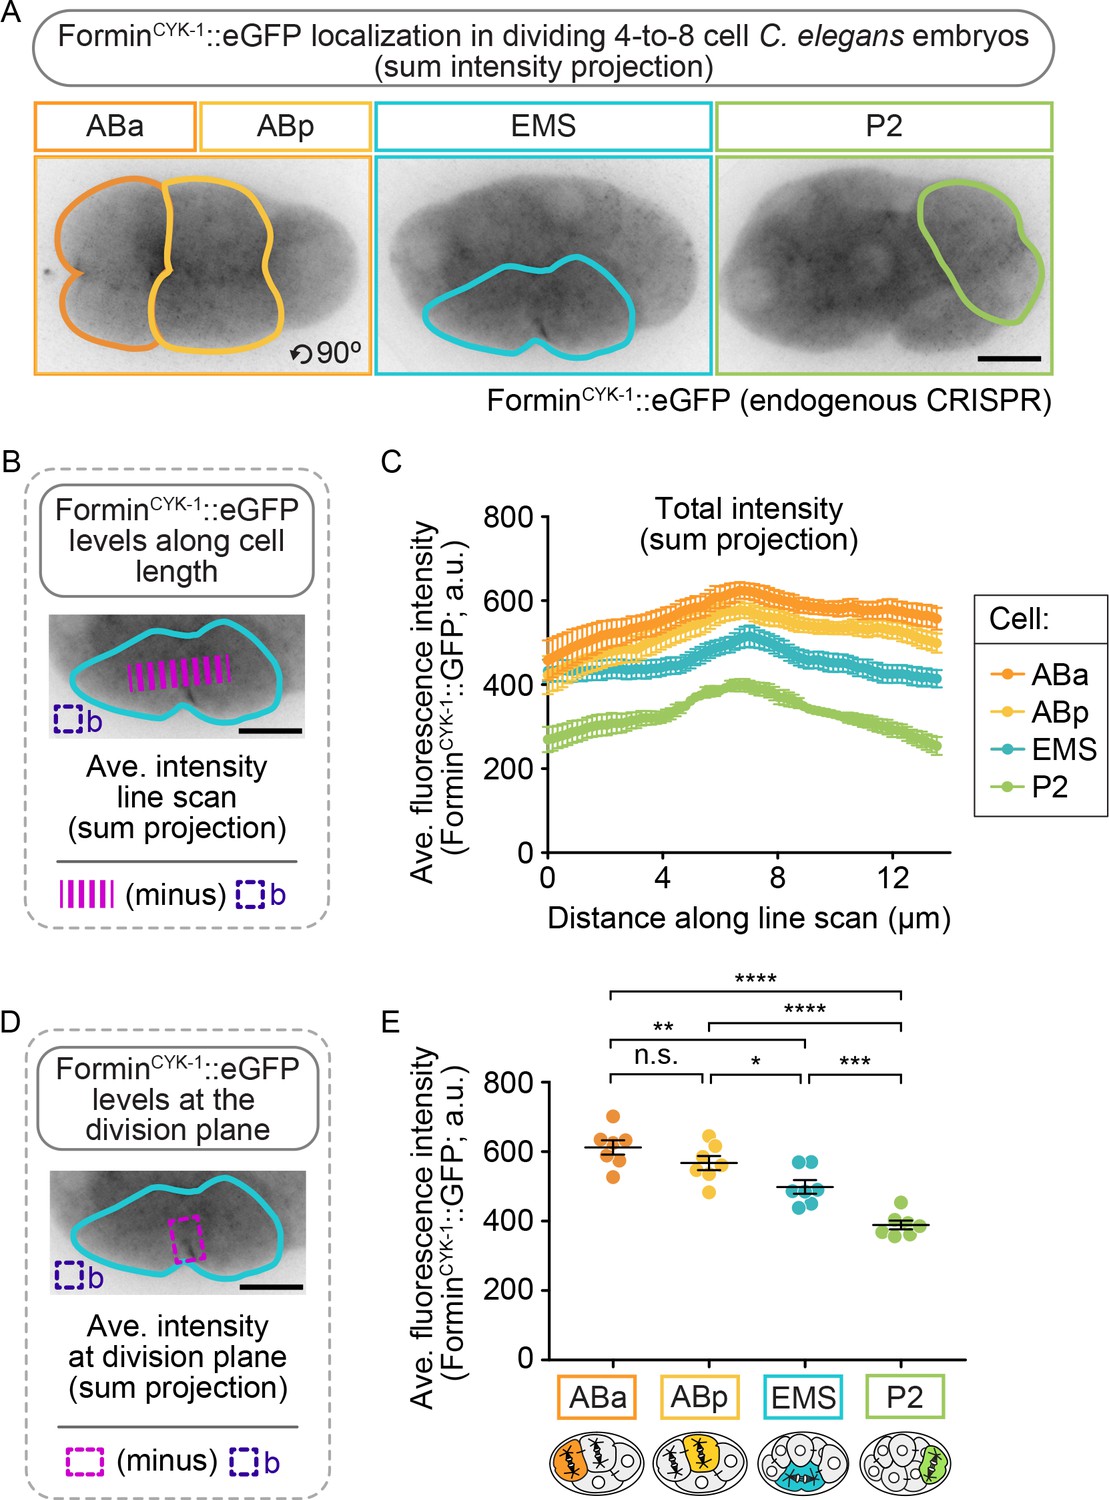
Sum projection analysis of forminCYK-1::GFP localization during cytokinesis in the ABa, ABp, EMS and P2 cells.
(A) Representative sum intensity projection images showing the localization and total levels forminCYK-1::GFP at the division plane in ABa and ABp (left panel), EMS (center panel), and P2 (right panel). Images were acquired after observation of the onset of contractile ring constriction (initial furrowing). (B) Schematic showing how forminCYK-1::GFP levels were measured along a line scan across the division plane. (C) Graph showing all four cells show a local peak of intensity of forminCYK-1::GFP at the division plane in the sum projection, and no increase is observed in EMS or P2 relative to in ABa/ABp. However, as expected, the sum intensity signal scales roughly with cell volume, with approximately equal levels in ABa and ABp, lower levels in EMS, and the lowest total levels in P2. (D) Schematic showing how forminCYK-1::GFP levels at the division plane were measured. (E) Graph showing the average summed fluorescence intensity of forminCYK-1::GFP at the division plane is not significantly different in ABa compared to ABp, but is significantly lower in both EMS and P2; and thus roughly scales with cell volume, as expected. Two-tailed t-test (Supplementary file 1); n.s., no significance, p>0.05; *p≤0.05; **p≤0.01; ***p≤0.001; ****p≤0.0001. Error bars, mean ± SEM; temperature, 21°C; scale bar = 10 µm.
Figure 4 with 3 supplements
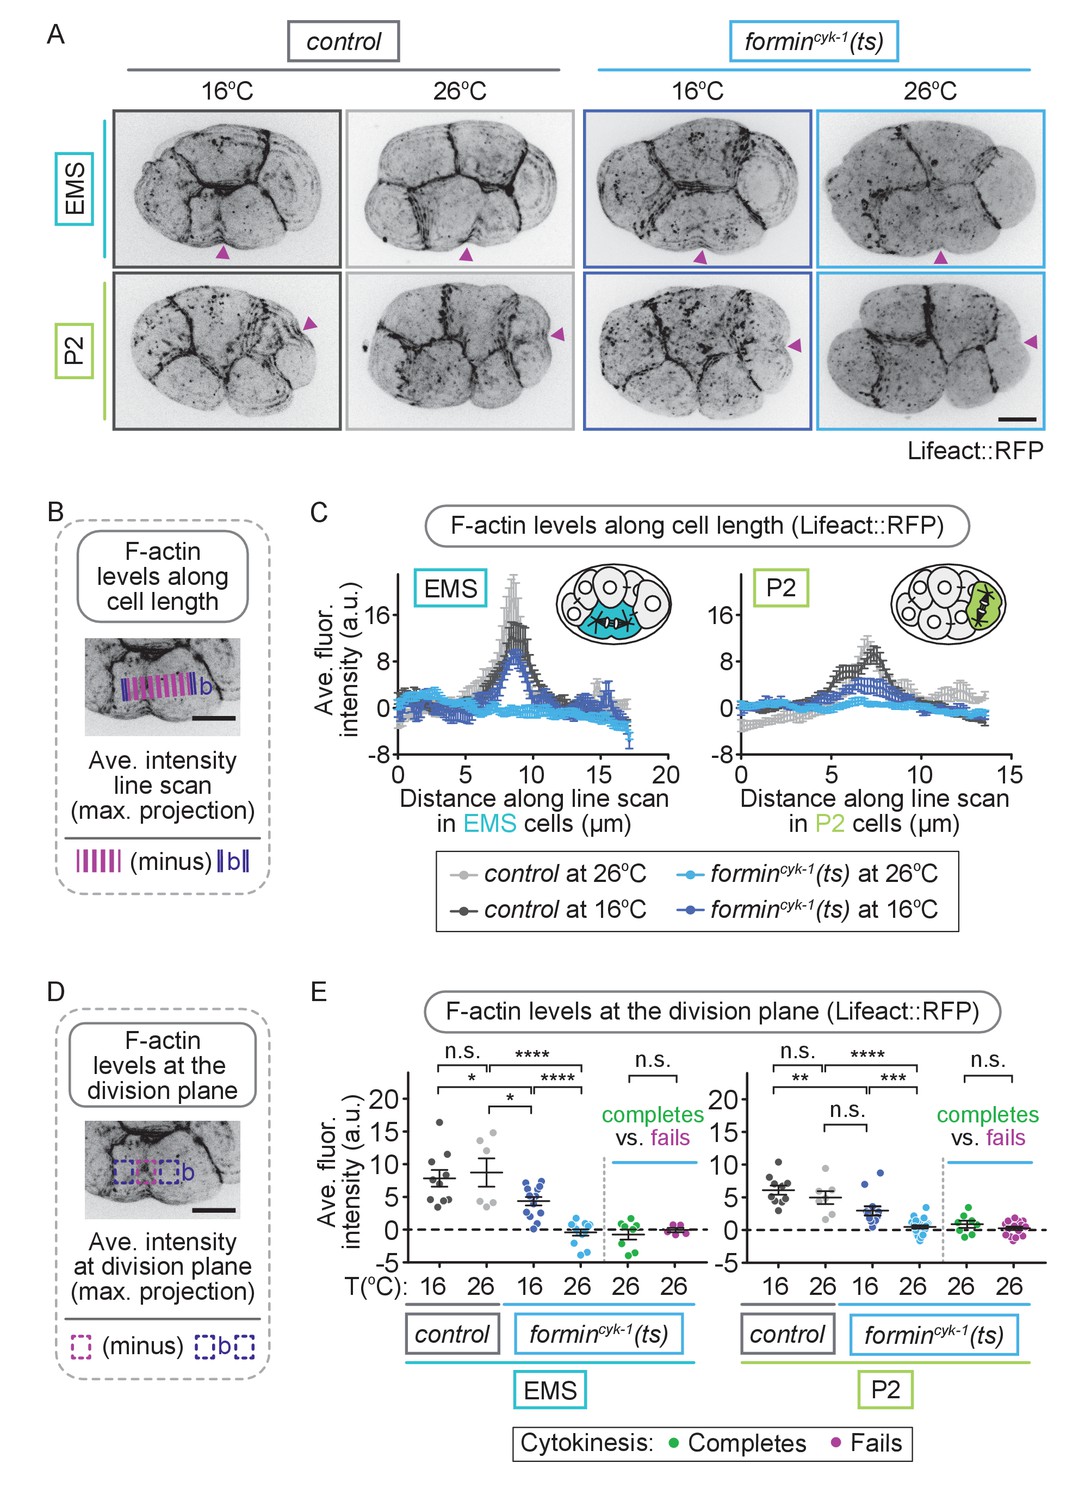
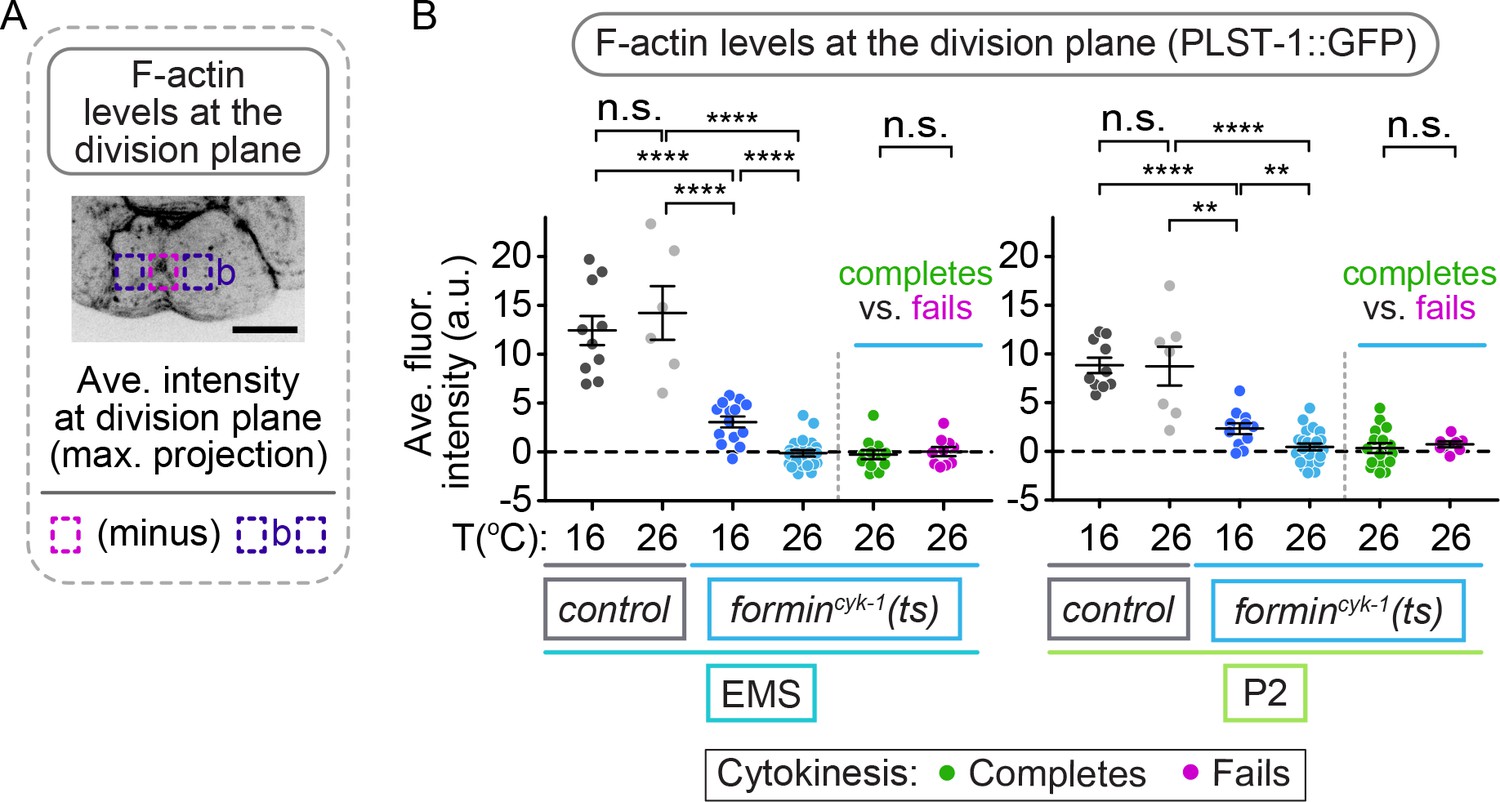
EMS and P2 cells can divide in the absence of a robust F-actin contractile ring.
(A) Representative images showing Lifeact::RFP-labeled contractile ring F-actin can be seen in EMS and P2 cells in control embryos at 16 and 26°C and in formincyk-1(ts) embryos at 16°C, but not in formincyk-1(ts) embryos at 26°C. Arrowheads (magenta) indicate the division plane/site of initial furrowing. (B) Schematic showing how F-actin levels were measured along a line scan across the division plane in EMS and P2 cells. Images were acquired after observation of the onset of contractile ring constriction (initial furrowing). (C) Graphs showing line scans across EMS and P2 cells have a local peak in Lifeact::RFP-labeled F-actin at the division plane in control embryos at 16 and 26°C and formincyk-1(ts) embryos at 16°C, but not in formincyk-1(ts) embryos at 26°C. (D) Schematic showing how F-actin levels at the division plane were measured in EMS and P2 cells. Images were acquired after observation of the onset of contractile ring constriction (initial furrowing). (E) Graphs showing the average fluorescence intensity of Lifeact::RFP at the division plane in EMS and P2 cells is significantly decreased in formincyk-1(ts) embryos at 26°C, compared to at 16°C, or compared to in control embryos at 16 or 26°C. There was no significant difference between the average maximum fluorescence intensity of Lifeact::RFP at the division plane in EMS and P2 cells in formincyk-1(ts) embryos at 26°C that successfully complete cytokinesis versus in those that fail to divide. Two-tailed t-test (SupplementaryfFile 1); n.s., no significance, p>0.05; *p≤0.05; **p≤0.01; ****p≤0.0001. Error bars, mean ± SEM, scale bar = 10 µm.
Figure 4—figure supplement 1
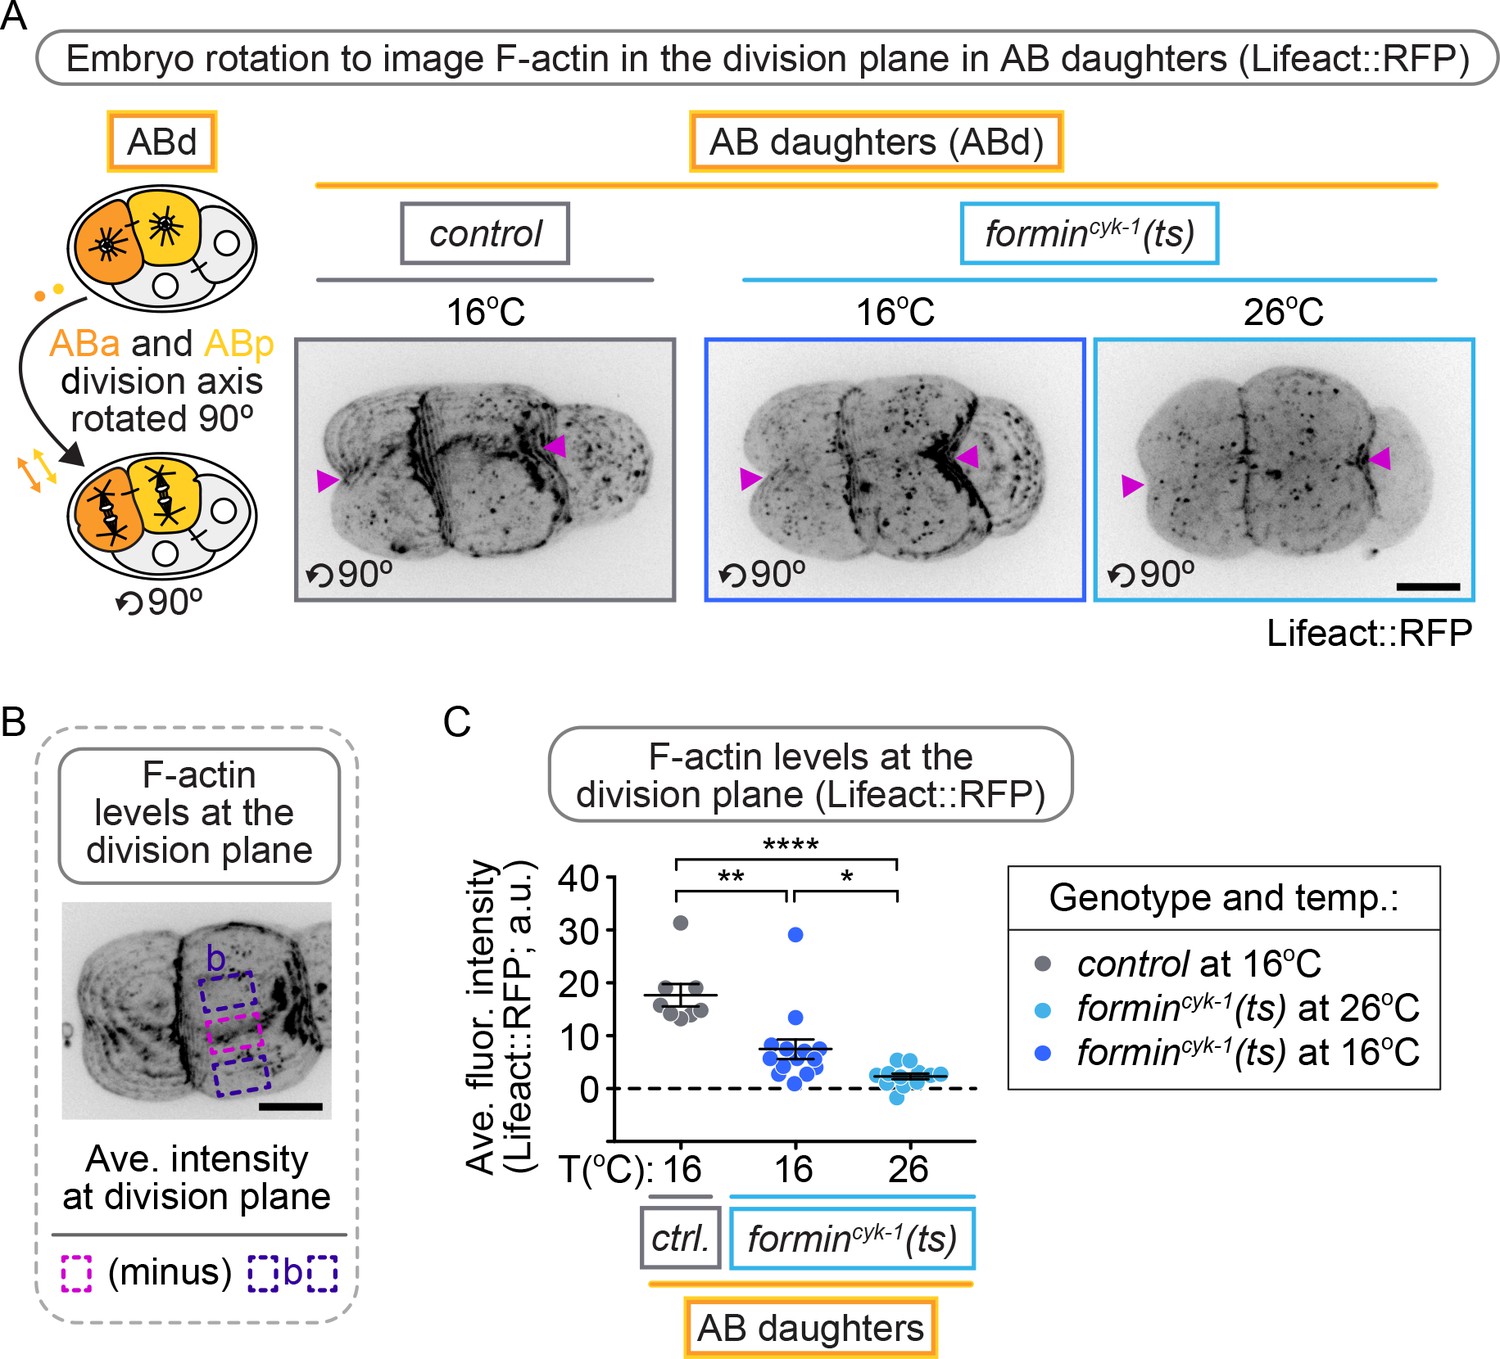
AB daughter cells fail to divide in the absence of a robust F-actin contractile ring.
(A) Representative images showing rotated, ‘belly-up’ oriented embryos, to enhance imaging of the division plane in ABa and ABp cells (collectively AB daughters, ABd). Lifeact::RFP-labeled F-actin in the contractile ring can be observed at the division plane in Abd cells in control embryos at 16°C and in formincyk-1(ts) embryos at 16°C, but not in formincyk-1(ts) embryos at 26°C. Arrowheads indicate the division plane/site of initial furrowing. (B) Schematic showing how F-actin levels were measured along a line scan across the division plane in ABd cells just after the the onset of equatorial membrane deformation (initial furrowing). (C) Graph showing the average fluorescence intensity of Lifeact::RFP at the division plane in ABd cells is significantly decreased in formincyk-1(ts) embryos at 26°C, compared to in control embryos or in formincyk-1(ts) embryos at 16°C. Two-tailed t-test (Supplementary file 1); *p≤0.05; **p≤0.01; ****p≤0.0001. Error bars, mean ± SEM; scale bar = 10 µm.
Figure 4—figure supplement 2
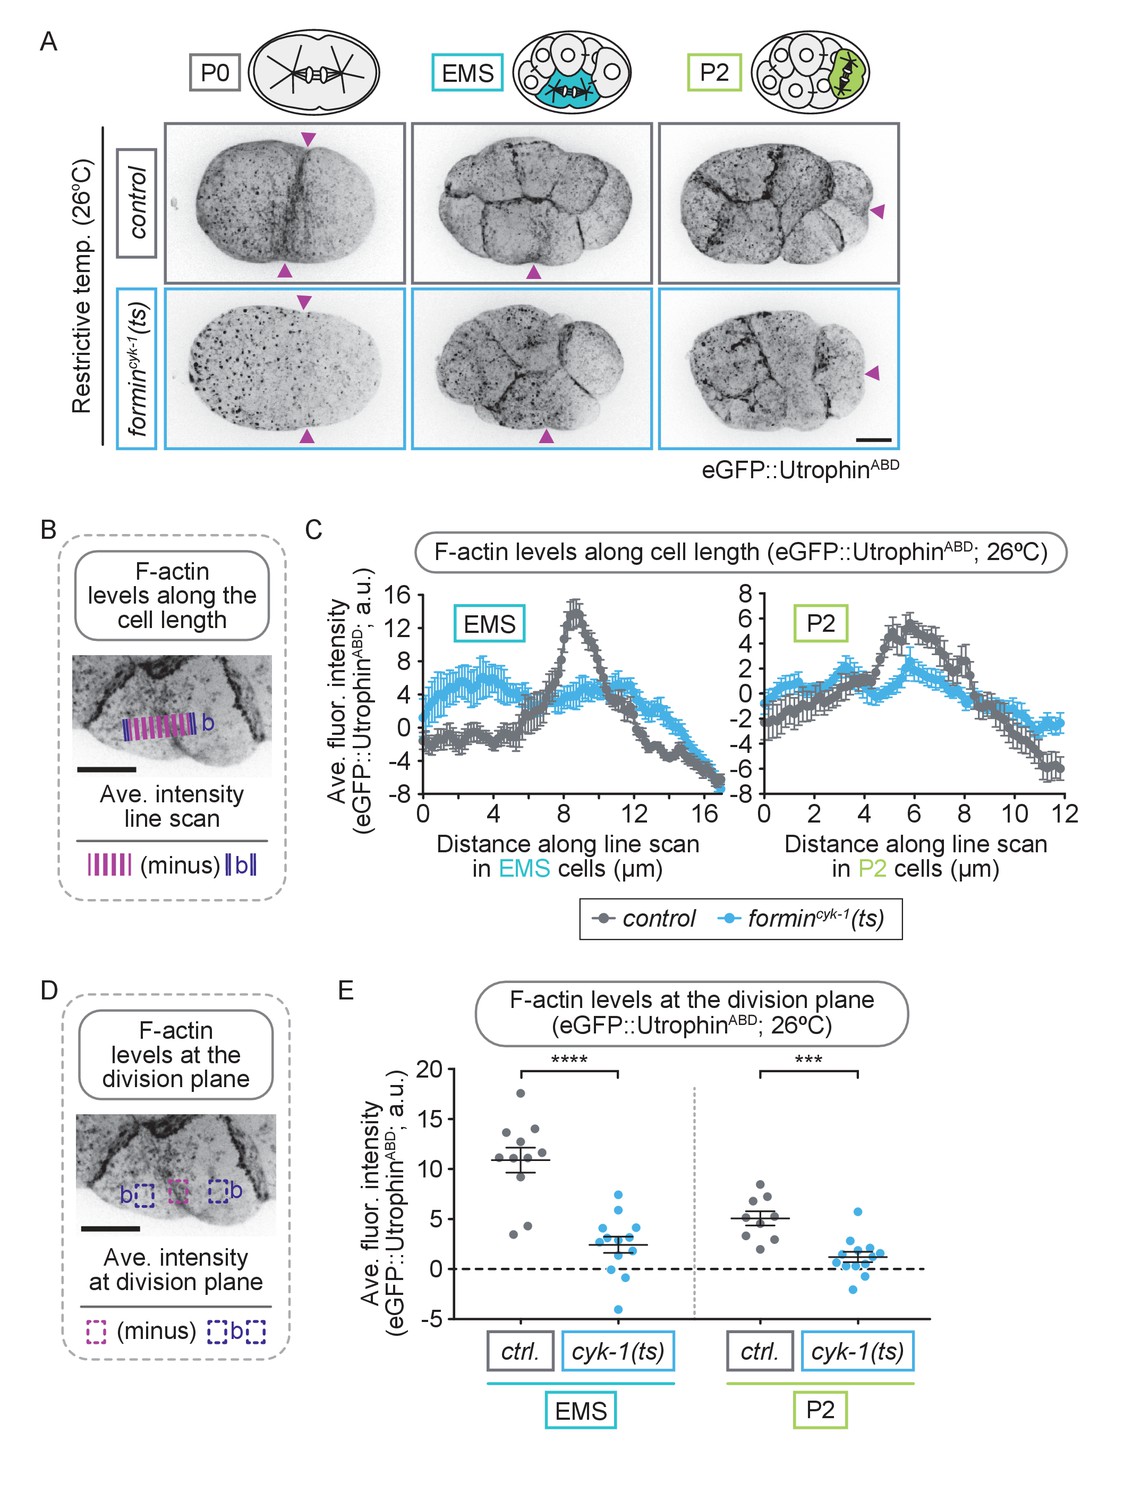
EMS and P2 cells can divide in the absence of a robust F-actin contractile ring.
(A) Representative images showing GFP::UtrophinABD-labeled F-actin can be observed in P0 (one cell, left panels), EMS (center panels), and P2 (right panels) cells in control embryos, but not in formincyk-1(ts) mutant embryos, at 26°C. Arrowheads indicate the division plane/site of initial furrowing. (B) Schematic showing how F-actin levels were measured along a line scan across the division plane in EMS and P2 cells. Images were acquired 20 s after the onset of contractile ring constriction (initial furrowing). (C) Graphs showing line scans in EMS and P2 cells in control, but not in formincyk-1(ts) embryos, showed a peak in GFP::UtrophinABD-labeled F-actin in the division plane at 26°C. (D) Schematic showing how F-actin levels at the division plane were measured in EMS and P2 cells. (E) Graph showing the average fluorescence intensity of GFP::UtrophinABD at the division plane in EMS and P2 cells is significantly decreased in in formincyk-1(ts) embryos at 26°C compared to at 16°C, or compared to in control embryos at 26°C. Two-tailed t-test (Supplementary file 1); ***p≤0.001. Error bars, mean ± SEM; scale bar = 10 µm.
Figure 4—figure supplement 3
EMS and P2 cells can divide in the absence of a robust F-actin contractile ring.
(A) Schematic showing how F-actin levels at the division plane were measured in EMS and P2 cells using a maximum intensity projection. Images were acquired after observation of the onset of contractile ring constriction (initial furrowing). (B) Graphs showing the average fluorescence intensity of PLST-1::GFP at the division plane in EMS and P2 cells was significantly decreased in formincyk-1(ts) embryos at 26°C, compared to at 16°C, or compared to in control embryos at 16 or 26°C. There was no significant difference between the average fluorescence intensity of PLST-1::GFP at the division plane in EMS and P2 cells in formincyk-1(ts) embryos at 26°C that successfully complete cytokinesis versus in those that fail to divide. Two-tailed t-test (Supplementary file 1); n.s., no significance, p>0.05; **p≤0.001; ****p≤0.0001. Error bars, mean ± SEM. Scale bar = 10 µm.
Figure 5
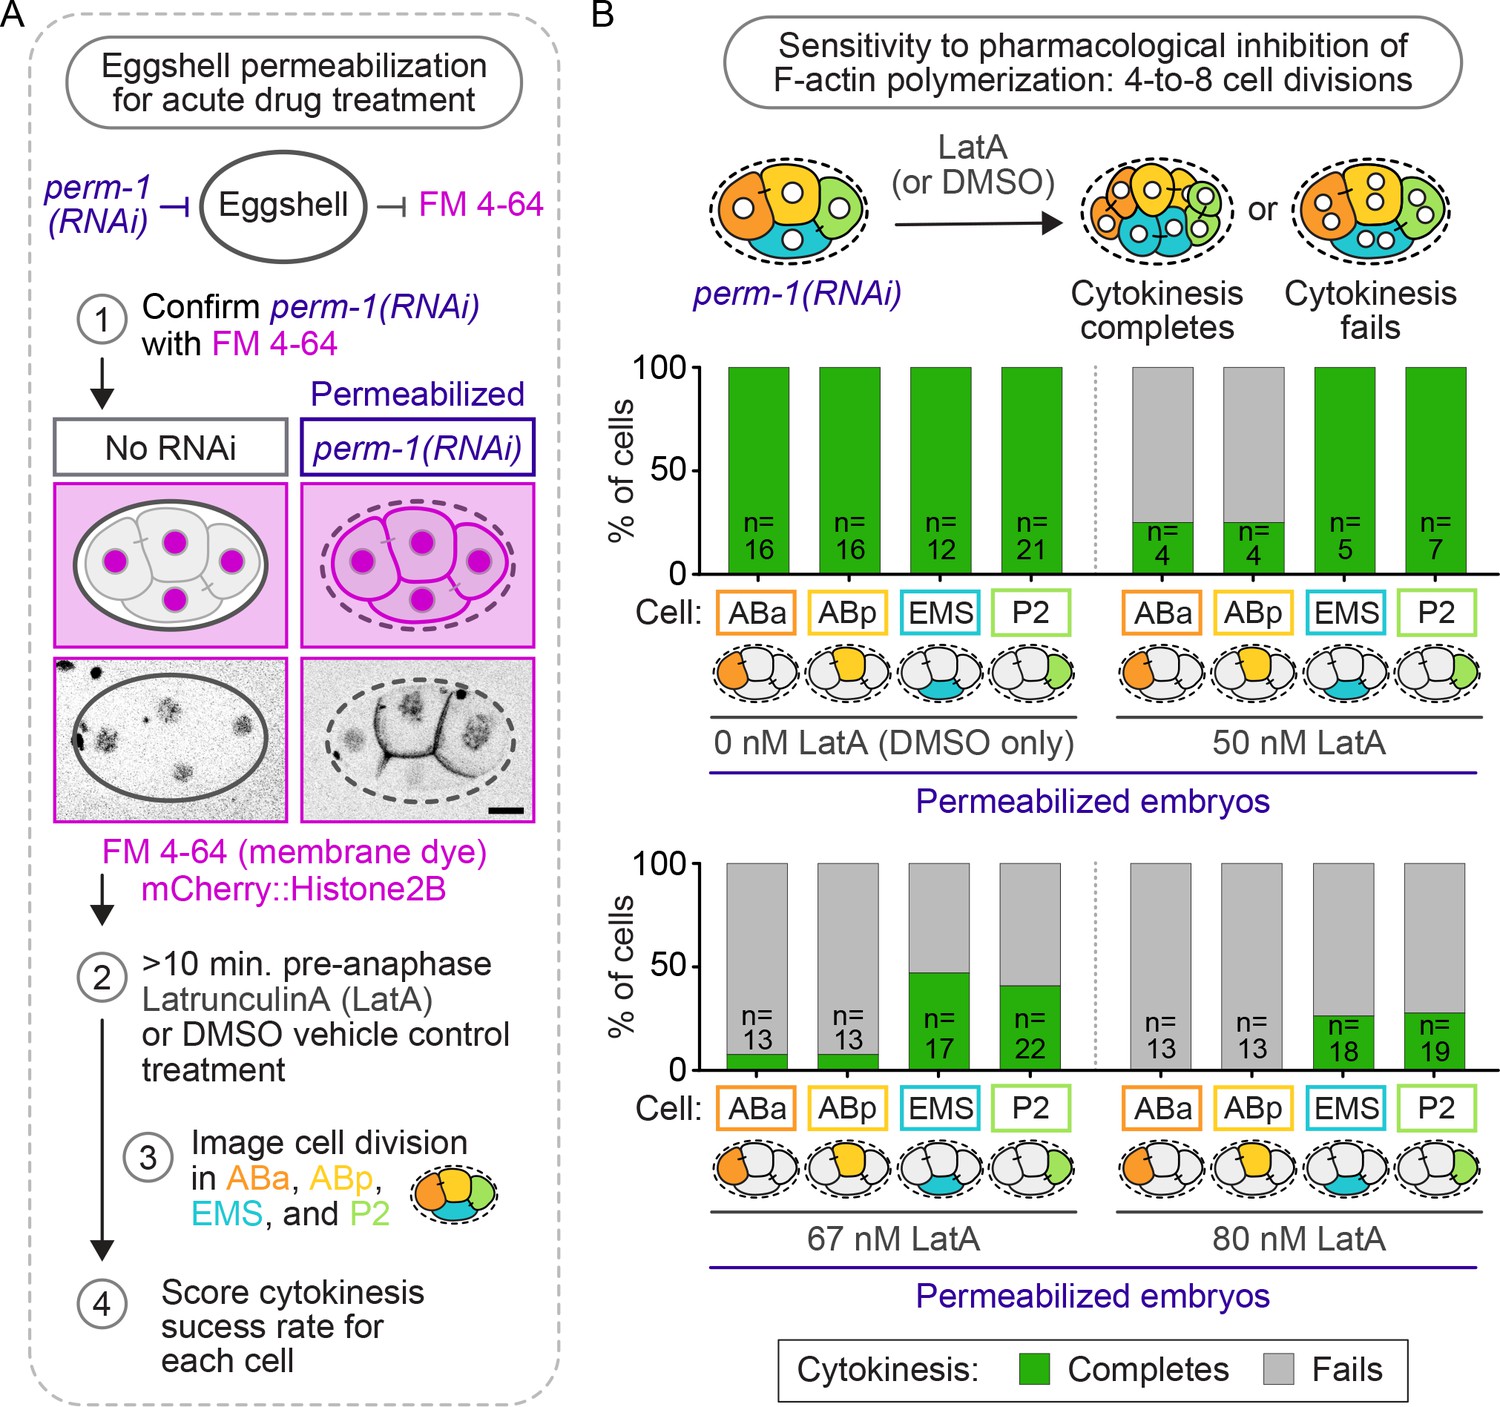
Cytokinesis in EMS and P2 is more resistant to pharmacological inhibition of F-actin assembly with LatA than in ABa and ABp.
(A) Schematic of the experimental protocol for eggshell permeabilization with perm-1(RNAi), confirmation of eggshell permeabilization with FM 4–64, and subsequent Latrunculin A (LatA) treatment of permeabilized control, non-ts, embryos. Scale bar = 10 µm. (B) Schematic of the experimental protocol and graphs showing the cytokinetic outcome for each cell in permeabilized four-cell embryos treated with 0, 50, 67, and 80 nM LatA. Temperature, 21°C. See also Supplementary file 1.
Figure 6 with 1 supplement
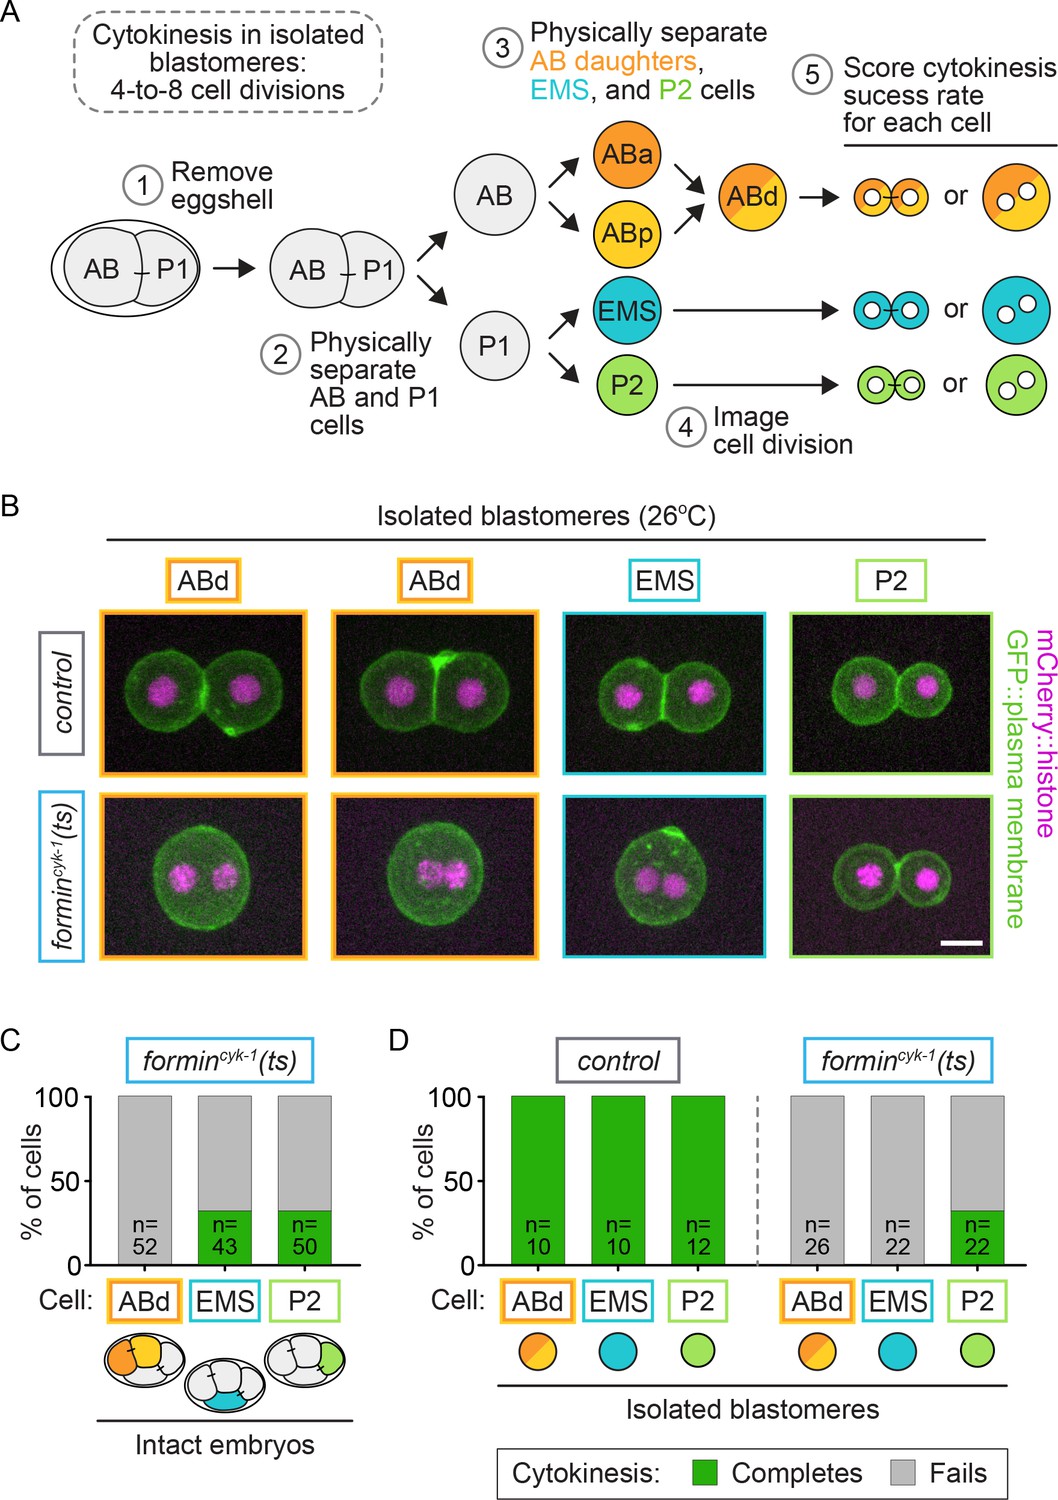
Cell-intrinsic and extrinsic regulation contribute to cytokinesis.
(A) Experimental protocol describing the microdissection, isolation, and separation of individual blastomeres. Steps 1–3 are performed at the permissive temperature (16°C) to ensure the first two-cell divisions occur normally. (B) Representative images showing the cytokinetic outcome of cells isolated from control and formincyk-1(ts) embryos. Cells that divide successfully are seen as two mononucleate daughter cells. Cells that fail in cytokinesis are seen as single binucleate cells. (C) Graph showing the frequency of successful cytokinesis in individual blastomeres in intact formincyk-1(ts) embryos upshifted prior to anaphase onset. Note: this data is sub-sampled from the temporally defined upshift experiments shown in Figure 2B, pooling only those cells upshifted before anaphase onset. ABa and ABp cells have been combined as AB daughters (ABd). (D) Graph showing the frequency of successful cytokinesis for blastomeres isolated from control and formincyk-1(ts) embryos. Temperature, 26°C; scale bar = 10 µm. See also Supplementary file 1.
Figure 6—figure supplement 1
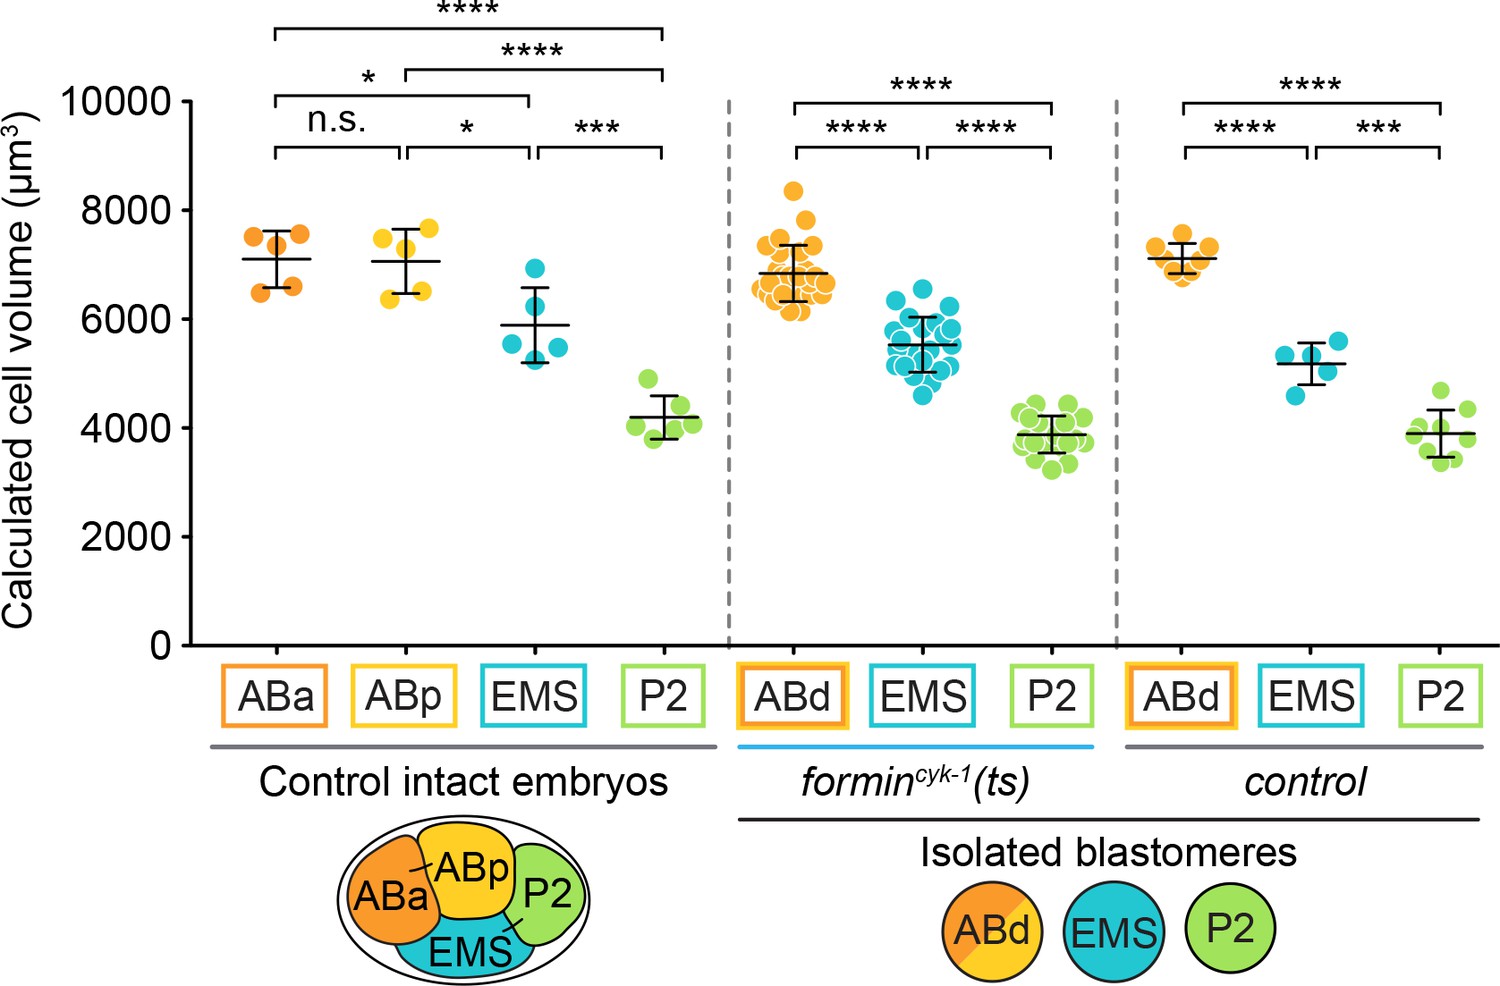
Blastomere size in intact four-cell embryos and following isolation.
Graphs showing the calculated volume of individual blastomeres, both in intact embryos and following microdissection and blastomere isolation. Cell volume is the same in intact embryos and isolated blastomeres. ABd cells are larger than EMS cells which are larger than P2 cells. Mean ± SD; two-tailed t-test (Supplementary file 1); n.s., no significance, p>0.05; *p≤0.05; ***p≤0.001; ****p≤0.0001.
Figure 7
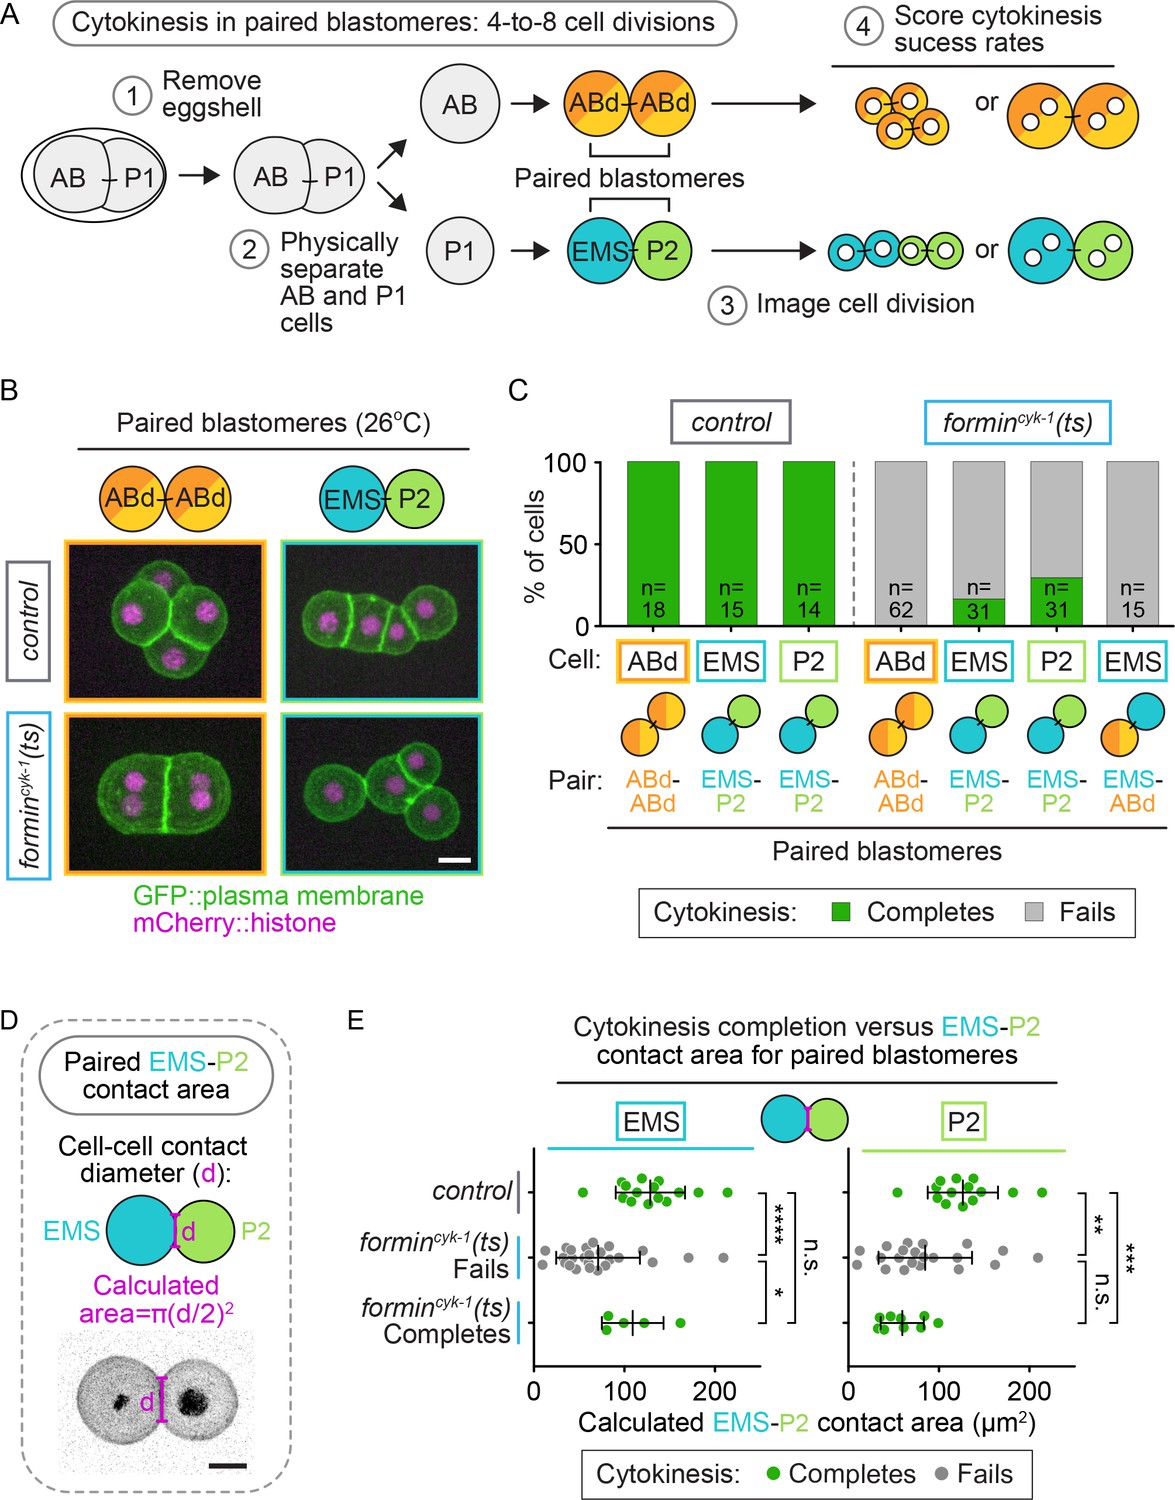
Cell-extrinsic regulation of cytokinesis in EMS depends on direct contact with its neighbor cell, P2.
(A) Schematic of the experimental protocol for the isolation of paired-blastomere doublets. Blastomeres are maintained at the permissive temperature (16°C) during preparation of cell doublets (steps 1 and 2) to ensure the first two-cell divisions occur normally. (B) Representative images showing the cytokinetic outcome of paired blastomeres from control and formincyk-1(ts) embryos. (C) Graph showing the frequency of successful cytokinesis for paired blastomeres isolated from control and formincyk-1(ts) embryos. (D) Schematic showing the measurement of cell-cell contact diameter to calculate the cell-cell contact area between cells in EMS-P2 doublets (E). Graphs showing the calculated cell-contact area between EMS and P2 cells in paired doublets isolated from control and formincyk-1(ts) embryos. Mean ± SD; two-tailed Mann-Whitney test (Supplementary file 1); n.s., no significance, p>0.05; *p≤0.05; **p≤0.01; ***p≤0.001; ****p≤0.0001. Temperature, 26°C; scale bar = 10 µm.
Figure 8 with 2 supplements

SrcSRC-1 mediated signaling from P2 provides the cell-extrinsic regulation of cytokinesis in EMS.
(A) Schematic showing EMS and P2 cell-cell signaling during EMS cell fate specification. (B) Schematic showing how the EMS spindle angle was calculated. (C) Graph showing the EMS spindle angle (as a read-out for proper EMS cell fate specification) for different EMS (left) and P2 (right) cells within paired-blastomere doublets from control or formincyk-1(ts) embryos that successfully complete or fail in cytokinesis. Note: the doublets analyzed here are the same as those used in Figure 7. (D) Graph showing the frequency of successful cytokinesis for each cell type in intact formincyk-1(ts); control(RNAi) and formincyk-1(ts); Srcsrc-1(RNAi) embryos. Error bars, mean ± SD. Two tailed Mann-Whitney test (Supplementary file 1); n.s., no significance, p>0.05; *p≤0.05; **p≤0.01; ****p≤0.0001. (F) Model showing the role extrinsic and intrinsic factors in EMS and P2 cytokinesis. Temperature, 26°C; scale bar = 10 µm.
Figure 8—figure supplement 1

Disrupting SrcSRC-1 does not cause cytokinesis failure in control embryos.
(A) Graph showing the frequency of successful cytokinesis for each cell type in intact control embryos after control(RNAi) or Srcsrc-1(RNAi). Temperature, 26°C. See also Supplementary file 1.
Figure 8—figure supplement 2

Disrupting cellular polarity causes division failure in all cell types.
(A) Graph showing the frequency of successful cytokinesis for each cell type in intact formincyk-1(ts), control(RNAi) and formincyk-1(ts), par-6(RNAi) embryos. PAR-6 is a protein essential for anterior posterior cell polarity in the one-cell C. elegans embryo (Watts et al., 1996). Temperature, 26°C. See also Supplementary file 1.
Videos
Video 1
Control, myosin-IInmy-2(ts), and formincyk-1(ts) mutant embryos undergoing cytokinesis at the restrictive temperature.
The three formincyk-1(ts) mutant embryos show phenotypic variation in the cytokinesis outcome for EMS and P2, as is observed at this temperature. 60 s per frame; temperature, 26°C. Green, GFP::PH (plasma membrane); magenta, mCherry::histone2B; scale bar = 10 µm.
Video 2
Isolated blastomeres from a control embryo.
60 s per frame; temperature, 26°C. Green, GFP::plasma membrane; magenta, mCherry::histone2B; scale bar = 10 µm.
Video 3
Isolated blastomeres from a formincyk-1(ts) embryo.
60 s per frame; temperature, 26°C. Green, GFP::plasma membrane; magenta, mCherry::histone2B; scale bar = 10 µm.
Video 4
Isolated ABd-ABd (left) and EMS-P2 (right) doublets from control (top) and formincyk-1(ts) (bottom) embryos.
60 s per frame; temperature, 26°C. Green, GFP::plasma membrane; magenta, mCherry::histone2B; scale bar = 10 µm.
Video 5
Isolated EMS-P2 doublets from formincyk-1(ts) embryos, showing combinations of cytokinesis phenotypes.
60 s per frame; temperature, 26°C; green, GFP::plasma membrane; magenta, mCherry::histone; scale bar = 10 µm.
Additional files
-
Supplementary file 1
A summary of the data analysis included in this manuscript, including number of experimental replicates and all statistical tests.
- https://doi.org/10.7554/eLife.36204.028
-
Supplementary file 2
A list of worm strains and RNAi constructs used in this study.
- https://doi.org/10.7554/eLife.36204.029
-
Transparent reporting form
- https://doi.org/10.7554/eLife.36204.030
Download links
A two-part list of links to download the article, or parts of the article, in various formats.
Downloads (link to download the article as PDF)
Open citations (links to open the citations from this article in various online reference manager services)
Cite this article (links to download the citations from this article in formats compatible with various reference manager tools)
Cell-intrinsic and -extrinsic mechanisms promote cell-type-specific cytokinetic diversity
eLife 7:e36204.
https://doi.org/10.7554/eLife.36204


