Re-evaluation of neuronal P2X7 expression using novel mouse models and a P2X7-specific nanobody
- Jiong Zhang

- Robin Kopp
- Antje Grosche
- Björn Rissiek
- Santina Bruzzone
- Tobias Engel
- Tina Jooss
- Anna Krautloher
- Stefanie Schuster
- Tim Magnus
- Christine Stadelmann
- Swetlana Sirko
- Friedrich Koch-Nolte
- Volker Eulenburg
- Annette Nicke
- Max Planck Institute for Experimental Medicine, Germany
- Ludwig-Maximilians-Universität München, Germany
- University of Regensburg, Germany
- University Hospital Hamburg-Eppendorf, Germany
- University of Genova, Italy
- Royal College of Surgeons in Ireland, Ireland
- University Erlangen-Nürnberg, Germany
- University Medical Center, Germany
- Helmholtz Center Munich, German Research Center for Environmental Health (GmbH), Germany
- University of Leipzig, Germany
Figures
Figure 1 with 2 supplements
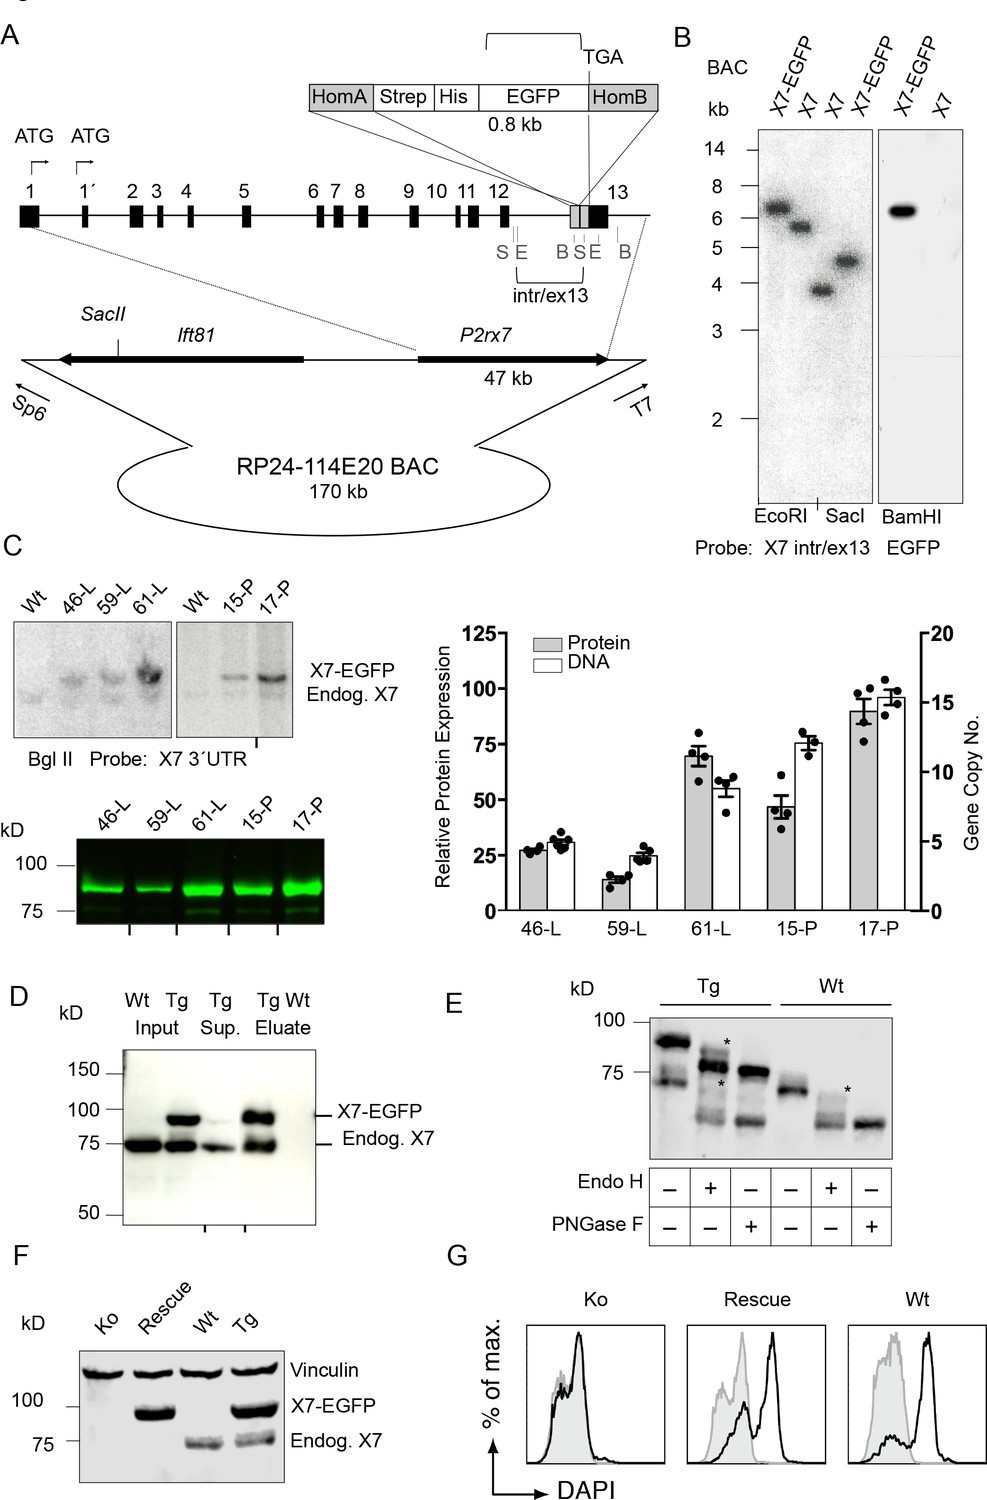
Generation and validation of BAC transgenic P2X7-EGFP mice.
(A) Scheme of the BAC clone containing the full-length P2rx7 plus about 103 kb (5´) and 10 kb (3´) flanking sequences. A Strep-His-EGFP cassette (0.8 kb) flanked by two homology arms (grey boxes) was inserted directly upstream of the stop codon into exon 13 of the P2rx7. Before pronuclear microinjection, the BAC-P2X7-EGFP construct was linearized at a unique SacII site. B, E, and S indicate BamHI, EcoRI, and SacI restriction sites, respectively. The probes used for Southern blot analysis are indicated as brackets. (B) Southern blot analysis of BAC DNA using these probes (X7 intr/ex13, EGFP) confirmed homologous recombination and correct integration of the Strep-His-EGFP cassette into the BAC. (C) Comparison of copy number and protein expression in different BAC transgenic P2X7-EGFP lines. Representative SDS-PAGE (direct EGFP fluorescence, 60 μg total protein/lane) and Southern blot data are shown (transgenic P2rx7, 5277 bp; endogenous P2rx7, 4561 bp). Black marks at the bottom indicate where replicates were excised from the figures. Data from 3–6 individual mice are represented. (D) Co-purification of endogenous P2X7 subunits with transgenic receptors. Protein complexes were purified under non-denaturing conditions via Ni-NTA agarose from dodecylmaltoside (0.5%) brain extracts (line 59). A representative result of n > 5 experiments with different lines is shown. P2X7-specific antibody: Synaptic Systems (E) Deglycosylation analysis of endogenous and transgenic P2X7. Protein extracts from spinal cord of wt and line 17 transgenic mice were treated with endoglycosidases as indicated and P2X7 protein was detected by immunoblotting (P2X7-specific antibody, Synaptic Systems). Asterisks indicate Endo H-resistant complex glycosylated protein. A representative result of n > 5 experiments with different organs is shown. (F) P2X7-EGFP (line 17) was crossed into P2rx7-/- background. Western blot analysis with an P2X7-specific antibody (Synaptic Systems) confirmed successful deletion of the endogenous P2X7 in this rescue mouse. (G) FACS analysis of microglia showing rescue of ATP-induced (1 mM) DAPI uptake by the P2X7 rescue (line 59) microglia in comparison to wt and P2rx7-/- microglia. A representative result from n = 3 animals is shown.
Figure 1—figure supplement 1
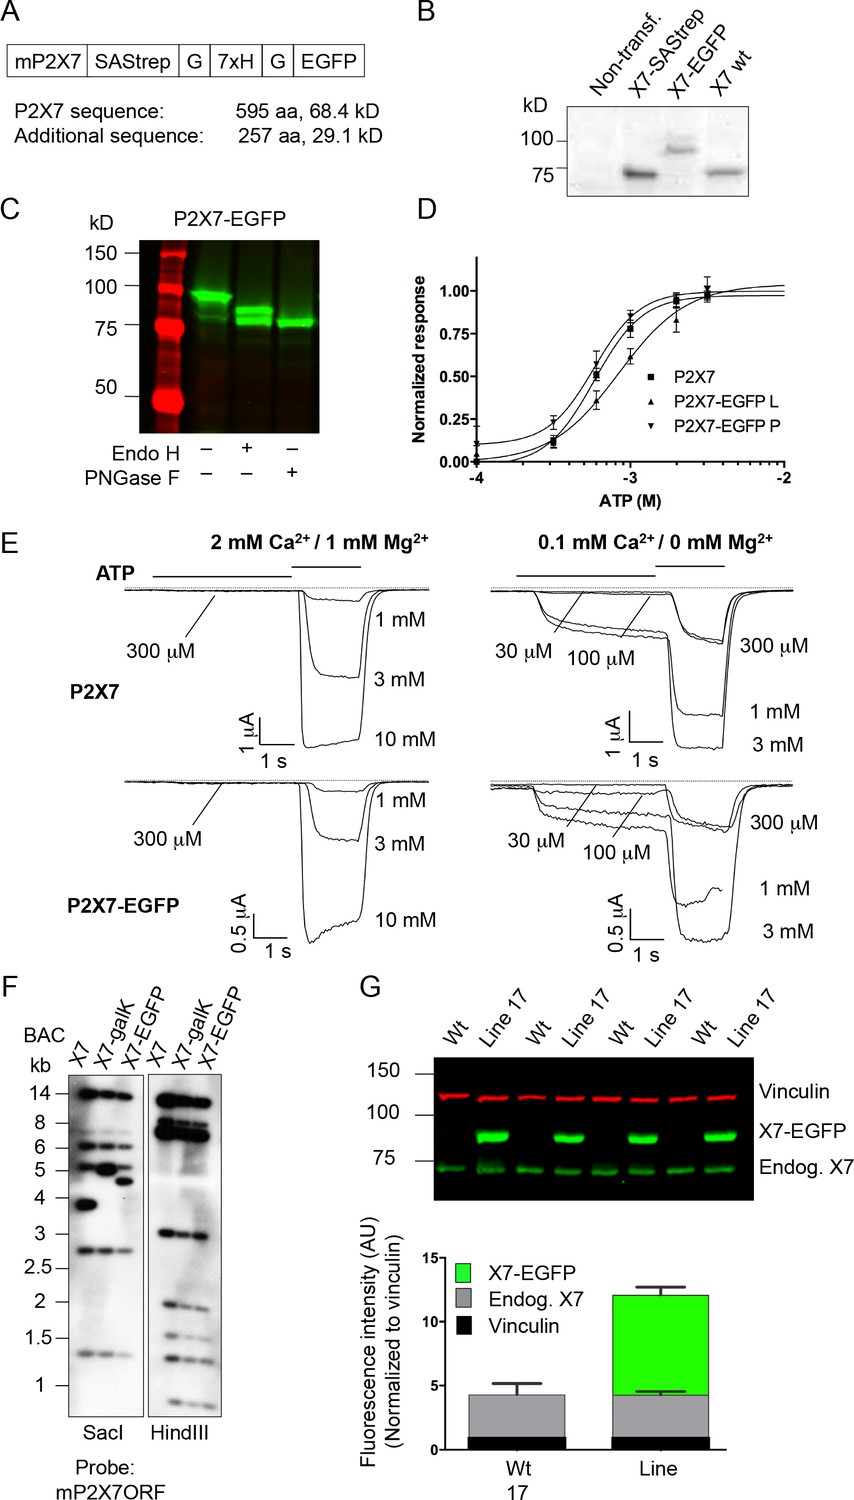
Expression and functionality of the P2X7-EGFP constructs in HEK cells and expression of the transgene in mice.
(A) The EGFP sequence was fused via a Strep-tag-His-tag linker to the very C-terminus of the mouse P2X7 sequence. (B/C) Protein extracts from transiently transfected (Lipofectamine 2000, Invitrogen) HEK cells (DSMZ (ACC 305), regularly tested for mycoplasma contamination) were separated by SDS-PAGE with endoglycosidase treatment as indicated. Gels were analyzed by western blotting with a P2X7-specific antibody (Alamone, extracellular) (B) or by direct EGFP-fluorescence scanning (C). (D) Normalized dose–response curves for ATP-induced ethidium uptake. HEK293 cells were cultured and transfected (2 μg DNA/well of a six-well-plate, Lipofectamin, Thermo Fisher Scientific). After 27 hr, cells were seeded in 96-well plates (5 × 10⁴ cells/well) and incubated in the presence of 20 μM ethidium bromide in PBS for 15 min. Dye influx was evaluated with a fluorescence plate reader (Fluostar Galaxy, BMG) upon addition of the indicated ATP concentrations, as described (Bruzzone et al., 2010). Lines represent nonlinear curve fits of the Hill equation to the data and were normalized to the calculated maximal responses. EC50 values are 582 (CI 498–681), 840 (CI 644–1098) and 582 (CI 457–740) for wt (L variant) and EGFP-tagged L and P variants, respectively. Error bars represent SEM (n = 4–7). CI = 95% confidence interval. (E) Patch-clamp recordings from HEK cells transfected as above with wt and EGFP-tagged P2X7 (L variants). Recordings were performed as described (Nicke et al., 2009) in normal or low divalent cation (DIC) containing extracellular solution to account for possible unspecific effects (Nörenberg et al., 2016). Representative current traces from n > 3 cells are shown. Due to problems with the perfusion, one trace is incomplete (1 mM ATP for P2X7-EGFP in low DIC). (F) Southern blot controls for correct modification and integrity of the P2X7 BAC clone during subsequent homologous recombination steps. (G) Reproducibility and stability of endogenous and transgenic P2X7 protein expression. Protein extracts from four line 17 mice were separated by SDS-PAGE and quantified by western blotting and infrared imaging using antibodies against P2X7 (Synaptic Systems) and vinculin and fluorescent secondary antibodies. Data are presented as mean ±SD from four individual mice. No significant difference of endogenous P2X7 expression was found in two independent experiments.
Figure 1—figure supplement 2
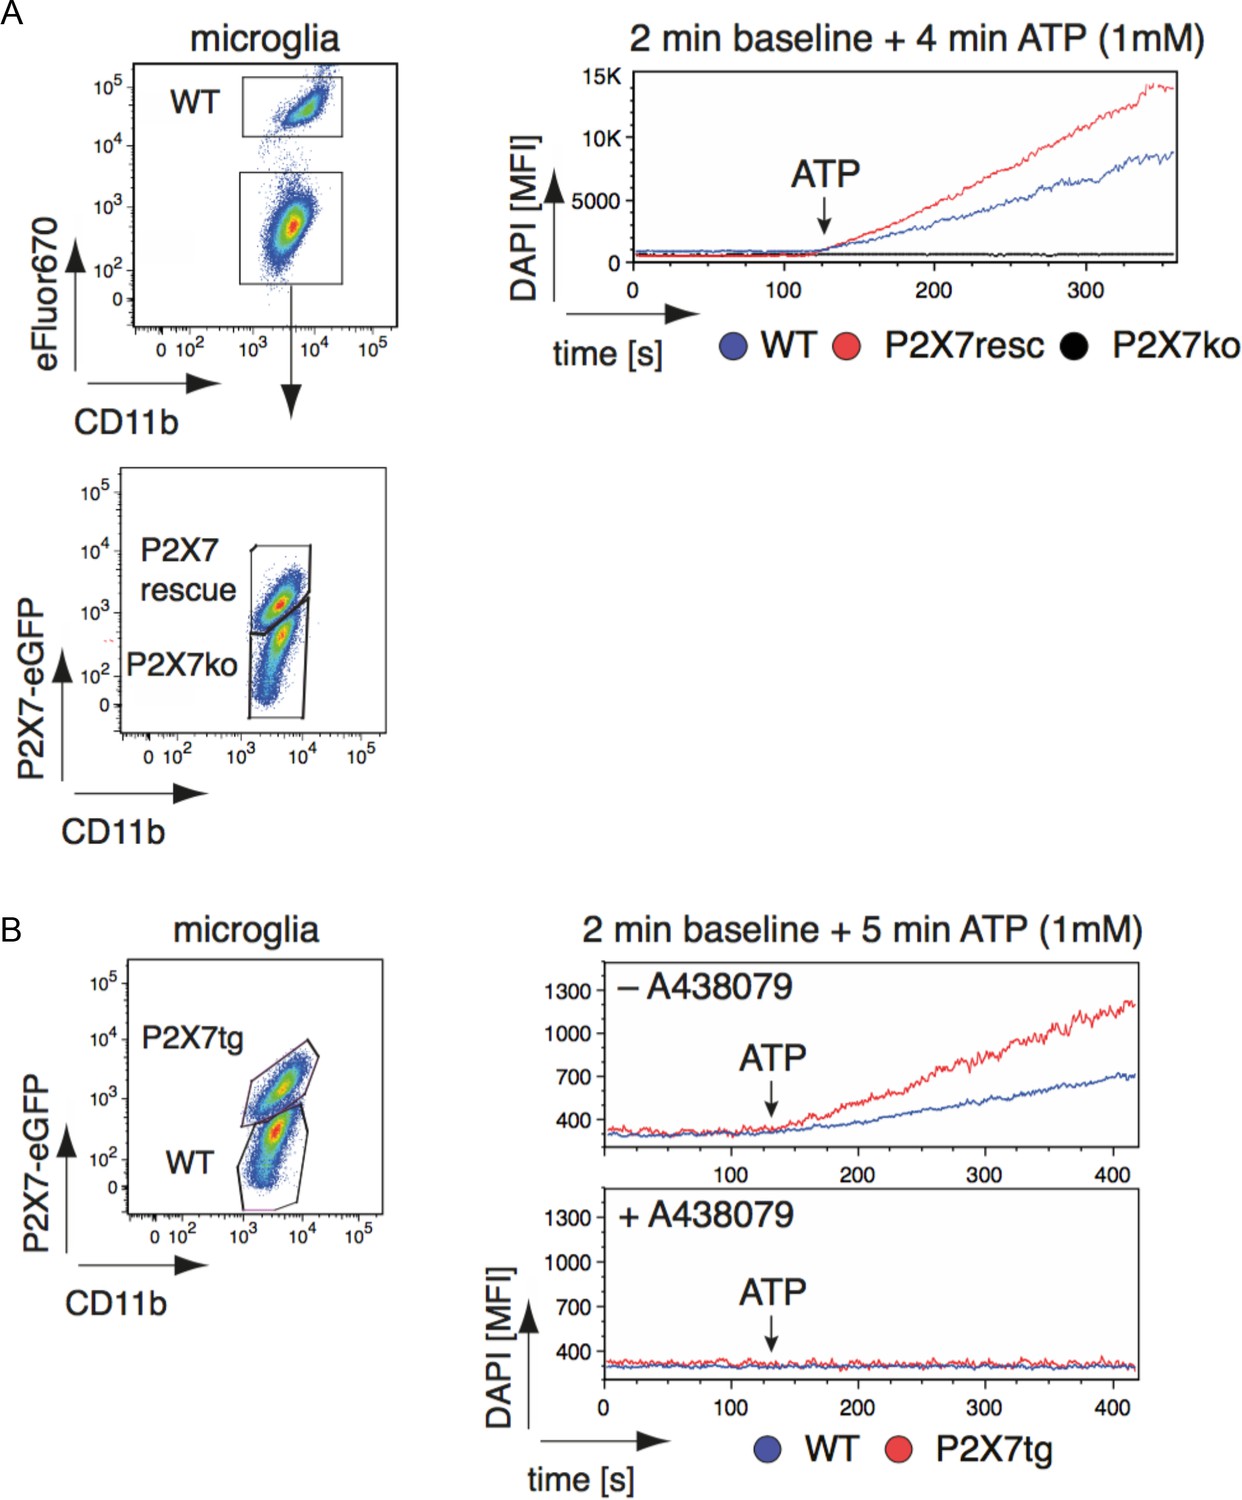
Efficiency and specificity of ATP-induced DAPI uptake in primary brain microglia from wt and P2X7-EGFP transgenic mice.
(A) Pooled isolated microglia from WT, P2X7-EGFP rescue mice and P2X7-/- mice were distinguished by eFluor670-labeling (WT) and EGFP-expression (rescue). DAPI mean fluorescence intensity was measured over 6 min: 2 min without ATP and 4 min after addition of ATP (1 mM). (B) Pooled isolated microglia from WT and P2X7-EGFP expressing mice were distinguished by the EGFP-expression. DAPI mean fluorescence intensity was measured over 7 min: 2 min in the absence of ATP, 5 min after addition of ATP (1 mM). DAPI uptake was measured in the presence or absence of the P2X7 antagonist A438079 (100 μM). Data were obtained in two independent experiments.
Figure 2 with 2 supplements
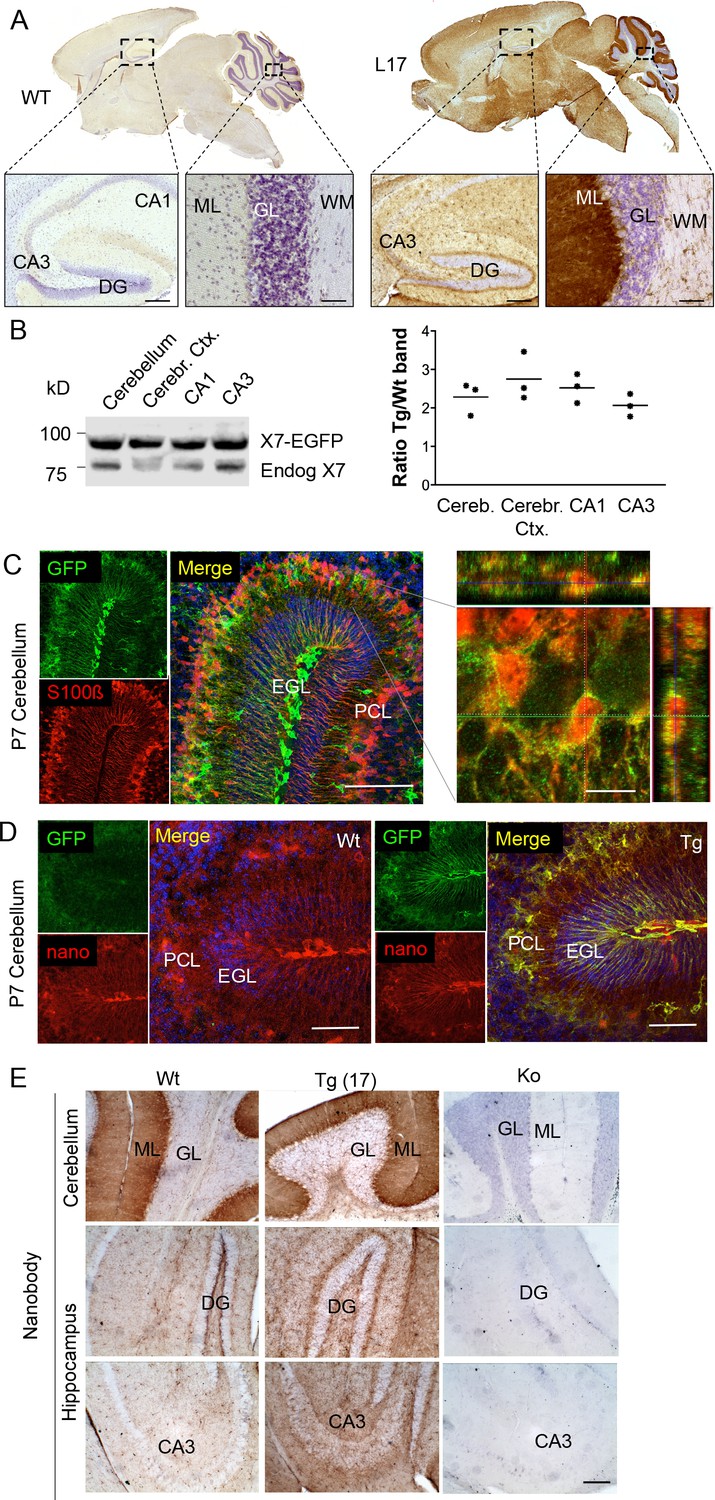
Distribution pattern of transgenic P2X7-EGFP.
(A) DAB staining with an antibody against GFP (A11122, Thermo Fisher Scientific). Scale bars: 200 μm and 50 μm in hippocampus and cerebellum, respectively. A representative result from at least three animals is shown (B) Ratios of transgenic (line 17) and endogenous P2X7 protein in different brain regions. Protein extracts (1% NP40) were prepared and 75 μg per lane separated by SDS-PAGE. Bands were quantified upon western blotting by infrared imaging with antibodies against P2X7 (Synaptic Systems) and fluorescent secondary antibodies (LI-COR 680RD dk anti rb). Data are presented as means from three animals. (C) Co-labeling of line 17 P7 cerebellum with antibodies against GFP (A10262, Thermo Fisher Scientific) and S100β (S2532, Sigma Aldrich). A typical staining pattern for radial glia is seen. The close up of a representative area in the Purkinje cell layer (right) shows punctate P2X7 staining on cells with Bergmann glia morphology. Cell nuclei were counterstained with DAPI (blue). Scale bars represent 100 μm and 10 μm, respectively. CA1/3, cornu ammonis regions 1/3; DG, dentate gyrus; ML, molecular layer; GL, granular layer; WM, white matter; EGL, external granular layer; PCL, Purkinje cell layer. (D) Co-labeling of wt and tg line 17 cerebellar slices from P7 pubs with an anti-GFP antibody (A10262, Thermo Fischer Sci.) and the novel P2X7-specific nanobody-rbIgG fusion construct 7E2-rbIgG (Danquah et al., 2016) confirms the endogenous expression pattern and the specificity of the P2X7-EGFP signal. Representative results from n = 3 (Tg) and n = 2 (Wt) pubs are shown. Scale bar: 50 μm, DAPI staining in blue. PCL, Purkinje cell layer; GL, granular layer; ML, molecular layer; DG, dentate gyrus; CA3, cornu ammonis region 3; EGL, external granular layer. (E) Comparison of DAB staining in transgenic P2X7-EGFP mice, wt, and P2X7-/- mice with 7E2-rbIgG (Danquah et al., 2016). Scale bar: 100 μm. Representative results from three animals per line (line 17 and wt) are shown. For antibodies not specified in the legend see Key resources table.
Figure 2—figure supplement 1
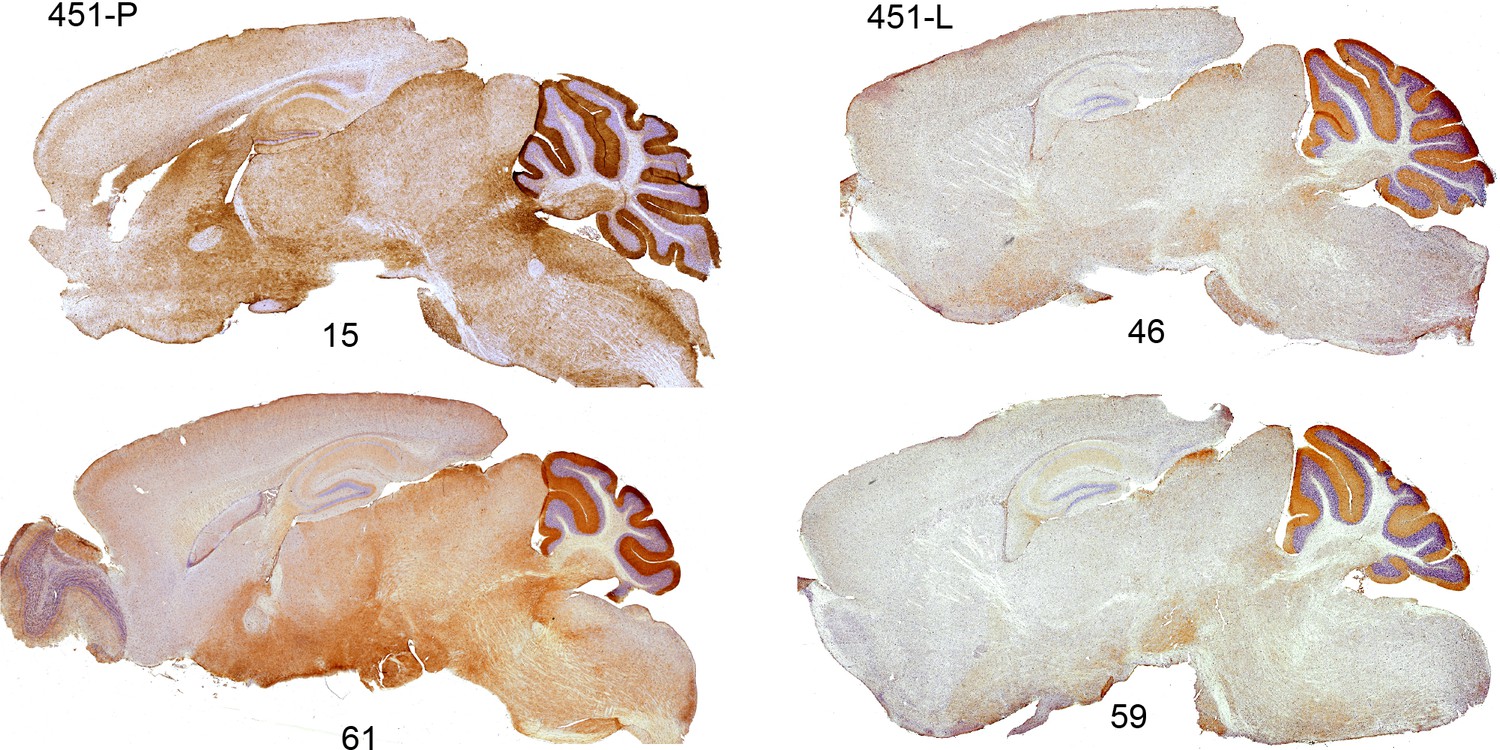
Identical expression patterns in five transgenic lines and wt animals.
DAB staining of transgenic P2X7-EGFP using antibodies against GFP (A11122 Thermo Fischer Sci. and ab6556 Abcam in lines 15 and 61, 46, 59, respectively). n = 2 animals per line.
Figure 2—figure supplement 2
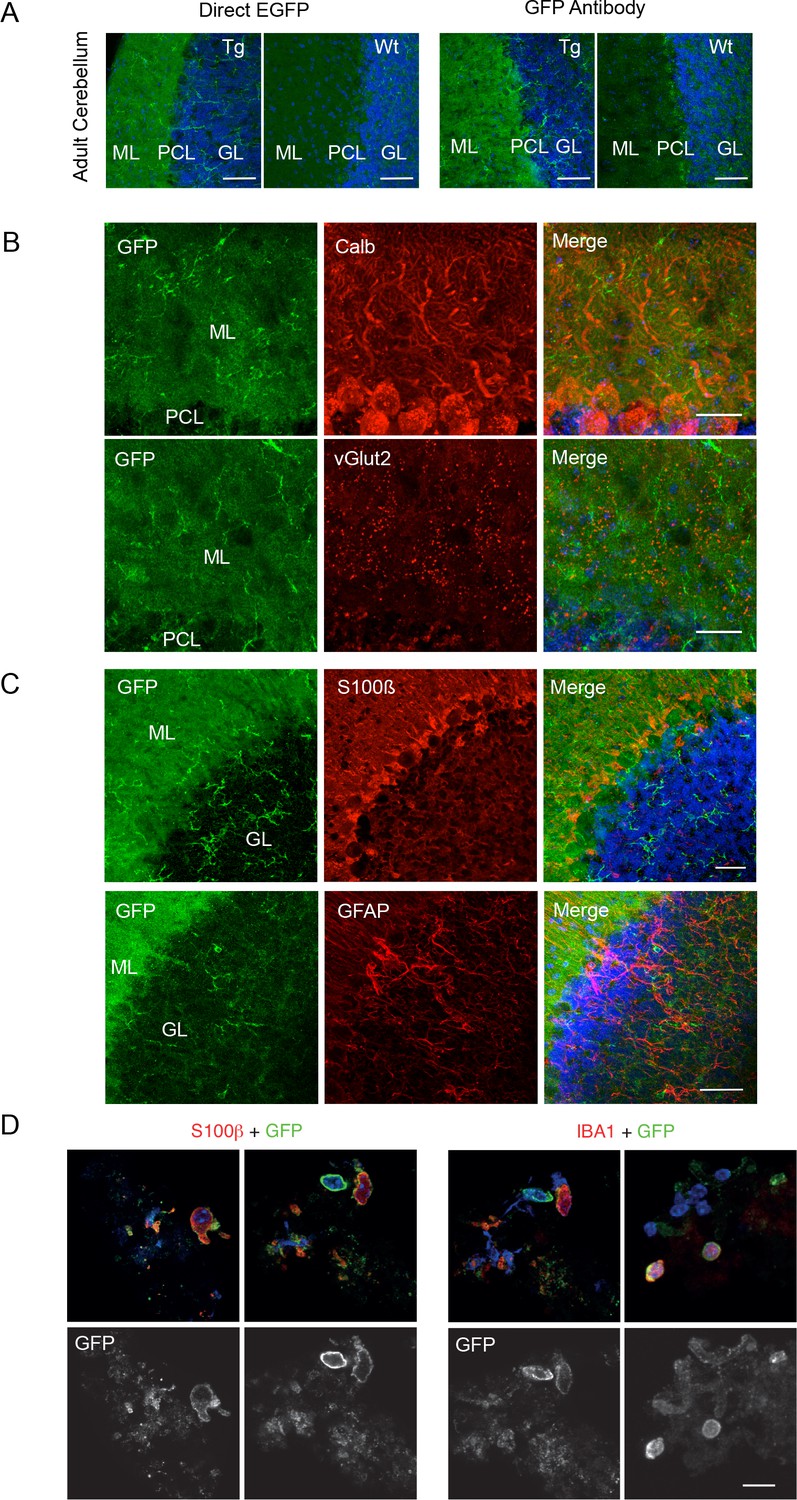
P2X7-EGFP immunofluorescence in the cerebellum.
(A) Direct fluorescence and antibody-enhanced EGFP signal (green) in the cerebellar molecular layer of adult line 17 and wt mice. Representative results from n = 3 animals per line are shown. Note a high level of background fluorescence in the wt tissue. Scale bars: 50 μm (B) Co-staining with antibodies against GFP (ab6556, Abcam) and calbindin D28k (Calb) for Purkinje cells or vesicular glutamate transporter 2 (vGlut2) as synaptic marker (n = 3). Scale bar: 50 μm (C) Co-staining with antibodies against GFP (A10262, Thermo Fischer Scientific,) and S100β (for Bergmann Glia, (S2532, Sigma Aldrich, 7853–500) or GFAP (for Astrocytes, Z0334, DAKO). Scale bars: 50 μm. DAPI staining in blue (n = 3). (D) Co-staining of EGFP (A6455, Thermo Fischer Scientific) with S100β (S2532, Sigma Aldrich) or Iba1 on dissociated cerebellar cell preparations of P2X7-EGFP mice (n = 3); scale bar represents 20 µm.
Figure 3 with 7 supplements
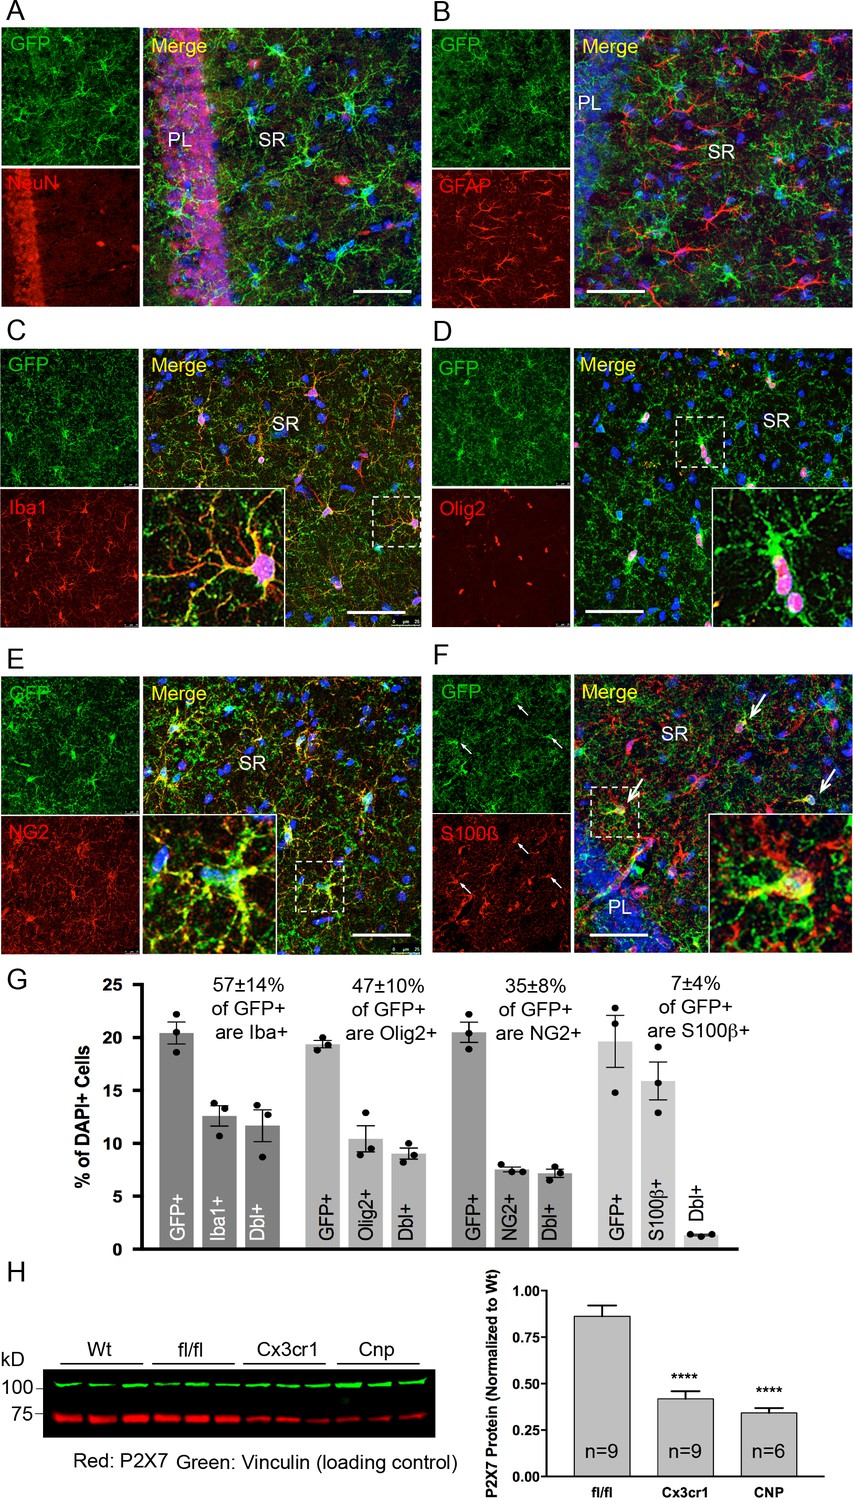
Identity and quantity of P2X7-EGFP expressing cell types in the CA1 region and comparison with P2X7 expression in wt mice.
(A–F) Co-labeling of tg line 17 brain slices with anti-GFP antibody (ab6556, Abcam; A10262, Thermo Fisher Scientific) and antibodies for the indicated marker proteins (GFAP (MAB360, Millipore), S100β (S2532, Sigma Aldrich)). Hippocampal CA1 regions are shown. Arrows indicate co-staining for S100β and GFP. Cell nuclei were counterstained with DAPI (blue). PL, pyramidal cell layer; SR, stratum radiatum. Scale bar: 50 μm (G) Quantitative analysis of 10 ‘counting boxes’ (as shown in C–F) from five sections/mouse in each experiment. Bars represent mean ±SEM of three independent experiments/animals (total cell numbers in transgenic versus wt animals were: 14.4% vs. 12.2% Iba1 +cells, 10.4% vs. 11.0% Olig2 +cells, 7.3% vs. 8.4% NG2 +cells, 16.1 vs. 14.1% S100β + cells). (H) Quantitative analysis of P2X7 protein reduction in conditional P2X7-/- mice (CNP-cre, Cx3cr1-cre). 75 μg cerebrum extracts (1% NP40) were analyzed by western blotting and infrared imaging with antibodies against P2X7 (Synaptic Systems) and fluorescent secondary antibodies (LI-COR 680RD dk anti-rb; LI-COR 800CW gt anti-ms). Data were normalized to P2X7 protein in wt animals. Bars represent mean ± SEM from 6 to 9 animals analyzed in three independent experiments. Significance between means was analyzed using two-tailed unpaired Student’s t-test and indicated as ****p<0.0001 compared to P2rx7fl/fl. For antibodies not specified in the legend see Key resources table.
Figure 3—figure supplement 1
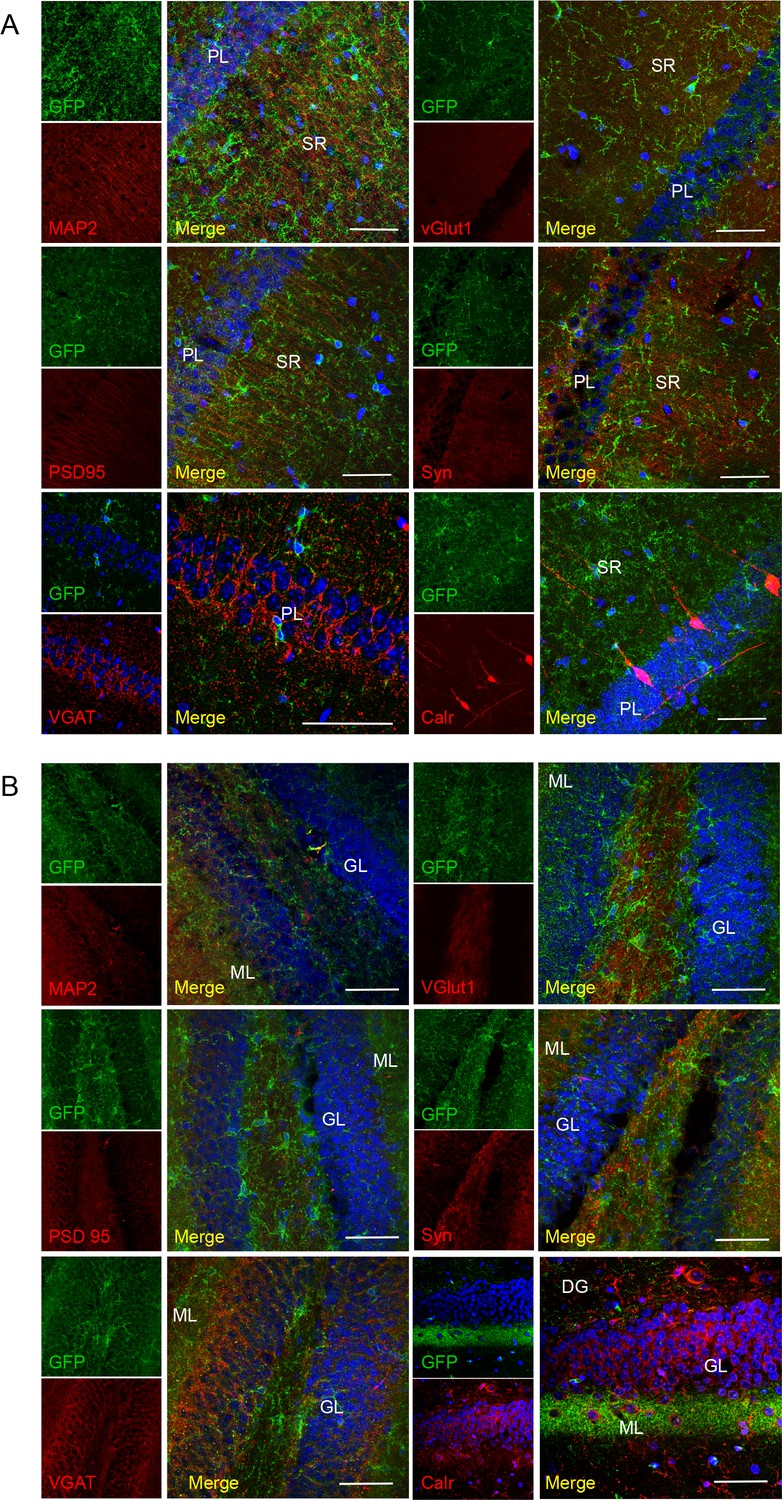
No co-localization of P2X7-EGFP with neuronal/synaptic markers in the CA1 region
(A) and dentate gyrus (B). Co-labeling with antibodies against GFP (green, ab6556, Abcam), different neuronal or synaptic marker proteins (red), and DAPI (blue). Scale bars: 50 μm, n = 3 animals.
Figure 3—figure supplement 2
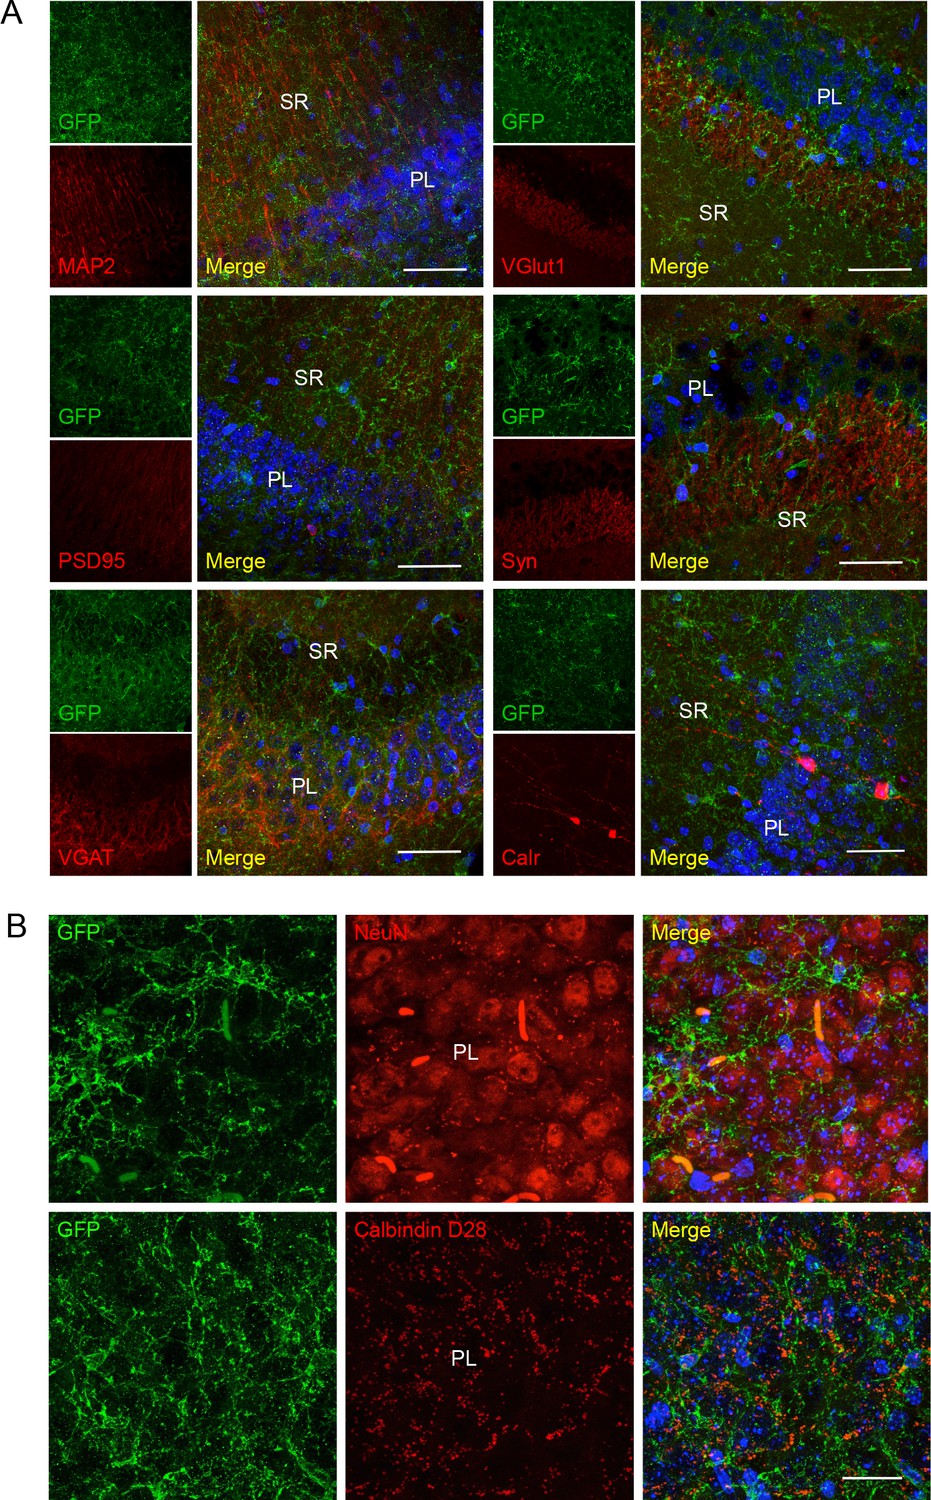
No co-localization of P2X7-EGFP with neuronal/synaptic markers in the CA3 region.
(A) Co-labeling with antibodies against GFP (green, ab6556, Abcam), different neuronal or synaptic marker proteins (red), and DAPI (blue). Scale bar: 50 μm. (B) Images taken in the CA3 region at higher resolution. Scale bars: 25 μm., n = 3 animals.
Figure 3—figure supplement 3
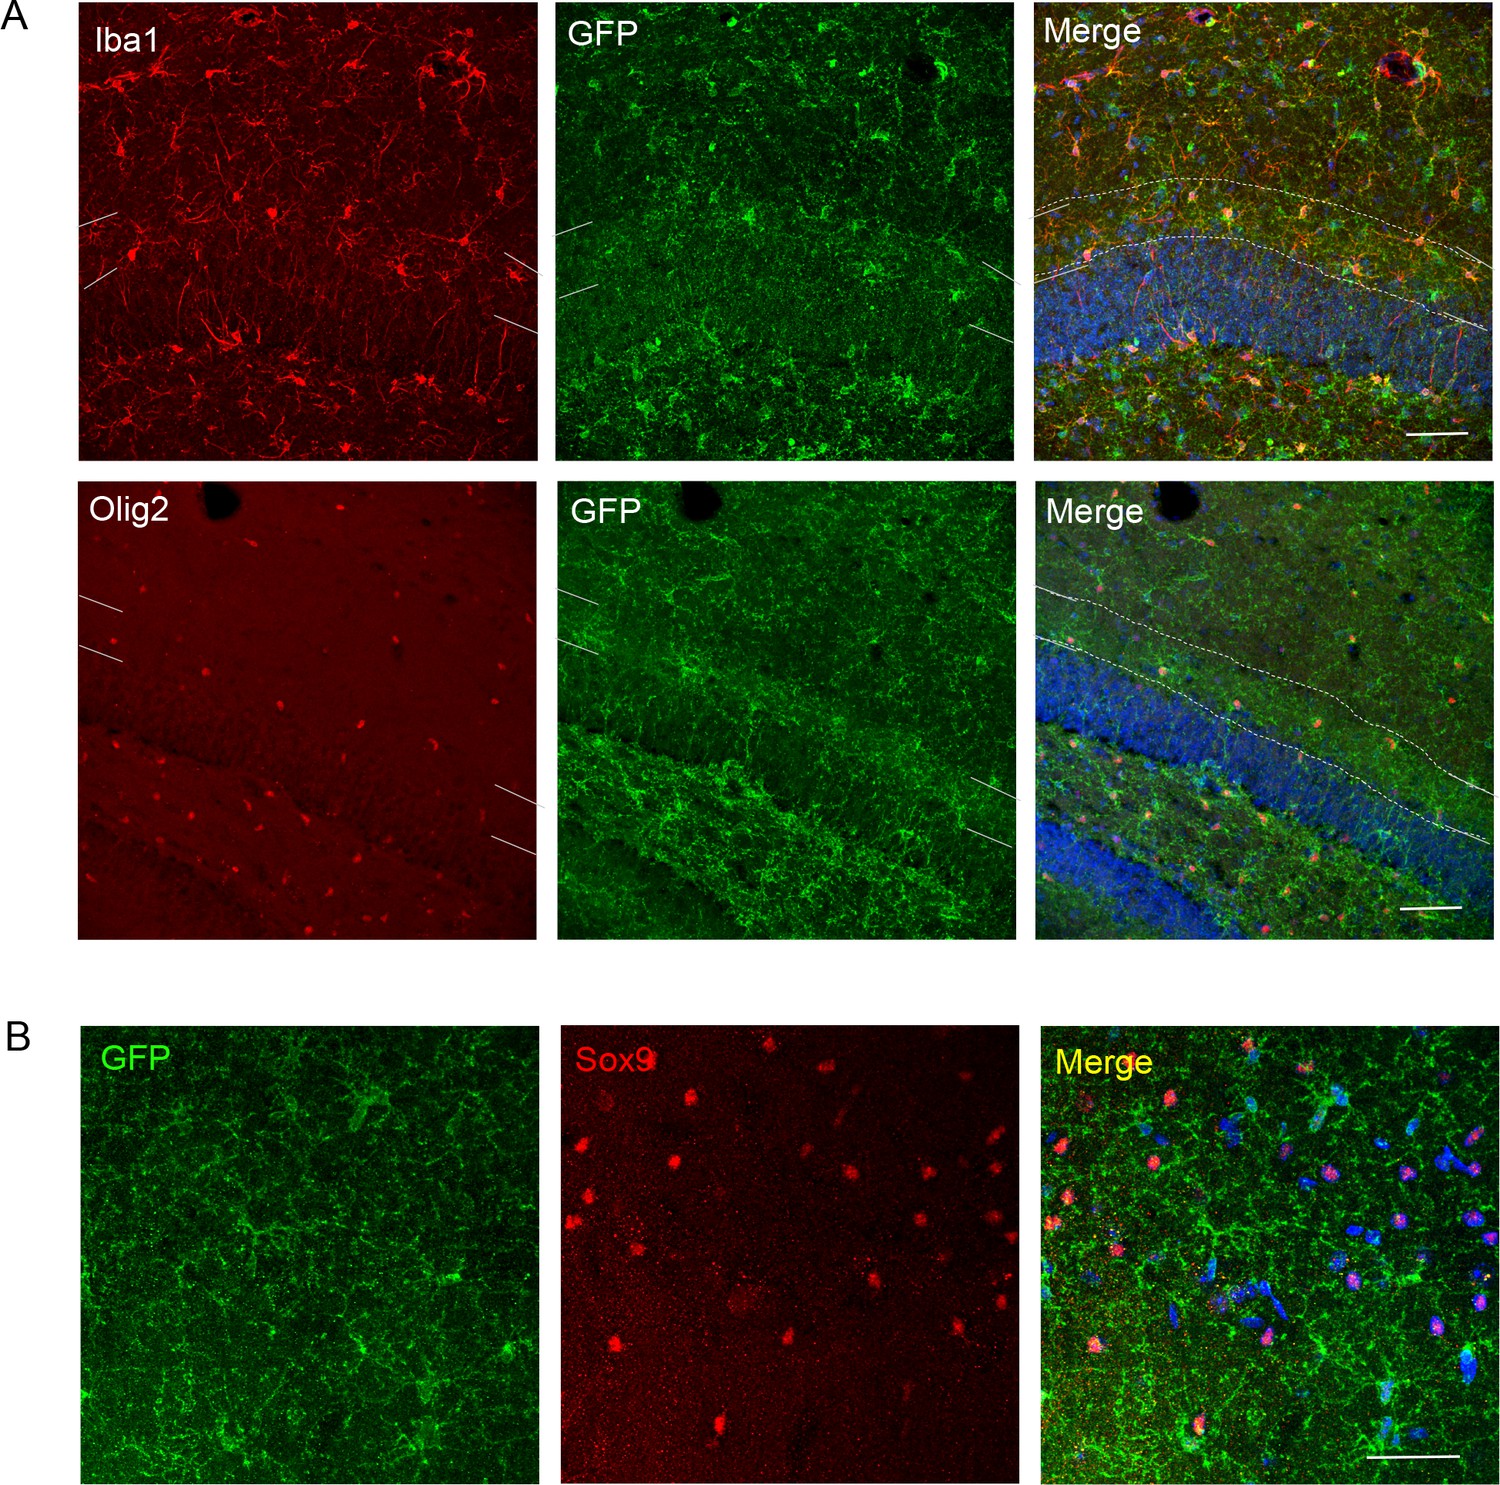
Further analysis of P2X7-EGFP expressing cells in the dentate gyrus and CA1 region.
(A) EGFP co-labeling (10262, Thermo Fischer Scientific, ab6556, Abcam) with Iba1 and Olig2 in the dentate gyrus. Iba1-positive microglia and Olig2-positive oligodendrocytes appear to align at the border between granular and molecular layers resulting in a region of more intense staining (indicated by white dotted lines and corresponding marks in the (merge) and at the side of the single channel pictures, respectively). Scale bar: 50 μm. DAPI staining in blue. (B) Co-staining of EGFP (A10262, Thermo Fischer Scientific) with the alternative astrocyte marker Sox 9 in the CA1 region. Scale bar: 50 μm. DAPI staining in blue (n = at least three animals in all experiments).
Figure 3—figure supplement 4
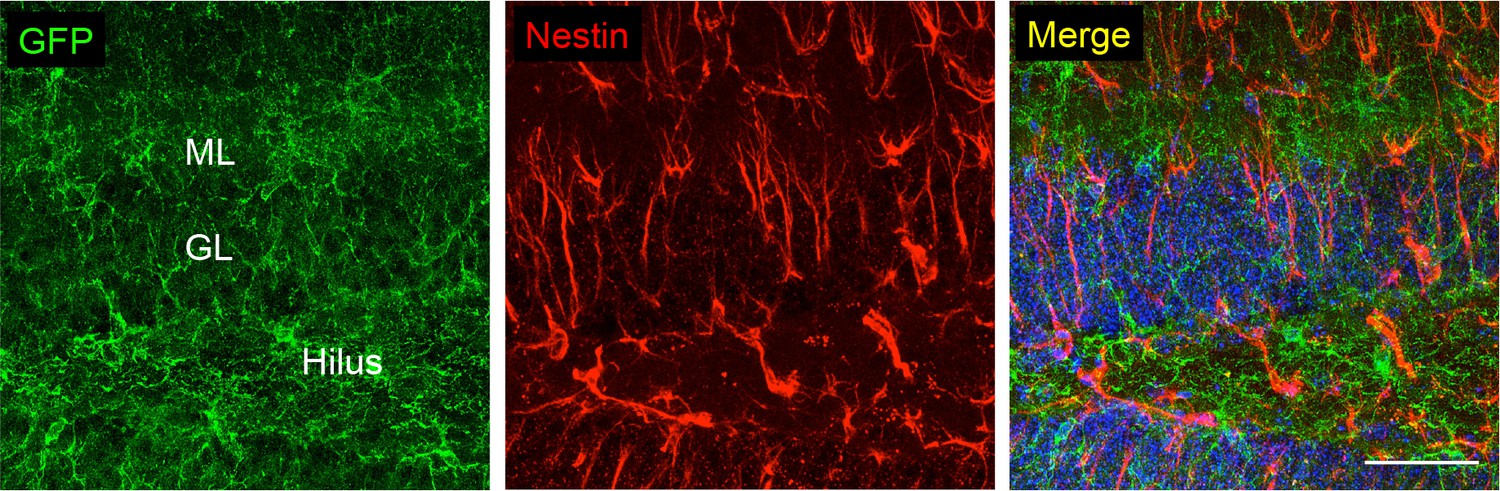
Co-stainings of EGFP (ab6556, Abcam) and the neuronal/astroglial precursor marker nestin in the subgranular zone of the dentate gyrus.
Scale bars: 50 μm. DAPI staining in blue (n = 3 animals).
Figure 3—figure supplement 5
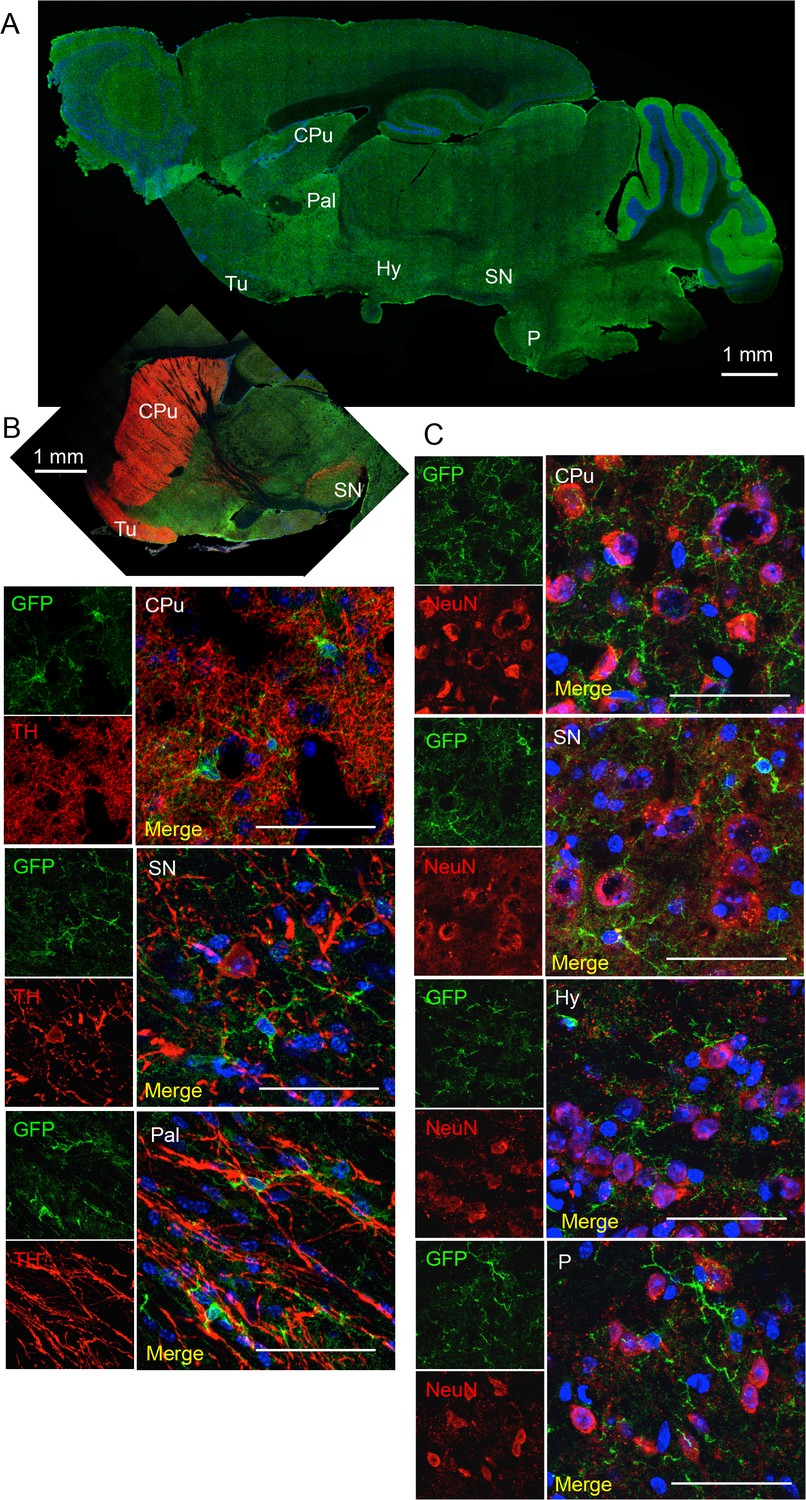
Co-stainings of EGFP (A10262, Thermo Fischer Scientific; ab6556, Abcam) and neuronal markers tyrosine hydroxylase (dopaminergic neurons, (B) and NeuN (C) in the substantia nigra (SN), hypothalamus (Hy) and pons (P).
CPu, caudate putamen; Tu, olfactory tubercle). (A) EGFP-staining of sagittal brain section to indicate regions shown in B and C. Scale bars: 50 μm or as indicated. DAPI staining in blue (n = 3 animals).
Figure 3—figure supplement 6
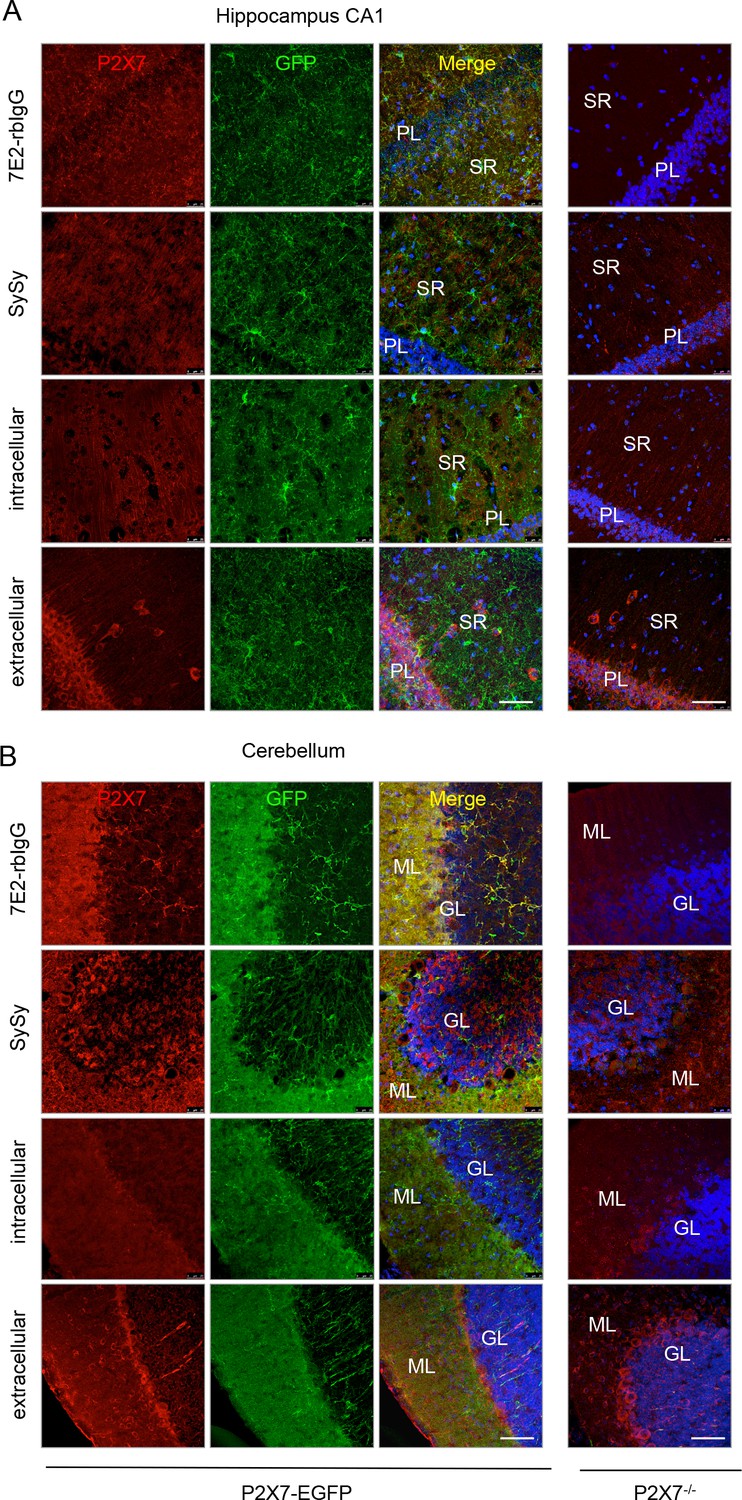
Comparison of the specificity of commercially available anti-P2X7 antibodies and an anti-P2X7 nanobody-rbIgG heavy chain antibody (7E2-rbIgG) in CA1 (A) and cerebellar (B) slices of adult line 17 mice and P2X7-/- mice.
GL, granular layer; ML, molecular layer; PL, pyramidal cell layer; SR, stratum radiatum. Representative stainings are shown for the P2X7-specfic 7E2-rbIgG, the Synaptic Systems antibody and two Alomone antibodies directed against intra- and extracellular epitopes, respectively (n = at least 3, each). Scale bars: 50 μm.
Figure 3—figure supplement 7
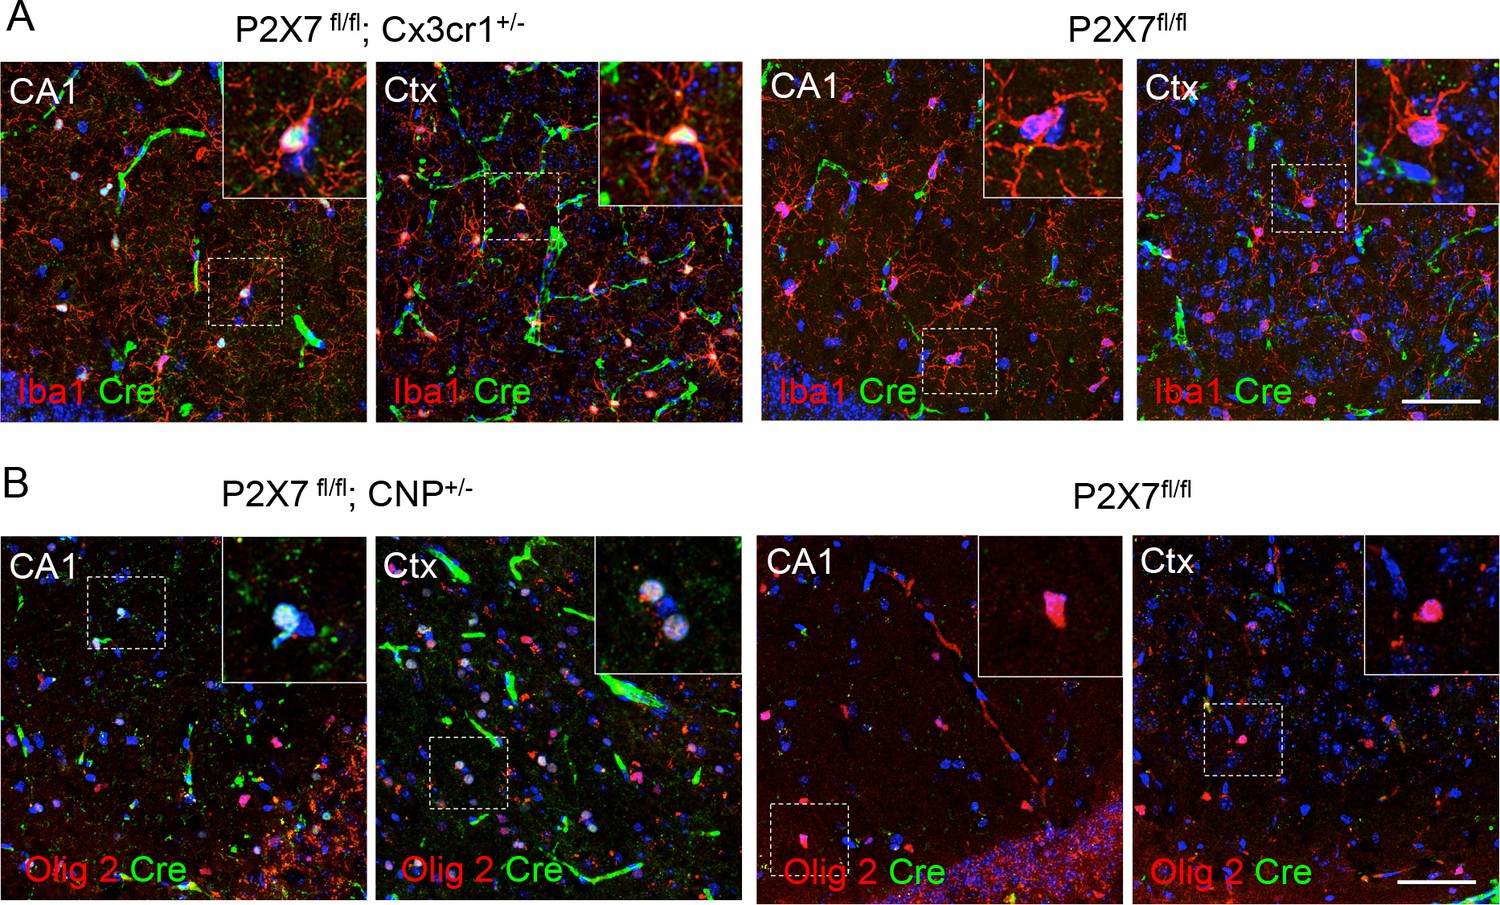
Cell type-specific Cre-expression in the hippocampal CA1 region and cerebral cortex (Ctx) of Cx3cr1- and CNP-Cre mice.
(A) Co-labeling of Cre and the microglia marker Iba1 in P2X7fl/fl; Cx3cr1-Cre ± mice and P2X7 fl/fl controls (B) Co-labeling of Cre and the oligodendrocyte marker Olig2 in P2X7 fl/fl; Cx3cr1-Cre mice and P2X7fl/fl controls. No ectopic expression was observed. Animals were not perfused and tissues only post-fixed in these experiments. Note that under these conditions, vessels, which can be morphologycally differentiated from oligodendrocytes and microglia, are unspecifically stained with the secondary antibody (green). Scale bar: 50 μm. Blue color represents DAPI staining. Representative stainings from n = 3 animals are shown.
Figure 4 with 1 supplement
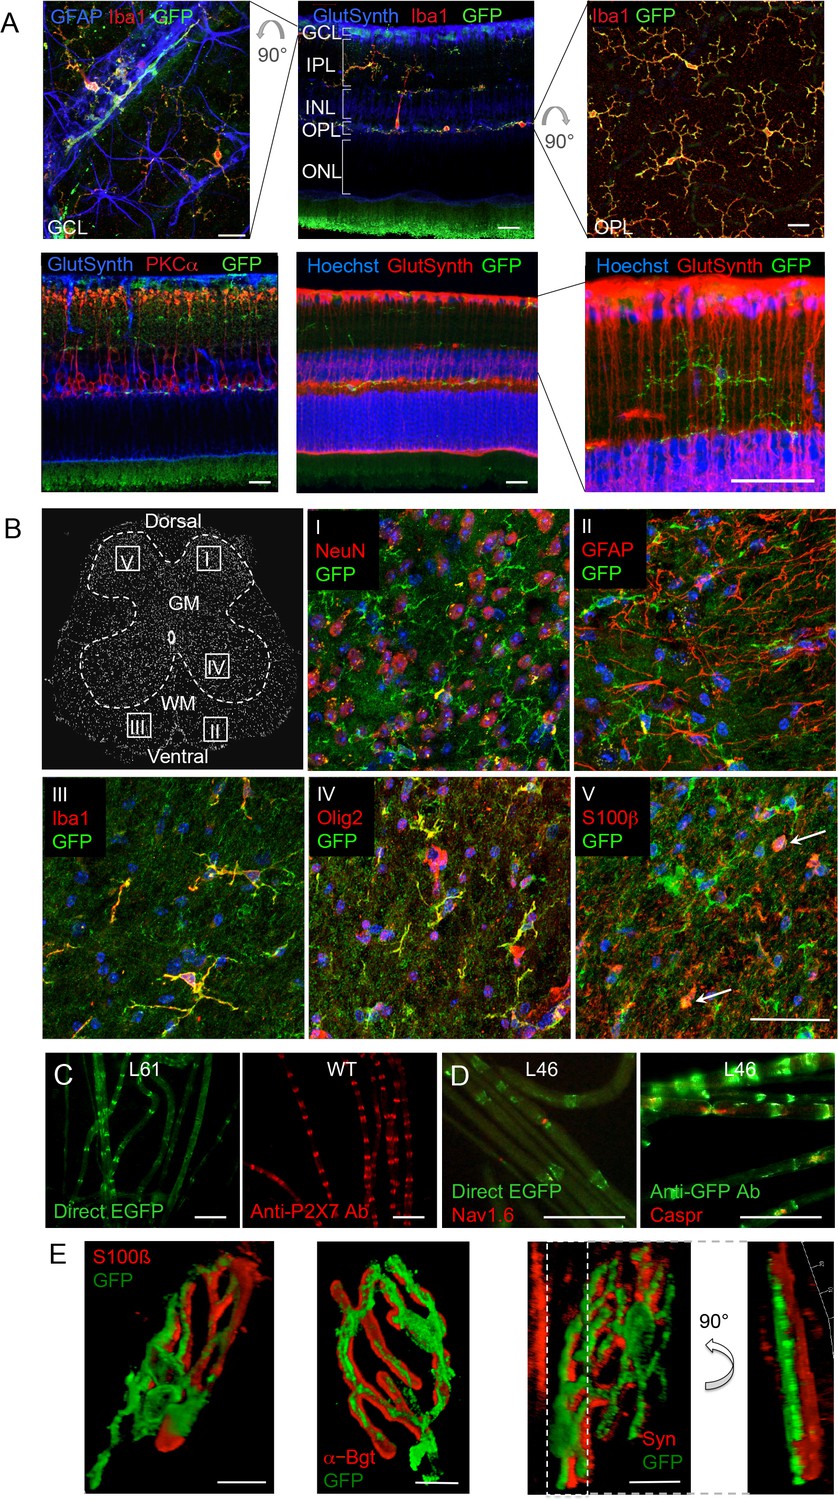
P2X7-EGFP expression in retina, sciatic nerves, spinal cord, and at the neuromuscular synapse.
(A) EGFP exclusively co-localizes with microglia and endothelial cells in the adult mouse retina. Upper panel: Middle, retinal slice labeled for GFP (600 101 215, Rockland), Iba1 (marker for microglia/macrophages) and glutamine synthetase (marker for Müller glia). Left and right, retinal flat mounts scanned at the plane of the ganlion cell layer (GCL) and outer plexiform layer (OPL), respectively, to delineate microglia residing in these retinal layers. Astrocytes in the GCL were labeled with GFAP (G6171, Sigma-Aldrich). IPL, inner plexiform layer; INL, inner nuclear layer; ONL, outer nuclear layer. Lower panel: Co-staining of EGFP with neuronal marker PKCα (left) and glutamine synthetase (two right panels) at higher contrast and resolution to show absence of neuronal P2X7-EGFP. Cell nuclei were counterstained with Hoechst 33342 (blue) Scale bars: 20 µm. n = 2 individual line 61 in FVB/C57b/6 hybrid mice (B) Confocal images of GFP (ab6556, Abcam; A10262 or Thermo Fisher Scientific) co-immunostaining with antibodies against the indicated marker proteins in transgenic mice line 17 spinal cord slices (GFAP (MAB360, Millipore), S100β (S2532, Sigma Aldrich)). Representative images were taken from the areas shown in the schematic overview. Arrows indicate co-staining for S100ß and GFP. Scale bar: 40 µm. Cell nuclei were counterstained with DAPI (blue). Representative images from n = 3 animals are shown. (C) Comparison of transgenic P2X7-EGFP fluorescence and endogenous P2X7 immunofluorescence (P2X7 antibody, Synaptic Systems) in teased sciatic nerve fibers of line 61 and wt mice, respectively. Representative images from at least 3 animals are shown. (D) Co-staining of P2X7-EGFP (A11122, Thermo Fischer Scientific, dilution 1:1000) in teased sciatic nerve fibers of line 46 with antibodies against axonal marker proteins demonstrates localization of the transgene at perinodal regions of Schwann cells. Scale bars: 50 μm. (E) Reconstructed 3-D images of the neuromuscular junction showing co-staining of P2X7-EGFP (ab6556, Abcam; or A10262, Thermo Fisher Scientific) with perisynaptic Schwann cells (S100β (S2532, Sigma Aldrich)) as well as postsynaptic (α-Bungarotoxin, α-Bgt) and presynaptic (synaptophysin, Syn) marker proteins. The side view in the right panel shows no overlap between GFP and synaptophysin staining. Scale bars: 10 µm and 20 µm, respectively. Representative images from n = 3 animals are shown. For antibodies not specified in the legend see Key resources table.
Figure 4—figure supplement 1
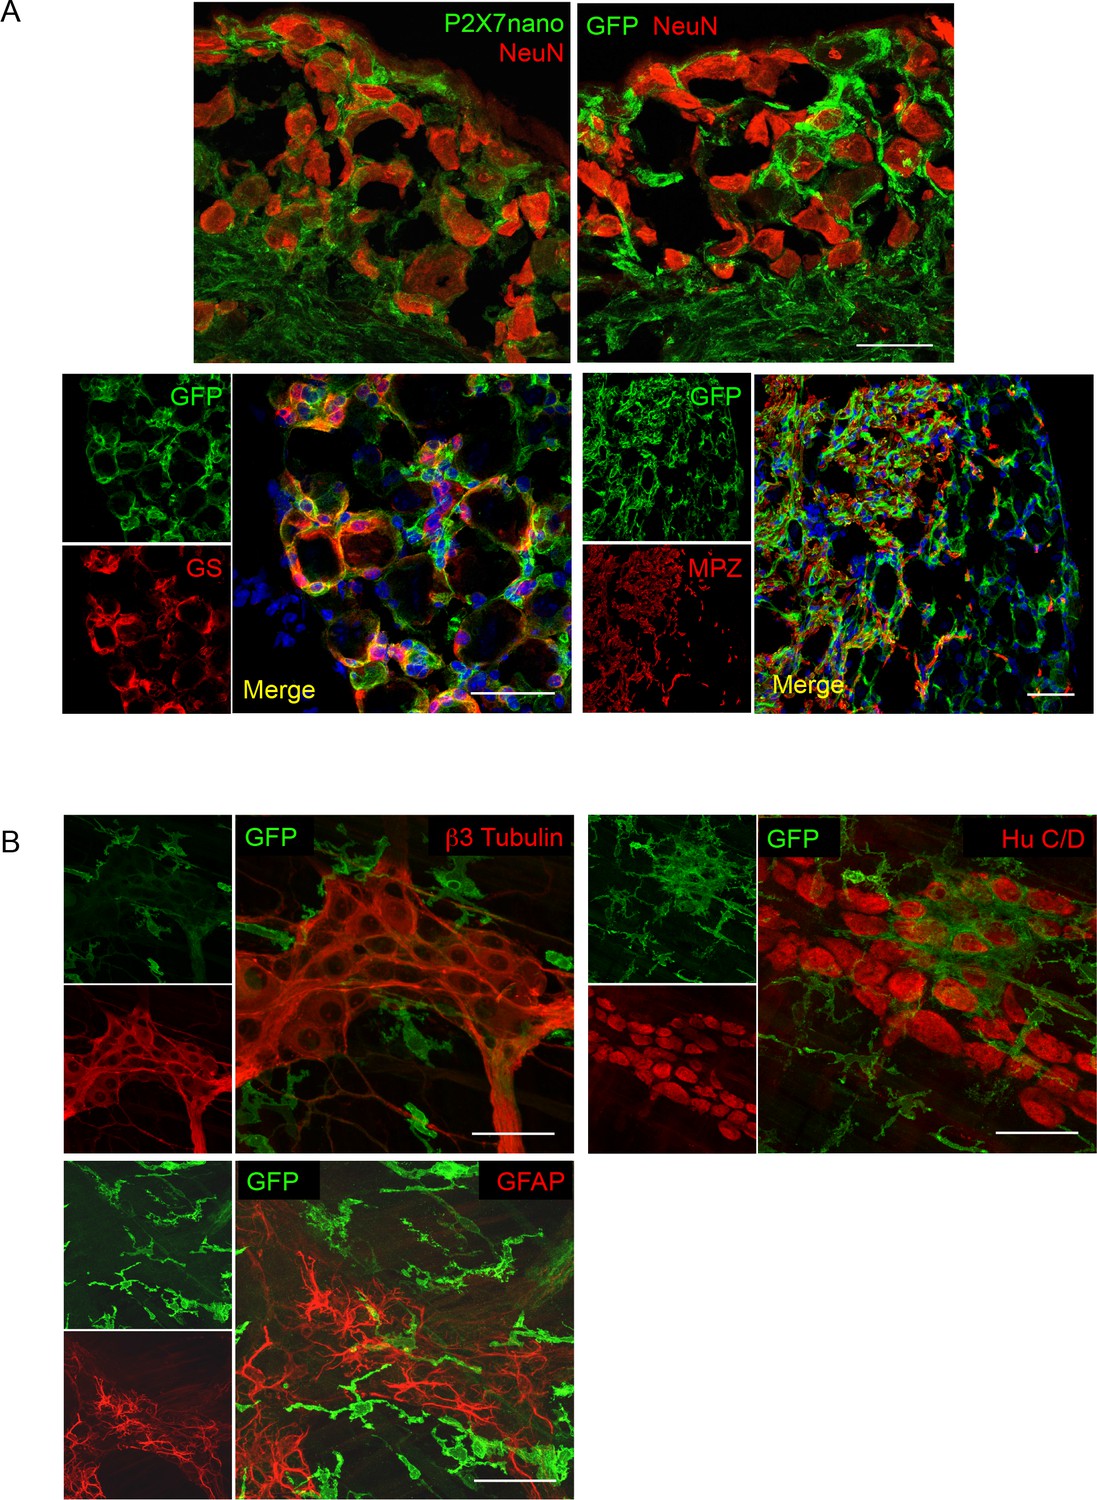
P2X7-EGFP localization in DRG and myenteric plexus preparations.
(A) Upper panel Co-staining of anti-P2X7 nanobody-based antibody or anti-GFP antibody (ab6556, abcam) with NeuN in dorsal root ganglions of line 17 mice shows no localization of P2X7 -EGFP in NeuN positive cells. Lower panel A fraction of P2X7-EGFP positive cells represent glutamine synthetase-positive satellite glia cells that closely surround the neurons. P2X7-EGFP-positive cells are not labeled with the Schwann cell marker myelin protein zero (MPZ) but closely associate with MPZ-positive cells which are localized in a region with fewer sensory neuron cell bodies, but probably rich in nerve fibers. Scale bars: 50 μm, n > 3. (B) Upper panel No costaining of P2X7-EGFP (ab6556, Abcam) with the neuronal markers β3-tubulin and HuC/D in the myenteric plexus of the colon. Lower panel The glia marker GFAP (MAB360, Millipore) also does not co-localize with P2X7-EGFP. Scale bars: 25 μm, n > 3 animals.
Figure 5 with 3 supplements
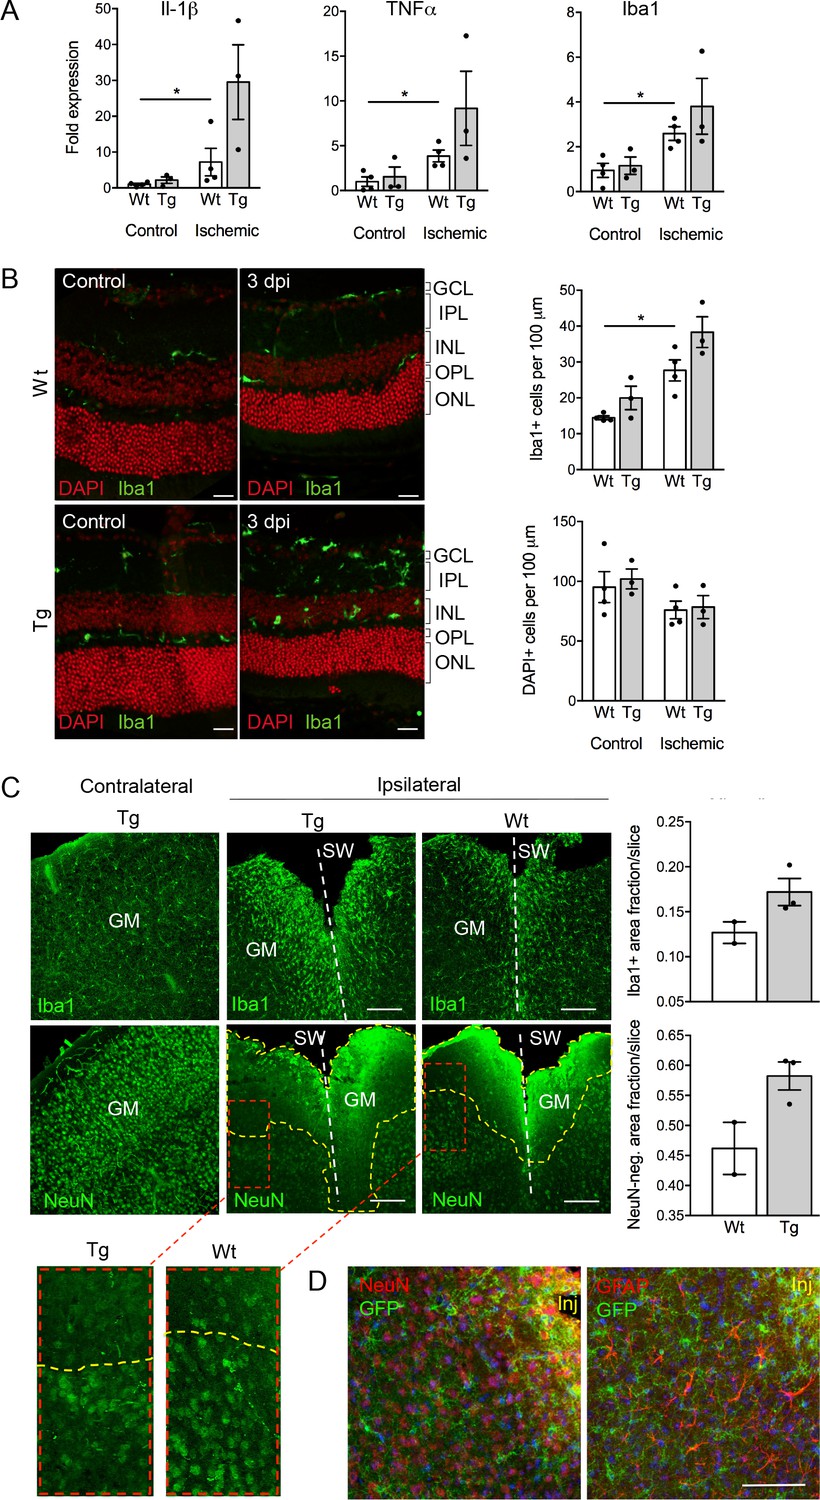
Consequences of P2X7 overexpression under physiological and pathophysiological conditions.
(A) Quantitative real-time PCR was performed in duplicates on samples from microglia isolated by immunomagnetic separation from control and postischemic (3 days post injury, 3 dpi) retinae. Bars represent mean ±SEM and include data from 3-4 animals/each genotype/condition. Significance between expression level in the untreated control eye of the respective genotype was analyzed using unpaired two-tailed Mann-Whitney-U-test and indicated as: *p<0.05. (B) Retinal slices labeled for the microglia/macrophage marker Iba1. Cell nuclei were counterstained with DAPI (red). Retinae were isolated from mice of which one eye had been subjected to transient ischemia. The untreated contralateral eye served as internal control. Dpi, days post-injury. Scale bars: 20 µm. Cell numbers of the inner retinal layers and microglia specifically were quantified in 2–5 central retinal slices per animal on basis of DAPI and Iba1 staining, respectively. Bars represent mean ±SEM and include data from 3 to 4 animals/genotype/condition. Note that data from transgenic mice were not significantly different in A and B. (C) Representative confocal images of coronal sections from posttraumatic GM at 5 dpi. Slices of the somatosensory grey matter (GM) from wt and transgenic animals stained for NeuN- (neurons) and Iba1- (microglia) positive cells are shown. White dotted lines indicate stab wounds; yellow dotted lines indicate NeuN-negative lesion areas. Insets show chosen borders between NeuN-positive and negative areas. Bar diagrams depict fractions of Iba1-positive and NeuN-negative areas in relation to DAPI-positive areas. Means of N = 2–3 animals (n = 6–7 sections per animal)±SEM are shown. Scale bar: 200 µm. One wt tissue broke and could not be analyzed. (D) Double immunostaining with GFP (ab6556, Abcam) and NeuN or GFAP (for astroglia (MAB360, Millipore)) shows no upregulation of P2X7-EGFP in these cell types within the penumbra of P2X7-EGFP and wt mice at 5 dpi. Note that immunofluorescence in the area immediately adjacent to the lesion core (~0–75 μm) is non-specific due to autofluorescence of cells within damaged tissue (inj), and this might obfuscate a potential P2X7-EGFP signal. Cell nuclei were counterstained with DAPI (blue). Scale bar: 100 µm. For antibodies not specified in the legend see Key resources table.
Figure 5—figure supplement 1
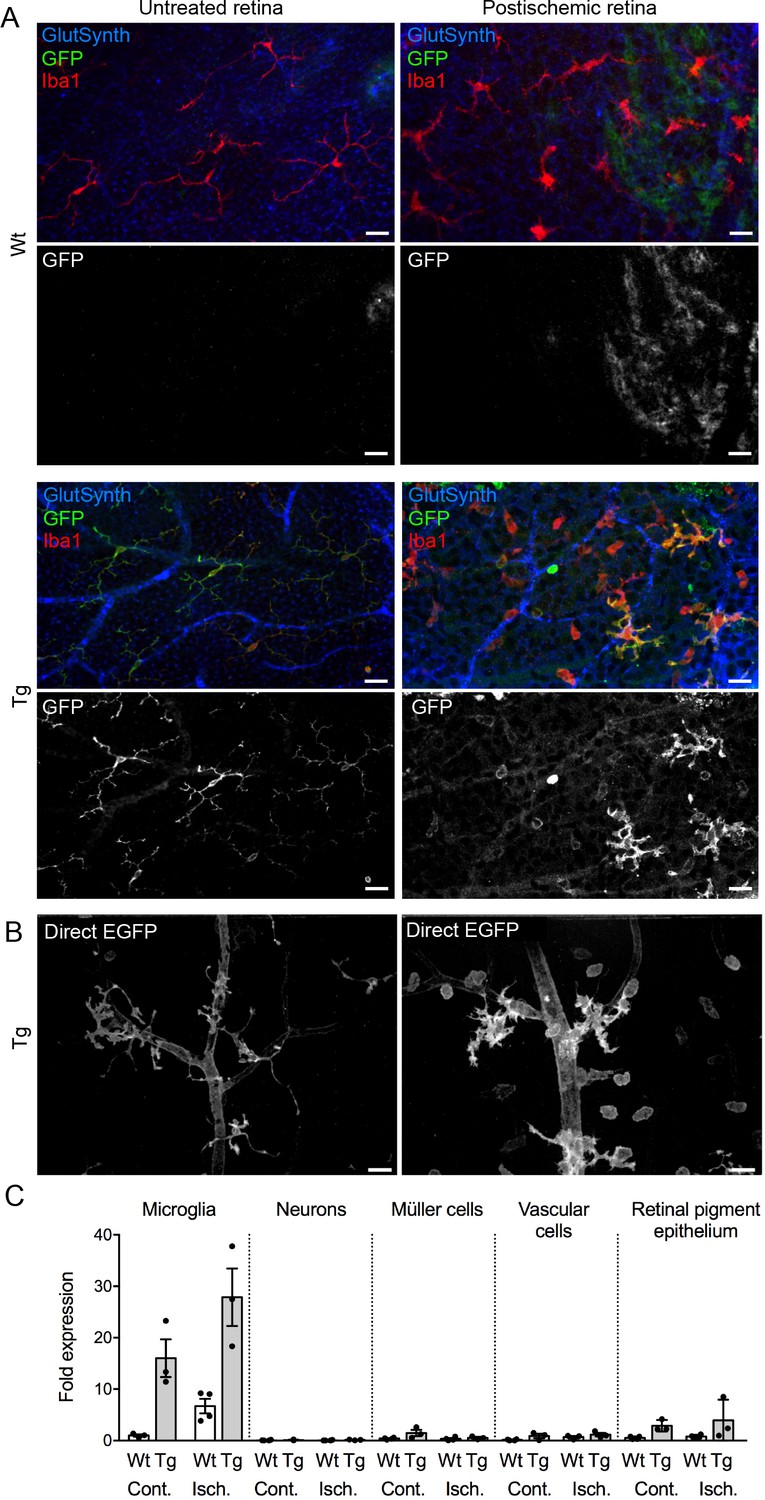
Upregulation of P2X7 expression in postischemic retinae 3 days post injury (dpi) of wt and P2X7-EGFP transgenic animals.
(A) Retinal flat mount scanned at the plane of the ganglion cell layer (GCL) to delineate microglia residing in this retinal layer. Co-labeling for GFP (600 101 215, Rockland), Iba1 (marker for microglia/macrophages) and glutamine synthetase (marker for Müller glia) shows that EGFP exclusively co-localizes with microglia and in the postischemic retina also with morphologically distinct Iba1-positive cells that likely correspond to infiltrated macrophages. Note unspecific vessel staining caused by the secondary antibody against glutamine synthetase. Scale bars: 20 µm. n = 2 individual line 61 in FVB/C57b/6 hybrid mice. (B) Direct EGFP-fluorescence captured at identical microscope settings in non-fixed retinal flatmounts focused on the GCL shows increased EGFP signal in vessels and microglia and an increase in the number of microglia and/or macrophages. Scale bar: 20 µm. (C) P2X7 expression determined by quantitative real-time PCR on the indicated cell types isolated by immunomagnetic separation from control and postischemic (3 dpi) retinae of line 17 P2X7-EGFP transgenic mice in (C57b/6 background). Bars represent mean ±SEM and include data from 3 to 4 animals/each genotype/condition. Significance between expression level in the untreated control eye of the respective genotype was analyzed using unpaired two-tailed Mann-Whitney-U-test and indicated as: *p<0.05. Data were normalized to the housekeeper pyruvate dehydrogenase beta (PDHB) and results are presented as relative expression levels compared to that in microglia of healthy wild-type retinae. Increase in P2X7 signal in RPE is most likely due to contamination by infiltrating immune cells.
Figure 5—figure supplement 2
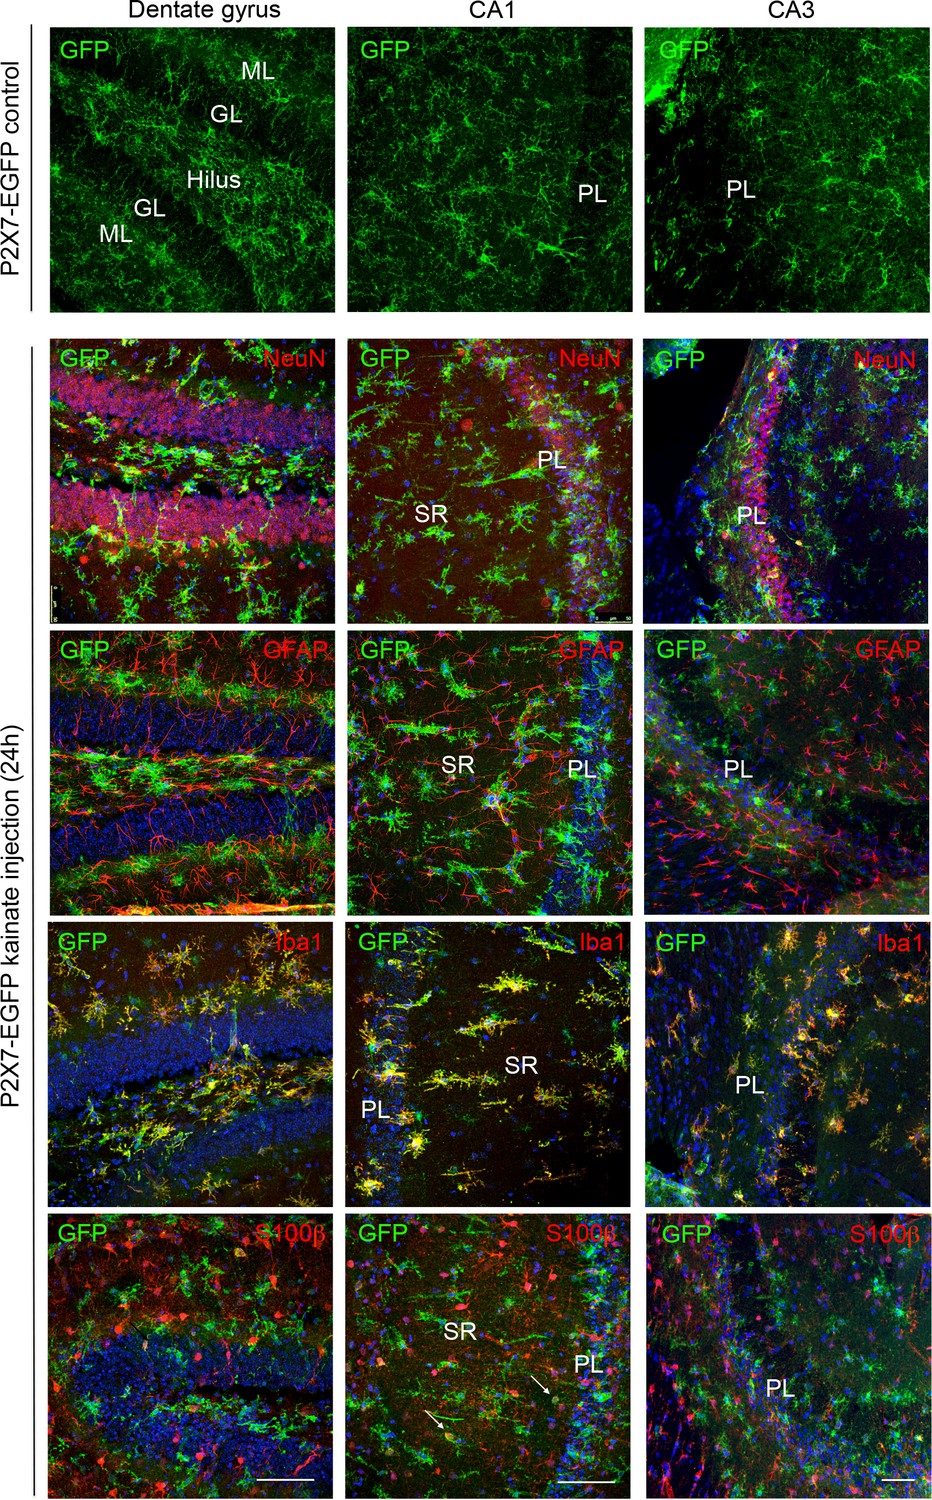
Cell type-specific P2X7-EGFP expression in the three hippocampal subfields (DG, CA1, and CA3) upon induction of status epilepticus.
Upper panel EGFP (A10262, Thermo Fisher Scientific) staining of control-injected transgenic mice shows non-activated microglia. Lower panels Double labeling of P2X7-EGFP with neuronal marker NeuN, astrocyte marker GFAP (MAB360, Millipore), microglial marker Iba-1, and S100β (S2532, Sigma Aldrich) (in red) 24 hr after intraamygdala kainic acid-induced status epilepticus. Cell nuclei were counterstained with DAPI (blue). Scale bar: 50 μm.
Figure 5—figure supplement 3
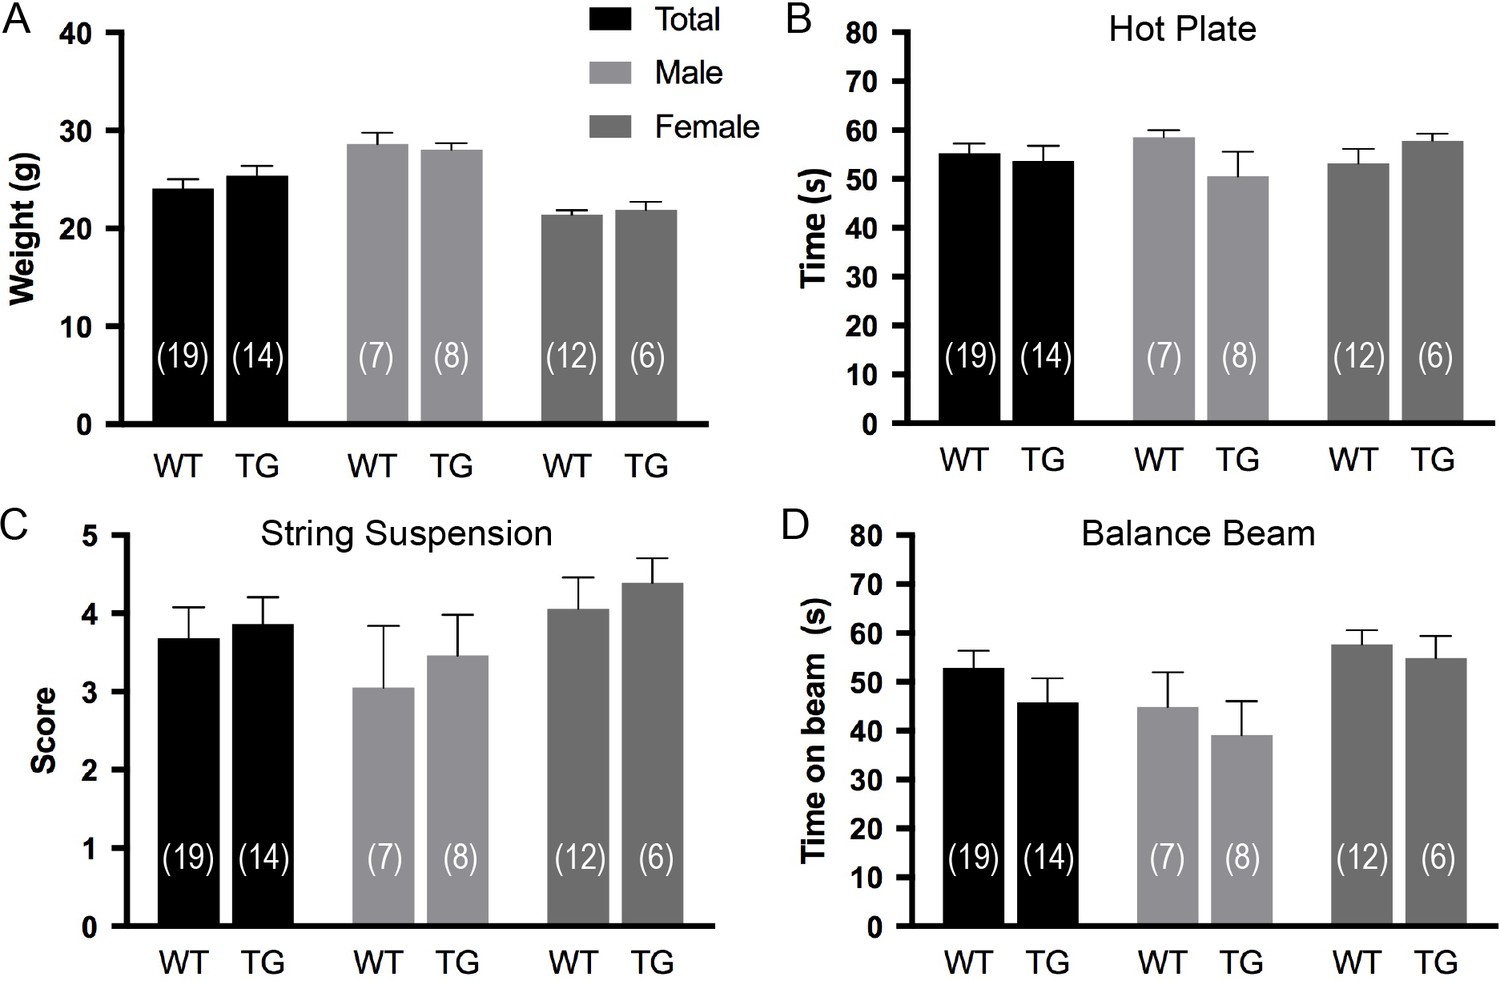
Effects of P2X7 overexpression under physiological conditions.
Overexpression of P2X7 has no obvious impact on body weight (A), pain response (B), and motor coordination (C and D). Data are represented as means ± SEM from the indicated numbers of mice per group. A group size of 15 was estimated using G*power to determine a biologically significant difference of 25%(Zhang et al., 2005) (SD <0.2) with an α error probability of 5% and a power of 95% (Wilcoxon-Mann-Whitney U test) but only one cohort was tested as no obvious trend was detected.
Tables
Table 1
Mice
https://doi.org/10.7554/eLife.36217.006| Strain | Official name | Origin |
|---|---|---|
| P2X7-EGFP P2X7451P-EGFP | FVB/N-Tg(RP24-114E20P2X7-StrepHis-EGFP)Ani Lines 46, 59 (also in BL/6N), 61 FVB/N-Tg(RP24-114E20P2X7451P-StrepHis-EGFP)Ani Lines 15, 17 (also in BL/6N) Transgenes were backcrossed into C57BL/6 for at least eight generations | This study This study |
| P2rx7fl/fl | B6-P2rx7tm1c(EUCOMM)Wtsi | This study (B6-P2rx7tm1a(EUCOMM)Wtsi x FLPe deleter mouse Gt(ROSA)26Sortm1(FLP1)Dym [Farley et al., 2000]) |
| P2rx7-/- | B6-P2rx7tm1d(EUCOMM)Wtsi | This study (P2rx7fl/fl x EIIa-Cre mouse Tg(EIIa-cre)C5379Lmgd [Lakso et al., 1996]) |
| P2x7 rescue | B6-P2rx7tm1d(EUCOMM)Wtsi//B6.Cg-Tg(RP24-114E20P2X7-StrepHis-EGFP)Ani | This study (P2rx7-/- x P2X7-EGFP line 59 and 17 in C57BL/6) |
| Microglia-specific P2X7 knock-out | B6-P2rx7tm1c(EUCOMM)Wtsi//B6-Cx3cr1tm1.1(cre)Jung | This study (P2rx7fl/fl x Cx3cr1tm1.1(cre)Jung [Yona et al., 2013]) |
| Oligodendrocyte-specific P2X7 knock-out | B6-P2rx7tm1c(EUCOMM)Wtsi//B6- Cnptm1(cre)Kan | This study (P2rx7fl/fl x CNP-Cre mouse Cnptm1(cre)Kan [Lappe-Siefke et al., 2003]) |
-
If not otherwise noted, mice of both genders (9–14 weeks) in FVB/N background were used. Given that FVB/NJ mice are homozygous for the retinal degeneration 1 allele of Pde6brd1, retinal stainings were performed in C57b/6 or FVB/N/C57b/6 hybrid mice.
Table 2
P2X7-EGFP protein expression in comparison with other P2X7 (reporter) mouse models (Tg(P2rx7 EGFP)FY174Gsat, www.gensat.org, P2rx7hP2RX7 (Metzger et al., 2017)
https://doi.org/10.7554/eLife.36217.010| Transgenic P2X7-EGFP | P2X7 reporter (Gensat) | Humanized P2X7 | |
|---|---|---|---|
| Brain region | Fusion protein | Soluble EGFP | RNA |
| Hippocampus | M (ML+), O, A | N, G | N (CA3+), O, A |
| Cerebral Cort. | M, O, A | N, G | M, O, A |
| Midbrain | M, O | N, G | nd |
| Thalamus | M, O | G | nd |
| Hypothalamus | M, O | N, G | nd |
| Cerebellum | M, O, A, BG (ML+) | N, G, BG (ML+) | O, A |
| Olfactory bulb | M | G | nd |
| Ventricle | EC | nd | nd |
| Corpus callosum | M, O | nd | nd |
-
A high density of positive cells in a specific area is indicated by +whereas the presence in specific cells or structures is indicated by letters (N, neuron; PC, Purkinje cell; A, astrocyte; M, microglia; O, oligodendrocyte; BG, Bergmann glia; G, glia-like; EC, ependymal cells, ML, molecular layer; GCL, granular cell layer; nd, not determined). Data from the Gensat mouse are according to information given on the gensat web site (www.gensat.org) for fluorescence images listed under confirmed expression veracity.
Key resources table
| Type | Designation | Source or reference | Identifiers | Additional information |
|---|---|---|---|---|
| BAC clone | BAC clone, RP24-114E20 | Children’s Hospital Oakland Research Institute, Oakland, CA | Strep-tagII-Gly-7xHis-Gly-EGFP-sequence was inserted into the P2r × 7 BAC clone RP24-114E20 | |
| Strain (Mus musculus) | P2 × 7 EGFP (FVB/N-Tg(RP24-114E20P2 × 7 StrepHis-EGFP)Ani) | this paper | Lines: 46, 59 (also in BL/6N), 61 | |
| Strain (Mus musculus) | P2X7451P-EGFP (FVB/N-Tg(RP24-114E20P2 × 7451P-StrepHis-EGFP)Ani) | this paper | Lines: 15, 17 (also in BL/6N) Transgenes were backcrossed into C57BL/6 for at least eight generations | |
| Strain (Mus musculus) | B6-P2r × 7tm1a(EUCOMM)Wtsi | European Mutant Mouse Archive | MGI:4432150 | |
| Strain (Mus musculus) | Gt(ROSA)26Sortm1(FLP1)Dym | Farley FW, et al., Genesis. 2000 | MGI:2429412 | FLPe deleter |
| Strain (Mus musculus) | Tg(EIIa-cre)C5379Lmgd | Lakso M, et al., Proc Natl Acad Sci U S A. 1996 | MGI:2137691 | EIIa-Cre mouse |
| Strain (Mus musculus) | B6-Cx3cr1tm1.1(cre)Jung | Yona S, et al., Immunity. 2013 | MGI:5467983 | Cx3cr-1-Cre |
| Strain (Mus musculus) | B6- Cnptm1(cre)Kan | Lappe-Siefke C, et al., Nat Genet. 2003 | MGI:3051635 | CNP-Cre |
| Antibody | P2 × 7 C-term (rb pAb) | Synaptic Systems | Cat# 177003, RRID: AB_887755 | WB 1:1500 IHC 1:500 |
| Antibody | P2 × 7 ECD (rb pAb) | Alomone | Cat# APR-008 RRID:AB_2040065 | WB 1:500 IHC 1:500 |
| Antibody | ß-Actin (ms AC-15) | Sigma-Aldrich | Cat# A3854 RRID:AB_262011 | WB 1:15.000 |
| Antibody | Vinculin (ms hVin-1) | Sigma-Aldrich | Cat# V9131 RRID:AB_477629 | WB 1:10.000 |
| Antibody | 800CW gt anti-ms | LI-COR | Cat# 925–32210 RRID:AB_2687825 | WB 1:15.000 |
| Antibody | 680RD dk anti-rb | LI-COR | Cat# 925–68073 RRID:AB_2716687 | WB 1:15.000 |
| Antibody | 680RD gt anti-rb | LI-COR | Cat# 925–68071 RRID:AB_2721181 | WB 1:15.000 |
| Antibody | CD11b-perCP (rat M1/70) | BioLegend | Cat# 101230, RRID:AB_2129374 | FACS 1:100 |
| Antibody | CD45-PE-Cy7 (rat 30-F11) | BioLegend | Cat# 103114, RRID:AB_312979 | FACS 1:100 |
| Antibody | CD16/32 (Fc-Block, rat 2.4G2) | BioXcell | Cat# BE0307 RRID:AB_2736987 | FACS 1:100 |
| Antibody | P2 × 7 C-term. (rb pAb) | Alomone | Cat# APR-004 RRID:AB_2040068 | IHC 1:500 |
| Antibody | P2 × 7 ECD, 7E2-rbIgG | Nolte lab | Nanobody rbIgG fusion construct | (0.1 ug/ml) |
| Antibody | GFP (rb pAb) | Abcam | Cat# ab6556 RRID:AB_305564 | IHC 1:2000 |
| Antibody | GFP (chk pAb) | Thermo Fisher | Cat# A10262, RRID:AB_2534023 | IHC 1:400 |
| Antibody | GFP (rb pAb) | Thermo Fisher | Cat# A6455, RRID:AB_221570 | IHC 1:250 |
| Antibody | GFP (rb pAb) | Thermo Fisher | Cat# A11122, RRID:AB_221569 | IHC 1:400 |
| Antibody | GFP (gt pAb) | Rockland | Cat# 600-101-215 RRID:AB_218182 | IHC 1:200 |
| Antibody | MAP2 (ms 198A5) | Synaptic Systems | Cat# 188011, RRID: AB_2147096 | IHC 1:500 |
| Antibody | NeuN (ms A60) | Millipore | Cat# MAB377 RRID:AB_2298772 | IHC 1:500 |
| Antibody | GFAP (ms GA5) | Millipore/Sigma-Aldrich | Cat# MAB360/G6171 RRID:AB_11212597/AB_1840893 | IHC 1:200/500 |
| Antibody | GFAP (rb pAb) | Dako | Cat# Z0334, RRID:AB_10013382 | IHC 1:1000 |
| Antibody | S100ß (rb pAb) | Synaptic Systems | Cat# 287003, RRID: AB_2620024 | IHC 1:500 |
| Antibody | S100ß (rb pAb) | Abcam | ab7853 (not longer available) | IHC 1:1000 |
| Antibody | S100ß (ms SHB1) | Sigma-Aldrich | Cat# S2532, RRID:AB_477499 | IHC 1:400 |
| Antibody | Iba1 (rb pAb) | WAKO | Cat# 019–19741 RRID:AB_839504 | IHC 1:100 |
| Antibody | Olig 2 (ms 211F1.1) | Millipore | Cat# MABN50 RRID:AB_10807410 | IHC 1:200 |
| Antibody | NG2 (rb pAb) | Millipore | Cat# AB5320 RRID:AB_91789 | IHC 1:500 |
| Antibody | VGAT (ms CL2793) | Molecular Probes | Cat# MA5-24643 RRID:AB_2637258 | IHC 1:200 |
| Antibody | vGlut1 (ms 317G6) | Synaptic Systems | Cat# 135511, RRID: AB_887879 | IHC 1:100 |
| Antibody | vGlut2 (rb pAb) | Synaptic Systems | Cat# 135 403, RRID:AB_887883 | IHC 1:100 |
| Antibody | PSD95 (ms 108E10) | Synaptic Systems | Cat# 124011, RRID:AB_10804286 | IHC 1:100/500 |
| Antibody | Calretinin (ms 37C9) | Synaptic Systems | Cat# 214111, RRID: AB_2619904 | IHC 1:1000 |
| Antibody | Calbindin D28k (ms 351C10) | Synaptic Systems | Cat# 214011, RRID:AB_2068201 | IHC 1:200 |
| Antibody | Calbindin D28k (gp pAb) | Synaptic Systems | Cat# 214 005, RRID:AB_2619902 | IHC 1:100 (only used for data confirmation, not in manuscript) |
| Antibody | Synaptophysin (ms pAb) | Synaptic Systems | Cat# 101011, RRID:AB_887824 | IHC 1:500 |
| Antibody | Nav 1.6 (rb pAb) | Alomone | Cat# ASC009 RRID:AB_2040202 | IHC 1:100/500 |
| Antibody | Caspr (ms K65/35) | Neuromab | Cat# 75–001 RRID:AB_2083496 | IHC 1:1000 |
| Antibody | Cre (ms 2D8) | Millipore | Cat# MAB3120 RRID:AB_2085748 | IHC 1:200 |
| Antibody | ß3-Turbulin (gp pAb) | Synaptic Systems | Cat# 302304 RRID:AB_10805138 | IHC 1:200 |
| Antibody | GlutSynth (ms GS-6) | Millipore | Cat# MAB302 RRID:AB_2110656 | IHC 1:500 |
| Antibody | PKCα (rb Y124) | Abcam | Cat# ab32376, RRID:AB_777294 | IHC 1:200 |
| Antibody | TH (rb pAb) | Millipore | Cat# AB152 RRID:AB_390204 | IHC 1:200 |
| Antibody | Nestin (ms rat-401) | Millipore | Cat# MAB353 RRID:AB_94911 | IHC 1:100 |
| Antibody | Sox9 (rb pAb) | Novus bio | Cat# NBP1-85551-25 RRID:AB_11002706 | IHC 1:100 |
| Antibody | MPZ (rb pAb) | Abcam | Cat# ab31851, RRID:AB_2144668 | IHC 1:200 |
| Antibody | Hu C/D (ms 16A11) | Thermo Fisher | Cat# A-21271, RRID:AB_221448 | IHC 1:200 |
| Antibody | A594 gt anti-ms | Thermo Fisher | Cat# A11032 RRID:AB_2534091 | IHC 1:400 |
| Antibody | A594 gt anti-rat | Thermo Fisher | Cat# A11007, RRID:AB_10561522 | IHC 1:400 |
| Antibody | A546 gt anti-ms | Thermo Fisher | Cat# A-11003, RRID:AB_2534071 | IHC 1:400 |
| Antibody | A488 gt anti-rb | Thermo Fisher | Cat# A11008, RRID:AB_143165 | IHC 1:400 |
| Antibody | A488 gt anti-chk | Thermo Fisher | Cat# A11039, RRID:AB_2534096 | IHC 1:400 |
| Antibody | A633 gt anti-rb | Thermo Fisher | Cat# A21070, RRID:AB_2535731 | IHC 1:400 |
| Antibody | A633 gt anti-gp | Thermo Fisher | Cat# A21105, RRID:AB_1500611 | IHC 1:400 |
| Antibody | Cy3 gt anti-rb | Jachkson Res. | Cat# 111-165-003, RRID:AB_2338000 | IHC 1:300 |
| Antibody | Cy3 gt anti-ms | Jachkson Res. | Cat# 115-165-146, RRID:AB_2338690 | IHC 1:300 |
Additional files
-
Supplementary file 1
List of probes.
- https://doi.org/10.7554/eLife.36217.025
-
Supplementary file 2
List of primers.
- https://doi.org/10.7554/eLife.36217.026
-
Transparent reporting form
- https://doi.org/10.7554/eLife.36217.027
Download links
A two-part list of links to download the article, or parts of the article, in various formats.
Downloads (link to download the article as PDF)
Open citations (links to open the citations from this article in various online reference manager services)
Cite this article (links to download the citations from this article in formats compatible with various reference manager tools)
Re-evaluation of neuronal P2X7 expression using novel mouse models and a P2X7-specific nanobody
eLife 7:e36217.
https://doi.org/10.7554/eLife.36217


