Long-term live imaging of the Drosophila adult midgut reveals real-time dynamics of division, differentiation and loss
- Stanford University School of Medicine, United States
- Stanford University, United States
Figures
Figure 1 with 3 supplements
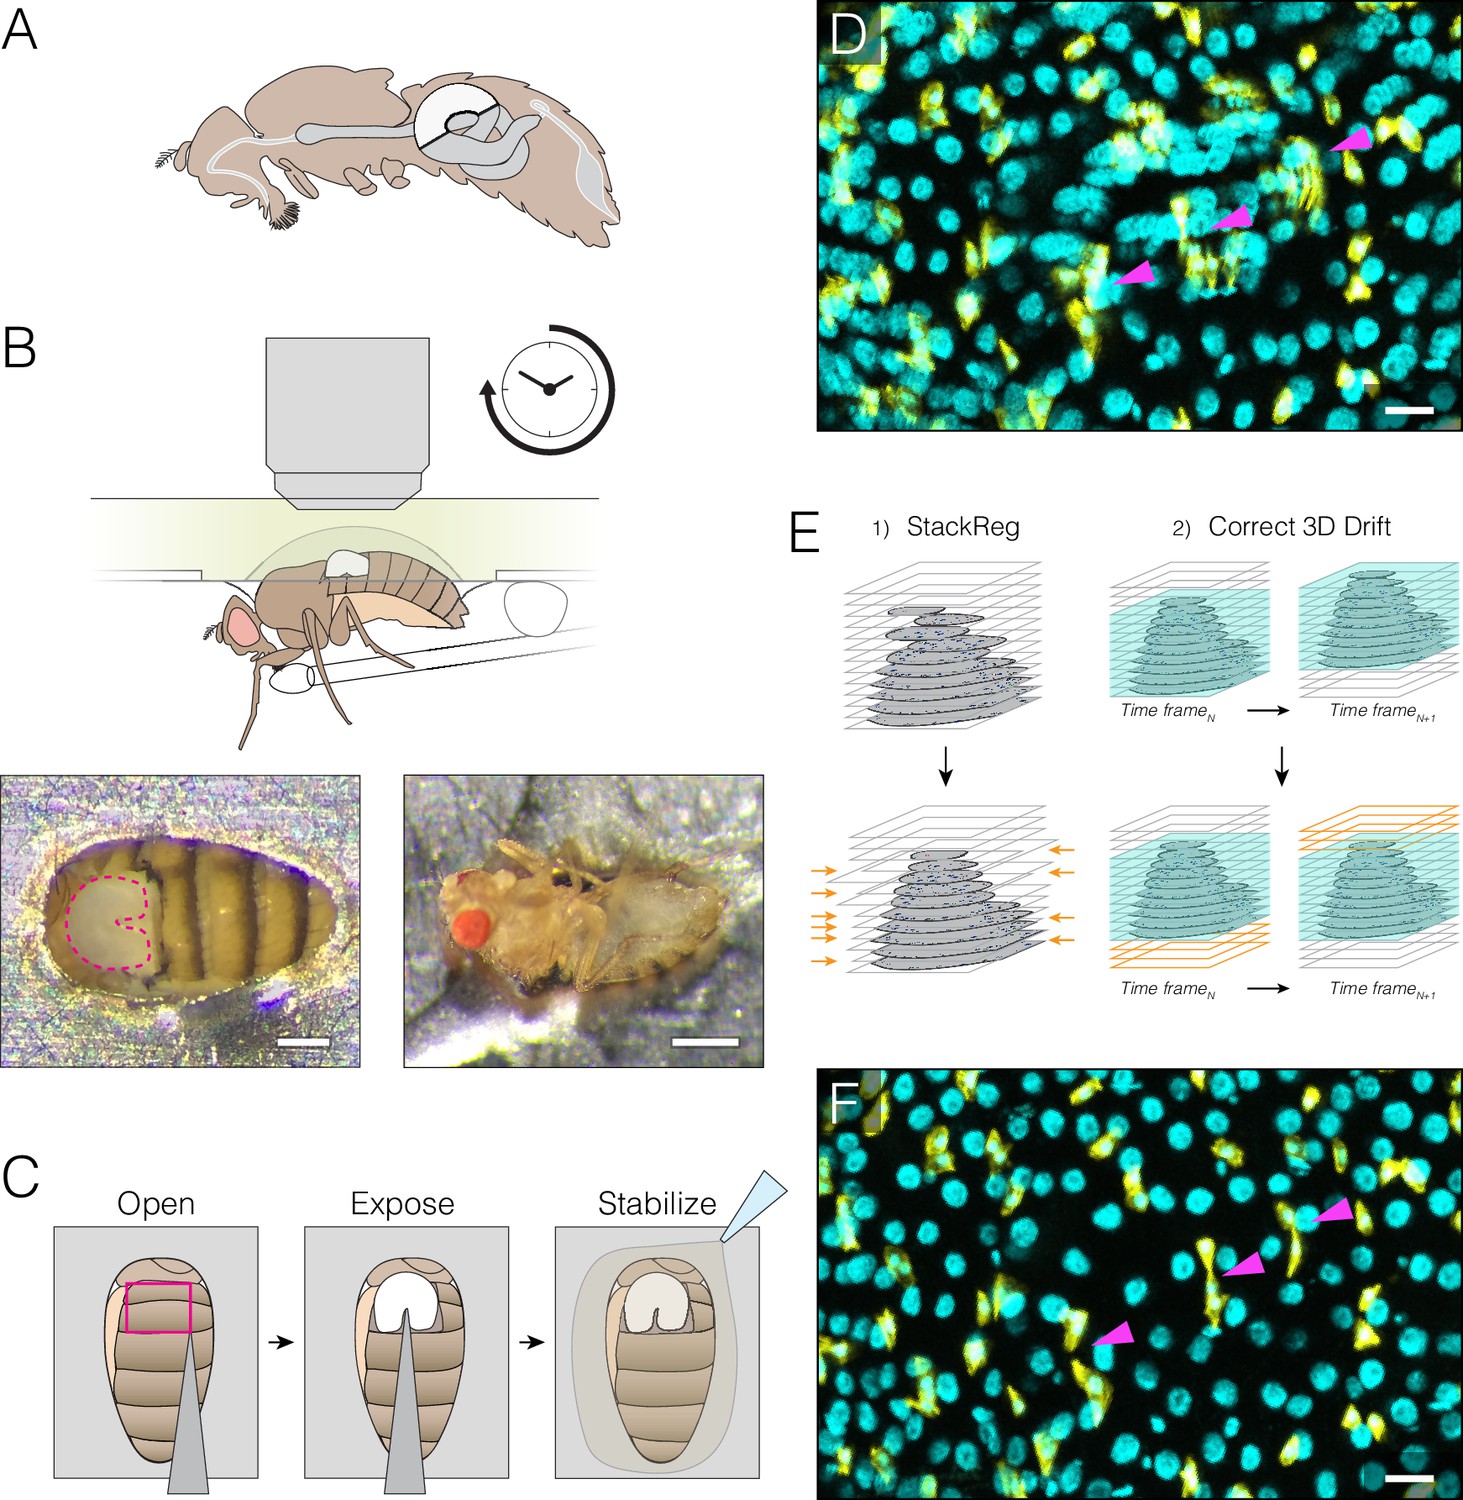
Extended imaging of the midgut in live Drosophila adults.
(A) Adult female midgut in situ, sagittal view. The white highlighted area indicates region R4a-b, also known as P1-2, (Buchon et al., 2013a; Marianes and Spradling, 2013)) of the midgut that will be exposed for imaging. (B–C) The midgut is accessed through a small cuticular window cut in the back of a live animal. (B) (Top) Schematic of the imaging apparatus. The animal is affixed to a modified petri dish ‘mount’. The chamber of the mount contains media. The underside of the mount supports a feeder tube. See and Fig. 1-fig. supplement 2. (Bottom) Dorsal (left) and ventral (right) views of an animal in the mount. In the left panel, the exposed midgut is outlined by the magenta dotted line. Scale bars: 0.25 mm (left), 0.5 mm (right). See Video 4. (C), Steps in preparing the midgut for imaging. See Video 1 tutorial. (D–F) Registration macros are applied post-acquisition to correct the blurring caused by tissue movements. (D), Before registration, blurring and duplications (arrowheads) are evident. This panel is a raw z-series projection of one movie time point. (E), During registration, two ImageJ plugins are applied in series. (1) 'StackReg' corrects for tissue movement during z-stack acquisition at a single time point. (2) 'Correct 3D Drift' corrects for global volume movements over multiple time points. (F), After registration, blurring and duplications are negligible. Cyan, all nuclei (ubi-his2av::mRFP); yellow, stem cells and enteroblasts (esg >LifeactGFP). Scale bars, 20 μm. See Video 6.
-
Figure 1—source data 1
Durations, genotypes, animal ages, and animal viability for movies analyzed in this study.
- https://doi.org/10.7554/eLife.36248.006
Figure 1—figure supplement 1
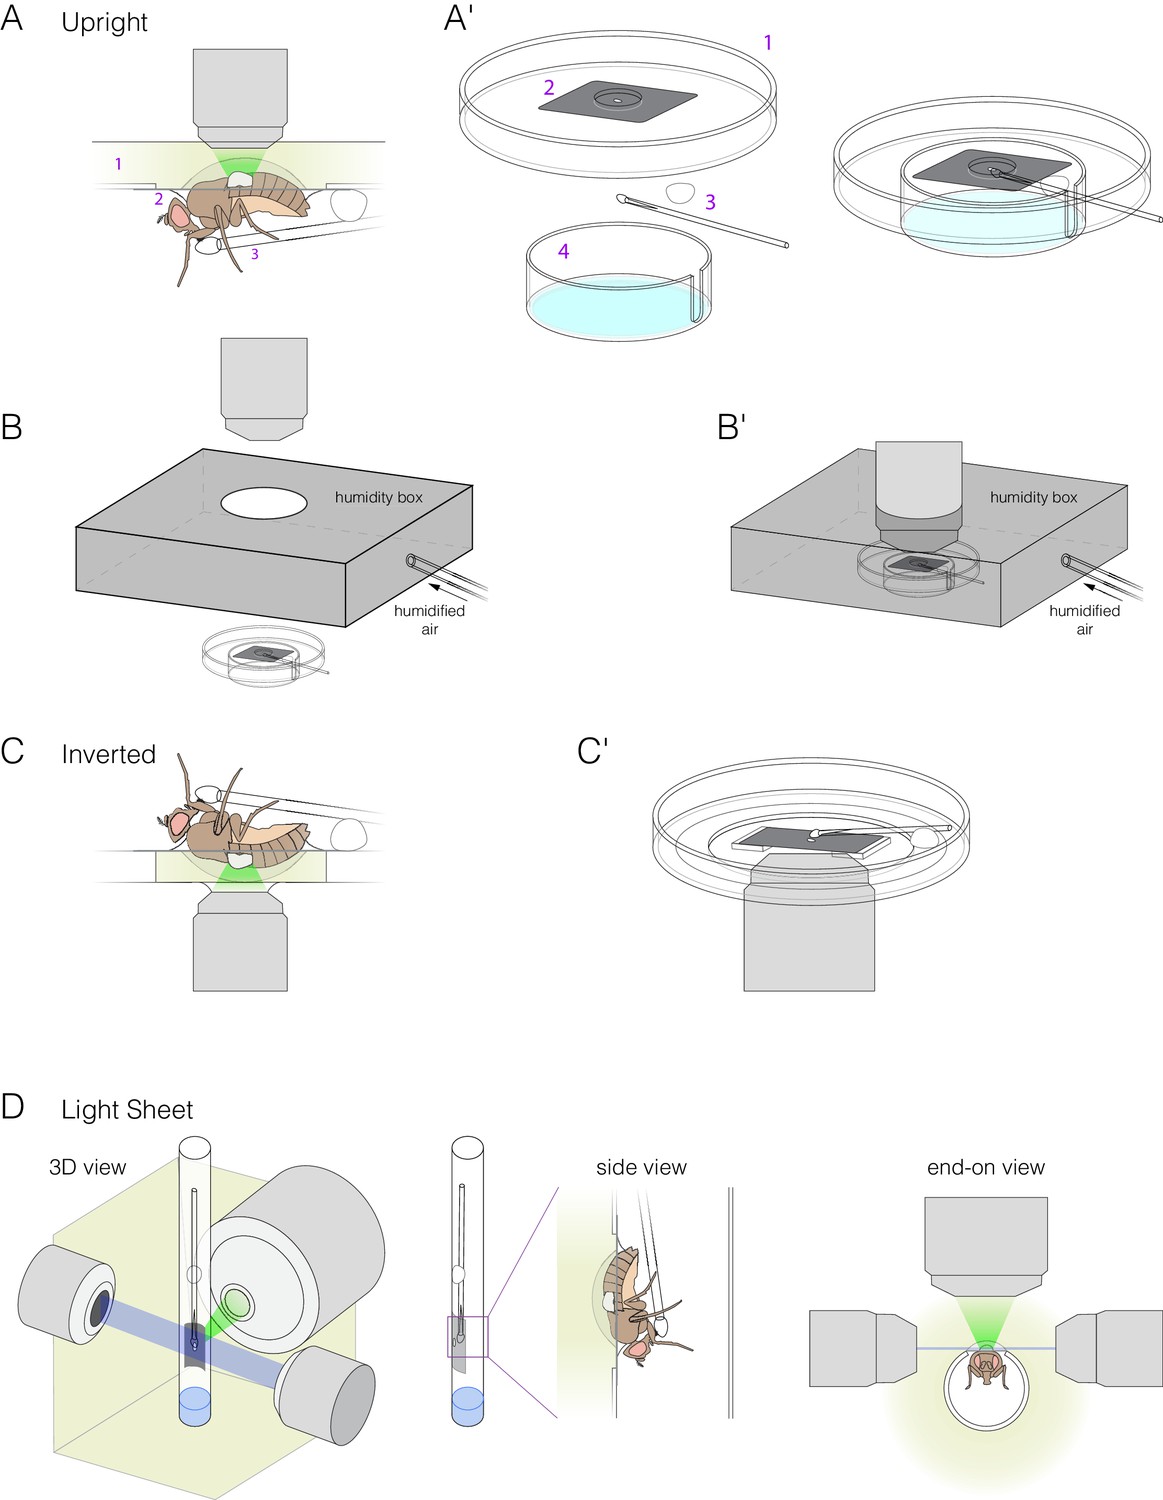
Mounts for upright, inverted and light-sheet microscopes.
(A–B) Mount for upright microscopes. (A) Schematic of an animal in the mount on a microscope stage. (A′) Isometric illustrations of mount components: (1) modified petri dish, (2) metal shim with cutout for Drosophila abdomen (Fig. 1-fig. supplement 2Figure 1—figure supplement 2), (3) feeder tube, and (4) bottom chamber with wet Kimwipes (light blue). (Bottom chamber is not shown in (A).) (B) Schematic of the humidity box that encloses the mount. Unassembled (B) and assembled (B′) views are shown. (C) Mount for inverted microscopes. The midgut is imaged through a glass-bottomed petri dish. To elevate the animal, two spacers are glued to the bottom of the dish, and the metal shim is affixed to the spacers. Media is added to the level of the spacers. (D) Mount for light-sheet microscopes. The barrel of a 1 ml syringe is modified to fit the metal shim. The animal and feeder tube are inside the barrel, and the dorsal surface and exposed midgut are outside the barrel. The barrel is submerged in media with one end remaining open to the air. 3D, side and end-on views are shown.
Figure 1—figure supplement 2
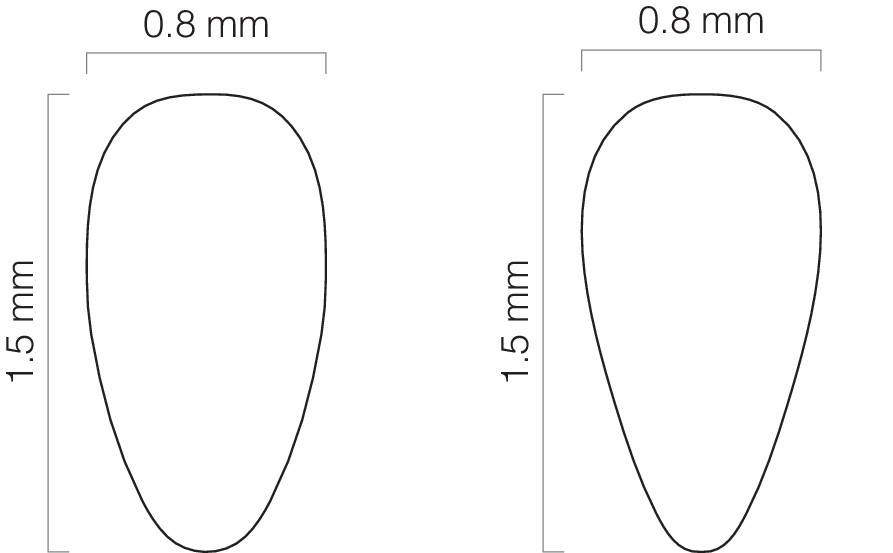
Specifications for abdomen cutouts.
The metal shim of the imaging mount includes a cutout through which the dorsal abdomen is inserted. ‘Fat’ (left) and ‘skinny’ (right) cutouts accommodate differently sized female abdomens. This diagram can be used as a CAD file for automated laser cutters.
Figure 1—figure supplement 3

Cell viability during extended imaging.
Cell viability during extended imaging was evaluated using the cell-death stain Sytox Green. (A) Positive control. To induce cell death, midguts were dissected out of the animals and cultured ex vivo. Sytox+ cells (green) are rare at the start of culture (0 hr) but became abundant after 2.5 hr. (B) Appearance of a Sytox+ cell during extended live imaging. In (A–B), arrowheads point to the same cells before and after becoming Sytox+. Nuclei are colored magenta (ubi-his2av::mRFP). Scale bars, 20 µm. See Video 5. (C) Timeline for the appearance of Sytox+ cells during extended live imaging of three midguts. Each vertical line marks the time at which one Sytox+ midgut cell became visible. A dot marks the end of each imaging session. Yellow box in Midgut 1 marks the timepoints that are shown in Video 5 (10.6–12 h).
Figure 2

Comprehensive, fate-specific tracking and analysis of individual cells.
(A–B) ‘Fate sensor’ midguts enable the live identification of cell types. (A) Stack projection of a single time point from a 10 hr movie (Video 7). Nuclei are distinguishable for four midgut cell types: stem cells (red pseudocolor), enteroblasts (yellow-green pseudocolor), enterocytes (gray, polyploid), and enteroendocrine cells (gray, diploid). Inset shows the zoom region depicted in (B). (B) Genetic design of the fate sensor line (esg >his2b::CFP, GBE-Su(H)-GFP:nls; ubi-his2av::mRFP). Cell types are distinguished by the combinatorial expression of three fluorescent, nuclear-localized markers: enterocytes/enteroendocrine cells (His2ab::mRFP only), stem cells (His2ab::mRFP, His2b::CFP), and enteroblasts (His2ab::mRFP, His2b::CFP, GFP:nls). All scale bars, 10 μm. (C–D) Workflow to identify, track and analyze cells in volumetric movies. (C) Nuclei from raw, multi-channel z-stacks are digitally separated into stem cell, enteroblast, and enterocyte/entero-endocrine populations using channel masks in ImageJ. (D) The three population sets are rendered in 4D in Imaris. Segmentation is performed on each population to identify individual nuclei. Enteroendocrine nuclei are separated from enterocyte nuclei by a size filter. The positions of individual nuclei are correlated between time points to track single cells over time.
Figure 3 with 1 supplement
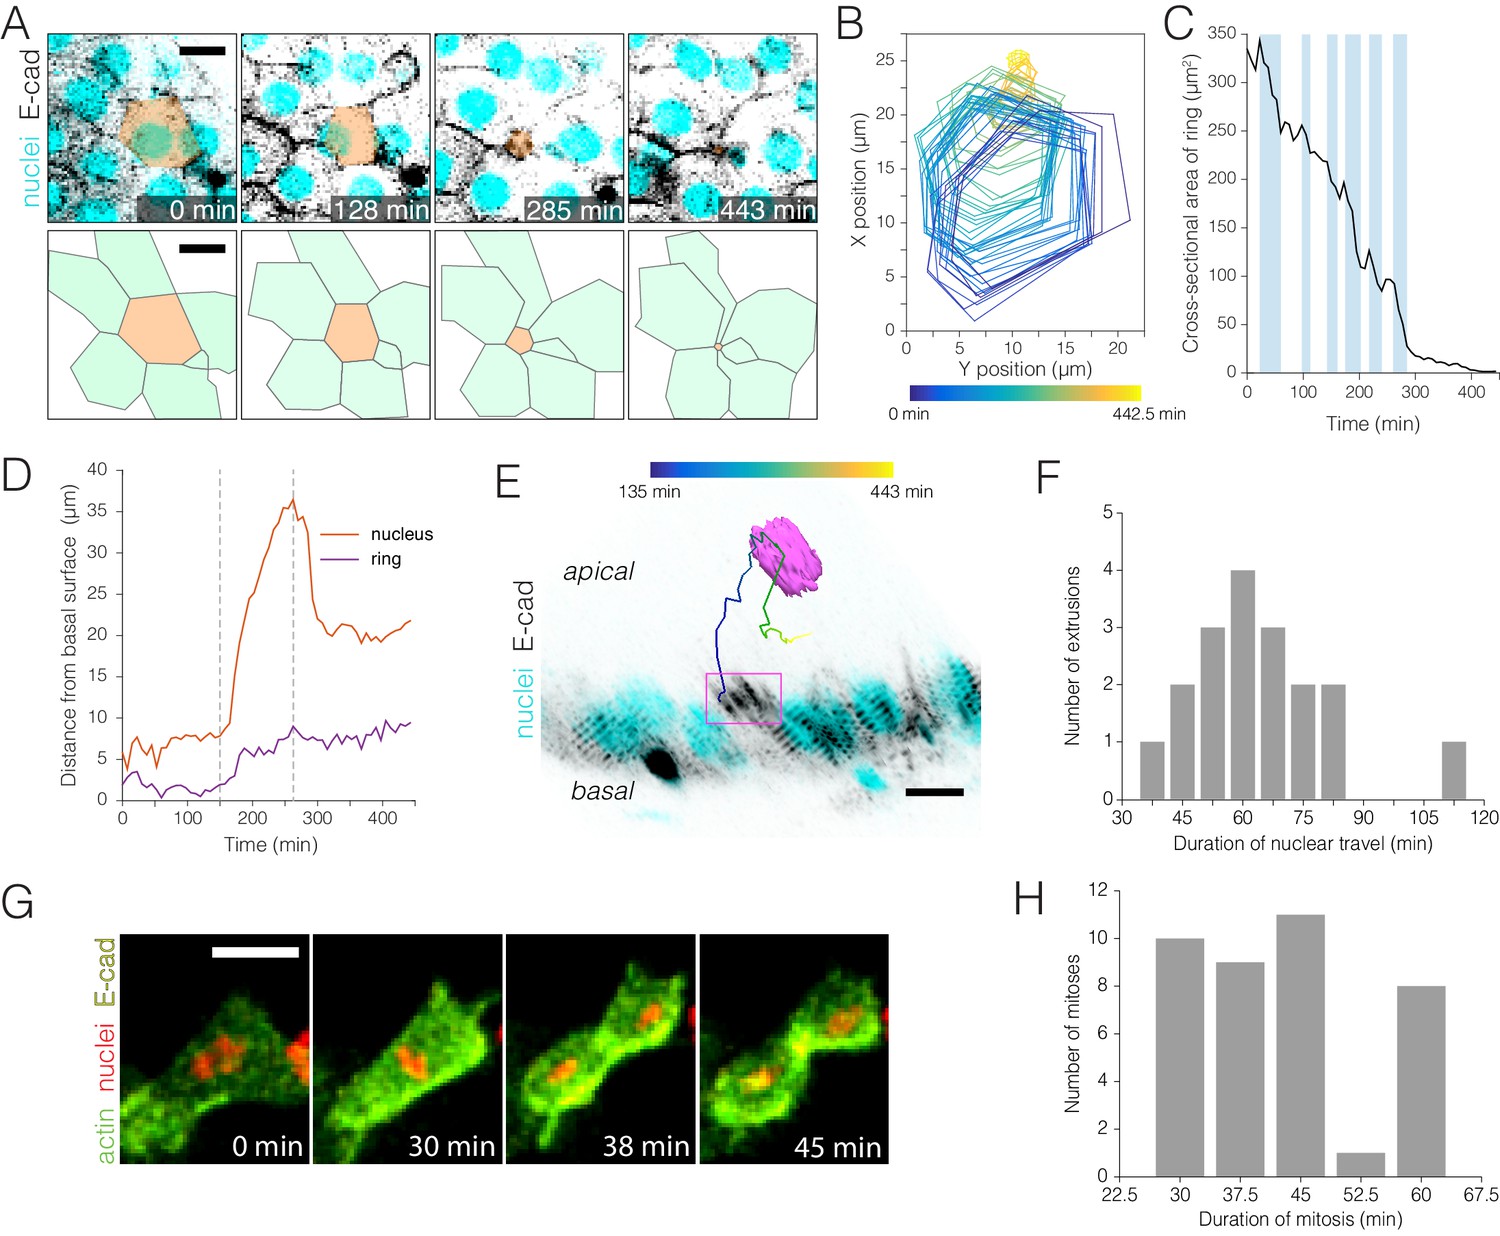
Real-time kinetics of enterocyte extrusion and stem cell mitosis.
(A–E) Morphometric analysis of a single-enterocyte extrusion. (A) Time-lapse sequence (top) and schematic (bottom) showing a planar view of an extrusion event. The basal region of the extruding cell (tan pseudocolor) is outlined by a six-sided ‘ring’ of E-cadherin::YFP (inverted gray, ubi-DE-cadherin::YFP). Over time, the basal ring closes to a point, and the six neighbor cells (green in schematic) draw into a rosette. The time-lapse images are stack projections. Cyan (ubi-his2av::mRFP) labels all nuclei. See Video 8. (B) Spatial ‘footprint’ of the E-cadherin::YFP ring in the epithelial plane over time (violet-yellow color scale). The ring remains six-sided throughout closure. (C) Ring closure occurs via ratcheted constrictions. During ring closure, pulses of constriction (shaded background) are interrupted by pulses of relaxation (unshaded background). See Figure 3—figure supplement 1. (D) Kinetics of apical travel. Displacements of the junctional ring (purple) and the cell nucleus (red) are shown over time for the extrusion in (A). The ring (purple trace) advances incrementally via small, apical-and-basal movements. The nucleus (red trace) ejects rapidly into the lumen, then recoils. Apical nuclear travel starts at t = 150 min and ends at t = 263 min (dotted vertical lines). (E) Orthoview of the extrusion depicted in (A). The multicolored line shows the path of the nucleus over time (violet-yellow color scale). Magenta box denotes the E-cadherin::YFP ring, which is visible in this time point (t = 285 min) as a density of YFP at the apical surface. Inverted gray, E-cadherin::YFP (ubi-DE-cadherin::YFP); cyan, all nuclei (ubi-his2av::mRFP). See Video 9. (F) Durations of apical nuclear travel for 18 single-enterocyte extrusions from six movies. Apical travel lasted 37–112 min with a mean ± standard deviation (SD) of 64 ± 18 min. (G–H) Kinetics of stem cell mitoses. (G) Time-lapse sequence of a mitotic event. Green, actin (esg >LifeactGFP); yellow, E-cadherin (ubi-DE-cadherin::YFP); red, nuclei (ubi-his2av::mRFP). Panels are partial stack projections of the basal epithelium. See Video 11. (H) Durations of mitosis for 39 cell divisions from 11 movies. Mitoses lasted from 30 to 60 min with a mean ± SD of 43 ± 11 min. All scale bars, 10 μm.
-
Figure 3—source data 1
Raw data for Figure 3F and 3H and for mitotic index calculations.
- https://doi.org/10.7554/eLife.36248.018
Figure 3—figure supplement 1

Enterocyte extrusion occurs via ratcheted constriction of a basal junctional ring.
(A–C) Cross-sectional area of the basal junctional ring over time for three enterocyte extrusions (blue, green, red). Pulses of ring constriction (colored background) alternate with pulses of ring stabilization or relaxation (uncolored background). (A'–C') Rates of change in ring area over time. Rings fluctuate between pulses of constriction (negative values) and pulses of stabilization (near-zero) or relaxation (positive values). Rates of constriction are generally higher than rates of relaxation. (D) Side-by-side comparison of ring area over time for the extrusions in (A–C). The initial area of the ring does not correlate with the overall time required for complete closure (Figure 3—figure supplement 1-source data 1). The blue extrusion in ( A) and (D) is identical to that in Figure 3A–E and Videos 8–9.
-
Figure 3—figure supplement 1—source data 1
Raw data for Figure 3—figure supplement 1.
- https://doi.org/10.7554/eLife.36248.017
Figure 4 with 1 supplement
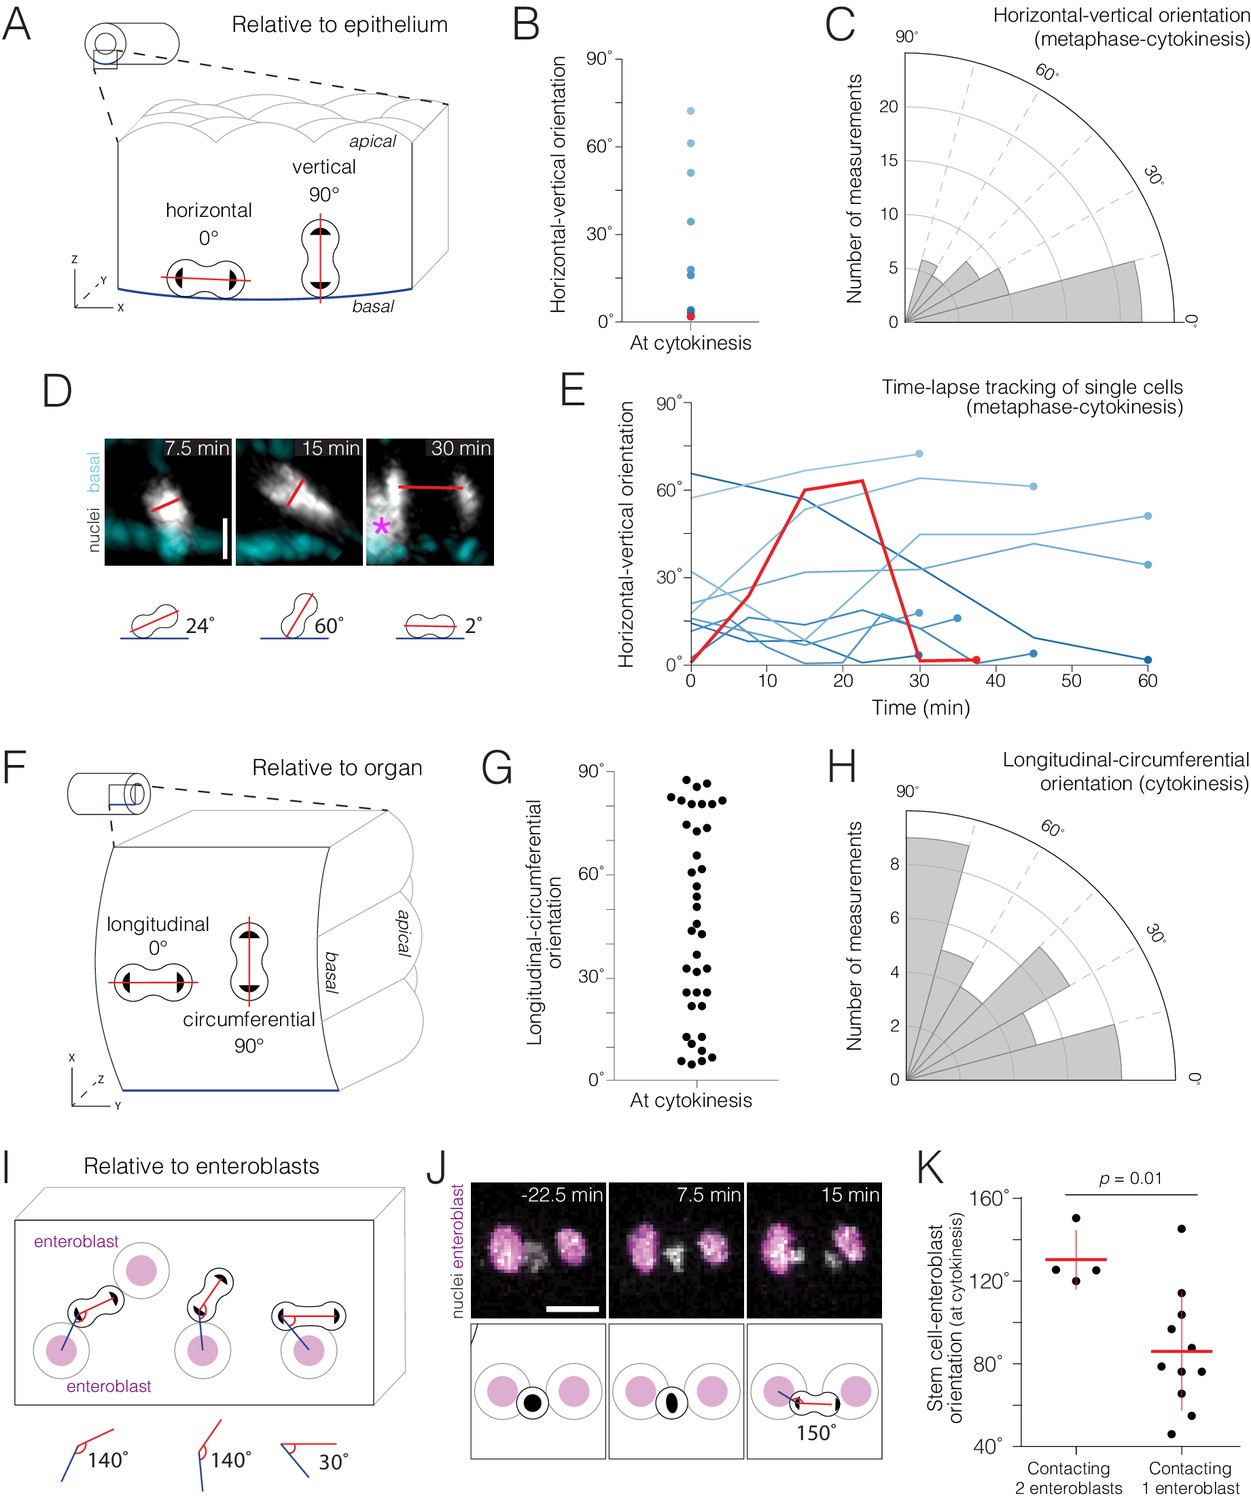
Real-time orientations of stem-cell divisions in three reference frames.
(A–E) Horizontal-vertical orientations are horizontally biased. (A) Schematic of horizontal (0°) and vertical (90°) orientations. See Figure 4—figure supplement 1. (B) Live orientations of 10 dividing cells specifically at cytokinesis. The distribution is biased toward horizontal (<45°). The red point represents the cell in (D). (C) Live orientations of the same 10 cells throughout mitosis. Each measurement is the orientation of one mitotic cell at one time point, from metaphase to cytokinesis (n = 51 measurements). The distribution is biased toward horizontal (<45°). (D) Two re-orientations in a single mitosis. The red line shows the orientation of condensed chromatin (gray, ubi-his2ab::mRFP) relative to the basal basement membrane (cyan, Concanavalin A-Alexa-647). For clarity, in the 7.5 min and 15 min projections, a clipping plane was applied in the gray channel to exclude an enterocyte nucleus; this nucleus is marked by an asterisk at the left edge of the 30 min projection. Scale bar, 5 µm. See Video 12. (E) Mitotic cells frequently re-orient. Each line shows the horizontal-vertical orientations of a single mitotic cell over time. The 10 cells are the same as those in (B) and (C). All lines start at metaphase (t = 0 min) and continue until cytokinesis (t = 30–60 min). Time intervals were either 5, 7.5, or 15 min. Colors are the same as those in (B); the red line represents the orientation of the cell in (D). (F–H) Longitudinal-circumferential orientations are unbiased. (F) Schematic of longitudinal (0°) and circumferential (90°) orientations. (G–H) Live orientations of 38 dividing cells at cytokinesis. Longitudinal (≤45°) and circumferential (>45°) orientations are near-equal. (I–K) Divisions between two flanking enteroblasts align with the enteroblast-enteroblast axis. (I) Schematic of divisions contacting either two or one enteroblast(s). When two enteroblasts are present, the closer enteroblast is used for measurements (see 'Materials and methods'). (J) Division between two enteroblasts. Orientation is nearly parallel to the axis between the enteroblast nuclei (magenta, GBE-Su(H)-GFP:nls). Gray, stem cell and enteroblast nuclei (esg >his2b::CFP). Scale bar, 10 µm. See Video 14. (K) Live orientations of divisions with two or one flanking enteroblast(s). With two enteroblasts (n = 4 of 18 divisions), orientations are near-parallel to the enteroblast-enteroblast axis. With one enteroblast (n = 11 of 18 divisions), orientations are broadly distributed. Orientations were measured at cytokinesis. Means ± SD are shown. Mann-Whitney test, p=0.01.
-
Figure 4—source data 1
Raw data for Figure 4B, 4C, 4D, 4G, 4H, and 4K.
- https://doi.org/10.7554/eLife.36248.021
Figure 4—figure supplement 1
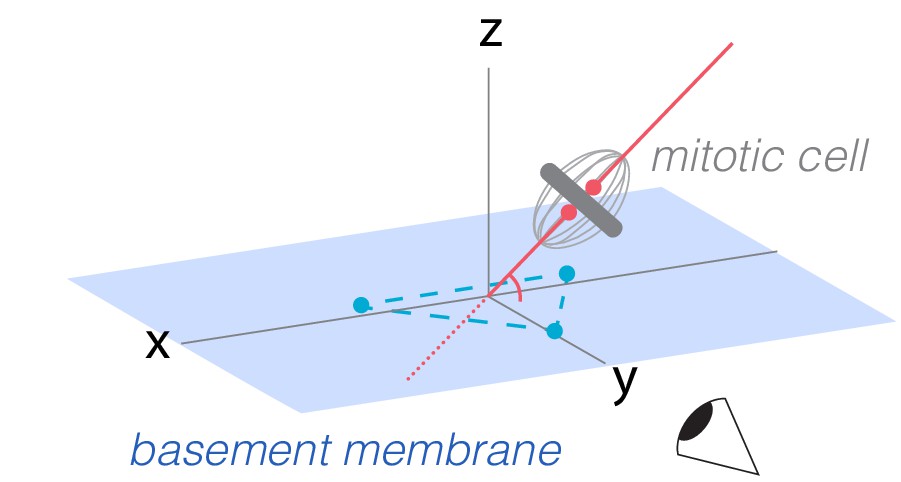
Measurement of horizontal-vertical spindle orientation in space.
Horizontal-vertical orientation of the mitotic spindle was measured as the angle at which the presumptive spindle axis intersected a plane tangent to the basal surface of the mitotic cell. Spindle axes and basal planes were determined by examination of volumetric movies in Imaris. To establish coordinates for the spindle axis (red line), two points (red dots) were placed relative to the condensed chromatin (ubi-his2ab::mRFP). To establish coordinates for the basal plane (blue rectangle), three points (blue dots) were placed on the basal epithelial surface underlying the spindle. The (x,y,z) coordinates of these five points were input into a vector algebra expression to calculate the horizontal-vertical spindle angle (see 'Material and methods').
Figure 5

Whole-population and single-cell analyses of real-time Notch activation.
(A–C) A threshold level of Notch activation distinguishes stem cells and enteroblasts. (A) Single-cell measurements of the Notch reporter GBE-Su(H)-GFP:nls from live movies. Cells additionally co-express esg >his2ab::CFP (magenta) and ubi-his2ab::mRFP (gray). GBE-Su(H)-GFP:nls activation is quantified as GFP:RFP (see 'Materials and methods'). For the indicated cells, GFP:RFP = 0.94, 0.27, and 0.01, respectively. (B) GFP:RFP values correlate with visible GFP and nuclear volume. Progenitor (esg+) cells were scored by eye as either GFP-negative (top) or -positive (bottom). In cells without visible GFP, nearly all GFP:RFP values cluster between 0.0 and 0.2, and most nuclear volumes are small (<200 µm3). In cells with visible GFP, most GFP:RFP values are spread between 0.1 and 1.4, and large nuclear volumes (≥200 µm3), indicative of late enteroblasts, are associated with high GFP:RFPs. The blue dotted lines show the 0.17 enteroblast threshold from (C). (C) GFP:RFP values quantitatively distinguish stem cells and enteroblasts. Gray bars show real-time GFP:RFPs for all esg+ cells in two movies (29,102 GFP:RFPs from 251 cells). Two peaks (GFP:RFP = 0.015, 0.528) are separated by a local minimum (blue dotted line; GFP:RFP = 0.17). Purple bars (C’ inset) show real-time GFP:RFPs for ‘benchmark’ stem cells prior to an observed mitosis (1,294 GFP:RFPs from 18 pre-mitotic cells). The benchmark stem cell distribution matches the left peak of the esg+ cells, and 99.6% of ‘benchmark’ GFP:RFPs are less than 0.17. Data in (B) and (C) are aggregated from two movies. (D–E) Stem-like cells transition to enteroblasts over multiple hours. (D) Real-time activation of GBE-Su(H)-GFP:nls reveals a transition from a stem-like to an enteroblast state. During a transition period lasting 6.9 hr (gray background), GFP:RFP increases from a baseline of ~0.049 at t = 3.5 hr to the enteroblast threshold of 0.17 (blue dotted line) at t = 10.4 hr. After the transition, GFP:RFP continues to increase and reaches 0.364 at t = 15.0 hr. GBE-Su(H)-GFP:nls shown in green (top) and inverted gray (bottom); esg >his2ab::CFP, magenta; ubi-his2ab::mRFP, gray. See Video 15. (E) Kinetics of three additional enteroblast transitions. Initial baseline GFP:RFPs are <0.17. GFP:RFPs increase from baseline to 0.17 during transition periods lasting from 2.3 to 6.9 hr (gray backgrounds: t = 0.3–7.1 hr (top), 10.0–12.4 hr (middle), 9.5–11.8 hr (bottom)). Initial and final GFP:RFPs are as follows: 0.058, 0.426 (top); 0.069, 0.281 (middle); 0.022, 0.257 (bottom). All cells in (D) and (E) were born before imaging started. Genotype in all panels: esgGal4, UAS-his2b::CFP, Su(H)GBE-GFP:nls; ubi-his2av::mRFP. All scale bars are 5 µm.
-
Figure 5—source data 1
Raw measurements for Figure 5.
- https://doi.org/10.7554/eLife.36248.023
Figure 6 with 1 supplement
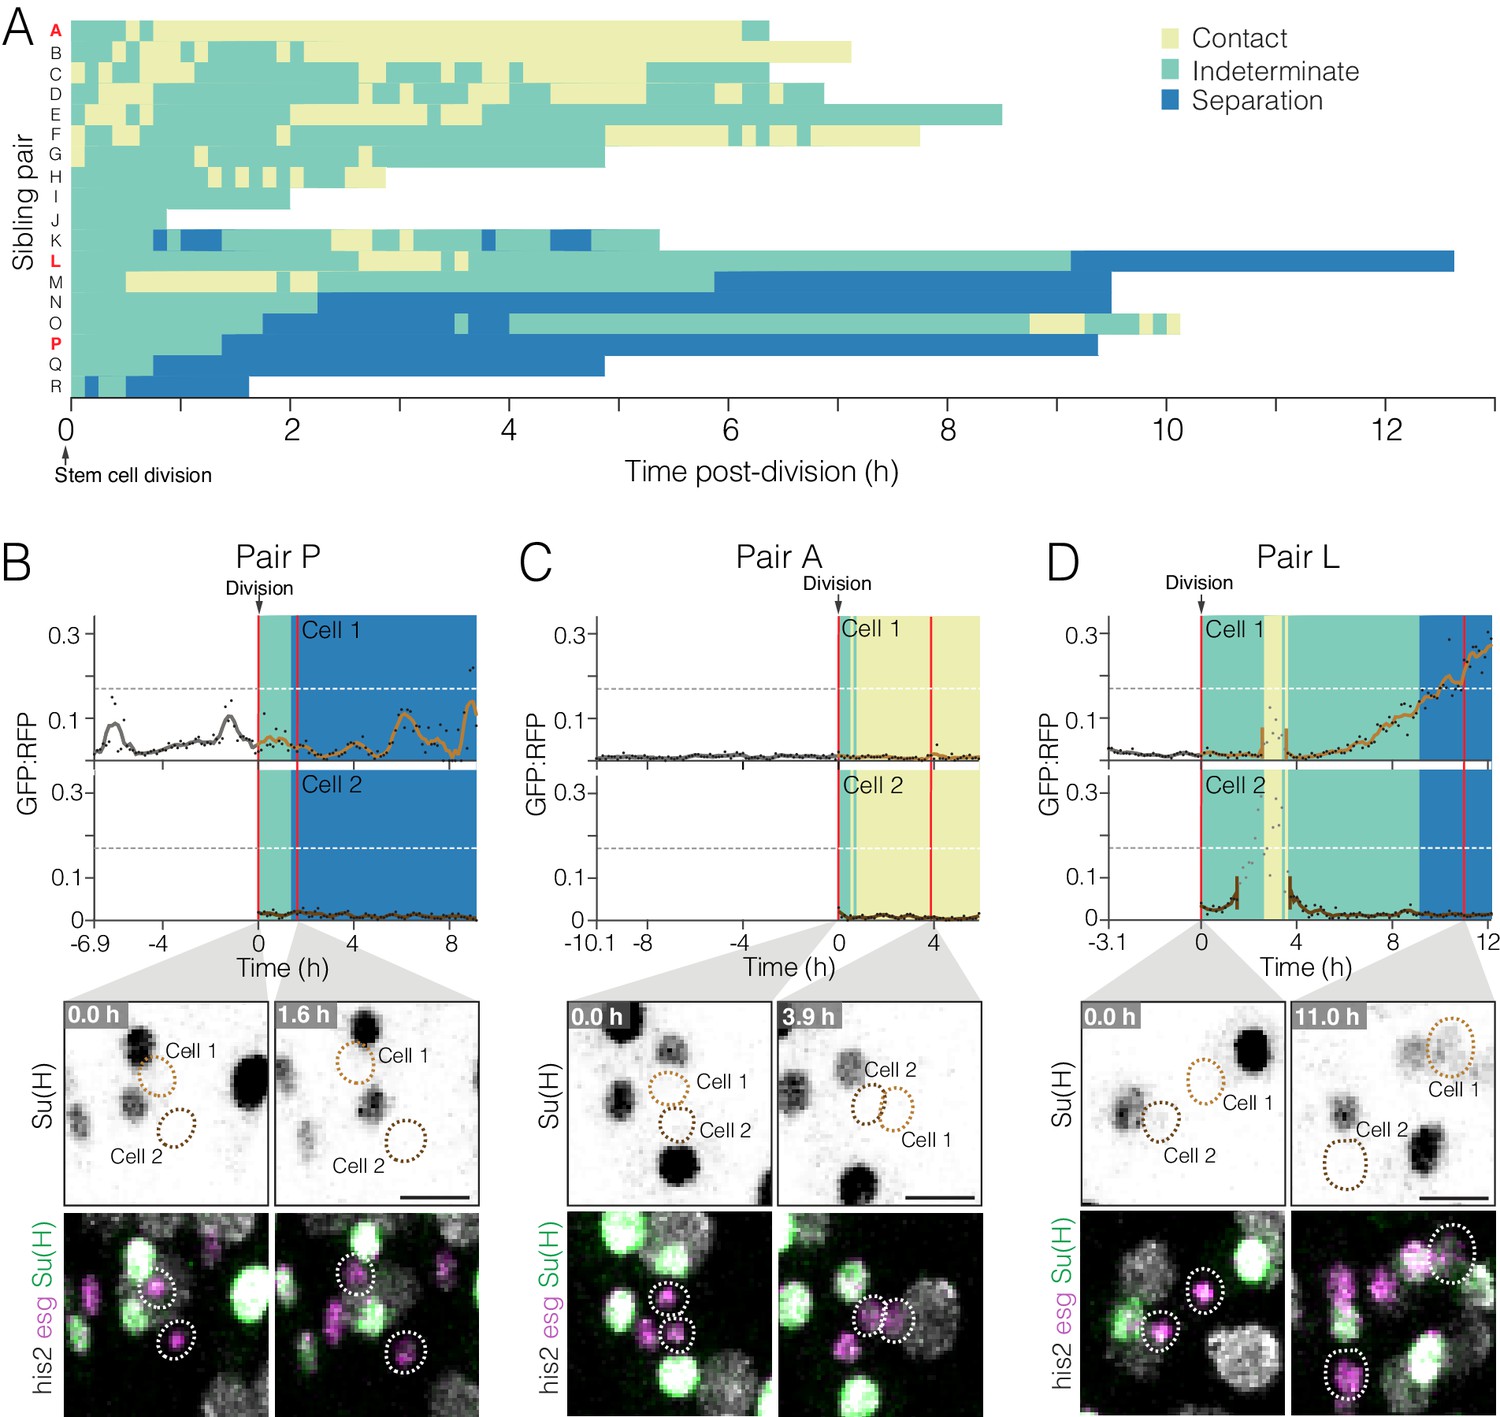
Dynamics of cell contact and Notch reporter activation in sibling cells after birth.
(A) Contacts between newborn siblings are highly variable. Eighteen pairs of sibling cells (rows A–R) were tracked from birth (t = 0.0 hr) to the end of imaging. Color shows the likelihood of sibling–sibling contact based on inter-nuclear distance (Figure 6—figure supplement 1): yellow, inferred contact (inter-nuclear distance <6.0 µm); green, indeterminate (inter-nuclear distance = 6.0–15.5 µm); blue, inferred separation (inter-nuclear distance >15.5 µm). Pairs are ordered from highest A to lowest P contact. Pairs A, L, and P (red labels) are featured in (C), (D), and (B), respectively. (B–D) Contacts between siblings do not correlate with real-time GBE-Su(H)-GFP:nls activation. Graphs show real-time contact status (background colors same as A) and GFP:RFP ratios. Sibling birth is at t=0.0 h. Red vertical lines are the time points shown in the bottom images. (B) Low-contact pair P does not exhibit persistent activation of GBE-Su(H)-GFP:nls. (C) High-contact Pair A does not exhibit persistent activation of GBE-Su(H)-GFP:nls. (D) Indeterminate-low contact Pair L exhibits persistent activation of GBE-Su(H)-GFP:nls in one sibling. The Pair L siblings are probably in contact from t=2.6–3.6 h and are probably separated after t=9.1 h. Note that between t=2.6–3.5 h (Cell 1) and t=1.5–3.6 h (Cell 2), GFP:RFP measurements (grayed dots) are artifactually high because the two cells collide with a third cell, which was a mature enteroblast (Video 18). Because of the intimate proximity between the mature enteroblast and the Pair L siblings during the collision, the high GFP signal of the enteroblast bled over into the surfaces for Cells 1 and 2. The duration of artifactual bleed-over is indicated by gaps in the cells’ interpolated GFP:RFP lines. Genotypes for all panels: esgGal4, UAS-his2b:CFP, Su(H)GBE-GFP:nls; ubi-his2av::mRFP. All scale bars are 10 µm. See Videos 16–18.
-
Figure 6—source data 1
Raw data for Figure 6.
- https://doi.org/10.7554/eLife.36248.027
Figure 6—figure supplement 1
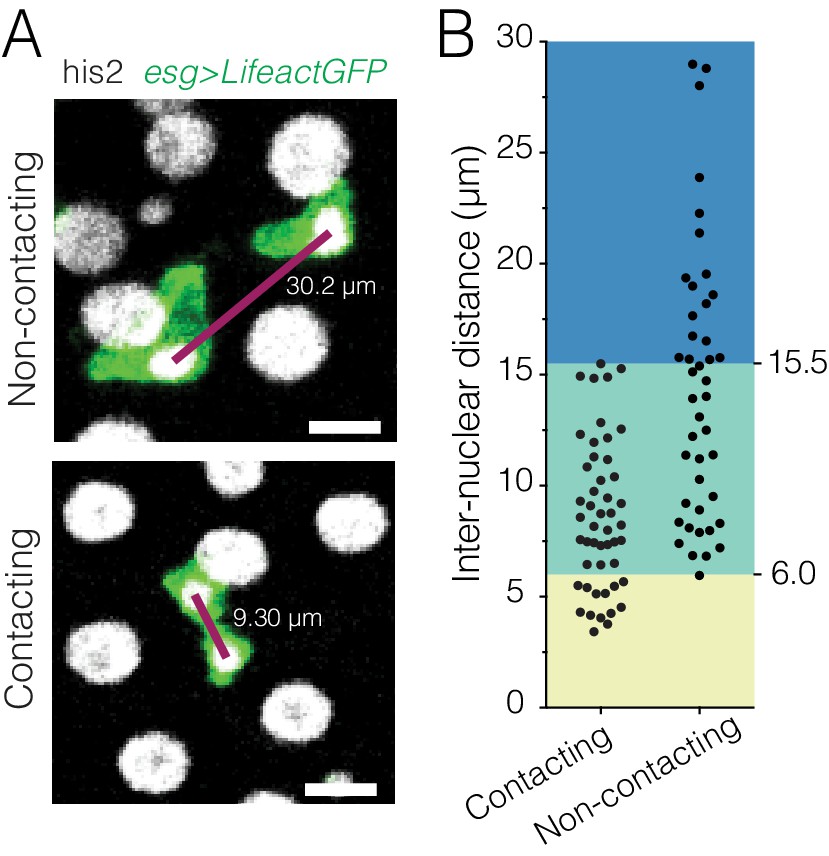
Comparison of cell-cell contact and inter-nuclear distance for live pairs of progenitor cells.
(A) Examples of contacting and separated progenitor pairs. Contact is revealed using esg-driven LifeactGFP (green) to label the actin cytoskeleton of progenitor cells. Inter-nuclear distances (purple lines) are the distances between the centroids of the two nuclei (gray). Images are projections of single time points; but contact and inter-nuclear distances were assessed in volumetric space. Scale bars, 10 µm. (B) Inter-nuclear distances of contacting and separated pairs. All pairs with inter-nuclear distances <6.0 µm (yellow background) are in contact (26% of all contacting pairs). Pairs with inter-nuclear distances from 6.0 to 15.5 µm (green background) are split between contacting and separated (73% of all contacting pairs; 58% of all separated pairs). All pairs with inter-nuclear distances >15.5 µm (blue background) are separated (42% of all separated pairs). These three ranges are used in Figure 6 to infer the probable contact behavior of esg+ + pairs that express only nuclear markers (inter-nuclear distance <6.0 µm, probable contact; 6.0–15.5 µm, indeterminate;>15.5 µm, probably separated). n = 49 contacting and 43 separated pairs. Pairs were designated as two esg+ + that were mutually closer to each other than to any other esg+ + and were selected randomly from single time points of four movies. Genotype: esgGal4, UAS-LifeactGFP; ubi-his2av::mRFP.
-
Figure 6—figure supplement 1—source data 1
Raw measurements for Figure 6—figure supplement 1.
- https://doi.org/10.7554/eLife.36248.026
Author response image 1
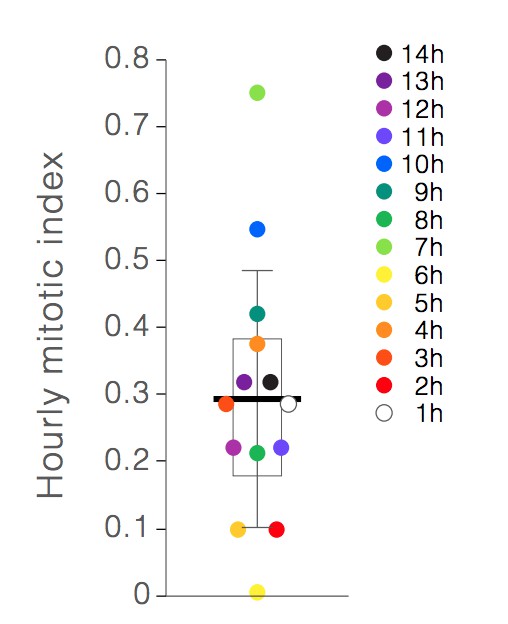
Hourly mitotic indices.
Individual points show the mitotic index for hours 1-14 of live imaging. Earlier hours are denoted by lighter colors, and later hours are denoted by darker colors. Box shows the mean of the hourly indices (bar) and the first and third quartiles (0.18% and 0.38%). Whiskers show the standard deviation (0.19%). No correlation between mitotic index and imaging hour is observed.
Videos
Video 1
Narrated, step-by-step tutorial illustrating the preparation of an animal for midgut imaging in the fly mount.
https://doi.org/10.7554/eLife.36248.007
Video 2
Movie showing the association of the trachea (cyan) with the midgut tube (red).
Smaller tracheal branches encircle the tube and move in concert with peristaltic contractions. A large tracheal branch (upper right) is continuous with smaller branches. The large branch does not move during peristalsis because it is not physically associated with the midgut; instead, it connects the midgut-associated branches to a spiracle (not visible in the movie frame). Left video: cyan pseudocolor, trachea (breathlessGal4, UAScyt-GFP); red pseudocolor, microtubules (SiR-tubulin). Right video: inverted gray, breathlessGal4, UAScyt-GFP. Each time point is the projection of a confocal z-stack. Scale bar, 20 µm.
Video 3
Volumetric movie of the midgut illustrates the wide-field, high-resolution images that are acquired.
Numerous physiological contractions of the midgut are evident. A midgut-associated tracheal branch is visible in the lower left of the video. Scale bar, 70 µm.
Video 4
After 16 hr of continuous imaging, the animal is alive and responsive.
https://doi.org/10.7554/eLife.36248.010
Video 5
Cell viability during extended imaging.
As cells die, they become marked by the cell death stain Sytox Green, which is continuously present in the imaging media. After 11 hr of imaging, an individual midgut enterocyte changes from Sytox– (arrowhead, 10.6 hr), to faintly Sytox+ (arrowhead, 11.1 hr), to strongly Sytox+ (arrowhead, 12.0 hr). Nuclei are magenta (ubi-his2av::mRFP). Each movie time point is the projection of a confocal z-stack. Scale bar, 20 µm.
Video 6
Movie clip of midgut before (left) and after (right) stack registration.
Before registration, blurred cells from tissue movements are evident during timepoints from 20–60 min. After registration, the blurring is negligible. Cyan, all nuclei (ubi-his2ab::mRFP); yellow, stem cells and enteroblasts (esg >LifeactGFP). Each time point is the projection of a confocal z-stack. Scale bar, 20 µm.
Video 7
Ten-hour movie of a ‘fate sensor’ midgut (esgGal4, UAS-his2b::CFP, GBE-Su(H)-GFP:nls; ubi-his2av::mRFP).
See Figure 2A–B). Nuclei are distinguishable for four midgut cell types: stem cells (red pseudocolor), enteroblasts (yellow-green pseudocolor), enterocytes (gray, polyploid), and enteroendocrine cells (gray, diploid). Each time point is the projection of a confocal z-stack. Scale bar, 20 µm.
Video 8
Twelve-hour movie of a single-enterocyte extrusion.
The epithelium is oriented with its basal surface toward the microscope objective and its apical surface further away. The basal region of the extruding enterocyte (orange pseudocolor at t=0, 127.5, 285, 442.5 min) is outlined by a ‘ring’ of E-cadherin::YFP. The ring closes down to a point from t=255–442.5 min. The intensity of the ring fluctuates during the first half of closure and becomes consistently bright during the second half. As the ring closes, neighboring cells draw into a rosette. Meanwhile, the nucleus of the extruding cell (yellow pseudocolor) starts to drop apically at t=150 min, hits its deepest luminal position at t=262.5 min, and recoils from t=262.5–307.5 min. Cyan, all nuclei (ubi-his2av::mRFP); inverted gray, E-cadherin (ubi-DE-cadherin::YFP). Each time point is the projection of a confocal stack. Scale bar, 10 µm.
Video 9
Orthoview of extrusion shown in Video 8.
The nucleus of the extruding enterocyte (magenta) ejects out of the epithelium (t=150–165 min) and penetrates into the lumen (t=165–265 min). It subsequently recoils and eventually comes to rest on the apical epithelium (t=263–443 min). The multicolored line shows the path of nuclear travel over time (violet-yellow color scale; see Figure 3D for legend). Cyan, all nuclei (ubi-his2av::mRFP); gray, E-cadherin (ubi-DE-cadherin::YFP). Scale bar, 10 µm.
Video 10
Four-hour movie of an enteroendocrine cell extrusion.
The epithelium is oriented with its basal surface toward the microscope objective and its apical surface further away. The basal region of the extruding cell (tan pseudocolor at t=0, 75 min) is outlined by a ring of E-cadherin::YFP (inverted gray signal at cell boundaries). The extruding cell is presumed to be enteroendocrine because it has a small, presumably diploid, nucleus and because it lacks expression of esg. (esg >his2b::CFP is inverted gray signal in nuclei.) The E-cadherin ring closes to a point over the period t=0–180 min. Meanwhile, the enteroendocrine cell nucleus drops apically from t = 0–143 min. Cyan, all nuclei (ubi-his2av::mRFP); inverted gray, E-cadherin (ubi-DE-cadherin::YFP) and stem/enteroblast nuclei (esg >his2b::CFP). Each time point is the projection of a confocal stack. Scale bar, 10 µm.
Video 11
Mitosis of a putative stem cell.
Green, actin (esg >LifeactGFP); yellow, E-cadherin (ubi-DE-cadherin::YFP); red, nuclei (ubi-his2av::mRFP). Each time point is the partial projection of a confocal stack. Scale bar, 10 µm
Video 12
Orthoview of a mitosis with two horizontal-vertical re-orientations.
The first re-orientation occurs between metaphase (24° at 7.5 min) and anaphase (60° at 15 min). The second re-orientation occurs between anaphase (62° at 22.5 min) and telophase (2° at 30 min). Gray channel, condensed chromatin (ubi-his2ab::mRFP). The red line indicates the spindle axis. The cyan line indicates the basal plane, as revealed by the basement membrane stain Concanavalin A-Alexa 647 (not shown). At each time point, the mitotic cell is shown as an orthogonal projection from the vantage of a plane that is parallel to the spindle axis and normal to the basal epithelial plane. For clarity, a clipping plane was applied in the gray channel to exclude an adjacent enterocyte nucleus. Scale bar, 5 µm.
Video 13
Orthoview of a second mitosis with two horizontal-vertical re-orientations.
The top panel shows condensed chromatin of the dividing cell (ubi-his2ab::mRFP). The red line indicates the spindle axis. The cyan line indicates the basal plane, as revealed by the basement membrane stain Concanavalin A-Alexa 647 (not shown). The bottom panel reproduces the graph from Figure 4E, with the time-resolved orientations of this particular cell in red. The first re-orientation occurs during metaphase (from 16° at 5 min to 0° at 15 min). The second re-orientation occurs between metaphase (1° at 20 min) and anaphase (18° at 25 min). Scale bar, 5 µm.
Video 14
Division of a stem cell that contacts two enteroblasts.
Division orientation aligns with the axis between the two enteroblast nuclei (magenta, GBE-Su(H)-GFP:nls). At cytokinesis (t=15–22.5 min), the new daughter nuclei hurl into the enteroblast nuclei, which recoil in response. Gray, stem cell and enteroblast nuclei (esg >his2b::CFP). Each time point is the partial projection of a confocal stack. Scale bar, 10 µm.
Video 15
Real-time enteroblast transition.
In the incipient enteroblast (blue dotted circle), GBE-Su(H)-GFP:nls is initially undetectable (GFP:RFP=0.014 at t=0.0 hr). Over time, its GFP intensity increases, eventually reaching the enteroblast threshold (GFP:RFP=0.18 at t=10.5 hr). See Figure 5D. Left video: green, GBE-Su(H)-GFP:nls.; magenta, stem cell and enteroblast nuclei (esg >his2b::CFP); gray, all nuclei (ubi-his2av::mRFP). Right video: inverted gray, GBE-Su(H)-GFP:nls. Each time point is the partial projection of a confocal stack. Scale bar, 2 µm.
Video 16
A low-contact sibling pair (Pair P; Figure 6A,B) does not activate GBE-Su(H)-GFP:nls.
Following their birth at t=0.0 hr, the two siblings move apart and have probably lost contact by t=1.4 hr (inter-nuclear distance >15.5 µm; c.f. Figure 6—figure supplement 1). The mother stem cell is indicated by the blue dotted circle at t=−1.0 hr; the two siblings are indicated by the two blue dotted circles at t=0.0 and t=9.2 hr. No GFP expression is apparent in either sibling. Left video: green, GBE-Su(H)-GFP:nls; magenta, stem cell and enteroblast nuclei (esg >his2b::CFP); gray, all nuclei (ubi-his2av::mRFP). Right video: inverted gray, GBE-Su(H)-GFP:nls. Each time point is the partial projection of a confocal stack. Scale bar, 5 µm.
Video 17
A high-contact sibling pair (Pair A, Figure 6A,C) does not activate GBE-Su(H)-GFP:nls.
Following their birth at t=0.0 hr, the two siblings probably remain in contact (inter-nuclear distance <6.0 µm; c.f. Figure 6—figure supplement 1) for at least 6.0 hr. The mother stem cell is indicated by the blue dotted circle at t=−1.2 hr; the two siblings are indicated by the two blue dotted circles at t=0.0 and t=6.0 hr. No GFP expression is apparent in either sibling. Left video: green, GBE-Su(H)-GFP:nls; magenta, stem cell and enteroblast nuclei (esg >his2b::CFP); gray, all nuclei (ubi-his2av::mRFP). Right video: inverted gray, GBE-Su(H)-GFP:nls. Each time point is the partial projection of a confocal stack. Scale bar, 5 µm.
Video 18
A sibling pair exhibits asymmetric Notch activation (Pair L, Figure 6A,D).
Following their birth at t=0.0 hr, the two siblings are probably in contact from t=2.6–3.6 hr, in indeterminate contact from t=3.6–9.0 hr, and separated after t=9.0 hr. The mother stem cell is indicated by the blue dotted circle at t=−1.0 hr. The two siblings are indicated by the two blue dotted circles at t=0.0 and 12.2 hr. A single blue dotted circle at t=10.2 hr indicates when the Notch-activated sibling crosses the enteroblast threshold (GFP:RFP=0.17; c.f. Figure 6D). This sibling exhibits nascent GFP signal at 4.0 hr and increases in GFP intensity for the rest of the movie. The other sibling does not exhibit detectable GFP, but from t=1.5–3.6 hr, it collides with a high-GFP enteroblast (orange dotted circle), which causes GFP signal to ‘bleed over’ in the GFP:RFP analysis (Figure 6D). Left video: green, GBE-Su(H)-GFP:nls; magenta, stem cell and enteroblast nuclei (esg >his2b::CFP); gray, all nuclei (ubi-his2av::mRFP). Right video: inverted gray, GBE-Su(H)-GFP:nls. Each time point is the partial projection of a confocal stack. Scale bar, 5 µm.
Tables
Key resources table
| Reagent type (species) or resource | Designation | Source or reference | Identifiers | Additional information |
|---|---|---|---|---|
| Genetic reagent (Drosophila melanogaster) | esgGal4 | Kyoto DGGR | DGRC:112304; FLYB:FBti0033872; | FlyBase symbol: w[*]; P{w[+mW.hs]=GawB}NP0726/CyO |
| Genetic reagent (D. melanogaster) | ubi-his2av::mRFP | Bloomington Drosophila Stock Center | BDSC:23650; FLYB:FBti0077846; RRID:BDSC_23650 | FlyBase symbol: w[*]; P{w[+mC]=His2Av-mRFP1}III.1 |
| Genetic reagent (D. melanogaster) | breathlessGal4, UAS-cyt-GFP | Other | w; btl-Gal4, UAS-cytGFP shared by Mark Metzstein | |
| Genetic reagent (D. melanogaster) | UAS-LifeactGFP | Bloomington Drosophila Stock Center | BDSC:35544; FLYB:FBti0143326; RRID:BDSC_35544 | FlyBase symbol: y[1] w[*]; P{y[+t*] w[+mC]=UAS-Lifeact-GFP}VIE-260B |
| Genetic reagent (D. melanogaster) | UAS-his2b::CFP | PMID: 24850412 | w; UAS-his2b::CFP/ (Cyo); + -- shared by Yoshihiro Inoue | |
| Genetic reagent (D. melanogaster) | GBE-Su(H)-GFP:nls | PMID: 22522699 | w?; mw, GBE-Su(H)-GFPnls/(Cyo); Dr/TM6B -- from (de Navascués et al., 2012) shared by Joaquin de Navascues | |
| Genetic reagent (D. melanogaster) | act5c-spaghetti squash::GFP | PMID:12105185 | w?; act5c-sqh::GFP; Dr/TM6C -- shared by Denise Montell | |
| Genetic reagent (D. melanogaster) | ubi-E-cadherin::YFP | PMID: 24855950 | w; ubi-E-cadherin::YFP; + -- shared by Denise Montell | |
| Chemical compound, drug | Concanavalin-A-Alexa647 | Invitrogen | Invitrogen:C21421 | 25 μg/ml final concentration |
| Chemical compound, drug | Sytox Green | ThermoFisher | ThermoFisher:S7020 | 1 μM final concentration |
| Chemical compound, drug | SiR-tubulin | Cytoskeleton | Cytoskeleton:CY-SC002 | 0.5 μM final concentration |
| Chemical compound, drug | Human insulin | Sigma Aldrich | Sigma-Aldrich:I0516 | 100 μg/ml final concentration |
| Software, algorithm | Fiji | Other | RRID:SCR_002285 | StackRegfrom Arganda-Arganda-Carreras et al., 2006b; Correct 3D drift from Parslow et al. (2014); Bioformats plugin |
| Software, algorithm | Bitplane Imaris | Other | RRID:SCR_007370 | Surpass module; Surface Recognition Wizard; Measurement Points tool |
Additional files
-
Source code 1
Registration macros utilizing the ImageJ plugin StackReg to perform three channel stack registration over time.
In this macro, the XY negative space around the image is increased by a user-defined amount to account for the shifting of stack slices during the registration process. The movie is then collapsed into an RGB format and StackReg is performed on each time point using a loop function. Once completed, corrected time points are concatenated, converted back to three color hyperstacks, and then the ImageJ plugin Correct 3D Drift is applied to correct for global volume movement of the tissue over time. The macro is in *.ijm format which can be opened and viewed in ImageJ.
- https://doi.org/10.7554/eLife.36248.039
-
Transparent reporting form
- https://doi.org/10.7554/eLife.36248.040
Download links
A two-part list of links to download the article, or parts of the article, in various formats.
Downloads (link to download the article as PDF)
Open citations (links to open the citations from this article in various online reference manager services)
Cite this article (links to download the citations from this article in formats compatible with various reference manager tools)
Long-term live imaging of the Drosophila adult midgut reveals real-time dynamics of division, differentiation and loss
eLife 7:e36248.
https://doi.org/10.7554/eLife.36248


