Multivalency regulates activity in an intrinsically disordered transcription factor
- Sarah Clark

- Janette B Myers
- Ashleigh King
- Radovan Fiala
- Jiri Novacek
- Grant Pearce
- Jörg Heierhorst
- Elisar J Barbar
- Oregon State University, United States
- Portland State University, United States
- The University of Melbourne, Australia
- Masaryk University, Czech Republic
- University of Canterbury, New Zealand
Figures
Figure 1

LC8 dimerizes its protein partners
(a) Ribbon diagram of dimeric LC8, where each monomer is colored a different shade of blue and bound to a representative peptide in yellow (PDB 5E0L). A single LC8 dimer binds two peptides (intrinsically disordered region, IDR), one on each side of the dimerization interface, that are arranged in a parallel fashion. (b) A sequence logo of LC8 binding motifs derived from sequences of the motifs in the 11 crystal structures reported for LC8/peptide complexes. Height of amino acids indicates their relative frequency at that position. (c) A crystal structure of two LC8 dimers bound to two copies of the same intrinsically disordered chains illustrates how LC8 can bind to multivalent partner proteins with two LC8 recognition motifs, TQT1 and TQT2 (PDB 3GLW). (d) Sequence-based predictions of order (red boxes), disorder (blue lines), and LC8 binding motifs (dark blue bars) are shown for 10 ASCIZ proteins from the animal kingdom. ASCIZ proteins for different species were identified from a BLAST search (Boratyn et al., 2013) against the human protein. Sequence predictions of order and disorder were obtained with PSIPRED (McGuffin et al., 2000), where a criteria for order is based on >10% probability of predicted structure in a 50 + amino acid stretch. LC8 binding sites for human ASCIZ and Drosophila ASCIZ were obtained from the literature (Rapali et al., 2011a; Zaytseva et al., 2014). Putative LC8 binding sites for the other species were identified based on the presence of TQT residues.
-
Figure 1—source data 1
A list of the 10-amino acid motifs and PDB identification codes for the 11 LC8-peptide crystal structures that were used to generate the sequence logo in Figure 1b.
- https://doi.org/10.7554/eLife.36258.004
Figure 2 with 1 supplement
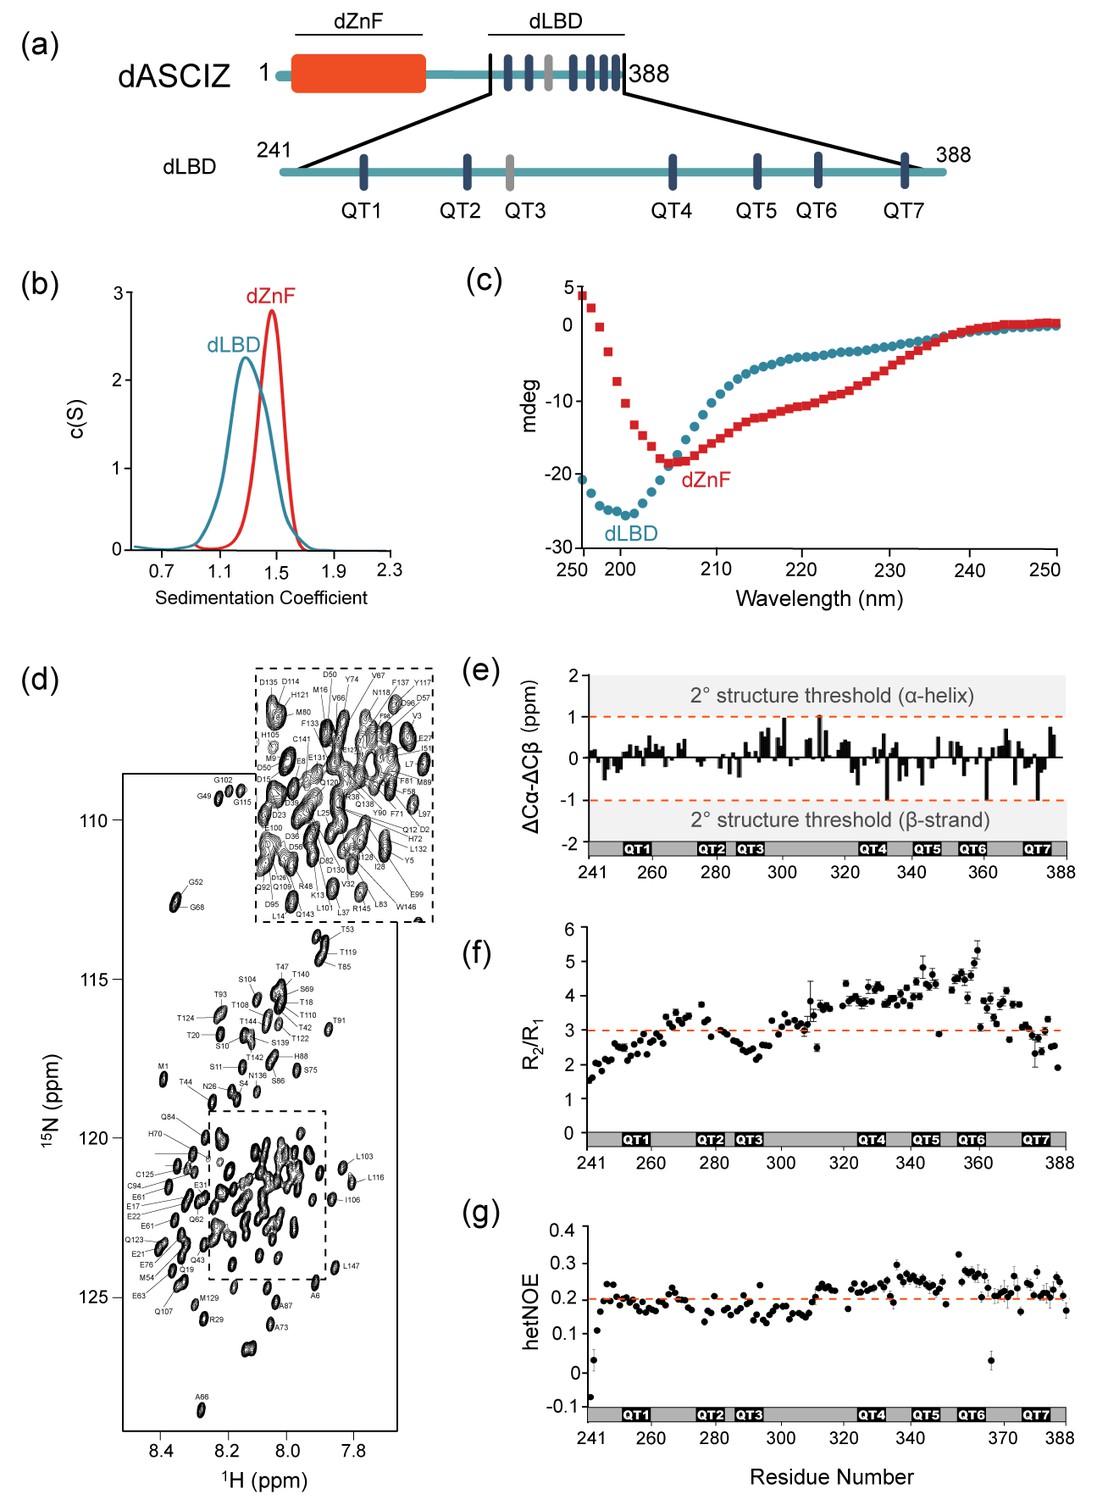
Domain structures of dASCIZ.
(a) Domain structure of dASCIZ, showing the dZnF domain (red) and 7 LC8 binding motifs in its C-terminal domain (blue). Dark blue bars indicate predicted TQT motifs and gray bars indicate the TMT motif (QT3) identified in this study. (b) Sedimentation velocity analysis of the dZnF domain (red), collected at 10°C, and the dLBD (blue), collected at 25°C. (c) Far UV CD spectrum of the ZnF domain (red squares) and the dLBD (blue circles), both collected at 10°C. (d) [15N−1H]-BEST-TROSY spectrum at 850 MHz showing backbone assignments for 133 non-proline residues. Unassigned peaks correspond to the two additional N-terminal residues from the expression vector. The spectrum was recorded at 10°C. (e) A plot of secondary chemical shift differences versus residue number. ΔCα and ΔCβ values were calculated by subtracting the random coil chemical shifts (Tamiola et al., 2010) from the experimentally determined. ΔCα − ΔCβ values < ±1.0 ppm are considered not significant. (f) Plots of R2/R1 and (g) heteronuclear NOE values measured at 10°C indicate high level of disorder. A dotted line is placed at the average value to aid in visualization. Segments corresponding to LC8 recognition motifs, QT1, QT2, QT3, QT4, QT5, QT6, and QT7 are shown. Additional structural characterization of the dLBD by circular dichroism and gel filtration chromatography is shown in Figure 2—figure supplement 1.
-
Figure 2—source data 1
Tables containing the NMR data that were used to generate the graphs in Figure 2e–g.
- https://doi.org/10.7554/eLife.36258.007
Figure 2—figure supplement 1
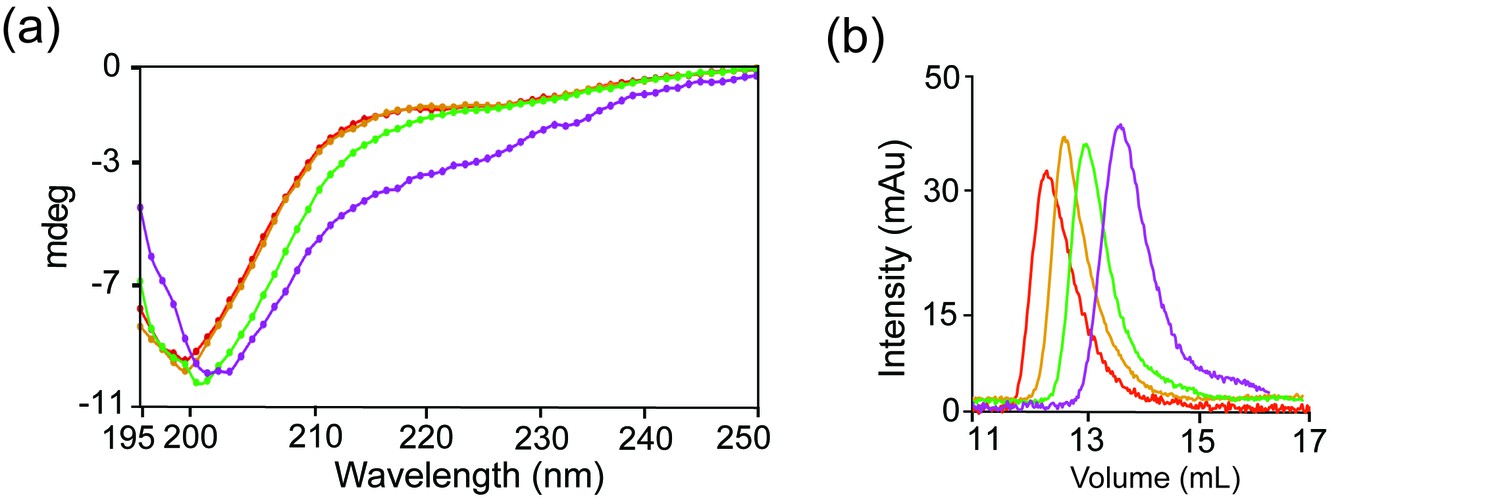
dLBD C-terminus is transiently compact.
(a) Far UV CD spectrum of dLBD constructs collected at 10°C: QT1-3 (red), QT2-4 (orange), QT4-6 (green), and QT4-7 (magenta). (b) Size exclusion chromatography of each construct from (a) depicts differences in migration time, using the same color scheme. Size exclusion chromatography was performed on a Superdex 75 10/300 column.
Figure 3

LC8-dLBD interactions monitored by ITC.
(a) Construct schematics of the dLBD, QT1-3, QT2-4, QT4-6, and QT4-7 are shown, along with the locations of each TQT motif. A representative isothermal titration calorimetry thermogram of LC8 with the dLBD is shown on the right. (b) Representative thermograms of LC8 with constructs corresponding to QT1-3, QT2-4, QT4-6, and QT4-7. (c) Representative isothermal titration plots of LC8 with peptides corresponding to QT1p, QT2p, QT3p, QT4p, QT5p, QT6p, and QT7p. Since the interaction with QT3p is too weak, the heat exchange with buffer is plotted on top to show the difference between QT3p with LC8 and buffer. Higher concentrations were not possible due to poor solubility of the QT3p. Data were fit to a single site binding model using Origin software.
Figure 4 with 1 supplement

ASCIZ and LC8 form a dynamic complex with low occupancy intermediates.
(a) Representative c(S) distributions obtained by sedimentation velocity are shown for the dLBD, LC8, and increasing molar ratios of the dLBD: LC8; 1:1, 1:3, 1:6, and 1:10. The standardized sedimentation coefficients (s20,w) of unbound LC8 and dLBD determined from sedimentation velocity are 2.42 s (frictional ratio, f/f0 = 1.21, consistent with a globular protein) and 1.34 s (f/f0 = 1.84, consistent with an asymmetric or unfolded protein), respectively. Calculation of the molecular weight from the sedimentation coefficient and frictional ratio gave masses of 23 kDa and 18 kDa respectively, closely matching their theoretical masses of 24 kDa for LC8 dimer and 17 kDa for dLBD monomer. Cartoon depictions of the ASCIZ dLBD (light blue) and LC8 (dark blue) are shown to aid in visualization of the complexes formed at a 1:10 ratio. (b) Native gel titration of dLBD with LC8. An increasing concentration of LC8 was added to a constant amount of dLBD, from a molar ratio of (dLBD:LC8) 1:1 to 1:8. As more LC8 is added, the complex migrates more slowly and excess LC8 appears at 1:4. (c) Native gel titration of hLBD with LC8. As an increasing concentration of LC8 is added to a constant amount of hLBD. Arrows indicate the locations of the low molecular weight (LMW) and high molecular weight (HMW) complex. (d) Titration of the hLBD with LC8, monitored by size exclusion chromatography on a Superdex 200 gel filtration column. The concentration of hLBD is held constant and an increasing amount of LC8 is added, from a molar ratio of 1:3 to 1:13. Peaks corresponding to free hLBD, free LC8, low molecular weight complex (LMW) and high molecular weight (HMW) complex are labeled. Additionally, SAXS data for the LMW dLBD:LC8 complex is shown in Figure 4—figure supplement 1.
Figure 4—figure supplement 1
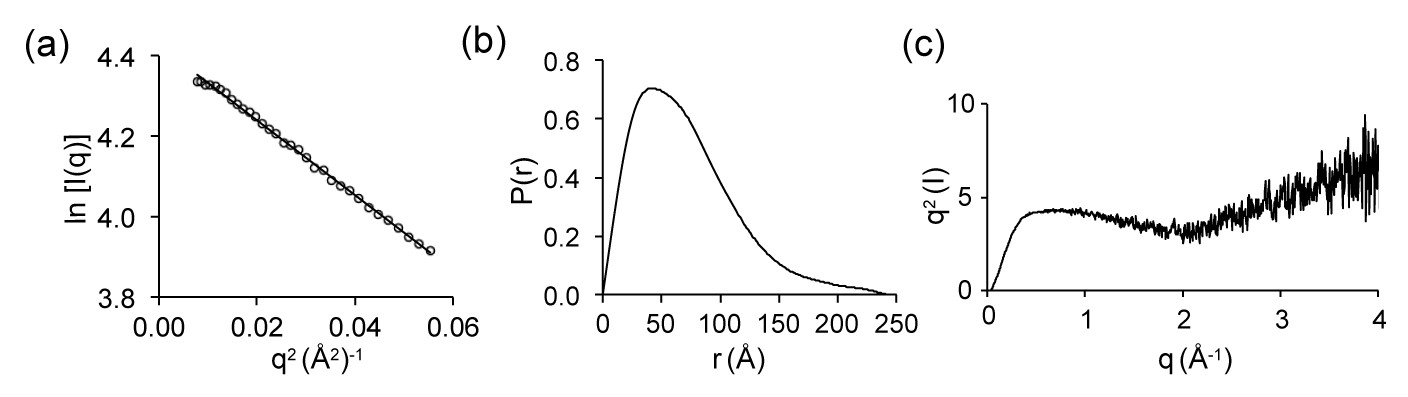
SAXS data of dLBD:LC8 complex.
(a) A Guinier plot of the experimental scattering data is shown. The solid line represents the Guinier fit, where the linear fit was extended to q < 1.3/Rg (Kikhney and Svergun, 2015). (b) The real-space pairwise distribution (P(r)) function for the dLBD:LC8 complex. The P(r) function was used to determine the Dmax, the maximum dimension of the dLBD:LC8 complex in solution, as well as estimate the molecular weight of the complex(Petoukhov et al., 2012). (c) Kratky plot of the dLBD:LC8 complex.
Figure 5 with 1 supplement

dLBD:LC8 and hLBD:LC8 complexes visualized by negative stain electron microscopy.
(a) Representative micrograph of negatively stained hLBD:LC8 complexes. Identified oligomeric complexes are boxed. Non-oligomeric LC8 dimers are indicated by arrowheads. Scale bar = 100 nm. dLBD:LC8 micrographs had the same appearance (not shown). (b) Representative 2D projection averages of (top) dLBD:LC8 oligomers and (bottom) hLBD:LC8 oligomers. Only low-occupancy oligomers with 2–4 LC8 dimers (2mer – 4mers) were successfully averaged. Higher-occupancy oligomers were identified in raw micrographs (Figure 5—figure supplement 1), but were not averaged due to low population and/or high degree of conformational flexibility. Scale bar = 20 nm. (c) Histogram showing the normalized population distribution of LC8 occupancy in complexes formed with dLBD (grey) and hLBD (black), identified from raw micrographs. The population of complexes formed with a single LC8 dimer were not determined (n.d.) (d) Illustration representing the distribution of LC8 occupancy and conformational flexibility observed in hLBD:LC8 complexes.
Figure 5—figure supplement 1
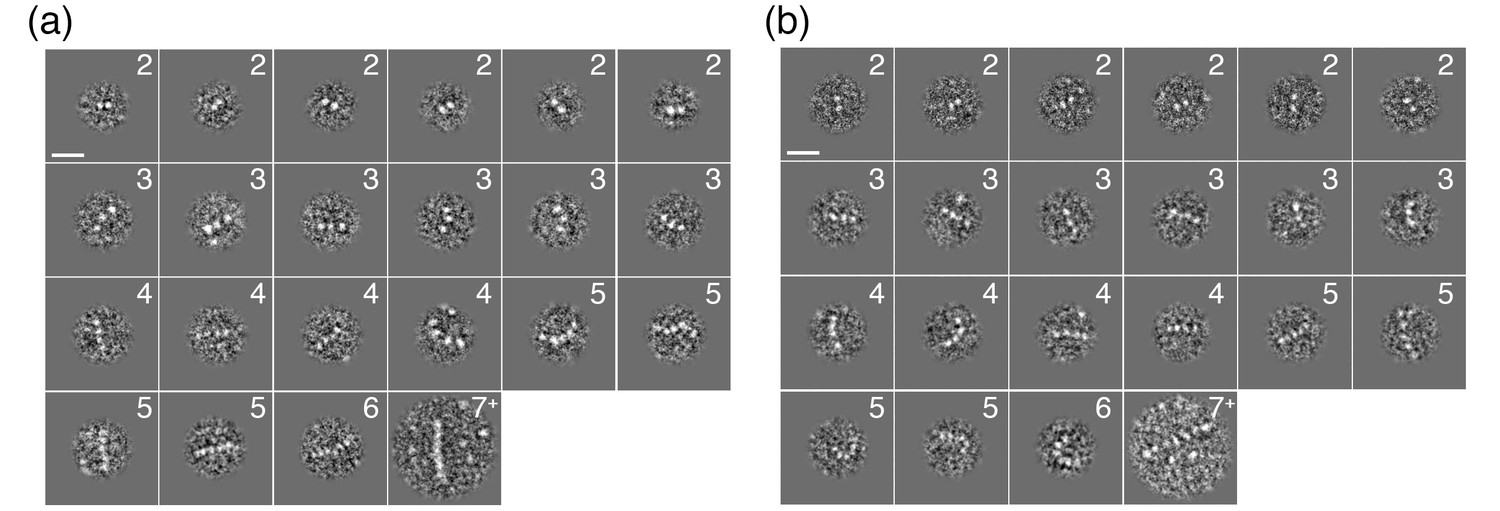
Single particle images of dLBD:LC8 and hLBD:LC8 complexes.
(a) Representative images of negatively stained (a) dLBD:LC8 complexes and (b) hLBD:LC8 complexes extracted from raw micrographs. Each particle is annotated to indicate the assigned occupancy of LC8 dimers used for statistical analysis in Figure 5. The classification of 7 + in panels a and b, indicates the possibility of a higher-order structure that is not fully resolved. Scale bars = 20 nm.
Figure 6 with 1 supplement
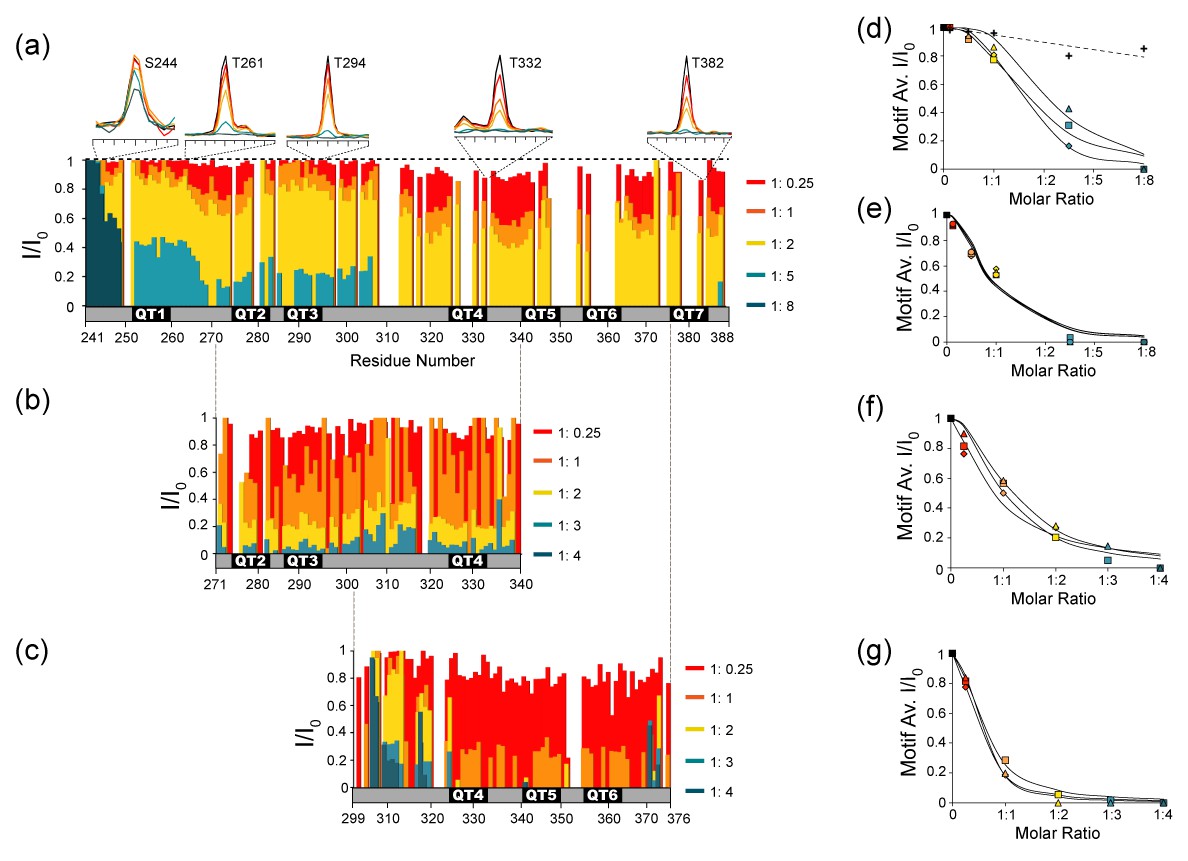
NMR titration of the dLBD with LC8.
Relative intensities of non-proline NH peaks in 15N-13C-HNCO spectra are shown for (a) dLBD, (b) QT2-4, and (c) QT4-6 titrated with LC8 at molar ratios of 1:0.25, 1:1, 1:2, 1:5, and 1:8. Peak intensities (I) are given relative to the intensity of the same peak in free peptide (I0). Above (a) are 1D NMR slices of representative amino acids from TQT motifs QT1 (T261), QT3 (T294), QT4 (T332), QT7 (T382) and a control (S244). Representative slices of HNCO spectra from multiple titration points are shown in Figure 6—figure supplement 1. (d–g) The I/I0 data are alternatively plotted as the average intensity ratio for each 10-amino acid motif versus the molar ratio of dLBD:LC8. For the dLBD complex, titration curves of individual motifs cluster in two groups having higher (d) or lower (e) average intensity ratios at the same dLBD:LC8 molar ratio. Similarly, for the two shorter constructs, plots of average I/I0 for individual motifs cluster in two groups, motifs in QT2-4:LC8 having higher intensity ratios (f), and motifs in QT4-6:LC8 having lower intensity ratios (g). Motif designations in (d) and in (f) are: QT1 (triangle), QT2 (square), QT3 (diamond). Motif designations in (e) and (g) are: QT4 (triangles), QT5 (squares), QT6 (diamond), and QT7 (circle). Note that complete peak attenuation at any titration point is given a value of 0 (Figure 6g). In (d) values are shown for a negative control group (crosses, dotted line) comprised of those measurable at saturating LC8 concentration in the first eight amino acids, 241–249. In panels (d–g), solid curves are to guide the eye.
-
Figure 6—source data 1
A table of the average I/I0 values for each 10-amino acid motif in the dLBD construct, QT2-4 construct, and QT4-6 construct.
These values were used to create the graphs in Figure 6e–g.
- https://doi.org/10.7554/eLife.36258.017
Figure 6—figure supplement 1
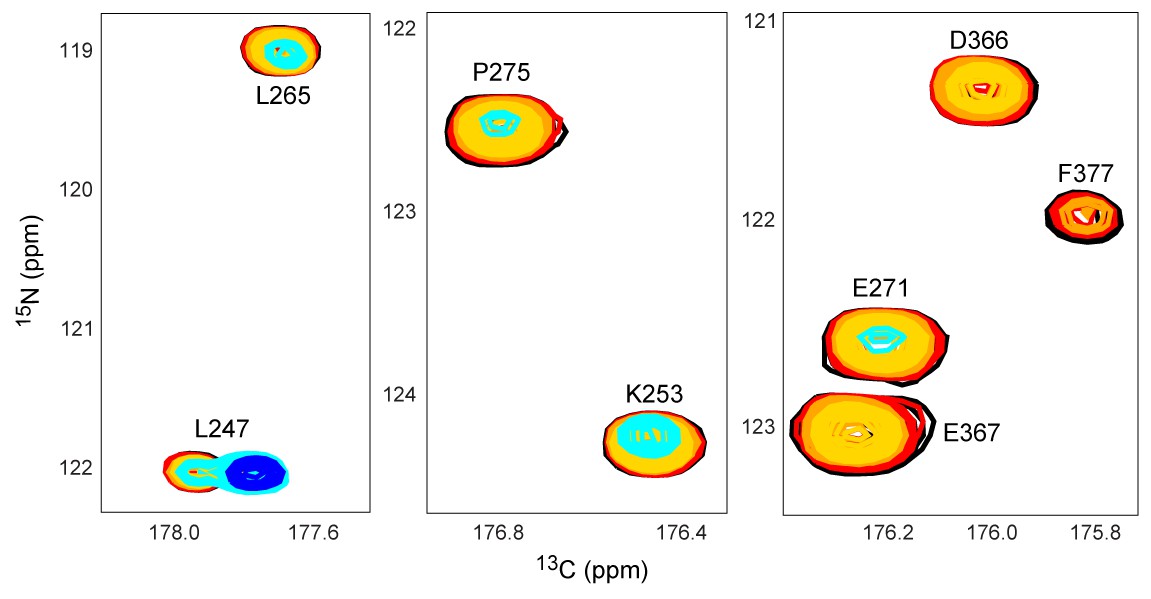
Representative HNCO slices of dLBD titration with LC8.
Shown are representative peaks from HNCO spectra depicting a loss of intensity with an increasing LC8 concentration. Colors are the same as Figure 6a: free dSQTQ (black), 1 LBD: 0.25 LC8 (red), 1:1 (orange), 1:2 (gold), 1:5 (blue), and 1:8 (dark blue).
Figure 7 with 1 supplement
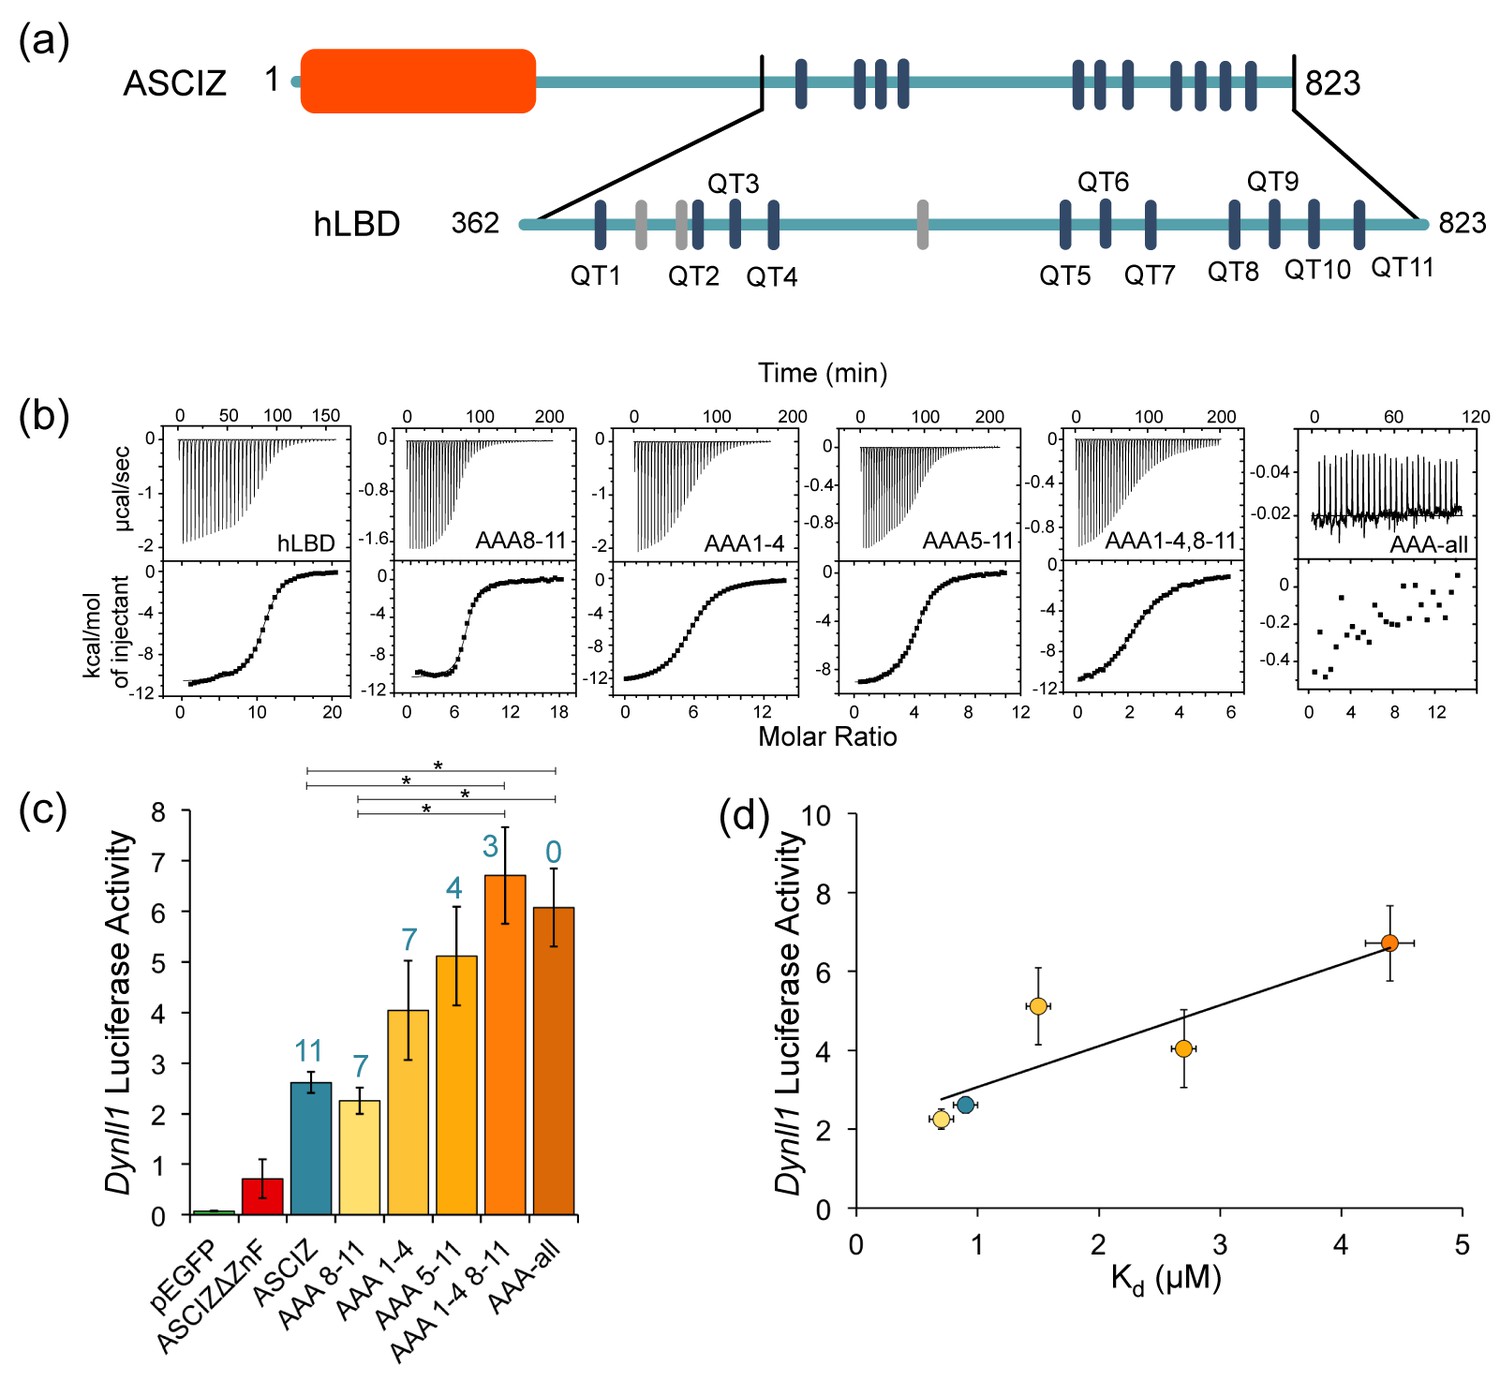
The number of LC8 recognition motifs tunes ASCIZ transcriptional activity.
(a) Domain structure of human ASCIZ, showing 11 LC8 binding motifs as blue bars. Additional non-TQT motifs are shown as gray bars. (b) Shown are representative isothermal titration plots of LC8 with the hLBD and constructs with four (AAA1-4 and AAA8-11), seven (AAA5-11), eight (AAA1-4, 8–11), or fourteen (AAA-all) mutant LC8 binding sites. Data were fit to a single site binding model using Origin software. (c) Firefly luciferase reporter assays of ASCIZ knockout mouse embryo fibroblast cells transiently transfected with WT human ASCIZ (blue), a zinc finger deletion construct (red), and ASCIZ mutant constructs AAA1-4, AAA8-11, AAA5-11, AAA1-4, 8–11, or AAA-all (shades of orange), along with the Dynll1 luciferase and Renilla luciferase vectors. The number of available motifs is indicated above each construct. Error bars are ±S.E. relative to Renilla luciferase as a control. Asterisks (*) indicate p-values less than 0.01. Data is the average of 2–4 independent experiments. Although the differences in transcriptional activity between each construct is small, the overall trend indicates an increase in transcriptional activity with a decrease in available binding motifs. A western blot depicting expression of the ASCIZ constructs is shown in Figure 7—figure supplement 1. (d) Binding affinity of each construct for LC8 is plotted against luciferase activity. Data points are colored according to (c). The AAA-all construct is excluded from the graph because it does not bind to LC8.
-
Figure 7—source data 1
The raw data from the firefly luciferase reporter assays, shown for each ASCIZ construct.
- https://doi.org/10.7554/eLife.36258.020
Figure 7—figure supplement 1
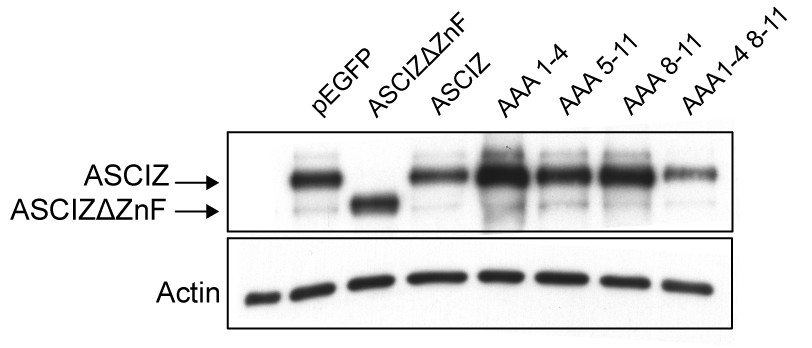
Western blot of ASCIZ constructs
Western blot analysis of human U2OS cells transiently transfected with ASCIZ constructs from (Figure 7c), probed with ASCIZ antibody.
Figure 8
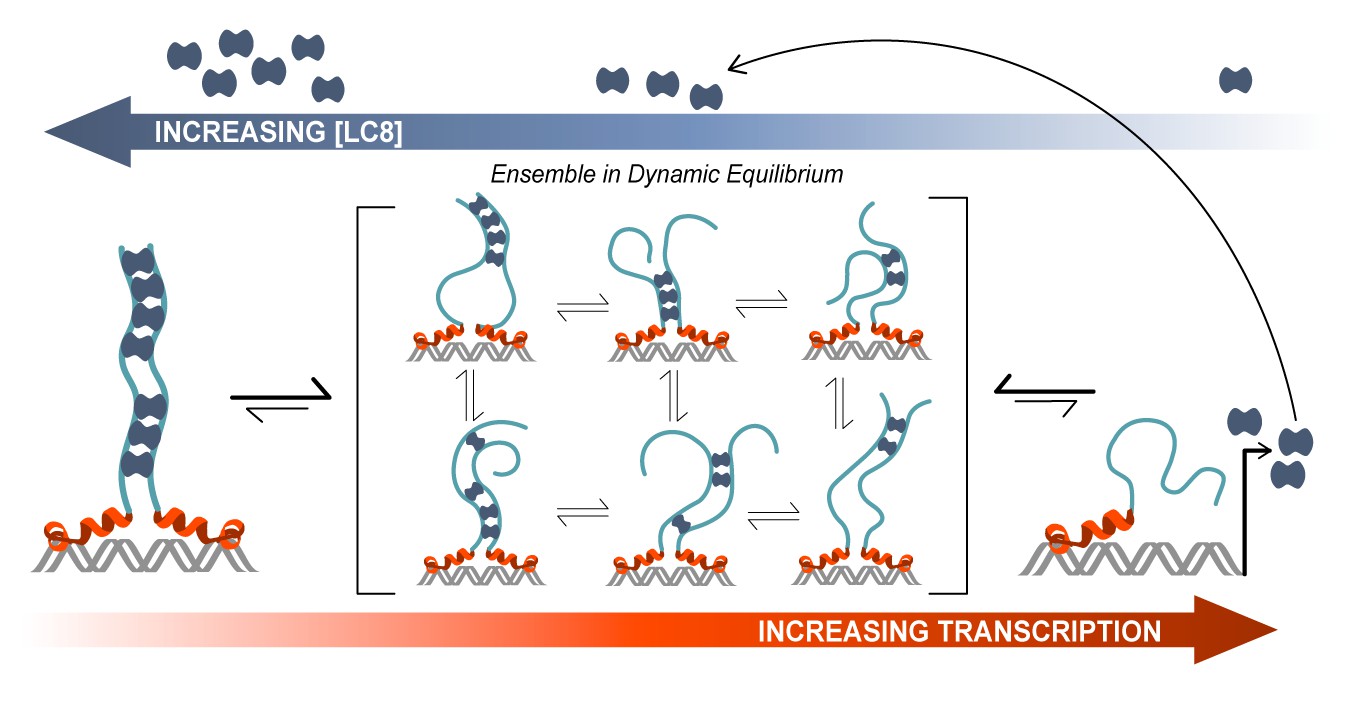
Model of ASCIZ regulation of LC8 transcription.
A proposed model of LC8 transcriptional regulation is shown for dASCIZ, which also applies to the human protein. Free LC8 dimers (dark blue) bind to ASCIZ and modulate transcriptional activity. Transcriptional activity is lowest when ASCIZ recognition motifs are fully occupied by LC8 (left) and is highest when ASCIZ is bound to a small number of LC8 dimers or not bound to LC8 (right). A dynamic, low-occupancy complexes (center) are composed of ASCIZ bound to 2–4 LC8 dimers. LC8 that is produced upon ASCIZ transcription returns to the pool of free LC8.
Tables
Table 1
Thermodynamic parameters of dASCIZ-LC8 interactions.
https://doi.org/10.7554/eLife.36258.009| Construct | N | Overall Kd (μM) | Overall ΔH (kcal/mol) | Overall TΔS (kcal/mol) | Overall ΔG (kcal/mol) |
|---|---|---|---|---|---|
| dLBD | 7.3 | 1.4 ± 0.1 | −5.3 ± 0.2 | 2.7 ± 0.4 | −8.0 ± 0.4 |
| QT1-3 (241–324) | 3.2 | 2.4 ± 0.1 | −8.1 ± 0.4 | −0.4 ± 0.6 | −7.7 ± 0.4 |
| QT2-4 (271–341) | 2.7 | 4.1 ± 0.2 | −7.9 ± 0.4 | −1.6 ± 0.5 | −6.3 ± 0.3 |
| QT4-6 (321–376) | 3.0 | 1.0 ± 0.1 | −10.0 ± 0.5 | −1.8 ± 0.6 | −8.2 ± 0.4 |
| QT4-7 (321–388) | 4.0 | 1.6 ± 0.4 | −10.0 ± 0.5 | −2.1 ± 0.6 | −7.9 ± 0.4 |
Table 2
Thermodynamic parameters of peptide-LC8 interactions.
https://doi.org/10.7554/eLife.36258.010| Peptide | Peptide Sequence*,† | N | Kd (μM) | ΔH (kcal/mol) | TΔS (kcal/mol) | ΔG(kcal/mol) |
|---|---|---|---|---|---|---|
| QT1p | ymssQKLDMETQTEe | 1.1 | 14 ± 3.5 | −5.9 ± 0.3 | 0.7 ± 0.4 | −6.6 ± 0.3 |
| QT2p | ylapLLRDIETQTPd | 1.0 | 7 ± 0.4 | −9.2 ± 0.5 | −2.2 ± 0.6 | −7.0 ± 0.4 |
| QT3p | ytpdTRGDIGTMTDd | --- | weak | ----- | ----- | ----- |
| QT4p | dlqTSAHMYTQTCd | 1.1 | 15 ± 0.8 | −8.7 ± 0.4 | −2.1 ± 0.5 | −6.6 ± 0.3 |
| QT5p | eelGLSHIQTQTHw | 0.9 | 11 ± 0.6 | −8.8 ± 0.4 | −2.0 ± 0.5 | −6.8 ± 0.3 |
| QT6p | wpdgLYNTQHTQTCd | 1.1 | 20 ± 1.0 | −8.6 ± 0.4 | −2.2 ± 0.5 | −6.4 ± 0.3 |
| QT7p | epdNFQSTCTQTRw | 1.1 | 10 ± 0.5 | −7.8 ± 0.4 | −0.9 ± 0.5 | −6.9 ± 0.3 |
-
*the 10-amino acid LC8 binding motif is capitalized
†non-native residues added to the N-terminus of each peptide to increase solubility or improve concentration determination are underlined
Table 3
Thermodynamic parameters of ASCIZ-LC8 interactions.
https://doi.org/10.7554/eLife.36258.021| Construct | N | Overall Kd (μM) | Overall ΔH (kcal/mol) | Overall TΔS (kcal/mol) | Overall ΔG (kcal/mol) |
|---|---|---|---|---|---|
| hLBD | 11.2 | 0.9 ± 0.1 | −10.6 ± 0.5 | −2.4 ± 0.6 | −8.2 ± 0.4 |
| AAA8-11 | 6.7 | 0.7 ± 0.1 | −10.4 ± 0.5 | −2.0 ± 0.6 | −8.4 ± 0.4 |
| AAA1-4 | 6.6 | 2.7 ± 0.1 | −12.6 ± 0.6 | −5.0 ± 0.7 | −7.6 ± 0.4 |
| AAA5-11 | 4.2 | 1.5 ± 0.1 | −9.2 ± 0.5 | −1.3 ± 0.6 | −7.9 ± 0.4 |
| AAA1-4, 8–11 | 2.5 | 4.4 ± 0.2 | −12.2 ± 0.6 | −4.9 ± 0.7 | −7.3 ± 0.4 |
Key resources table
| Reagent type (species) or resource | Designation | Source or reference | Identifiers | Additional information |
|---|---|---|---|---|
| Gene (Homo sapiens) | ASCIZ | NA | Uniprot ID: O43313 | |
| Gene (Drosophila melanogaster) | dASCIZ | NA | Uniprot ID: Q9VZU1 | |
| Cell line (Mus musculus) | ASCIZ knockout mouse embryonic fibroblast | PMID: 22167198 | ||
| Antibody | ASCIZ (rabbit monoclonal) | PMID: 15933716 | WB: 100 ng/mL | |
| Commercial assay or kit | Dual-luciferase reporter assay kit | Promega | Catalog number: E1910 | |
| Chemical compound, drug | D-glucose 13C6 | Sigma Aldrich | Catalog number: 389374 | |
| Chemical compound, drug | Ammonium-15N chloride | Sigma Aldrich | Catalog number: 299251 | |
| Software, algorithm | Origin 7.0 | OriginLab | ||
| Software, algorithm | SEDFIT | open-source | ||
| Software, algorithm | SEDNTERP | open-source | ||
| Software, algorithm | SEDPHAT | open-source | ||
| Software, algorithm | Curvefit | Palmer lab website | ||
| Software, algorithm | Topspin | Bruker Biospin Corporation | RRID:SCR_014227 | |
| Software, algorithm | Sparse Multidimentional Fourier Transform | Kozminski lab website | ||
| Software, algorithm | NMRFAM-Sparky | NMR facility at University of Wisconsin-Madison website | RRID:SCR_014228 | |
| Software, algorithm | ATSAS package | EMBL Hamburg BioSAXS website | RRID:SCR_015648 | |
| Software, algorithm | EMAN2 | National Center for Macromolecular Imaging | ||
| Software, algorithm | RELION 2.0 | open-source |
Additional files
-
Transparent reporting form
- https://doi.org/10.7554/eLife.36258.023
Download links
A two-part list of links to download the article, or parts of the article, in various formats.
Downloads (link to download the article as PDF)
Open citations (links to open the citations from this article in various online reference manager services)
Cite this article (links to download the citations from this article in formats compatible with various reference manager tools)
Multivalency regulates activity in an intrinsically disordered transcription factor
eLife 7:e36258.
https://doi.org/10.7554/eLife.36258


