Support for a clade of Placozoa and Cnidaria in genes with minimal compositional bias
- Wellcome Trust Sanger Institute, United Kingdom
- European Molecular Biology Laboratories-European Bioinformatics Institute, United Kingdom
- Max Planck Institute for Marine Microbiology, Germany
- Pacific Biosciences Research Center and the University of Hawaii-Manoa, United States
- University of California, United States
- The Natural History Museum, United Kingdom
- University of Cambridge, United Kingdom
- Harvard University, United States
Figures
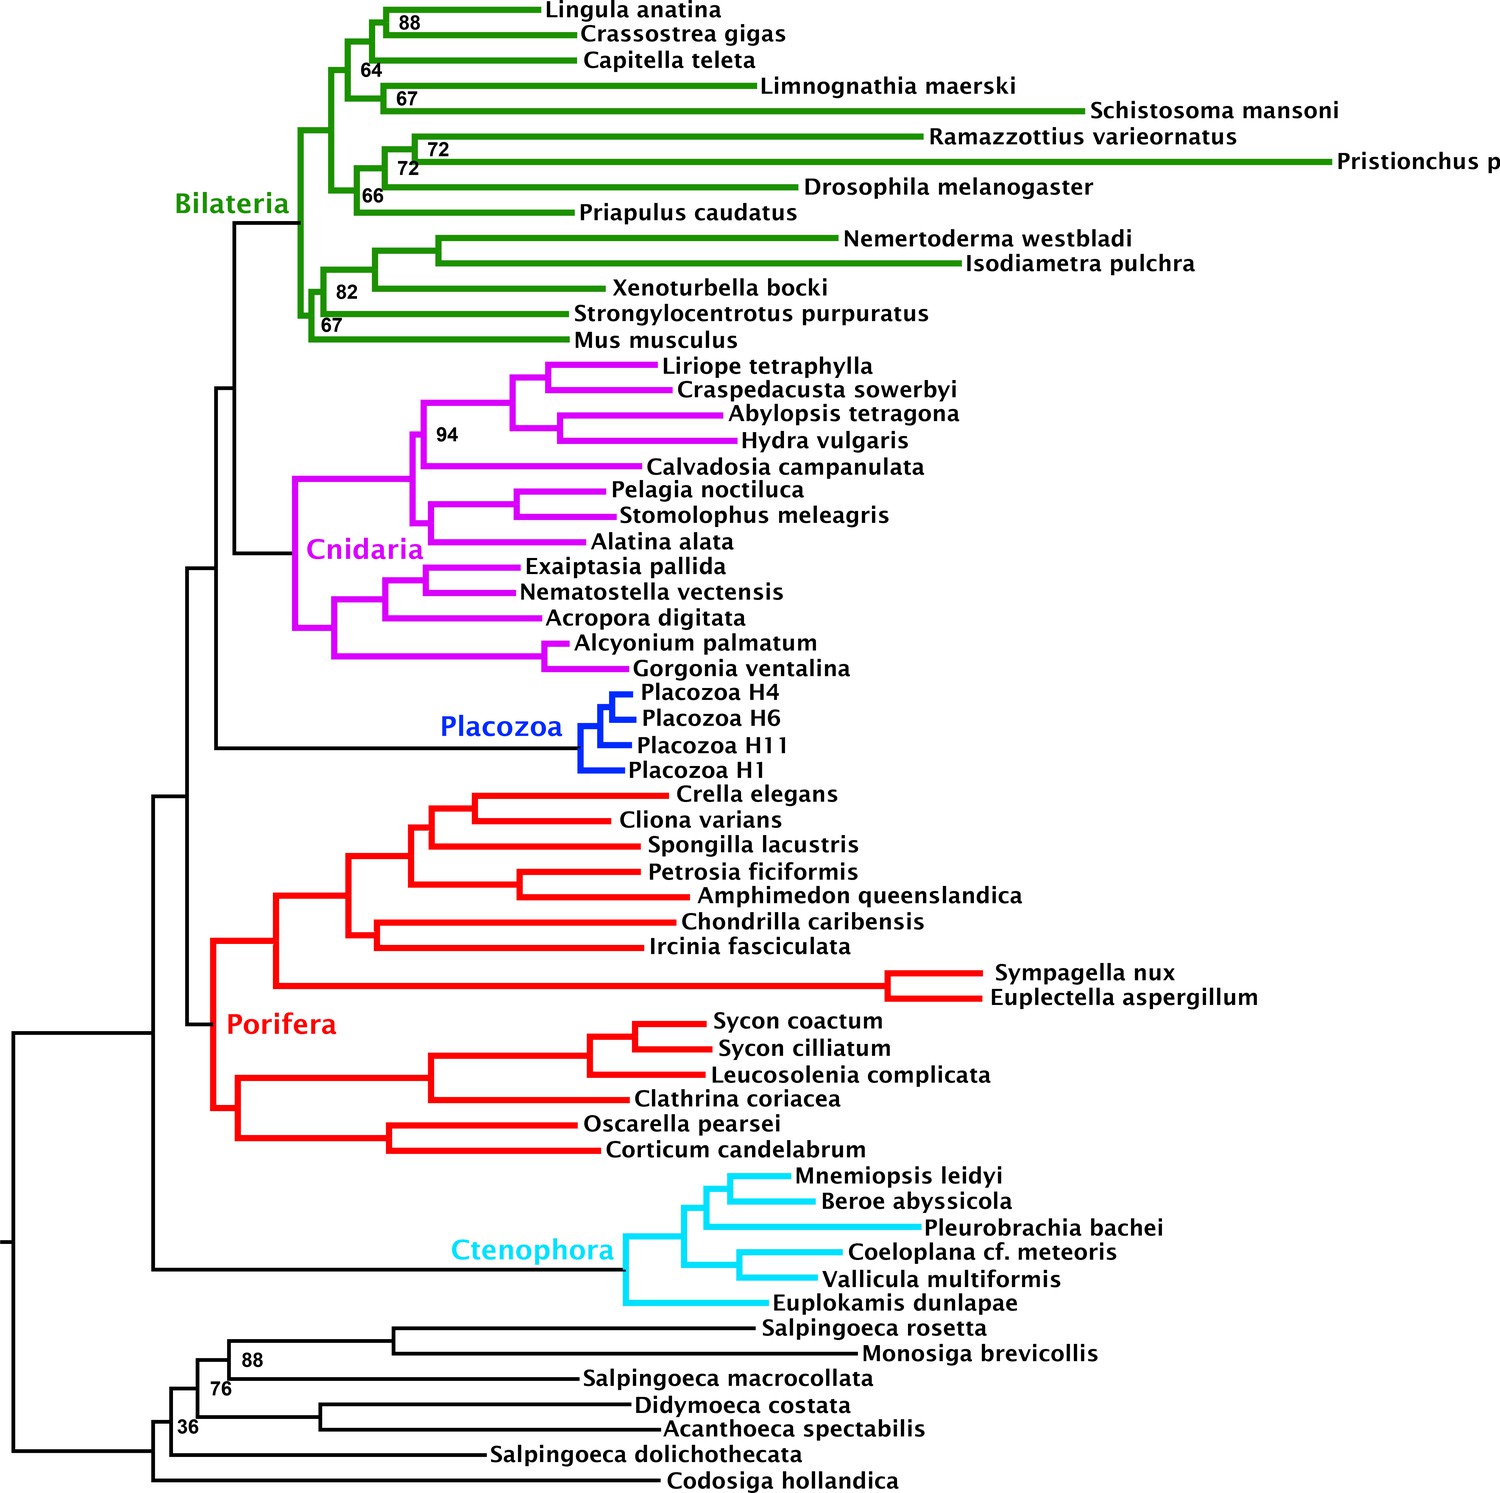
Figure 1 with 2 supplements
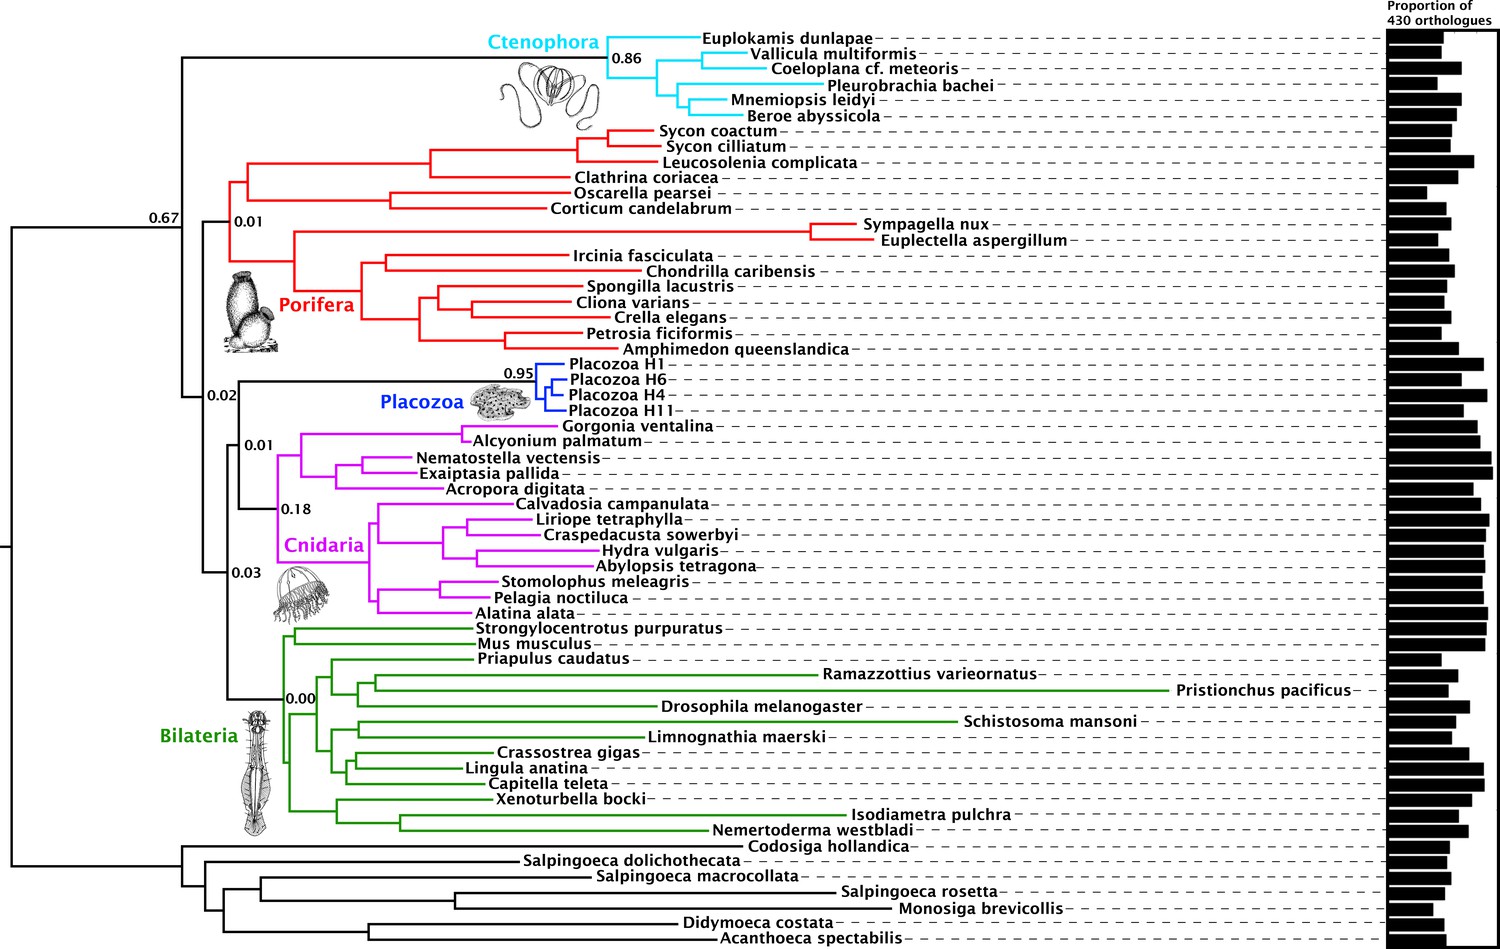
Consensus phylogram showing deep metazoan interrelationships under Bayesian phylogenetic inference of the 430-orthologue amino acid matrix, using the CAT + GTR + Г4 mixture model.
All nodes received full posterior probability. Numerical annotations of given nodes represent Extended Quadripartition Internode Certainty (EQP-IC) scores, describing among-gene-tree agreement for both the monophyly of the five major metazoan clades and the given relationships between them in this reference tree. A bar chart on the right depicts the proportion of the total orthologue set each terminal taxon is represented by in the concatenated matrix. ‘Placozoa H1’ in this and all other figures refers to the GRELL isolate sequenced in Srivastava et al., 2008, which has there and elsewhere been referred to as Trichoplax adhaerens, despite the absence of type material linking this name to any modern isolate. Line drawings of clade representatives are taken from the BIODIDAC database (http://biodidac.bio.uottawa.ca/).
Figure 1—figure supplement 1
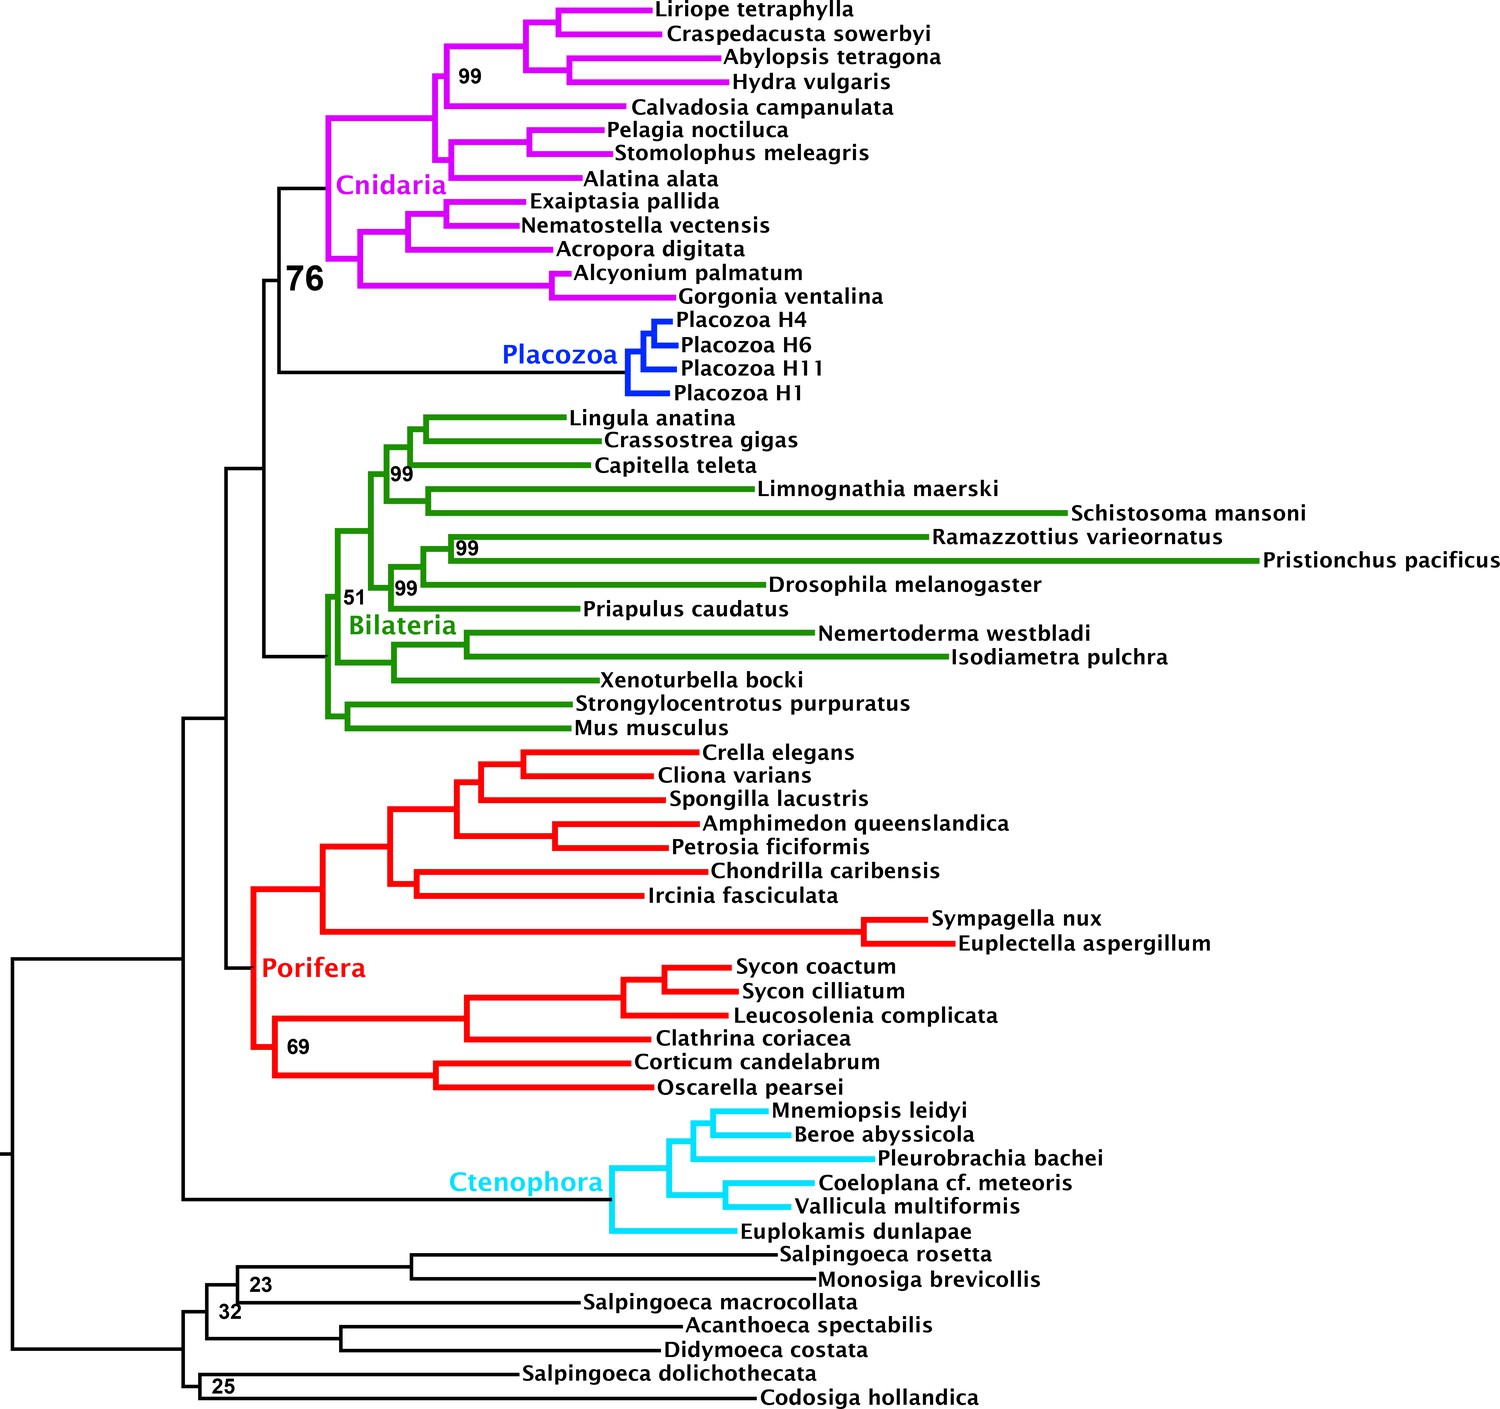
Maximum likelihood tree under the C60 +LG + FO + R4 profile mixture model, inferred from the 430-orthologue matrix with full taxon sampling.
Nodes annotated with ultrafast bootstrap supports with NNI correction; unannotated nodes received full support.
Figure 1—figure supplement 2
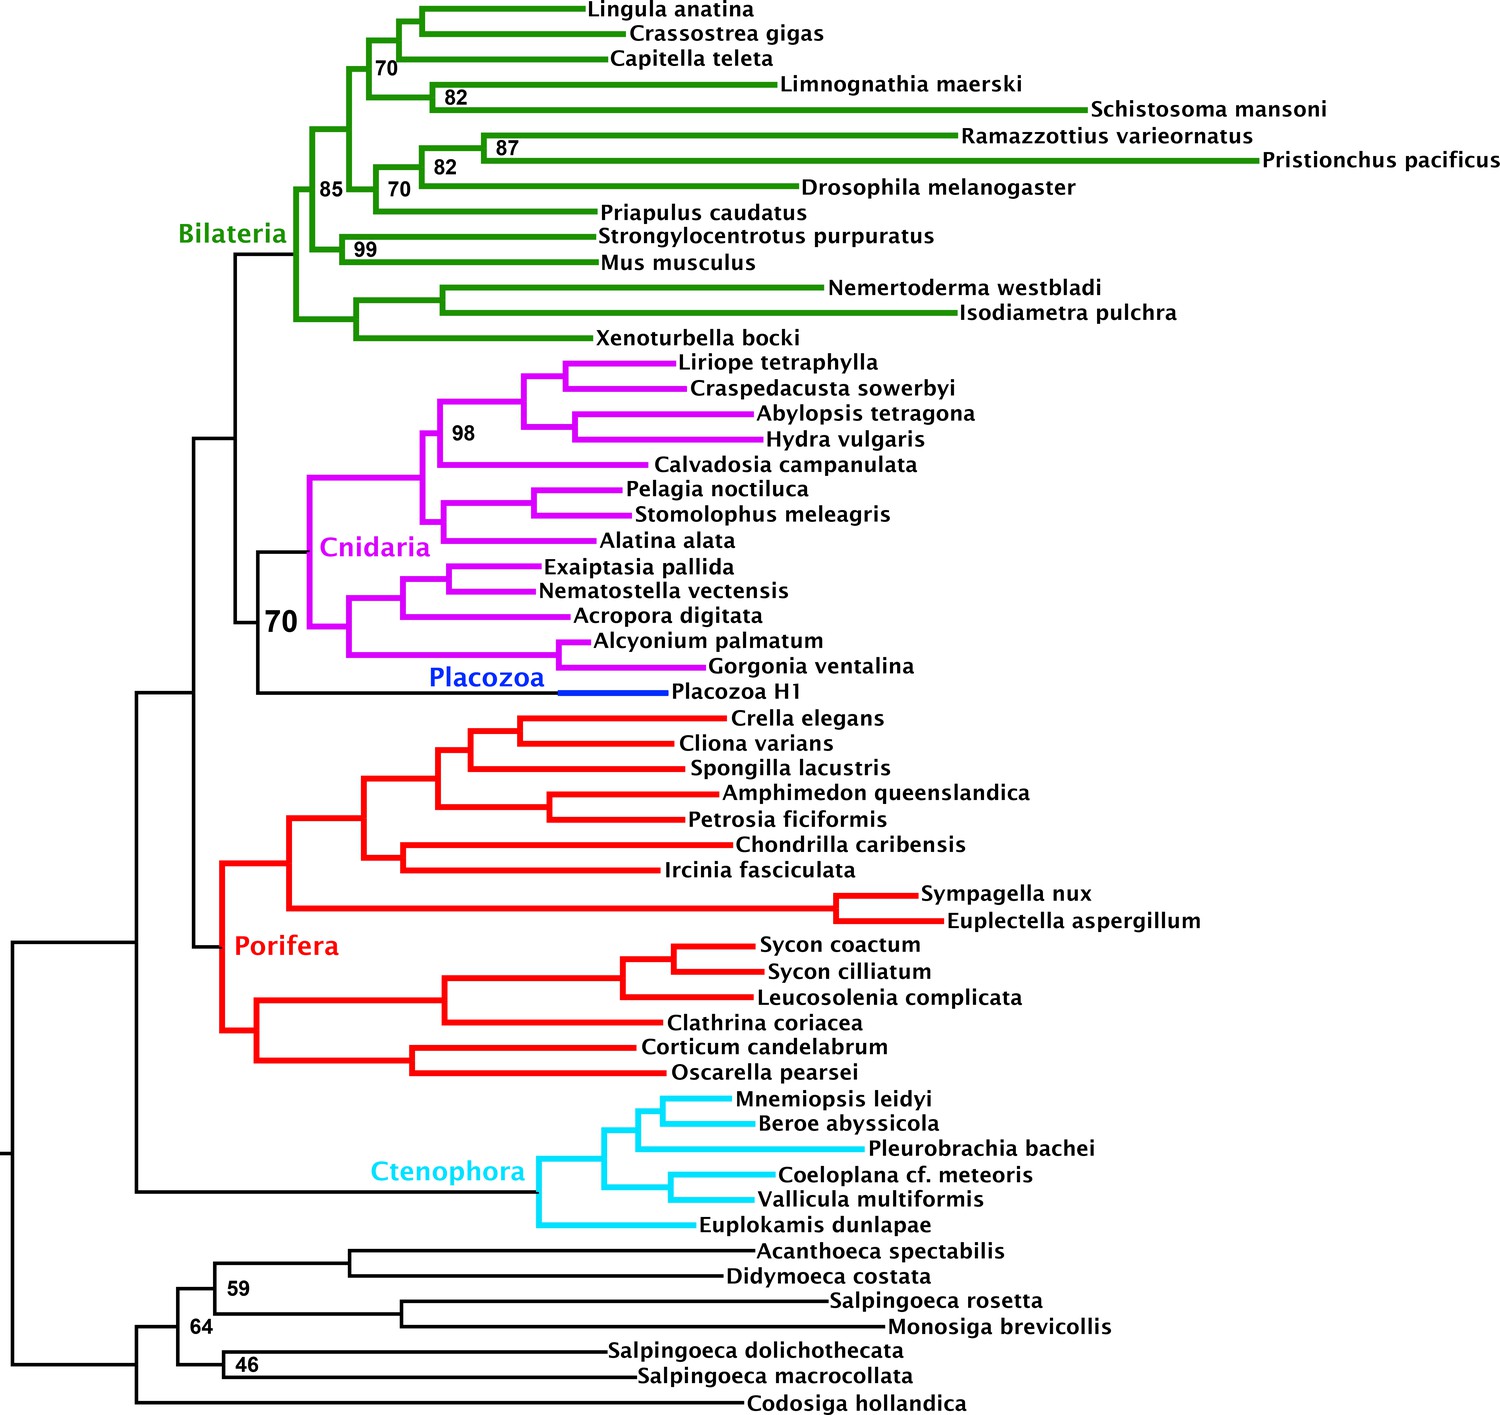
Maximum likelihood tree under a profile mixture model inferred from the 430-orthologue matrix, with only Placozoa H1 used to represent this clade.
Nodes annotated with ultrafast bootstrap supports with NNI correction; unannotated nodes received full support.
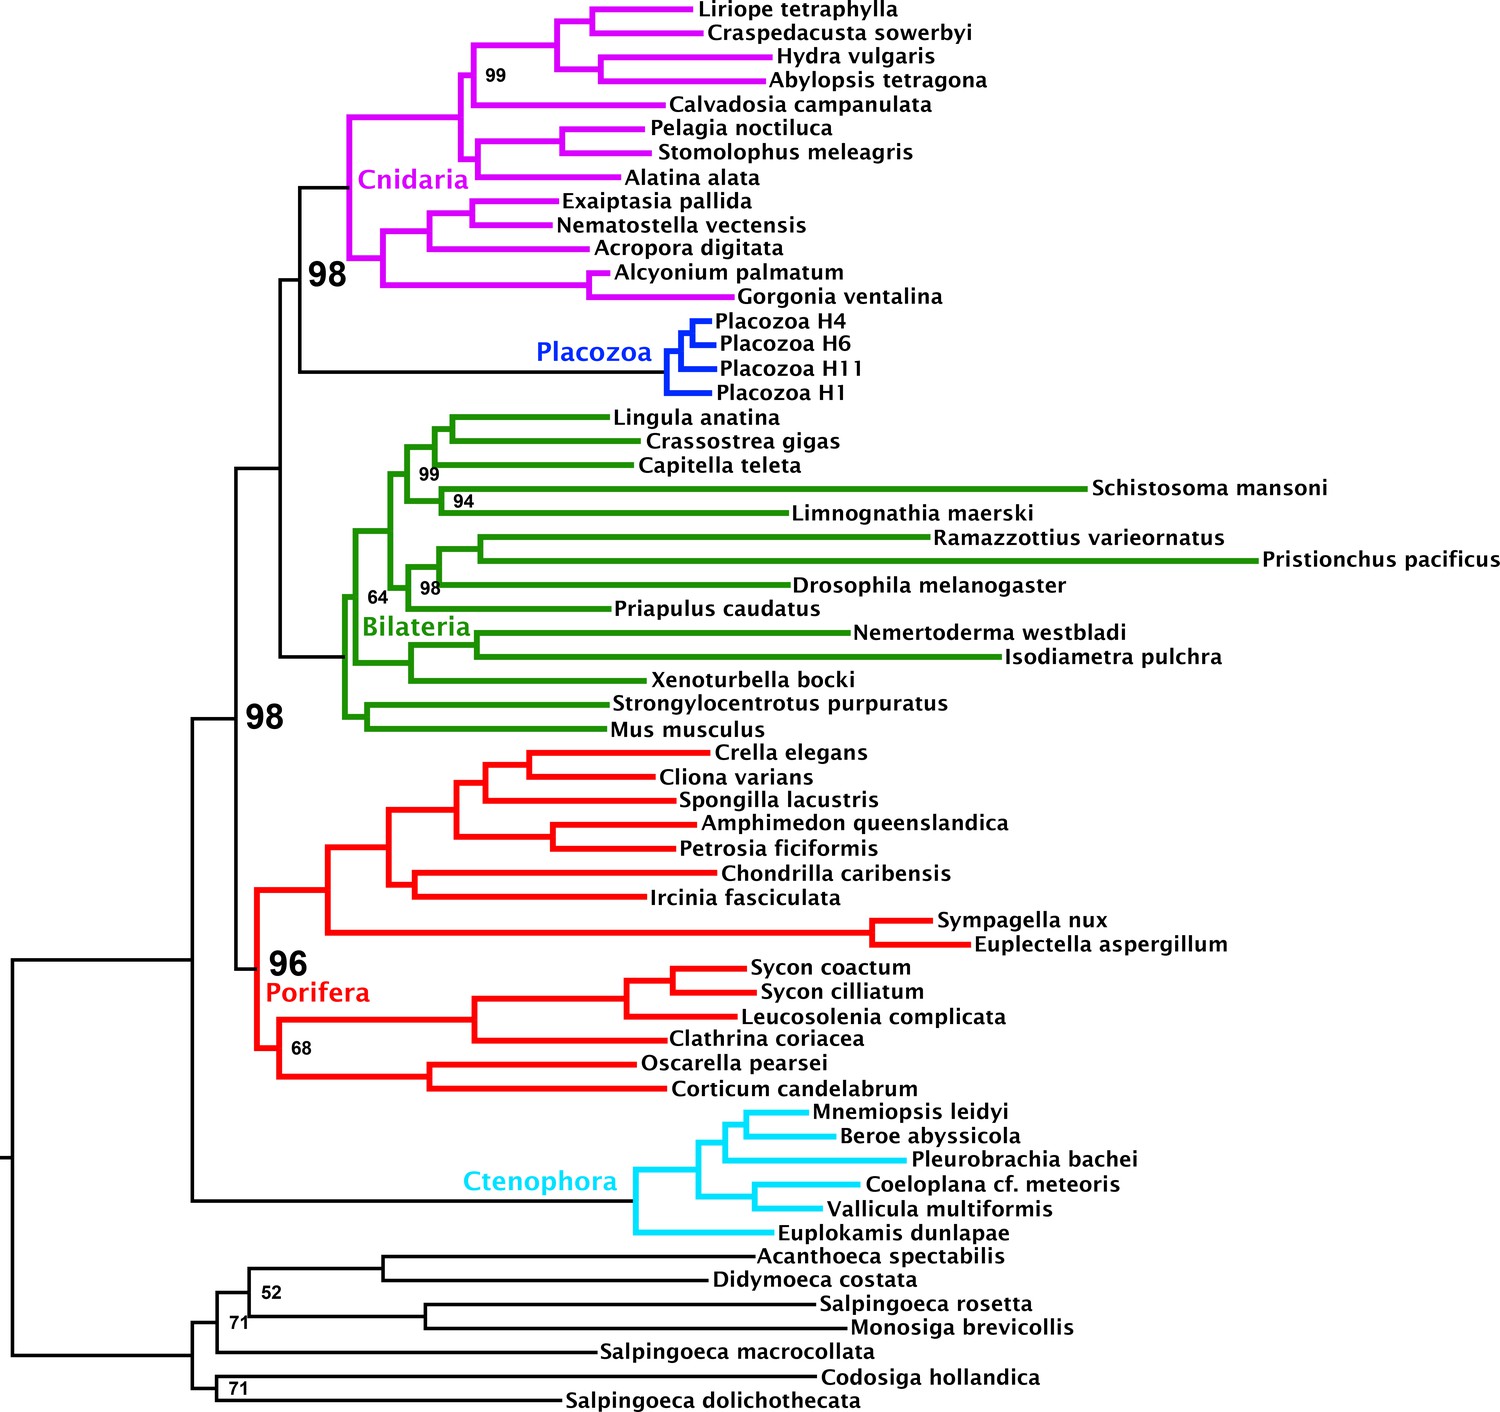
Figure 2
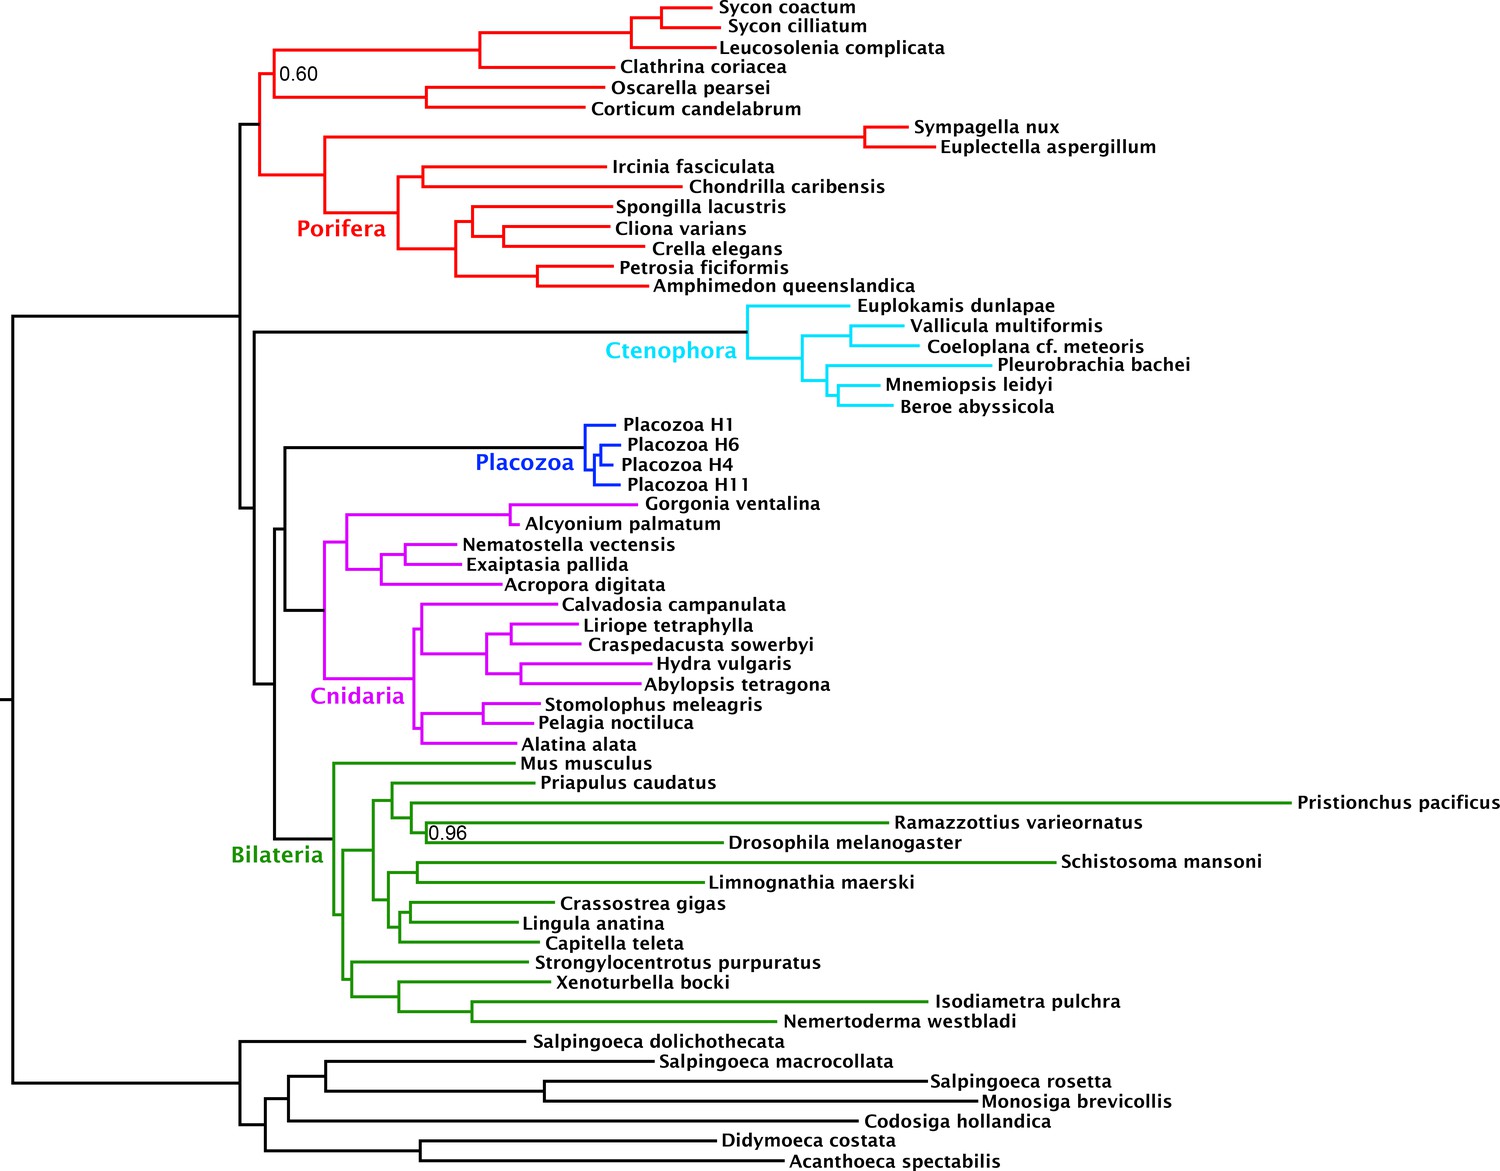
Consensus phylogram under Bayesian phylogenetic inference under the CAT + GTR + Г4 mixture model, on the 430-orthologue concatenated amino acid matrix, recoded into 6 Dayhoff groups.
Nodes annotated with posterior probability; unannotated nodes received full support.
Figure 3
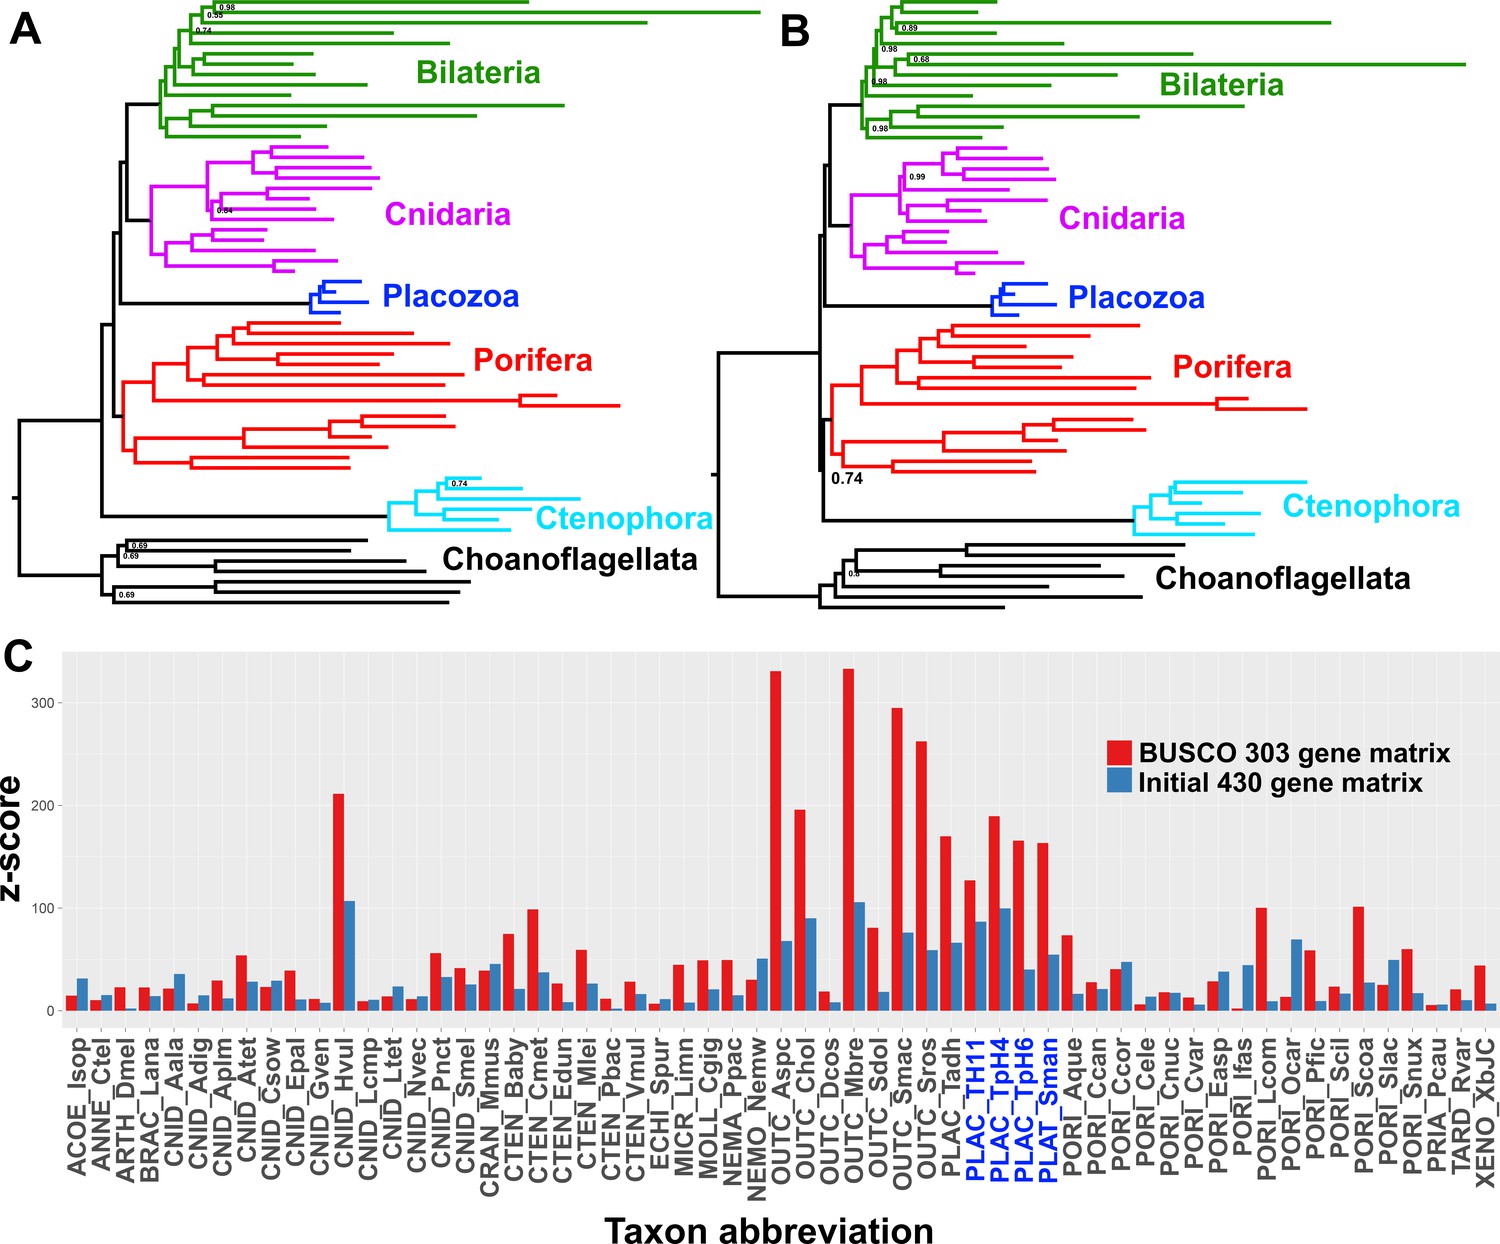
Posterior consensus trees from CAT + GTR + Г4 mixture model analysis of a 94,444 amino acid supermatrix derived from the 303 single-copy conserved eukaryotic BUSCO orthologs, analysed in A.
amino acid space or (B) the Dayhoff-6 reduced alphabet space. Nodal support values comprise posterior probabilities; nodes with full support not annotated. Taxon colourings as in previous Figures. (C) Plot of z-scores (summed absolute distance between taxon-specific and global empirical frequencies) from representative posterior predictive tests of amino acid compositional bias, from both the BUSCO 303-orthologue matrix (red) and the initial 430-orthologue matrix (blue). Placozoan taxon abbreviations are shown in blue font.
Figure 4 with 2 supplements
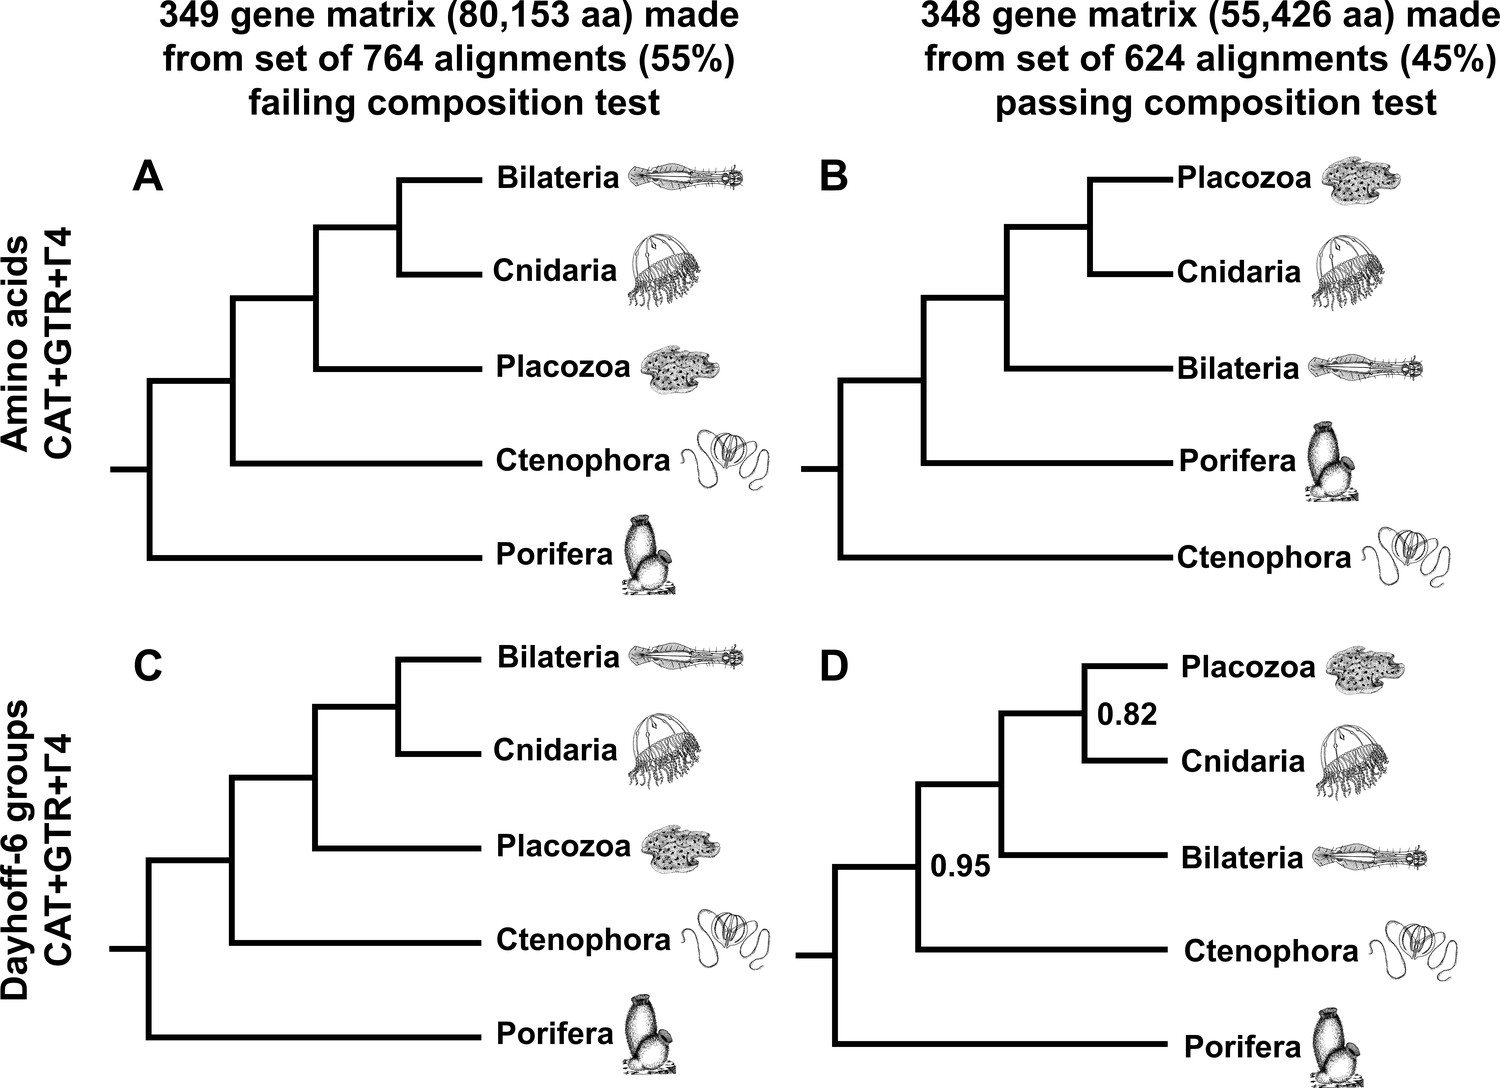
Schematic depiction of deep metazoan interrelationships in posterior consensus trees from CAT + GTR + Г4 mixture model analyses of matrices made from subsets of genes passing or failing a sensitive null-simulation test of compositional heterogeneity.
Panels correspond to (A) the amino acid matrix made within the failing set; (B) the amino acid matrix derived from the passing set; (C) the Dayhoff-6 recoded matrix from the failing set; (D) the Dayhoff-6 recoded matrix from the passing set. Only nodes with posterior probability less than 1.00 are annotated numerically.
Figure 4—figure supplement 1
Maximum likelihood tree under a profile mixture model inferred from the 349-orthologue matrix composed from the subset of genes binned as failing the null-simulation compositional bias test.
Nodes annotated with ultrafast bootstrap supports with NNI correction; unannotated nodes received full support.
Figure 4—figure supplement 2
Maximum likelihood tree under a profile mixture model inferred from the 348-orthologue matrix composed from the subset of genes binned as passing the null-simulation compositional bias test.
Nodes annotated with ultrafast bootstrap supports with NNI correction; unannotated nodes received full support.
Author response image 1

Tables
Table 1
Summary statistics describing the contiguity and completeness of the draft host metagenome bins from the three clade A placozoan isolates utilized in this paper, presented in comparison to the reference H1 strain.
https://doi.org/10.7554/eLife.36278.003| H11 | H4 | H6 | H1 | |
|---|---|---|---|---|
| assembly span (Mbp) | 56.63 | 83.39 | 76.7 | 98.06 |
| scaffold number | 5813 | 5337 | 8310 | 1415 |
| scaffold N50 (kbp) | 12.738 | 25.97 | 12.84 | 5790 |
| GC% | 30.76 | 30.84 | 29.9 | 29.37 |
| BUSCO2 Eukaryota complete (of 303) | 220 | 276 | 239 | 294 |
| BUSCO2 Eukaryota complete + partial (of 303) | 246 | 282 | 265 | 298 |
| Average # of hits per BUSCO | 1.00 | 1.04 | 1.00 | 1.00 |
| % of BUSCOs with more than one match | 0.45 | 3.99 | 0.42 | 0.34 |
Table 2
Mean (and standard deviation of) z-scores from posterior predictive tests of per-site amino acid diversity and among-lineage compositional homogeneity, called for amino-acid alignments using the PhyloBayes-MPI v1.8 readpb_mpi –div and –comp options, respectively, with burn-ins selected as per the posterior consensus summaries shown elsewhere.
Except for the diversity statistic in the test-passing matrix, all tests reject (at p=0.05) the adequacy of the inferred CAT + GTR + Г4 model to describe the data.
| Diversity | Composition (mean) | Composition (maximum) | |
|---|---|---|---|
| 430 matrix | 1.94 (0.09) | 181.35 (7.50) | 105.04 (3.13) |
| BUSCO 303-gene matrix | 11.27 (0.73) | 334.98 (4.56) | 107.56 (6.17) |
| comp-failed matrix | 2.51 (0.19) | 270.16 (12.03) | 173.87 (9.15) |
| comp-passed matrix | 0.81 (0.18) | 107.67 (10.10) | 63.19 (6.95) |
Additional files
-
Transparent reporting form
- https://doi.org/10.7554/eLife.36278.013
Download links
A two-part list of links to download the article, or parts of the article, in various formats.
Downloads (link to download the article as PDF)
Open citations (links to open the citations from this article in various online reference manager services)
Cite this article (links to download the citations from this article in formats compatible with various reference manager tools)
Support for a clade of Placozoa and Cnidaria in genes with minimal compositional bias
eLife 7:e36278.
https://doi.org/10.7554/eLife.36278


