RNA-directed activation of cytoplasmic dynein-1 in reconstituted transport RNPs
- MRC Laboratory of Molecular Biology, United Kingdom
Figures
Figure 1 with 4 supplements
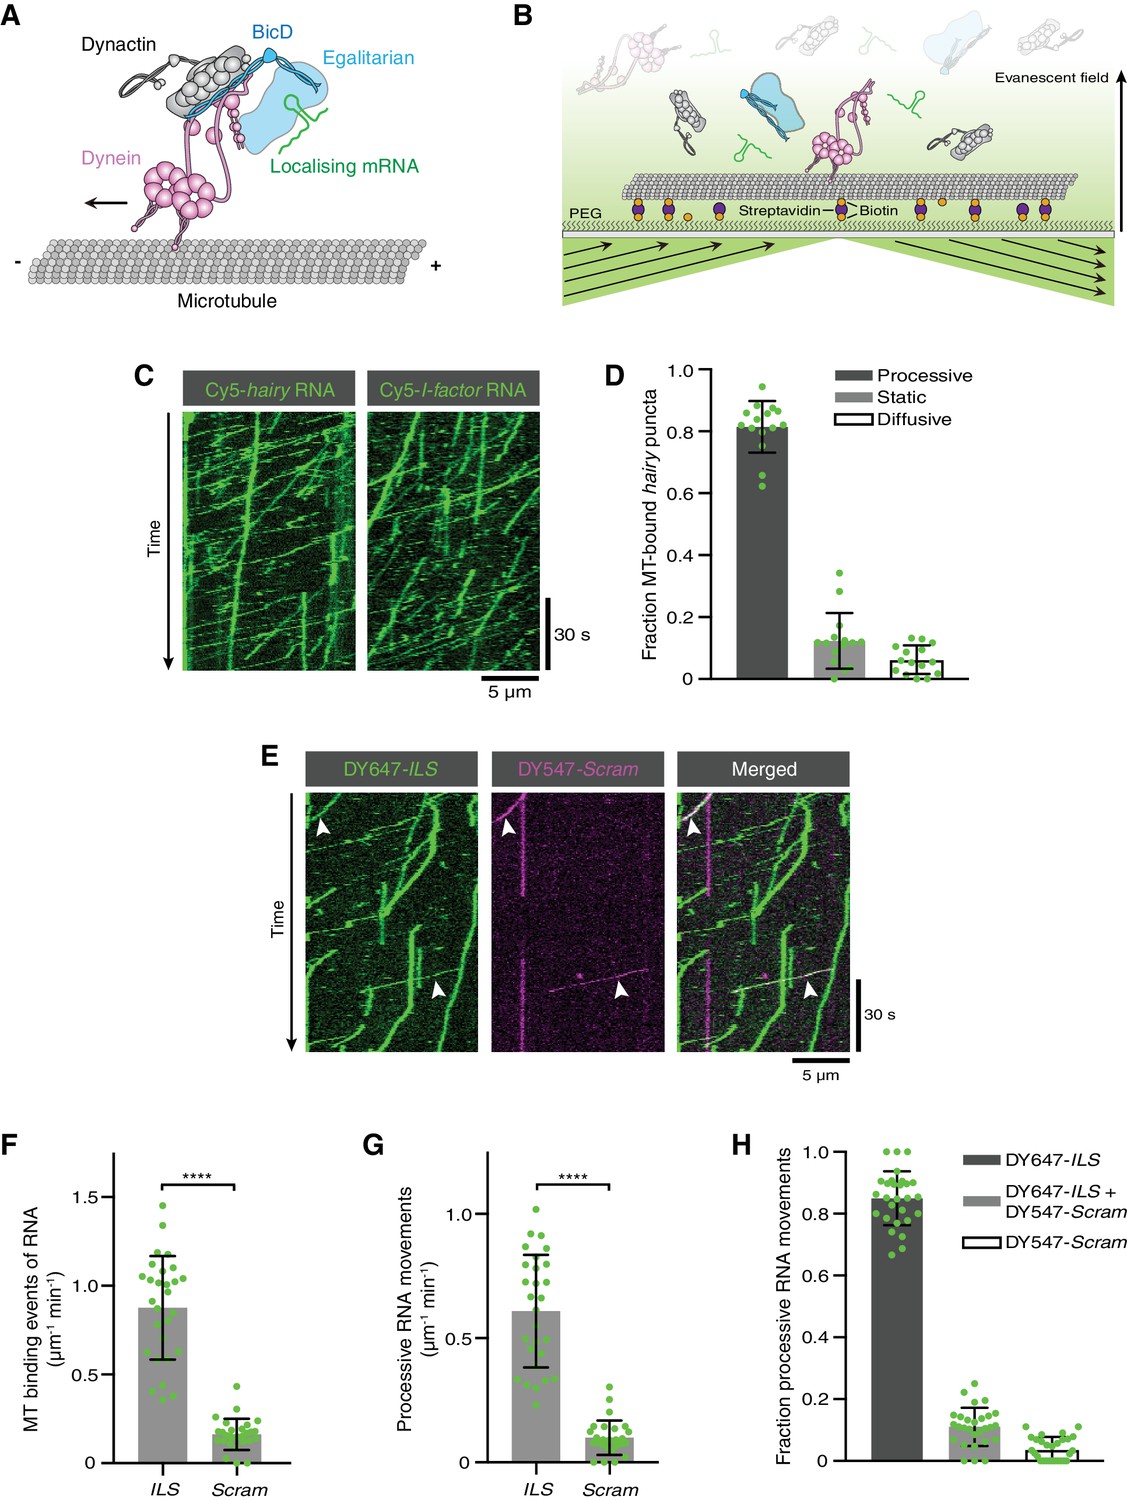
Reconstitution of dynein-based RNA transport with purified proteins.
(A) Existing model for linkage of localising mRNAs to dynein. Note that there is no structural information available for Egl. (B) Diagram of TIRF-based in vitro motility assay. RNAs and proteins were incubated together for at least 1 hr on ice at the following molar concentrations: 100 nM dynein dimers, 200 nM dynactin, 100 nM Egl/BICD2 (with the operational assumption of two Egl molecules per BICD2 dimer) and 1 μM RNA. RNA-protein mixtures were typically diluted 40-fold and injected into imaging chambers containing microtubules that were pre-immobilised on passivated glass surfaces. (C) Examples of kymographs (time-distance plots) showing behaviour of Cyanine5 (Cy5)-labelled hairy or I-factor RNAs in the presence of Egl/BICD2, dynein and dynactin. Diagonal lines are processive movements. In these and other kymographs, the microtubule minus end is to the left. (D) Fraction of microtubule (MT)-associated hairy RNA complexes that are processive, static or diffusive. (E) Kymograph illustrating behaviour of DY647-labelled ILS and a scrambled (Scram) version of the sequence labelled with DY547 following co-incubation with Egl/BICD2, dynein and dynactin. Arrowheads: examples of co-transport of the two RNA species. (F and G) Numbers of RNA binding events on microtubules (F) and processive RNA movements (G) of ILS and Scram RNAs. (H) Fraction of processive RNA movements that contain signals from the ILS only, Scram only, or both RNAs. In (D) and (F-H), circles are values for individual microtubules. Error bars: SD. Statistical significance was evaluated with a Welch’s t-test (F and G). ****p<0.0001.
-
Figure 1—source data 1
Numerical values for plots presented in Figure 1D,F–H.
- https://doi.org/10.7554/eLife.36312.009
Figure 1—figure supplement 1

Alignment of the binding site for Rab6GTPand Egl in Drosophila melanogaster BicD with the corresponding region of mouse and human BICD2.
The Drosophila sequence has 71% identity and 93% similarity with the mouse and human sequence.
Figure 1—figure supplement 2
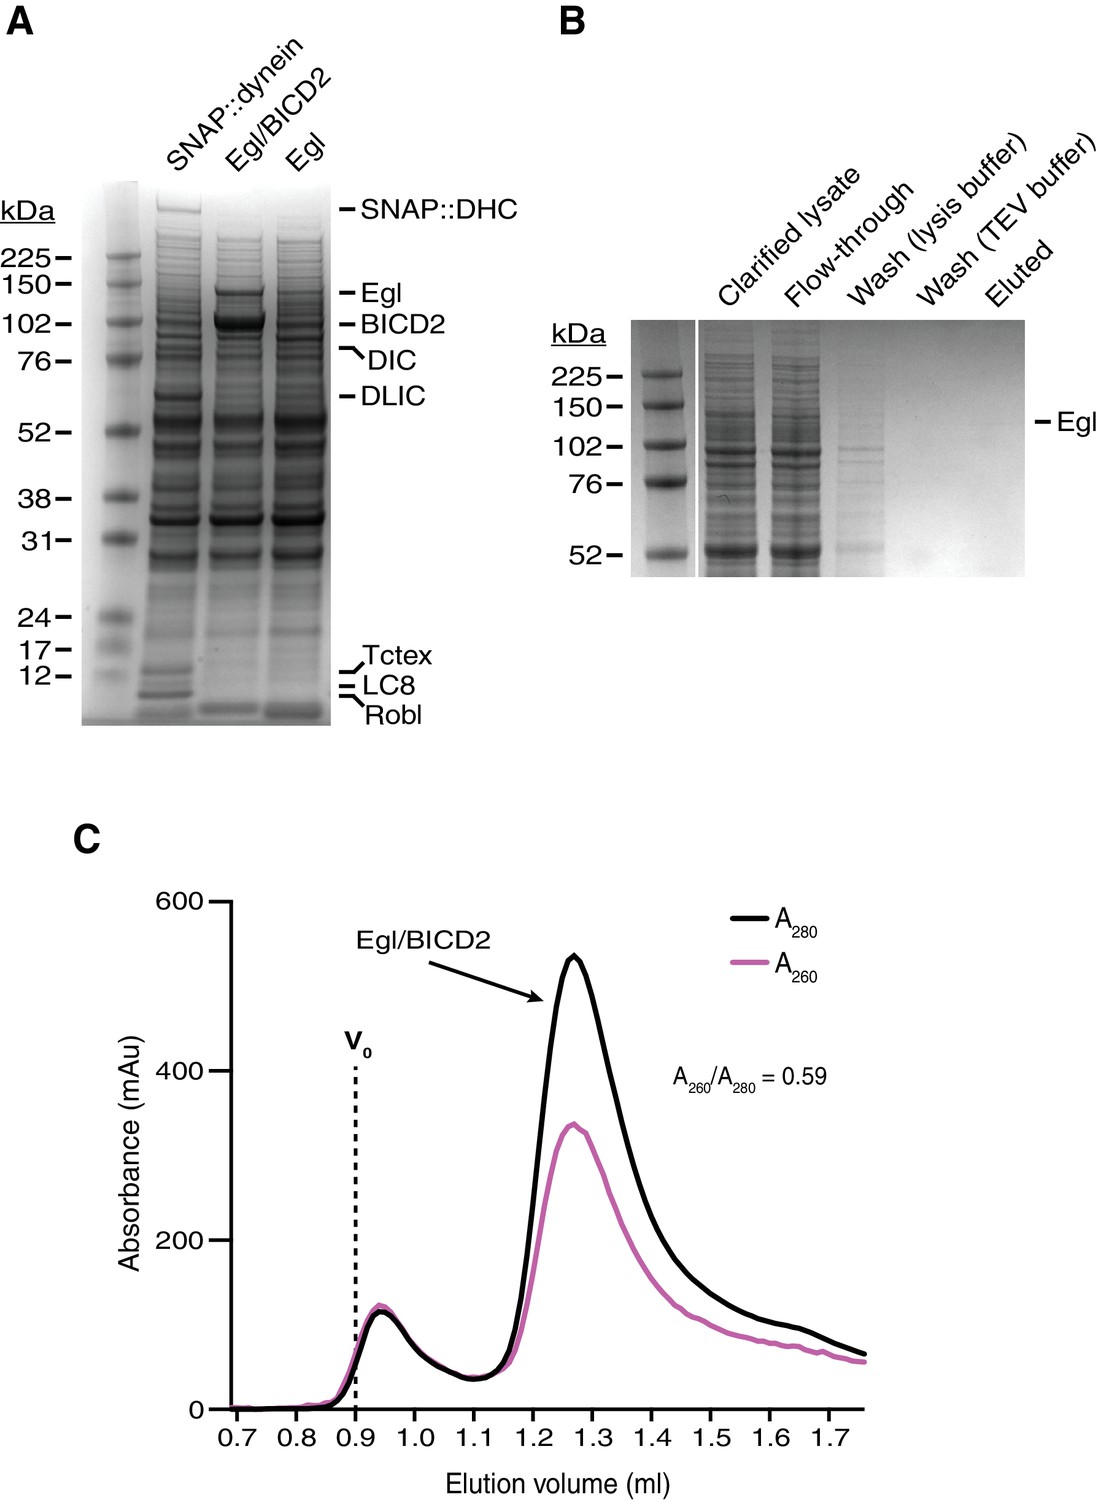
Supplemental data on the purification of Egl/BICD2.
(A) Coomassie-stained gel of clarified lysates of Sf9 cells infected with baculoviruses encoding SNAP::dynein, Egl/BICD2, or Egl alone. The amount of soluble Egl is greatly increased by co-expression of BICD2. The SNAP::dynein lysate is included to illustrate the pattern of endogenous Sf9 cell proteins with molar masses similar to Egl (none of the dynein subunits is found in this region of the gel). (B) Coomassie-stained gel showing the affinity purification steps for Egl expressed alone. The yield of Egl was extremely low in the absence of BICD2 co-expression, presumably due to on-going solubility issues. Flow through: lysate recovered after incubation with the IgG affinity matrix. Wash (lysis buffer): material liberated from the affinity matrix after washing with lysis buffer. Wash (TEV buffer): material liberated from the affinity matrix after washing with TEV buffer. Eluted: material liberated from the affinity matrix by treatment with TEV protease (which cuts between the IgG-binding affinity tag and Egl). No material was recovered after gel filtration of the eluted protein. (C) Size-exclusion chromatography (SEC) trace of Egl/BICD2 produced in GF150 buffer at 4°C (Superose 6 Increase 3.2/300). The ratio of absorbance values at 260 to 280 nm for the peak fractions indicates that there was little, if any, RNA co-purified from the insect cells (A260:A280 is 0.57 for pure protein and 1.05 for a sample with 95% protein and 5% nucleic acid [Glasel, 1995]). Vo: void.
-
Figure 1—figure supplement 2—source data 1
Numerical values for plots in Figure 1—figure supplement 2C.
- https://doi.org/10.7554/eLife.36312.006
Figure 1—figure supplement 3
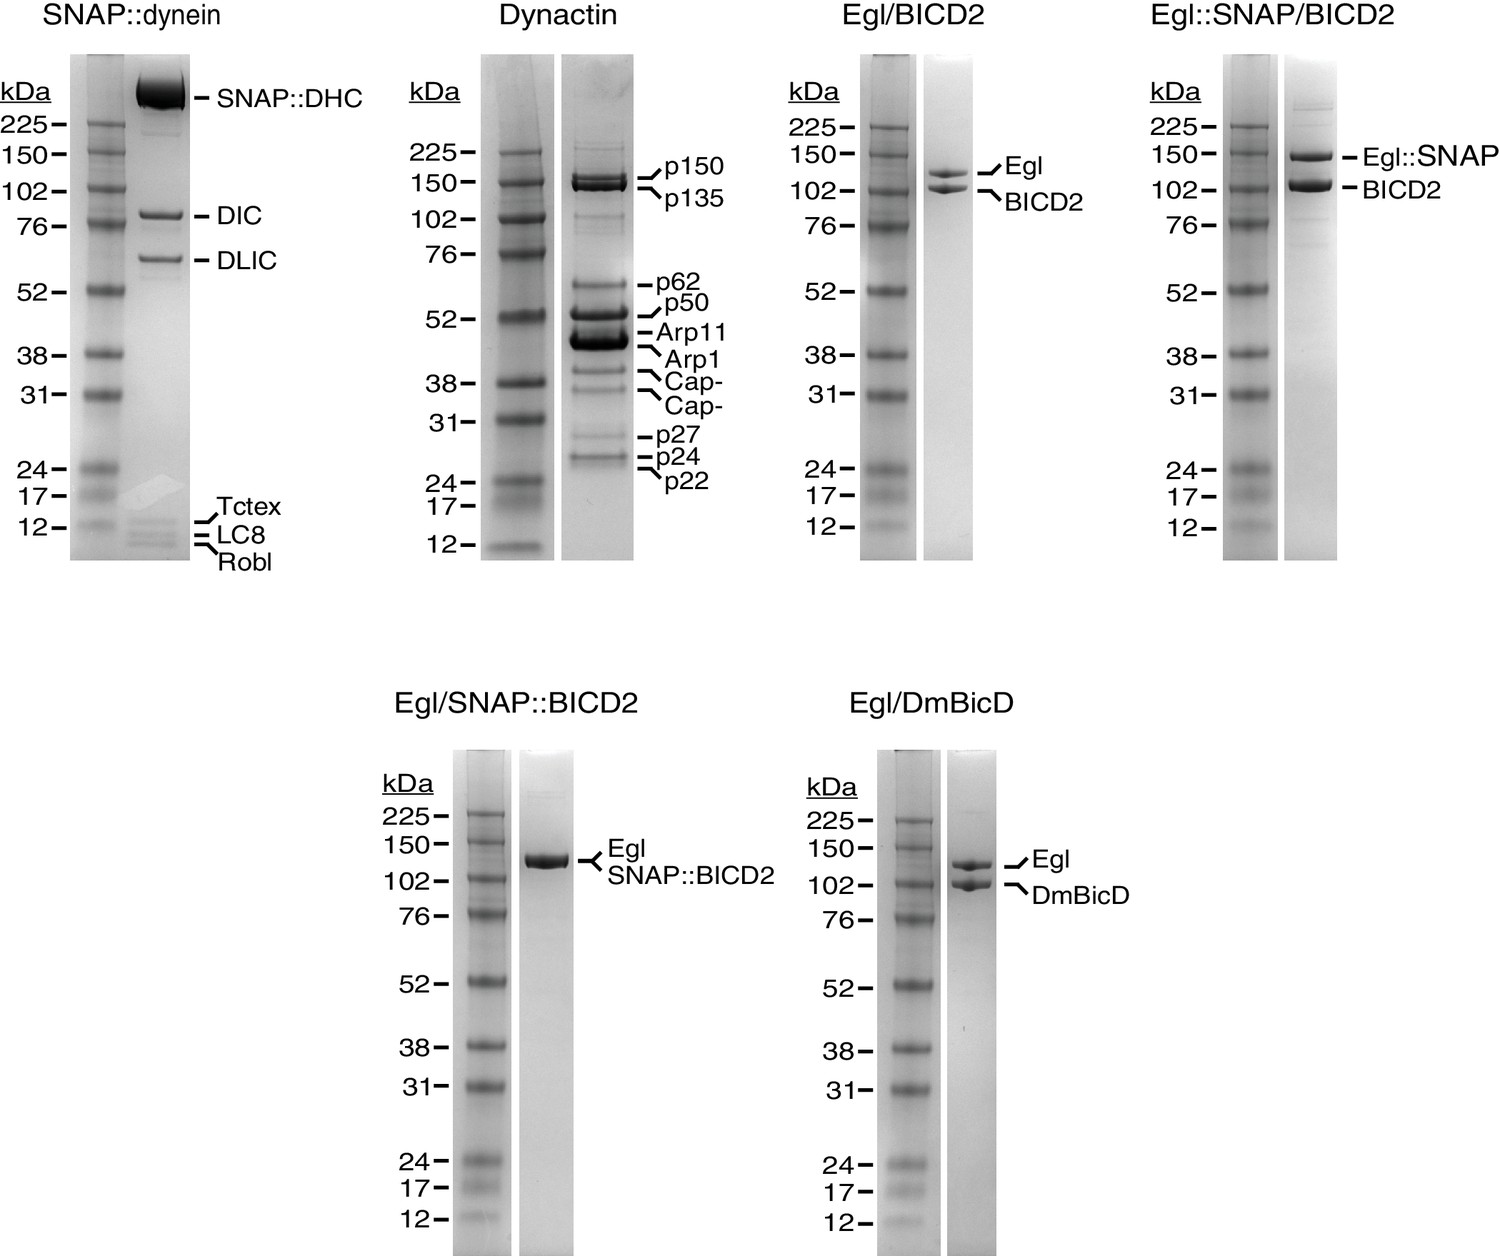
Purity of protein preparations.
Examples of Coomassie-stained gels illustrating purity of protein preparations used for motility assays. The native brain dynactin contains both the p150 and p135 isoforms of DCTN1/Glued, as described previously (Schlager et al., 2014).
Figure 1—figure supplement 4
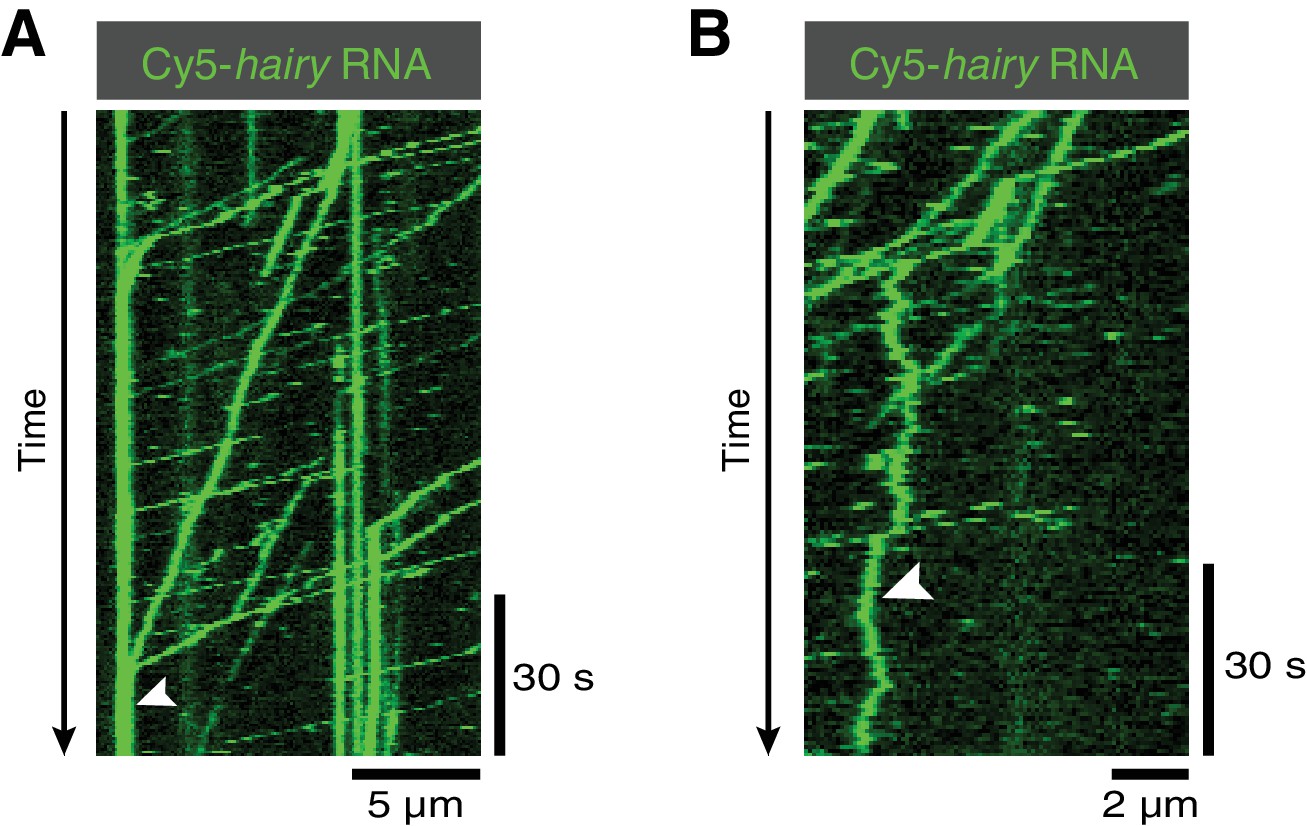
Kymographs illustrating additional behaviours of hairy RNA in the presence of Egl/BICD2, dynactin and dynein.
(A) Accumulation of transported RNPs at the microtubule minus end (arrowhead). (B) Diffusive behaviour of an RNP on the microtubule lattice (arrowhead).
Figure 2 with 2 supplements
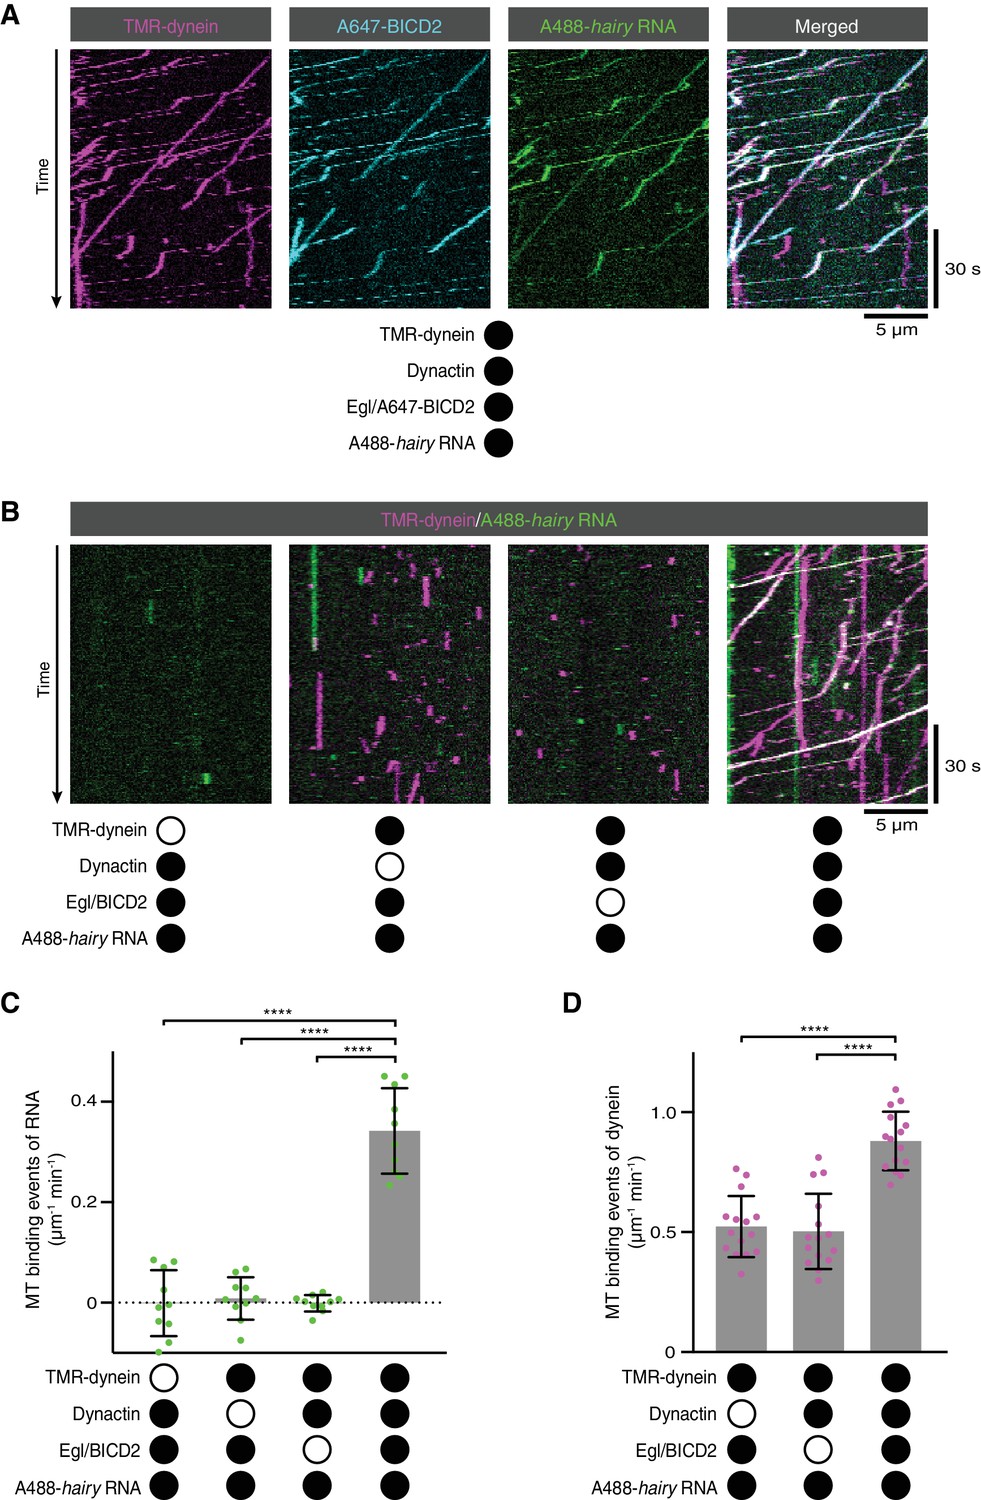
RNA transport by dynein requires the simultaneous presence of Egl/BICD2 and dynactin.
(A) Kymographs showing co-transport of tetramethyrhodamine (TMR)-labelled dynein, Alexa647 (A647)-labelled BICD2 (included in the assembly as a complex with unlabelled Egl) and Alexa488 (A488)-labelled hairy mRNA in the presence of unlabelled dynactin. See Figure 2—figure supplement 1 for equivalent experiment with Egl labelled in the Egl/BICD2 complex. (B) Kymographs illustrating the results of omitting dynein, dynactin or Egl/BICD2 from the assay. Figure 2—figure supplement 2 shows images of separate channels. (C) Binding of Cy5-hairy RNA to microtubules in the presence of the indicated proteins. Signals were corrected for background binding of RNA to the glass surface. (D) Binding of TMR-dynein to microtubules in the presence of the indicated proteins. Background correction was not necessary due to negligible association of dynein with the glass. In this and other figures, black or white circles indicate proteins that were present or absent from the experiment, respectively. In C and D, small circles are values for individual microtubules. Error bars: SD. Statistical significance was evaluated with an ANOVA test with Dunnett’s multiple comparison correction. ****p<0.0001.
-
Figure 2—source data 1
Numerical values for plots presented in Figure 2C,D.
- https://doi.org/10.7554/eLife.36312.014
Figure 2—figure supplement 1
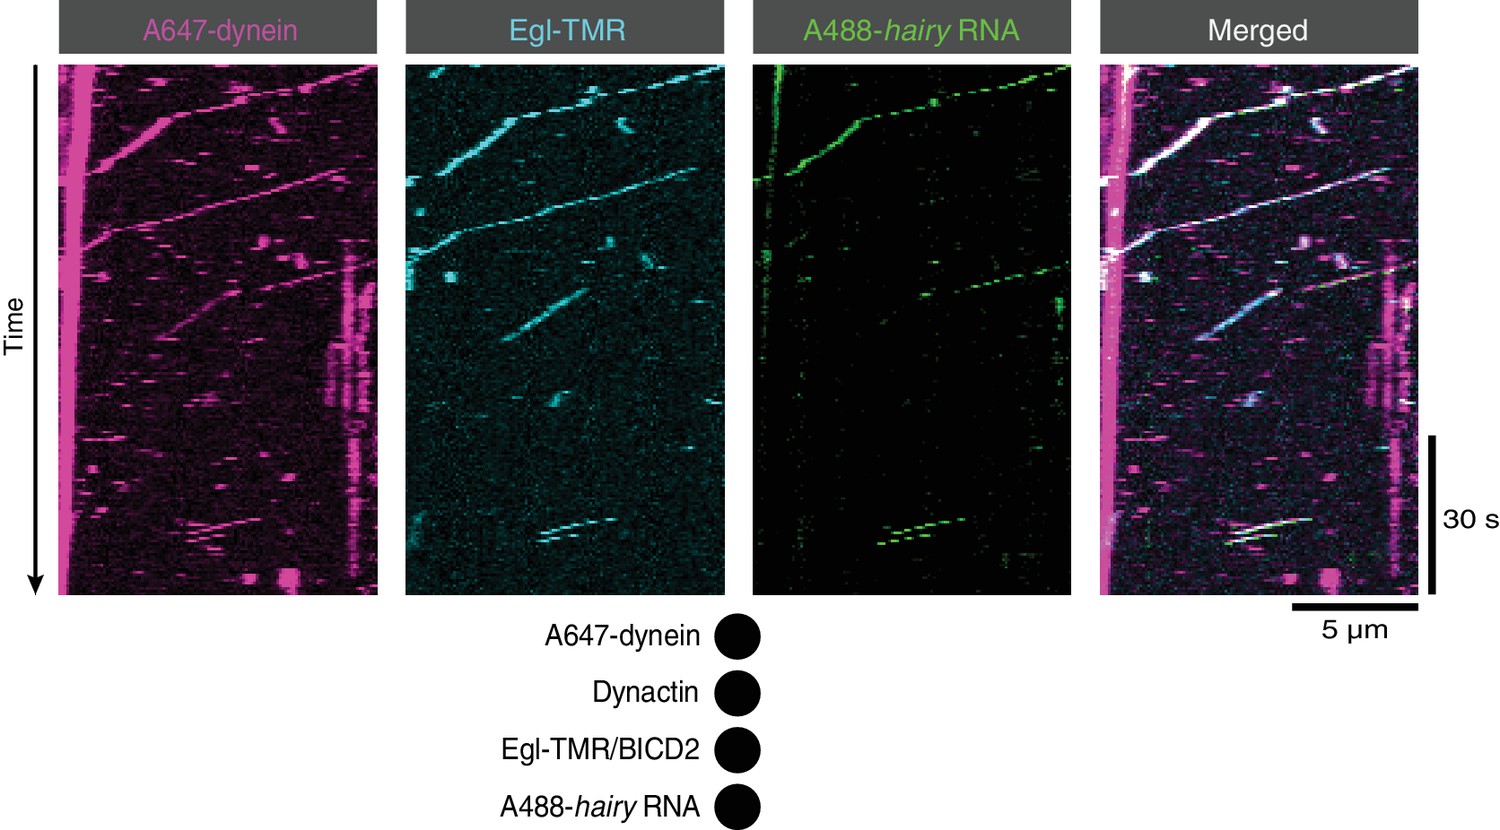
Co-transport of Egl with dynein and RNA in the presence of BICD2 and dynactin.
Kymographs illustrating transport of dynein with Egl (included in the assembly in a complex with unlabelled BICD2) and hairy mRNA in the presence of unlabelled dynactin. See Figure 2A for data from an analogous experiment in which BICD2 was labelled fluorescently within the Egl/BICD2 complex.
Figure 2—figure supplement 2
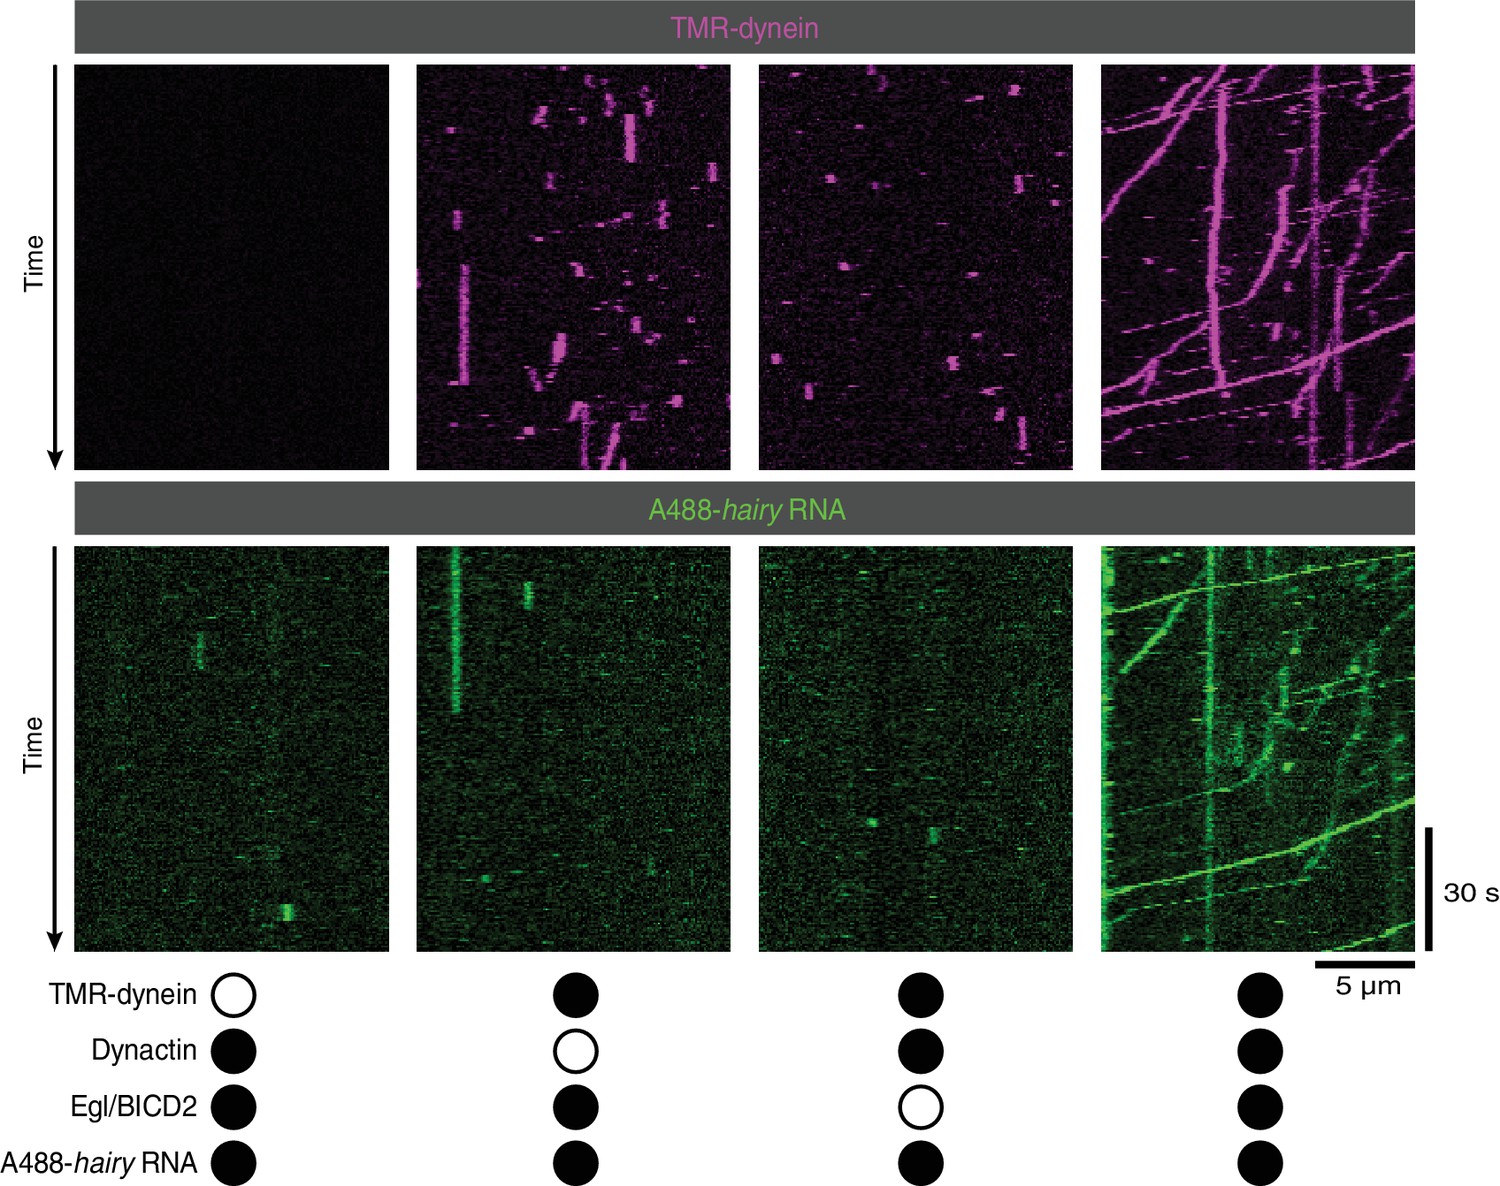
Supplementary data on the requirement for Egl/BICD2 and dynactin for binding of RNA to microtubules and dynein motility.
Images are individual channels for the merged data in Figure 2B.
Figure 3 with 1 supplement
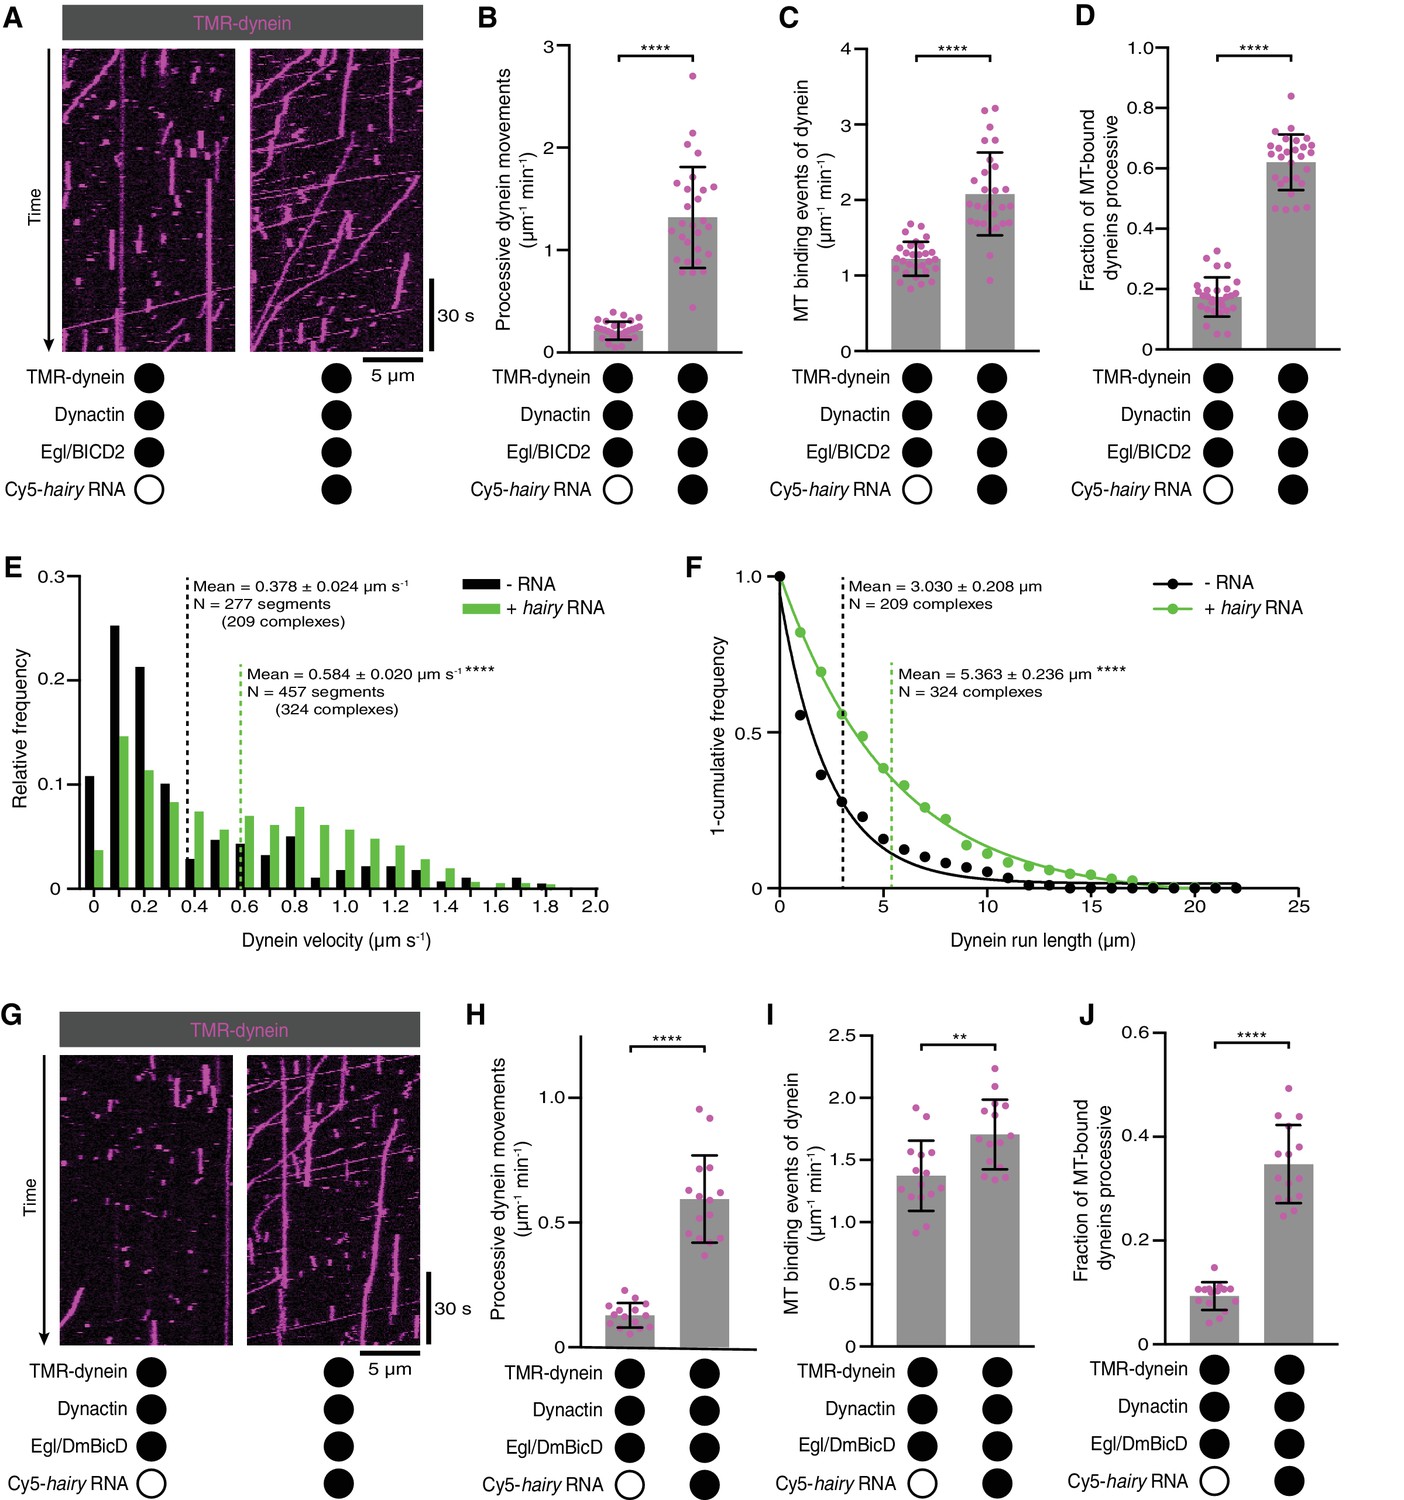
Activation of dynein motility by RNA.
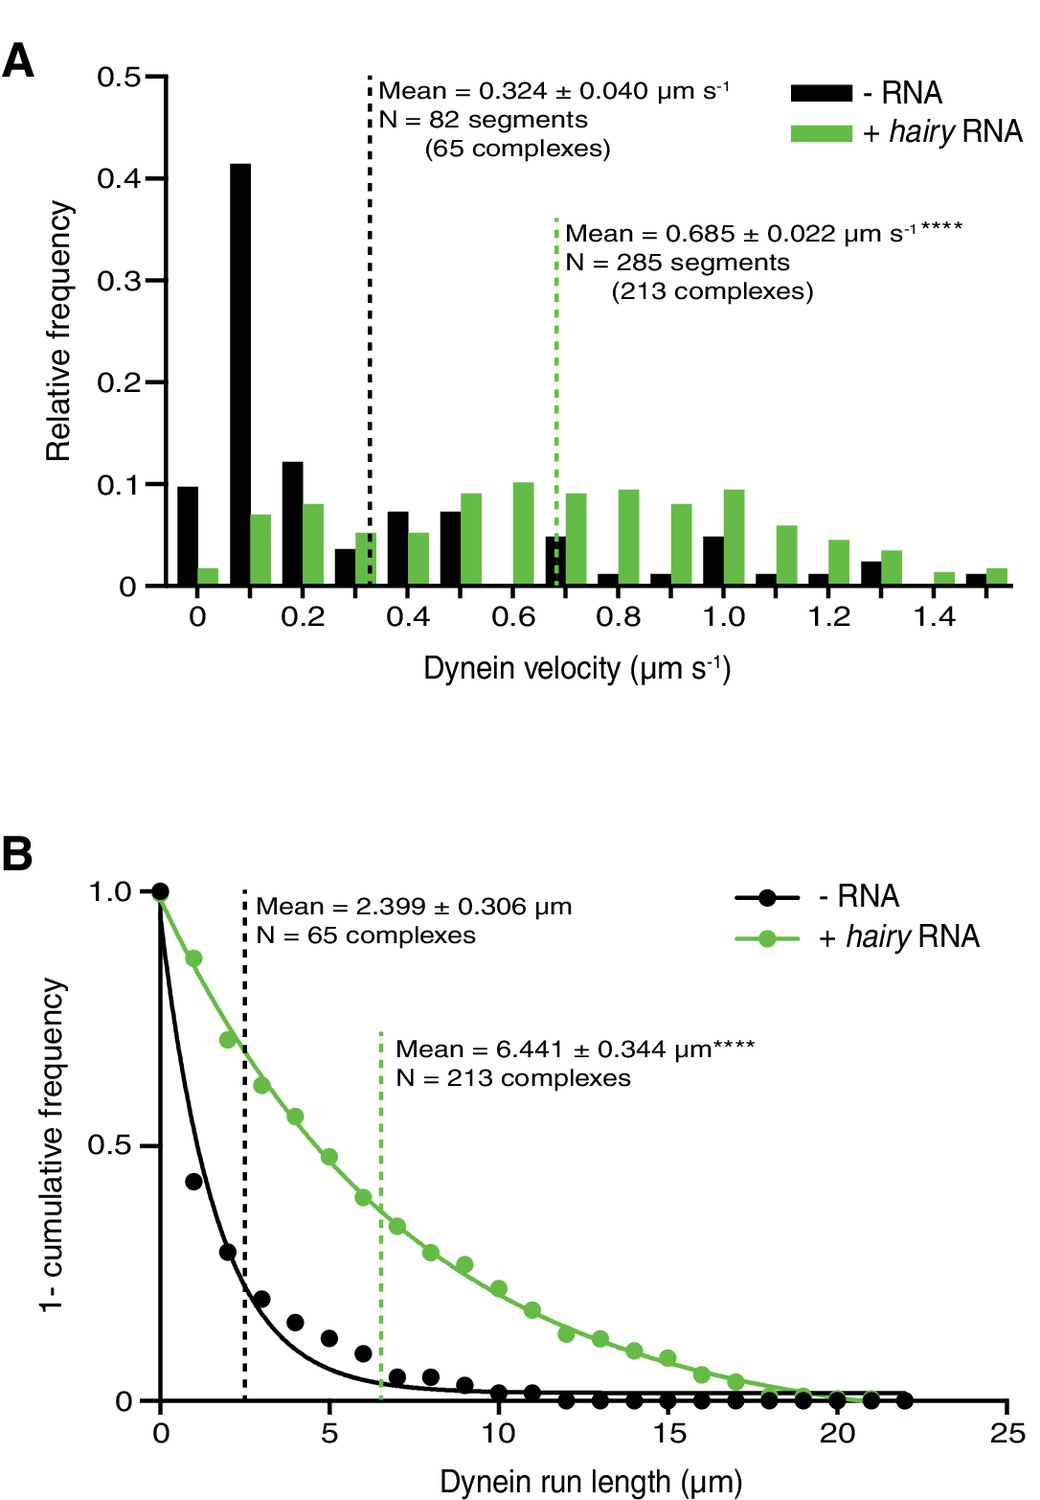
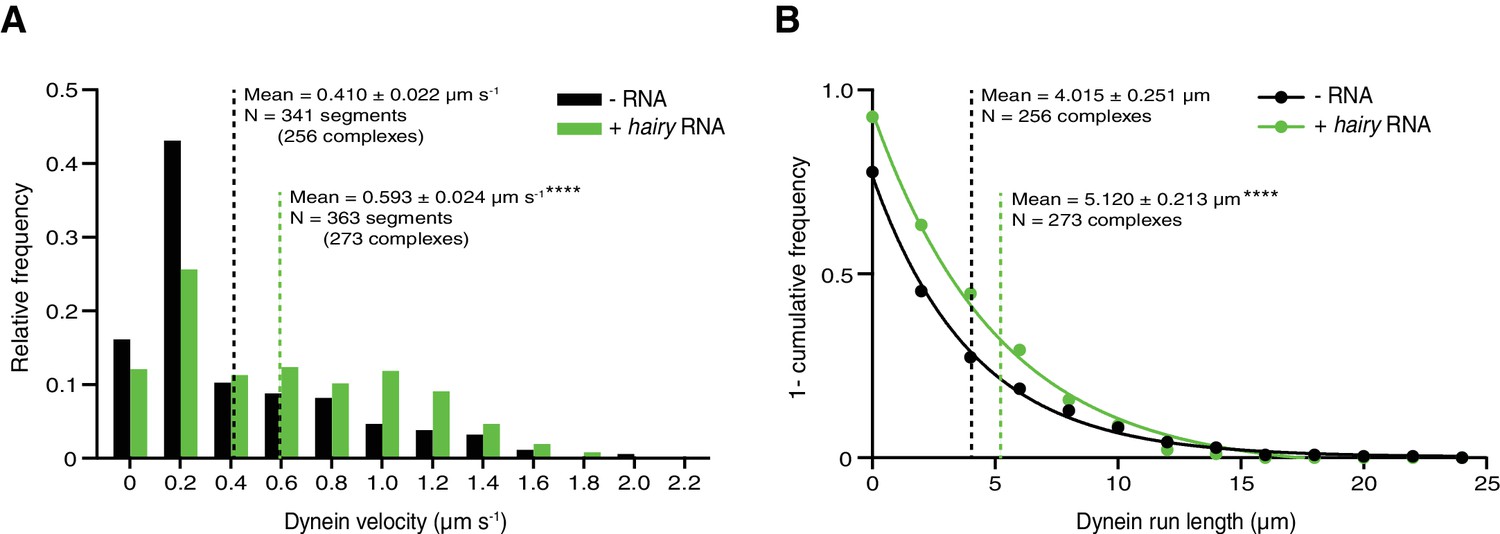
(A) Kymographs illustrating that hairy RNA increases the frequency of processive dynein movements in the presence of Egl/BICD2 and dynactin. (B–D) Numbers of processive dynein movements (B), microtubule-binding events of dynein (C) and fraction of microtubule-binding events that result in processive dynein movements (D) in the presence and absence of hairy RNA. (E and F) Distribution of segmental velocities (E) and run lengths (F) of dynein in the presence of Egl/BICD2 and dynactin ± hairy RNA (for experiments including hairy RNA, only those complexes associated with an RNA signal were analysed). (G) Kymographs illustrating that hairy RNA increases the frequency of processive dynein movements when dynactin and a complex of Egl bound to Drosophila BicD (DmBicD) is included in the assay. (H–J) Numbers of processive dynein movements (H), microtubule-binding events of dynein (I) and fraction of microtubule binding events that result in processive dynein movements (J) in the presence of dynactin and Egl/DmBicD ± hairy RNA. See Figure 3—figure supplement 1 for velocity and run length distributions for these experiments. Errors: SD, except in E and F (SEM). In B-D, and H-J, circles are values for individual microtubules. In B, C, H, and J, statistical significance was evaluated with a Welch’s t-test. In D and I, statistical significance was evaluated with a Student’s t-test. In E and F, statistical significance (compared to the equivalent parameter in the absence of RNA) was evaluated with a Mann-Whitney test using raw, unfitted values. **p<0.01. ****p<0.0001.
-
Figure 3—source data 1
Numerical values for plots in Figure 3B–F,H–J.
Raw, unfitted values for dynein velocity and run length were used to calculate statistical significance in Figure 3E,F.
- https://doi.org/10.7554/eLife.36312.018
Figure 3—figure supplement 1
Supplementary data on dynein motility in the presence of dynactin and Egl/DmBicD ± hairy RNA.
(A and B) Distribution of segmental velocities (A) and run lengths (B) of dynein. Means ± SEM are shown for the raw, unfitted values; statistical significance (compared to the equivalent parameter in the absence of RNA) was evaluated with a Mann-Whitney test. ****p<0.0001.
-
Figure 3—figure supplement 1—source data 1
Numerical values for plots in Figure 3—figure supplement 1A,B.
Raw, unfitted values for dynein velocity and run length were used to calculate statistical significance in Figure 3—figure supplement 1A,B.
- https://doi.org/10.7554/eLife.36312.017
Figure 4 with 2 supplements
RNA stimulates the assembly of the transport complex.
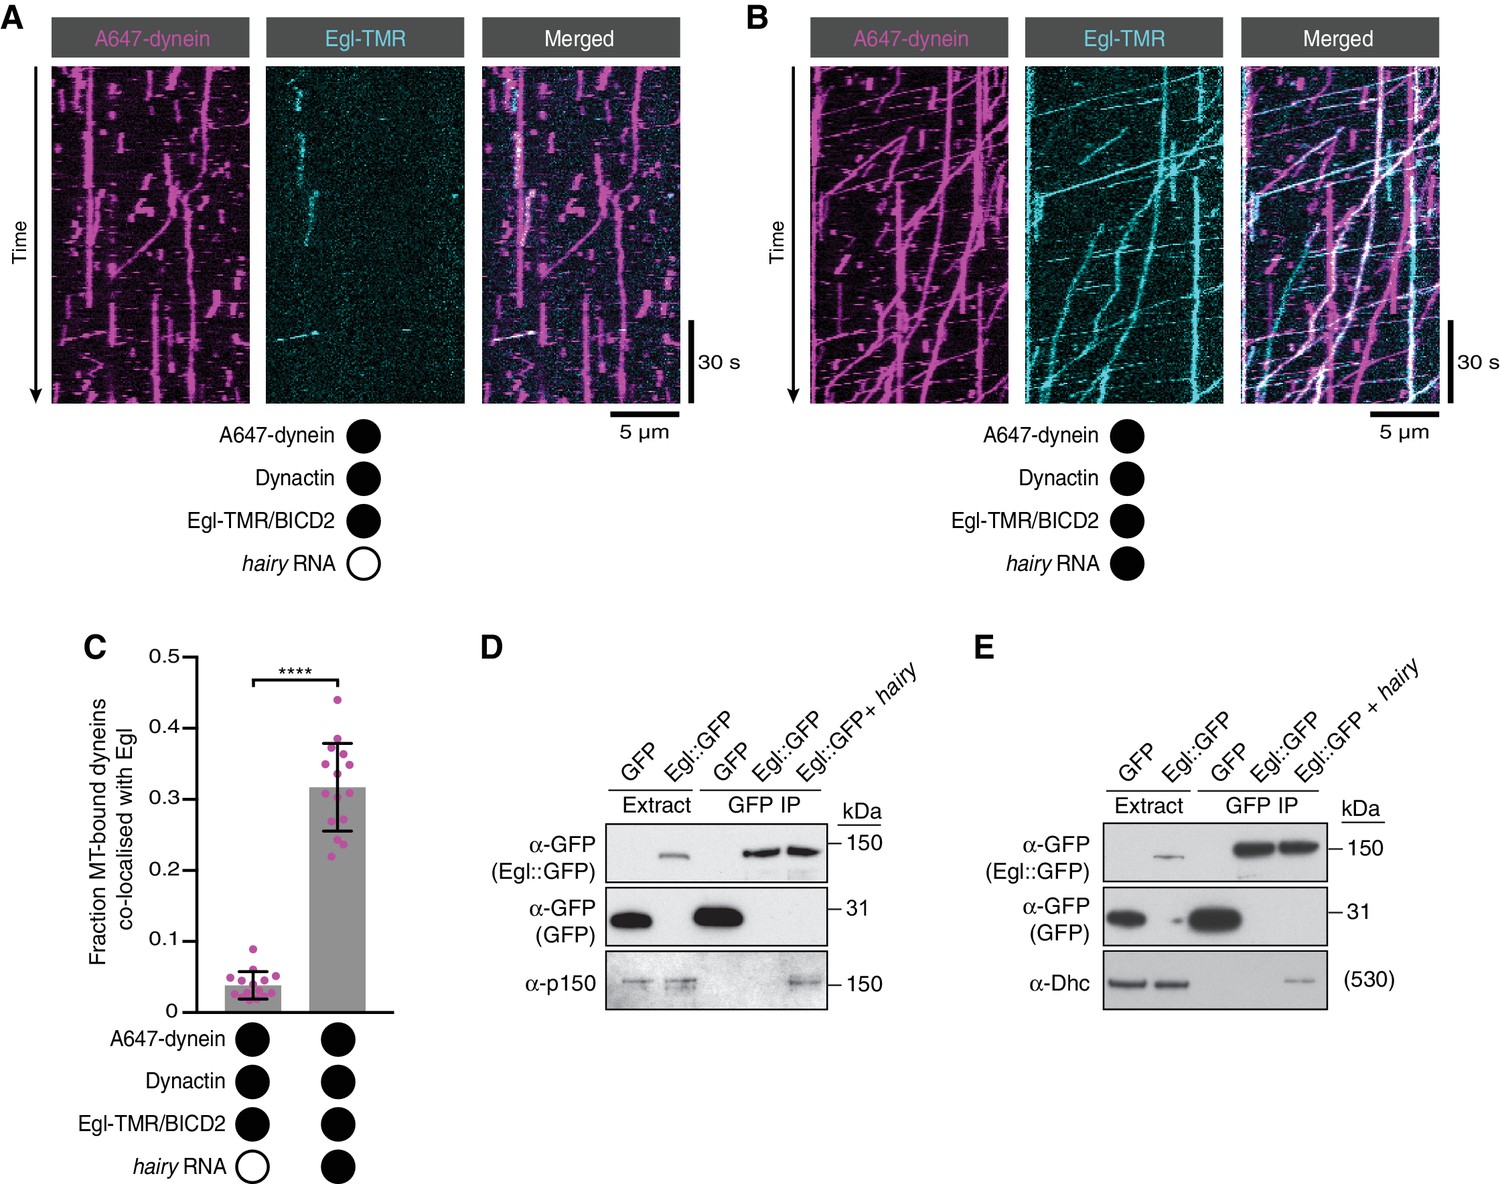
(A and B) Kymographs illustrating the behaviour of fluorescent dynein and Egl (included in the assembly in a complex with unlabelled BICD2) in the presence of dynactin ± hairy RNA. (C) Fraction of microtubule-bound dyneins that associate with Egl in the presence of dynactin ± hairy RNA. Circles are values for individual microtubules. Error bars: SD. Statistical significance was evaluated with a Welch’s t-test. ****p<0.0001. See Figure 4—figure supplement 1 for equivalent data when BICD2 was labelled in the Egl/BICD2 complex. (D and E) Immunoblots of GFP-binding protein pulldowns from Drosophila embryo extracts showing RNA-induced co-precipitation of endogenous p150 (D) and Dhc (E) with Egl::GFP. This effect was observed in four independent experiments. For the blots shown, the amount of extract from which the loaded immunoprecipate was derived was 20 times the amount of extract loaded into the input lane for α-GFP, 200 times the amount of extract loaded into the input lane for α-Dhc and 1000 times the amount of extract loaded into the input lane for α-p150. Thus, only a small fraction of total Egl was associated with p150 and Dhc in the presence of RNA. Embryos expressing free GFP were used as a control. In control experiments, the presence of RNA did not cause co-precipitation of the dynein-dynactin complex with GFP.
-
Figure 4—source data 1
Numerical values for plot in Figure 4C.
- https://doi.org/10.7554/eLife.36312.024
Figure 4—figure supplement 1

RNA promotes the association of BICD2 with dynein in the presence of Egl and dynactin.
(A, B) Kymographs illustrating the behaviour of fluorescently labelled versions of dynein and BICD2 (included in the assembly in a complex with unlabelled Egl) in the presence of dynactin ± hairy RNA. (C) Fraction of microtubule-bound dyneins that associate with BICD2 in the presence of Egl/BICD2, dynactin ± hairy RNA. Circles are values for individual microtubules. Error bars: SD. Statistical significance was evaluated with a Welch’s t-test. ****p<0.0001. See Figure 4A–C for equivalent data when Egl was labelled in the Egl/BICD2 complex.
-
Figure 4—figure supplement 1—source data 1
Numerical values for plot in Figure 4—figure supplement 1C.
- https://doi.org/10.7554/eLife.36312.021
Figure 4—figure supplement 2
RNA-induced association of Egl/BICD2 with dynein promotes transport.
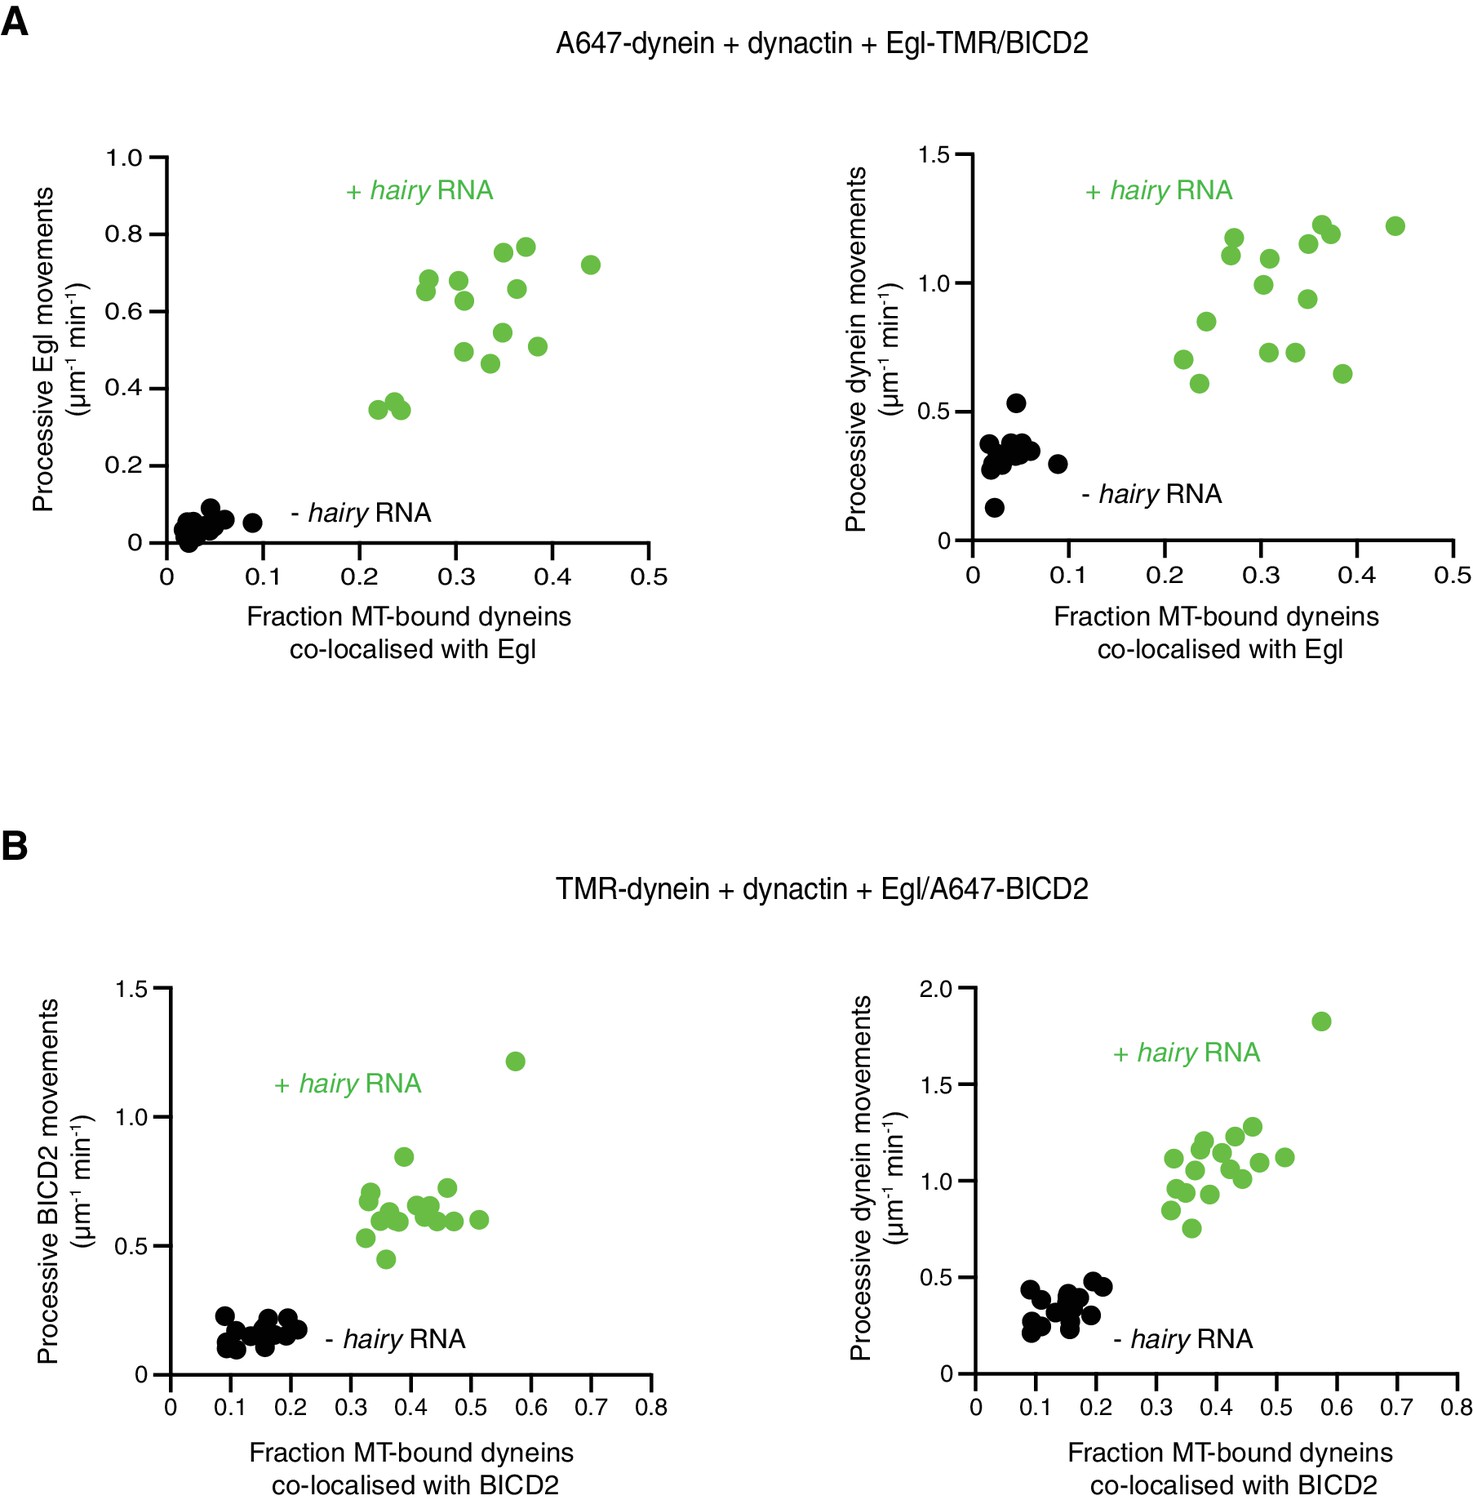
(A, B) Correlation between co-localisation of Egl (A) or BICD2 (B) (each included in the assembly in the context of the Egl/BICD2 complex) with dynein and transport. Circles are values for individual microtubules.
-
Figure 4—figure supplement 2—source data 1
Numerical values for plots in Figure 4—figure supplement 2A,B.
- https://doi.org/10.7554/eLife.36312.023
Figure 5 with 1 supplement
The Egl-LC8 interaction is dispensable for RNA-directed activation of dynein motility.
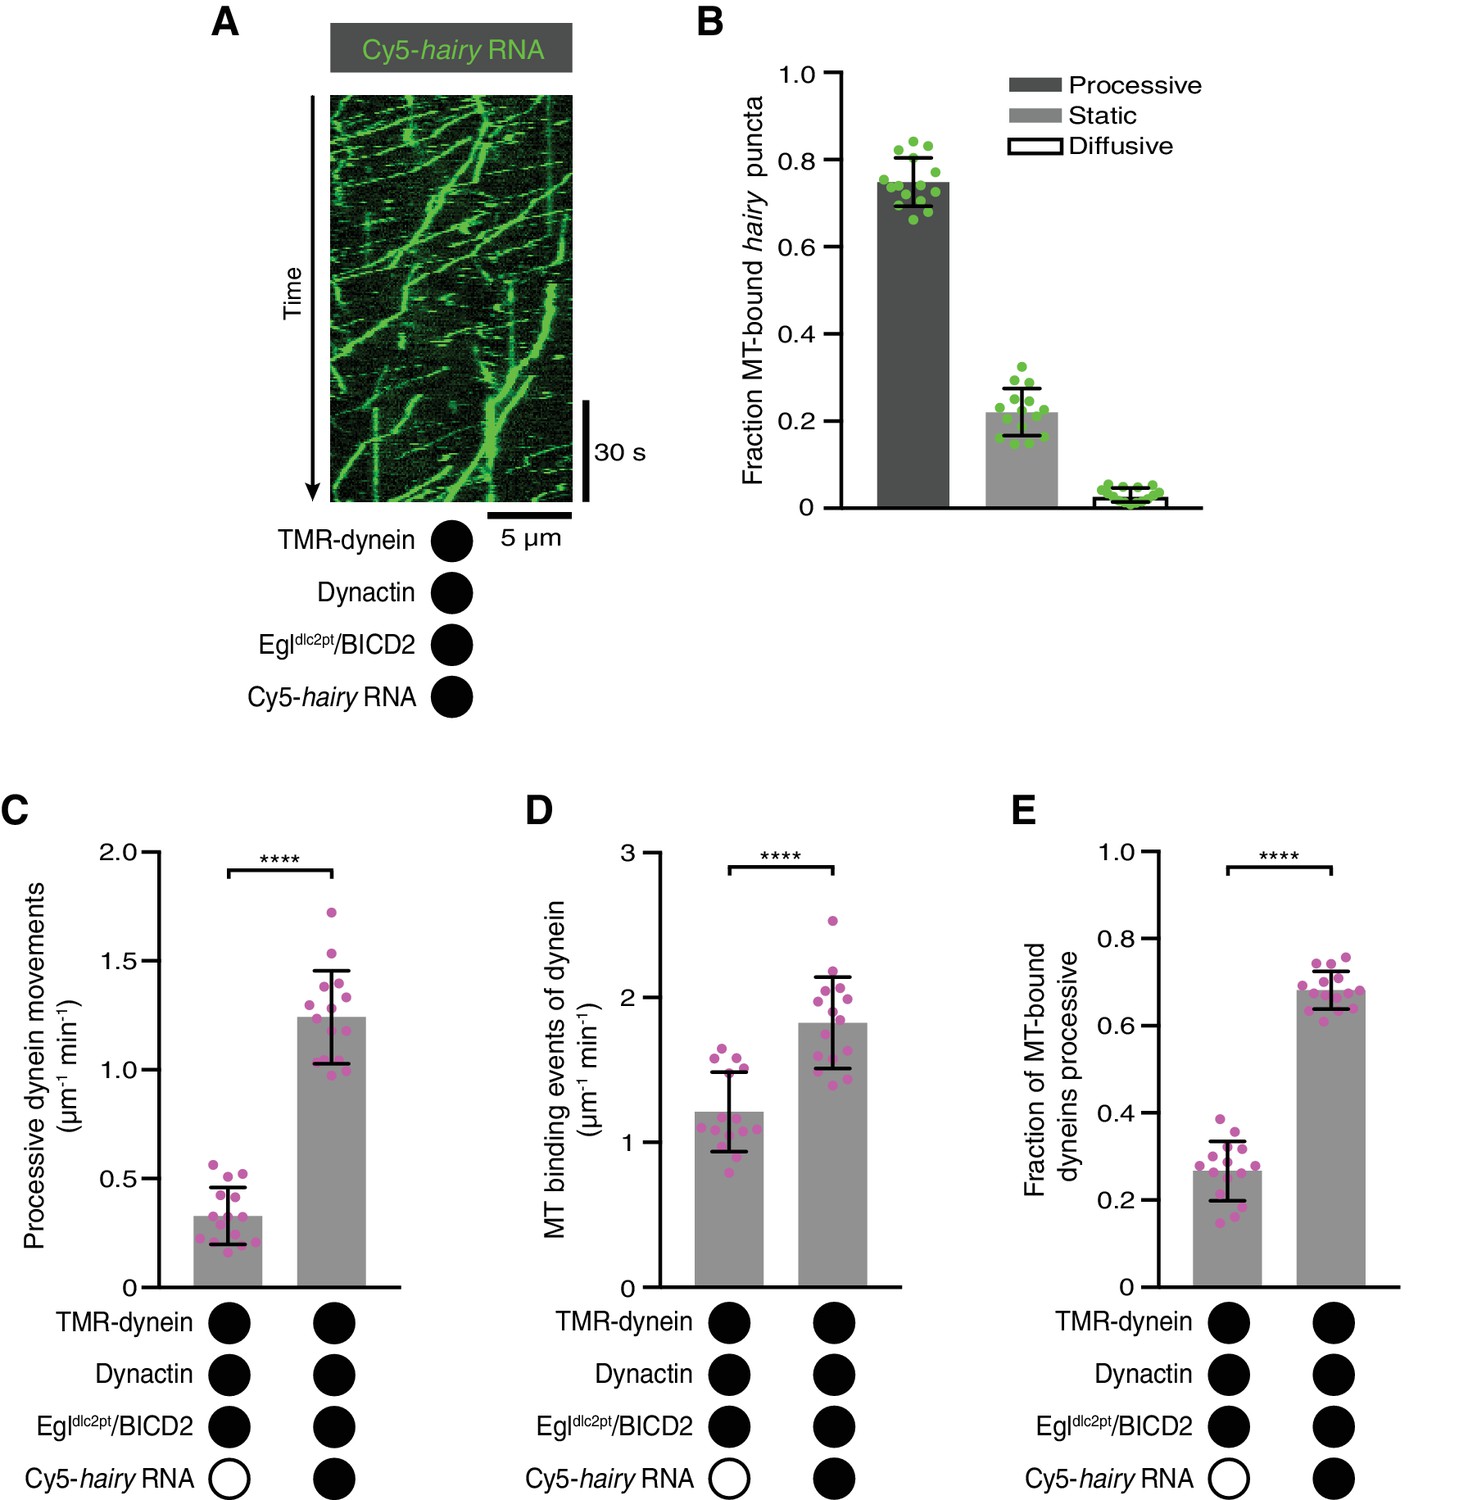
(A) Kymograph illustrating robust transport of hairy RNA in the presence of dynein, dynactin and the Egldlc2pt/BICD2 complex. (B) Fraction of microtubule-associated hairy RNA complexes that are processive, static or diffusive using the Egldlc2pt/BICD2 complex. (C–E) Numbers of processive dynein movements (C), microtubule-binding events of dynein (D) and fraction of microtubule-binding events that result in processive dynein movements (E) in the presence and absence of hairy RNA. In C-E, circles are values for individual microtubules. Error bars: SD. Statistical significance in C-E was evaluated with a Student’s t-test. ****p<0.0001. See Figure 5—figure supplement 1 for velocity and run length distributions for these experiments.
-
Figure 5—source data 1
Numerical values for plots in Figure 5B–E.
- https://doi.org/10.7554/eLife.36312.028
Figure 5—figure supplement 1
Supplementary data on dynein motility in the presence of dynactin, and Egldlc2pt/BICD2 ± hairy RNA.
(A and B) Distribution of segmental velocities (A) and run lengths (B) of dynein. Means ± SEM are shown for the raw, unfitted values; statistical significance (compared to the equivalent parameter in the absence of RNA) was evaluated with a Mann-Whitney test. ****p<0.0001.
-
Figure 5—figure supplement 1—source data 1
Numerical values for plots in Figure 5—figure supplement 1A,B.
Raw, unfitted values for dynein velocity and run length were used to calculate statistical significance in Figure 5—figure supplement 1A,B.
- https://doi.org/10.7554/eLife.36312.027
Figure 6 with 5 supplements
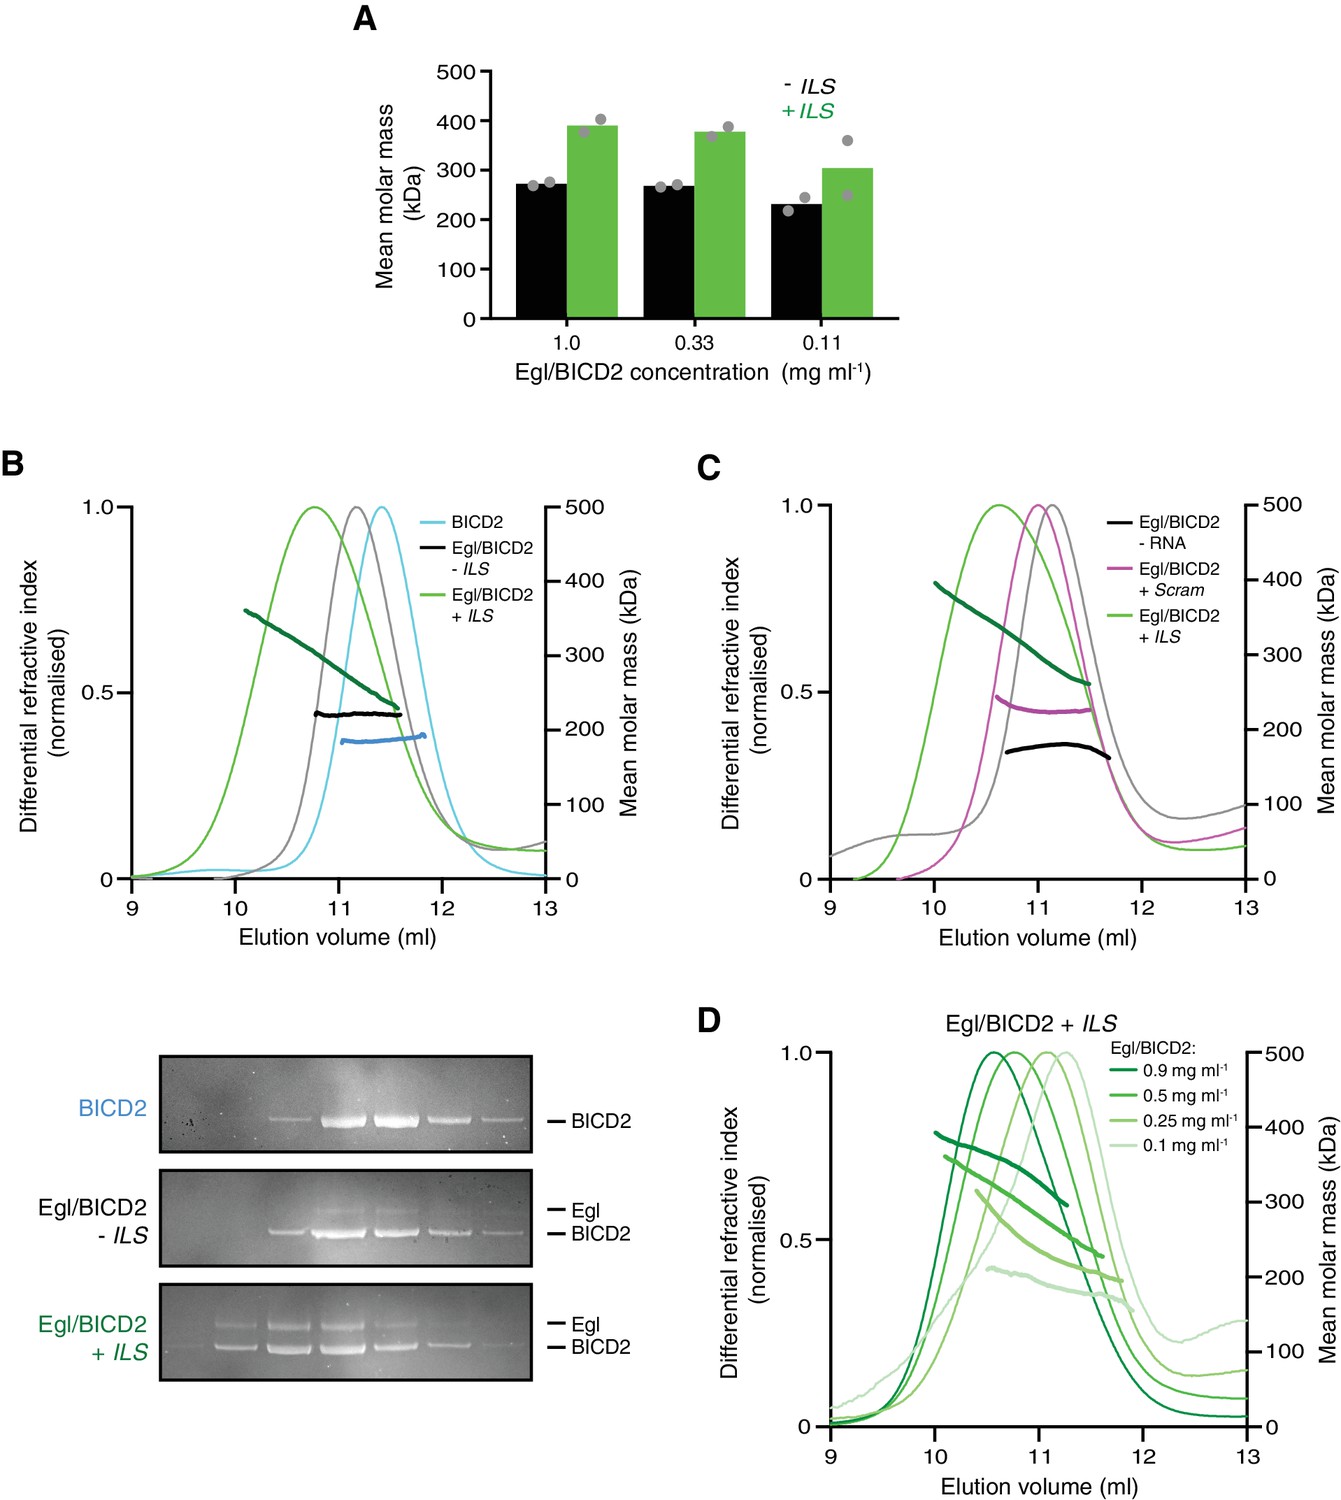
The RNA localisation signal promotes the occupancy of BICD2 with Egl.
(A) Mean molar masses of Egl/BICD2 complexes at different concentrations in the presence and absence of the ILS determined by SE-AUC. For comparison, the concentration of Egl/BICD2 in the assembly mix for in vitro motility assays is 0.04 mg ml−1. In this and other panels of this figure, the RNA was present in a 10-fold molar excess to the protein (based on an operational assumption of a complex of two Egl molecules and a BICD2 dimer). Circles are values for individual samples. See Figure 6—figure supplement 2 for examples of raw data and fitting. Experiments were performed in 150 mM salt at 4°C. (B) SEC-MALS analysis of samples of Egl/BICD2 in the presence and absence of ILS RNA, and BICD2 alone for comparison. The MALS analysis provides the abundance-weighted mean mass of all of the species present throughout the peak (darker lines). Gels of collected fractions stained with SYPRO Ruby reveal more Egl associated with BICD2 in the presence of the ILS (maximum Egl:BICD2 ratio without ILS = 0.07; maximum Egl:BICD2 ratio with ILS = 0.48), which corresponds to species with higher mean molar mass (gels are aligned with corresponding positions in the SEC-MALS trace). Consistent with the relatively modest increase in molar mass compared to BICD2 alone, the SEC-MALS peak for the mixture of Egl/BICD2 without the ILS is dominated by free BICD2, with a relatively small amount of Egl. The absence of a BICD2-like shoulder in the trace of this sample presumably reflects rapid binding and unbinding of Egl. Free monomeric Egl elutes later from the column in a broad peak (Figure 6—figure supplement 3). The broad range of mean masses across the Egl/BICD2 peak in the presence of ILS indicates that our experimental conditions captured an equilibrating mixture of different Egl/BICD2 species. (C) SEC-MALS analysis of Egl/BICD2 in the presence of the ILS, scrambled ILS (Scram), or no RNA. In B and C, the concentration of the Egl/BICD2 input was 0.5 mg ml−1. (D) SEC-MALS analysis of different input concentrations of Egl/BICD2 in the presence of a 10-fold molar excess of the ILS (0.5 mg ml−1 data are reproduced from B). Note that SEC dilutes proteins ~10 fold before they are subjected to MALS analysis. SEC-MALS experiments were performed in 150 mM salt at room temperature. See Figure 6—figure supplement 4 for results with Egl/BICD2 ± ILS using lower ionic strength buffers.
-
Figure 6—source data 1
Numerical values for plots in Figure 6A–D.
- https://doi.org/10.7554/eLife.36312.040
Figure 6—figure supplement 1

The ILS RNA leads to a significant change in the SEC elution profile of the Egl/BICD2 complex.
The purified Egl/BICD2 complex was incubated with or without a 10-fold molar excess of the ILS (assuming two Egl molecules and one BICD2 dimer per complex) and subjected to SEC (G4000SWxl with guard column) in GF150 buffer at 4°C. Vo: void.
-
Figure 6—figure supplement 1—source data 1
Numerical values for plot in Figure 6—figure supplement 1.
- https://doi.org/10.7554/eLife.36312.031
Figure 6—figure supplement 2
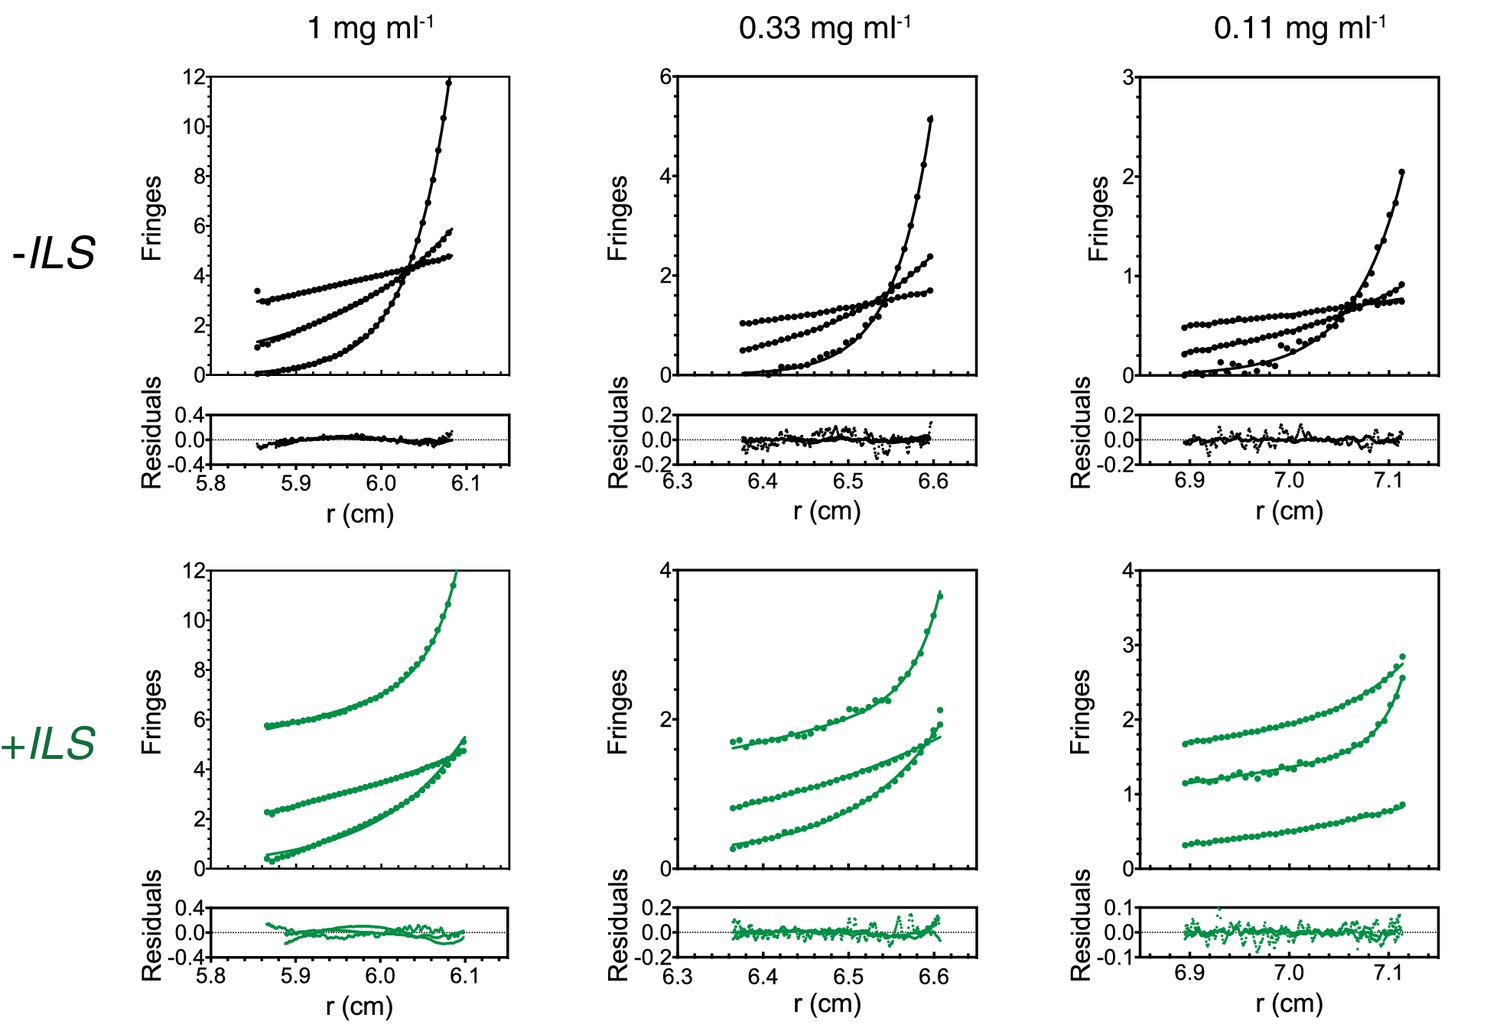
Supplementary data for SE-AUC analysis of Egl/BICD2 samples.
Raw data and goodness of fit are shown for one sample per concentration in the presence and absence of ILS RNA. Curves indicate data from runs at different velocities.
-
Figure 6—figure supplement 2—source data 1
Numerical values for plots in Figure 6—figure supplement 2.
- https://doi.org/10.7554/eLife.36312.033
Figure 6—figure supplement 3
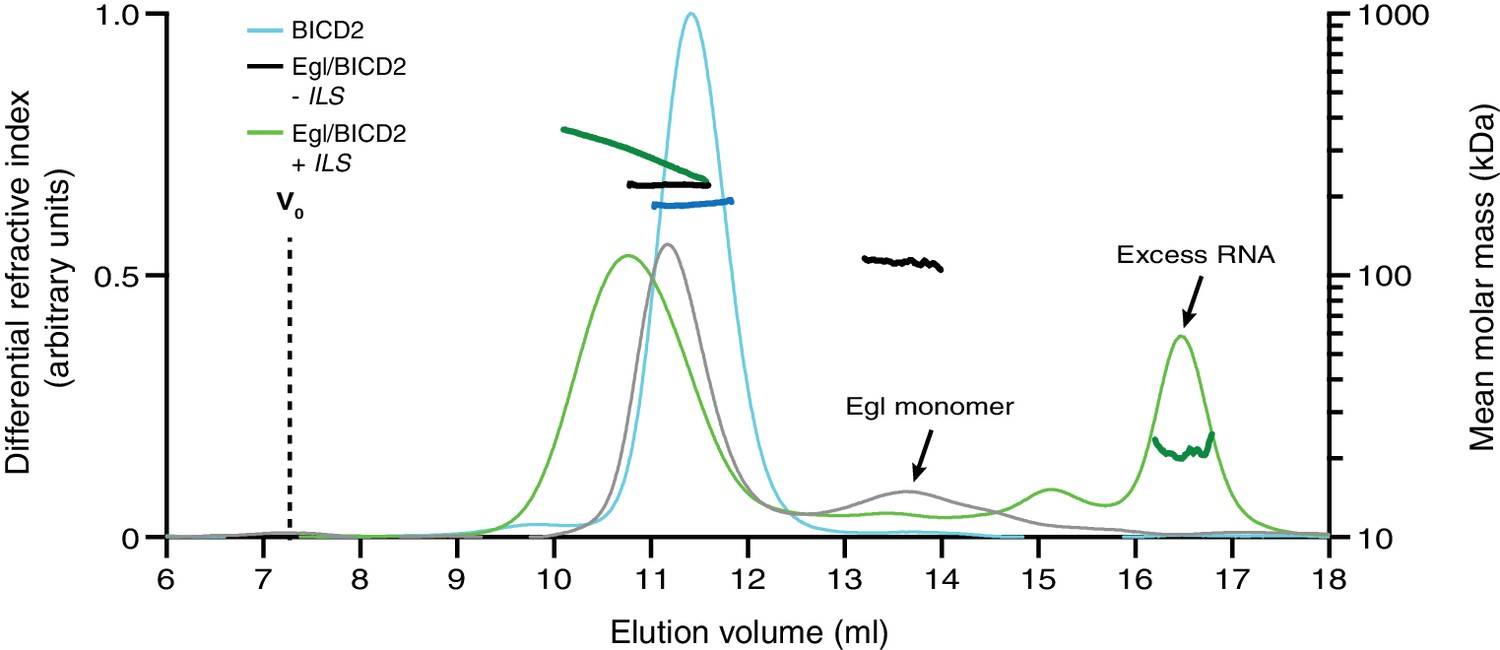
Extended trace from SEC-MALS experiment in Figure 6B illustrating typical elution profiles for Egl/BICD2 samples.
The peak corresponding to free Egl was confirmed by gel-based analysis of other SEC-MALS experiments. The observed molar mass of free Egl indicates a monomeric state (predicted molar mass: 112 kDa; observed molar mass: 112.0 ± 1.7 kDa). There is an apparent reduction in total eluted protein for the Egl/BICD2 minus ILS sample, which is likely due to the retention of a fraction of Egl on the column.
-
Figure 6—figure supplement 3—source data 1
Numerical values for plot in Figure 6—figure supplement 3.
- https://doi.org/10.7554/eLife.36312.035
Figure 6—figure supplement 4
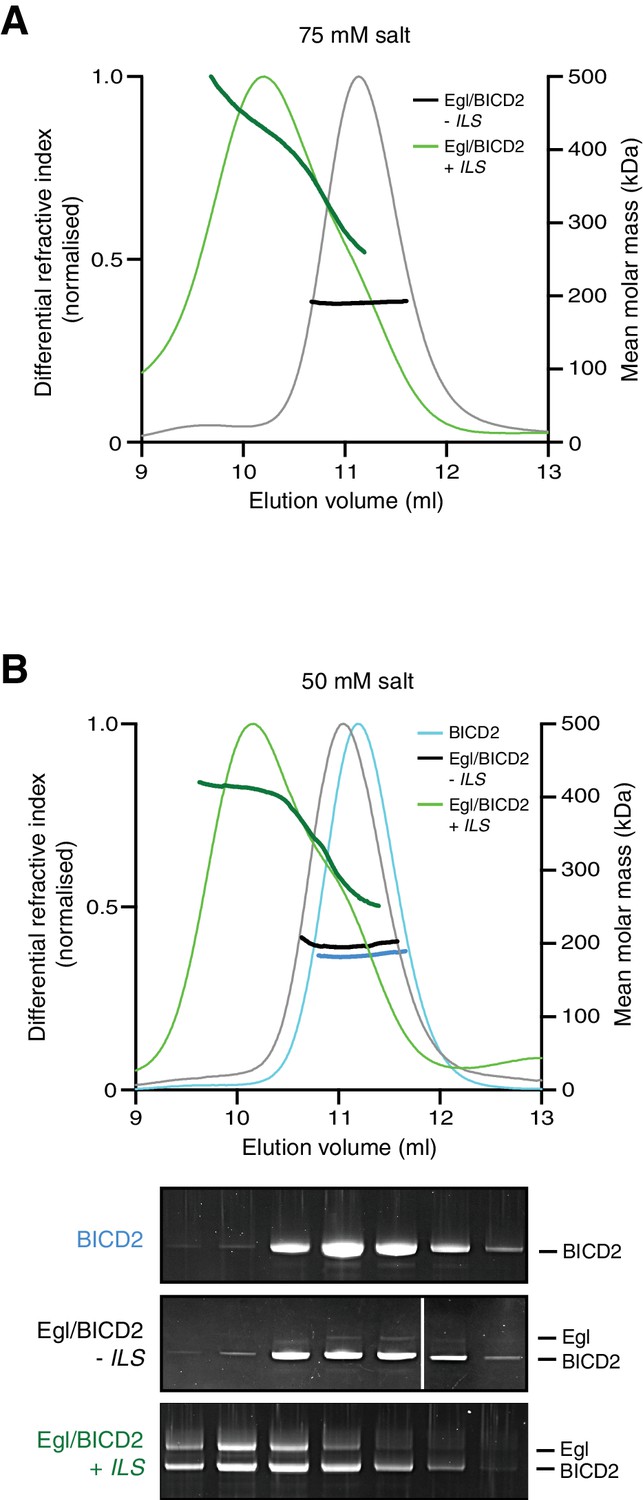
SEC-MALS data for the purified Egl/BICD2 complex in the presence and absence of the ILS using buffer with modified salt concentrations.
(A) Data with 75 mM salt buffer. (B) Data with 50 mM salt buffer. SEC-MALS was performed at room temperature with inputs of 0.5 mg ml−1 Egl/BICD2 (with the RNA present in a 10-fold molar excess). Note that SEC dilutes proteins ~10-fold before they are subjected to MALS analysis. SYPRO Ruby-stained gels of collected fractions from the 50 mM experiment confirm more Egl associated with BICD2 in the presence of the ILS (maximum Egl:BICD2 ratio without ILS = 0.08; maximum Egl:BICD2 ratio with ILS = 1.05), which corresponds to species with higher molar mass (gels are aligned with corresponding positions in the SEC-MALS trace).
-
Figure 6—figure supplement 4—source data 1
Numerical values for plots in Figure 6—figure supplement 4A,B.
- https://doi.org/10.7554/eLife.36312.037
Figure 6—figure supplement 5

SEC-MALS analysis of the purified Egl/DmBicD complex in the presence and absence of ILS RNA.
SEC-MALS was performed in 50 mM salt and at 4°C using an input of 0.5 mg ml−1 protein (note that SEC dilutes proteins ~10-fold before they are subjected to MALS analysis). Gels of collected fractions stained with Coomassie Blue reveal more Egl associated with DmBicD in the presence of the ILS, which corresponds to species with higher molar mass (gels are aligned with corresponding positions in the SEC-MALS trace).
-
Figure 6—figure supplement 5—source data 1
Numerical values for plot in Figure 6—figure supplement 5.
- https://doi.org/10.7554/eLife.36312.039
Figure 7 with 3 supplements
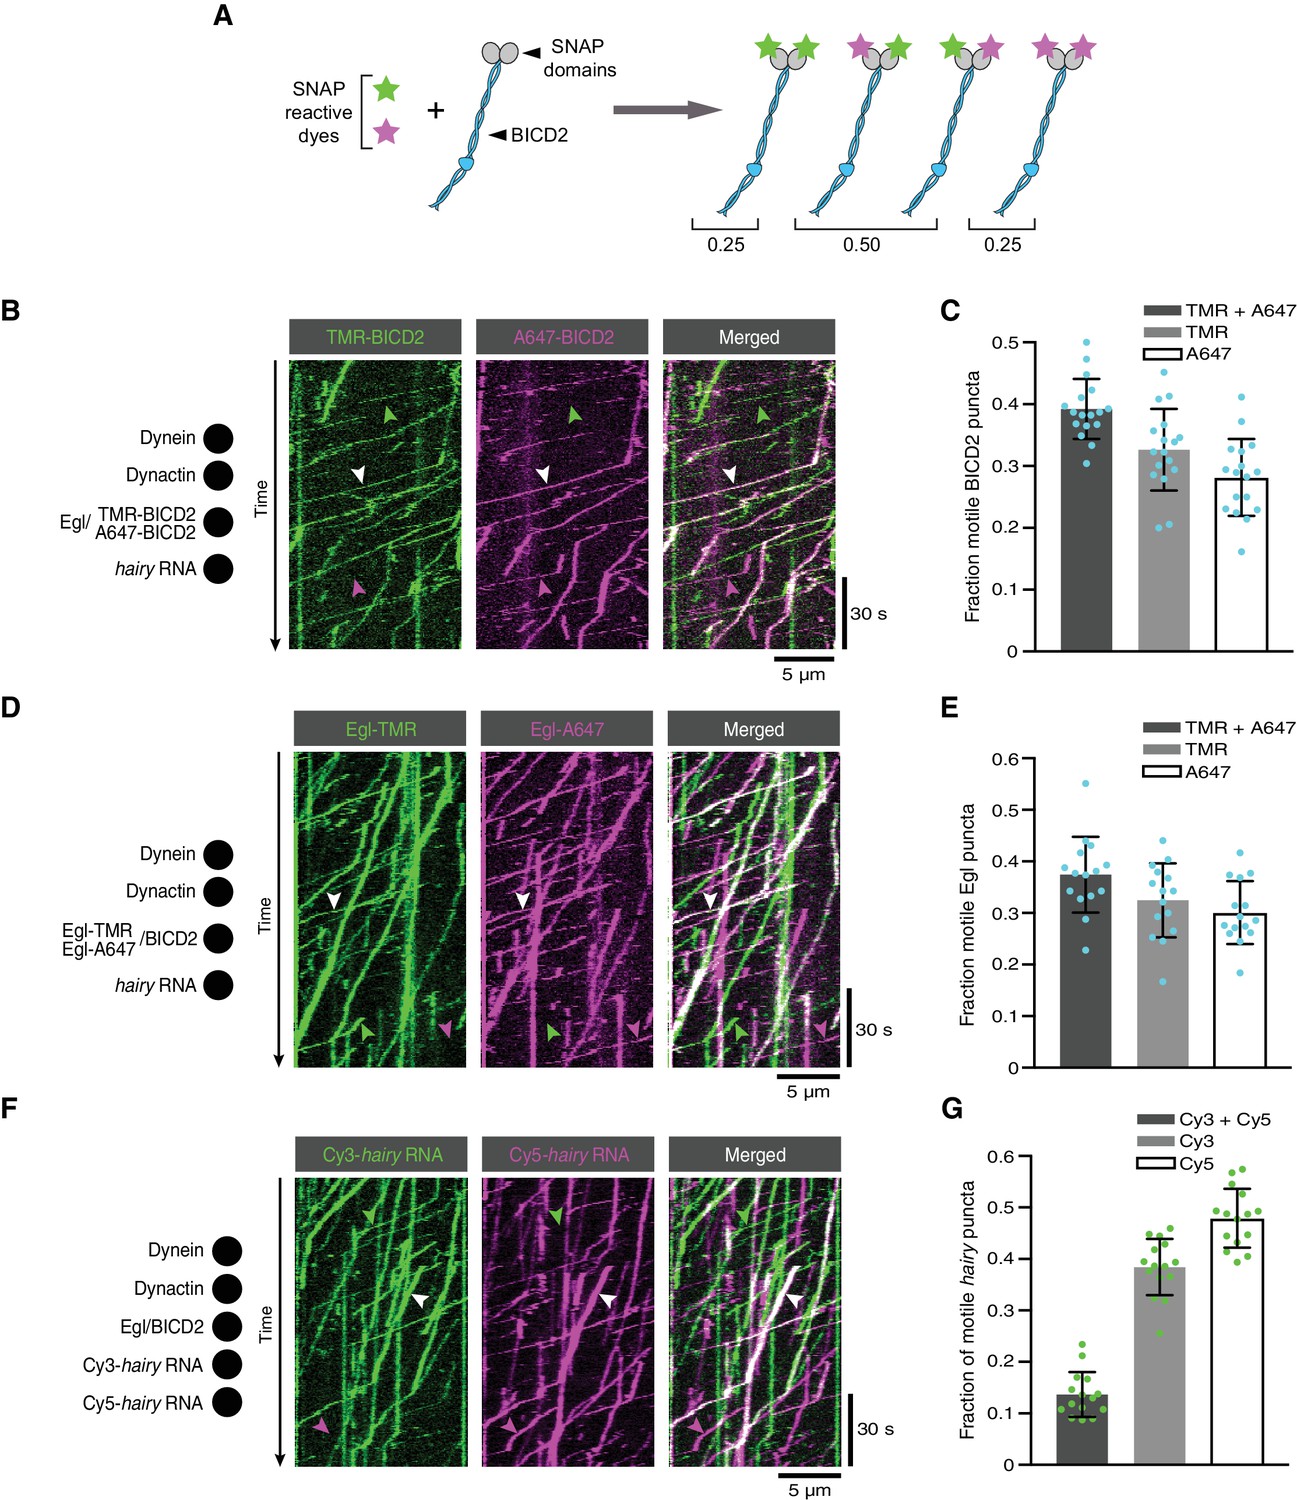
The copy number of BICD2, Egl and RNA in active transport complexes.
(A) Idealised outcome of incubating a SNAP-tagged protein that is present in two copies per complex with equimolar amounts of two different SNAP-reactive dyes. The BICD2 dimer is used as an example, although the same principle applies for experiments with labelled Egl. (B) Kymograph of fluorescent signals when a complex of Egl and SNAP::BICD2 is labelled with a mixture of TMR and Alexa647 and assayed in the presence of RNA, dynactin and dynein. (C) Fraction of motile BICD2-containing complexes with signals from both fluorophores, only TMR, or only Alexa647. (D) Kymograph of fluorescent signals when a complex of Egl::SNAP and BICD2 is labelled with a mixture of TMR and Alexa647 and assayed in the presence of RNA, dynactin and dynein. (E) Fraction of motile Egl-containing complexes labelled with signals from both fluorophores, only TMR, or only Alexa647. (F) Kymograph of fluorescent signals when Cy3-hairy and Cy5-hairy are mixed and assayed in the presence of Egl/BICD2, dynactin and dynein. (G) Fraction of motile hairy RNA puncta labelled with both fluorophores, only Cy3, or only Cy5. In B, D and F, white arrowheads indicate complexes containing both dyes; green and magenta arrowheads indicate, respectively, complexes containing only TMR or only Alexa647 (B and D) or only Cy3 or Cy5 (F). In C, E and G, circles are values for individual microtubules; error bars: SD. See Supplementary files 1–3 for calculations of copy numbers based on corrections for the proportion of protein or RNA molecules that are unlabelled.
-
Figure 7—source data 1
Numerical values for plots in Figure 7C,E,G.
- https://doi.org/10.7554/eLife.36312.048
Figure 7—figure supplement 1
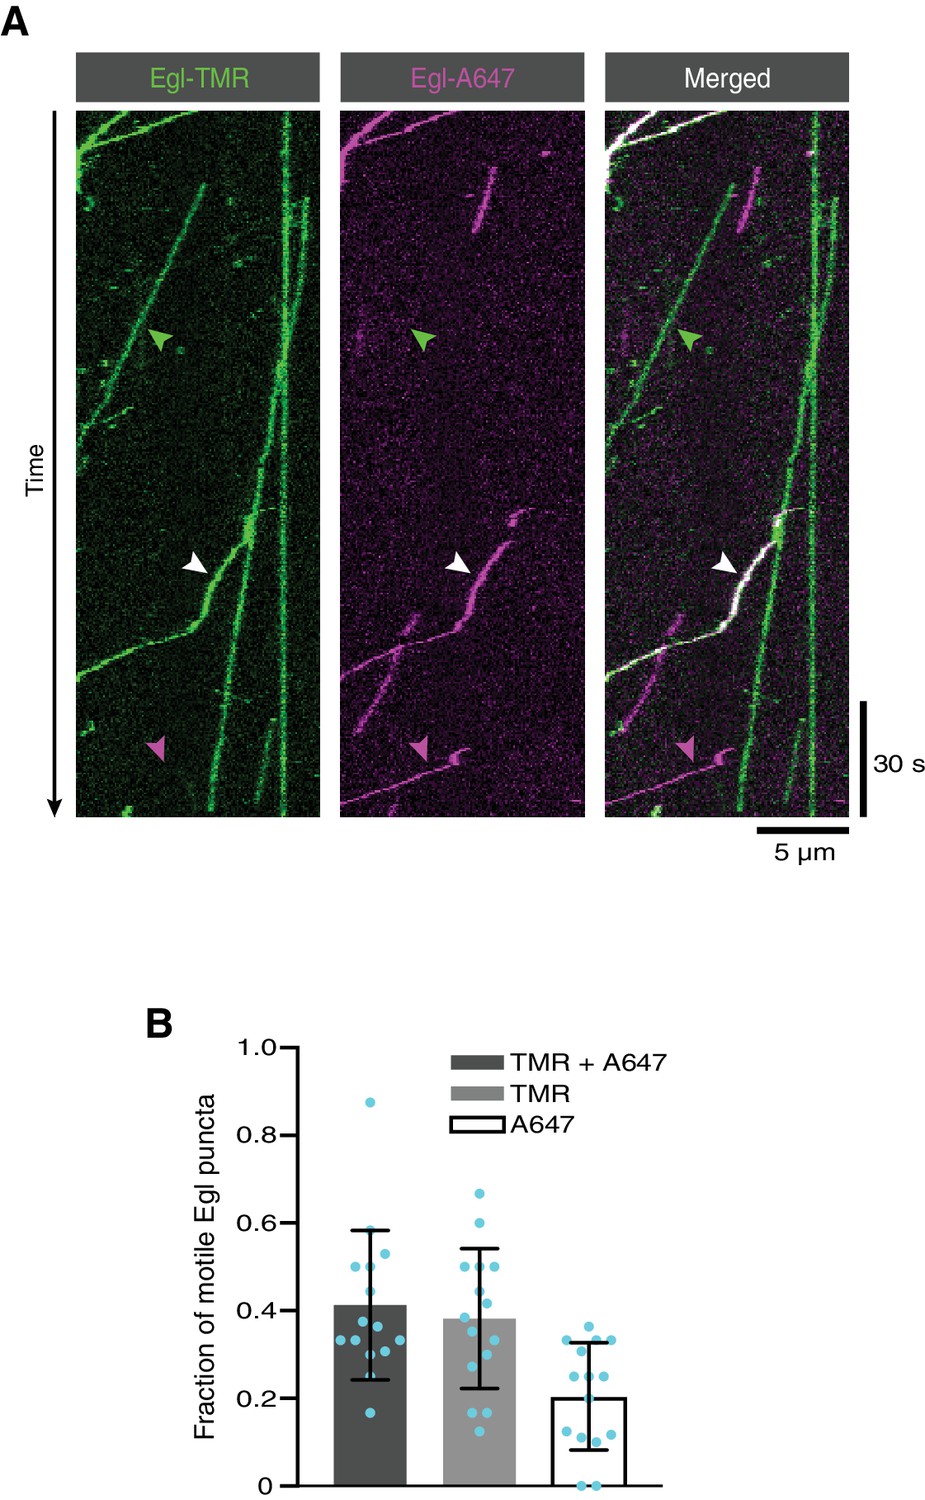
The presence of two Egl proteins in active transport complexes assembled in the absence of RNA.
(A) Kymograph of fluorescent signals when a complex of Egl::SNAP and BICD2 is labelled with a mixture of TMR and Alexa647 and assayed in the presence of dynactin and dynein and the absence of RNA. White, green and magenta arrowheads show, respectively, examples of motile Egl-containing complexes with signals from both fluorophores, only TMR, or only Alexa647. (B) Fraction of motile Egl-containing complexes labelled with signals from both fluorophores, only TMR, or only Alexa647. Circles are values for individual microtubules. Variance is high because of the small number of motile complexes per microtubule.
-
Figure 7—figure supplement 1—source data 1
Numerical values for plot in Figure 7—figure supplement 1B.
- https://doi.org/10.7554/eLife.36312.043
Figure 7—figure supplement 2
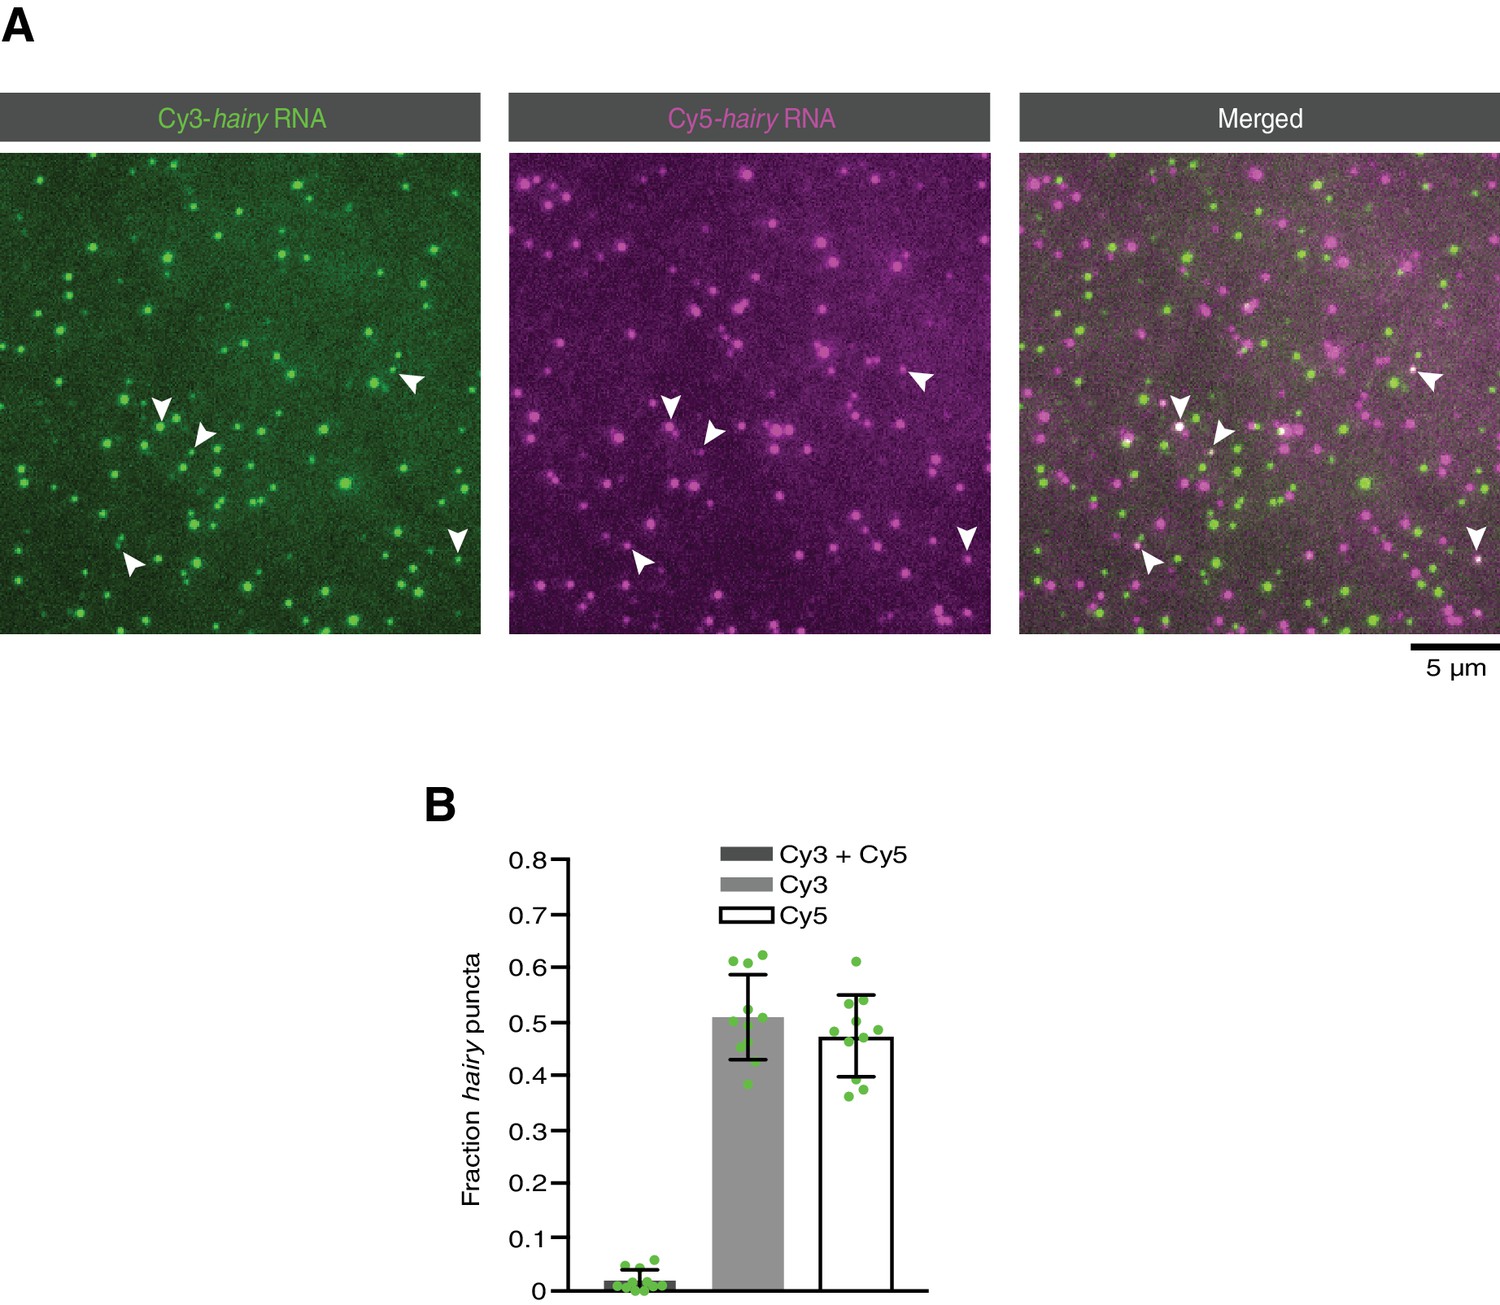
Analysis of RNA-RNA association in the absence of proteins.
(A) Representative TIRF image of a mixture of Cy3-hairy RNA and Cy5-hairy RNA adsorbed on a glass surface in the absence of proteins. (B) Quantification of co-localisation of Cy3 and Cy5 signals. Circles are values for individual fields of view. For each field of view, data were corrected for the frequency of chance overlap of fluorescent signals with this density of molecules. This frequency (which varied between 0.00 and 0.033 for different fields of view) was determined by scoring co-localisation in an image of a 90° rotation of the Cy5 image overlaid on the original orientation of the Cy3 image.
-
Figure 7—figure supplement 2—source data 1
Numerical values for plot in Figure 7—figure supplement 2B.
- https://doi.org/10.7554/eLife.36312.045
Figure 7—figure supplement 3
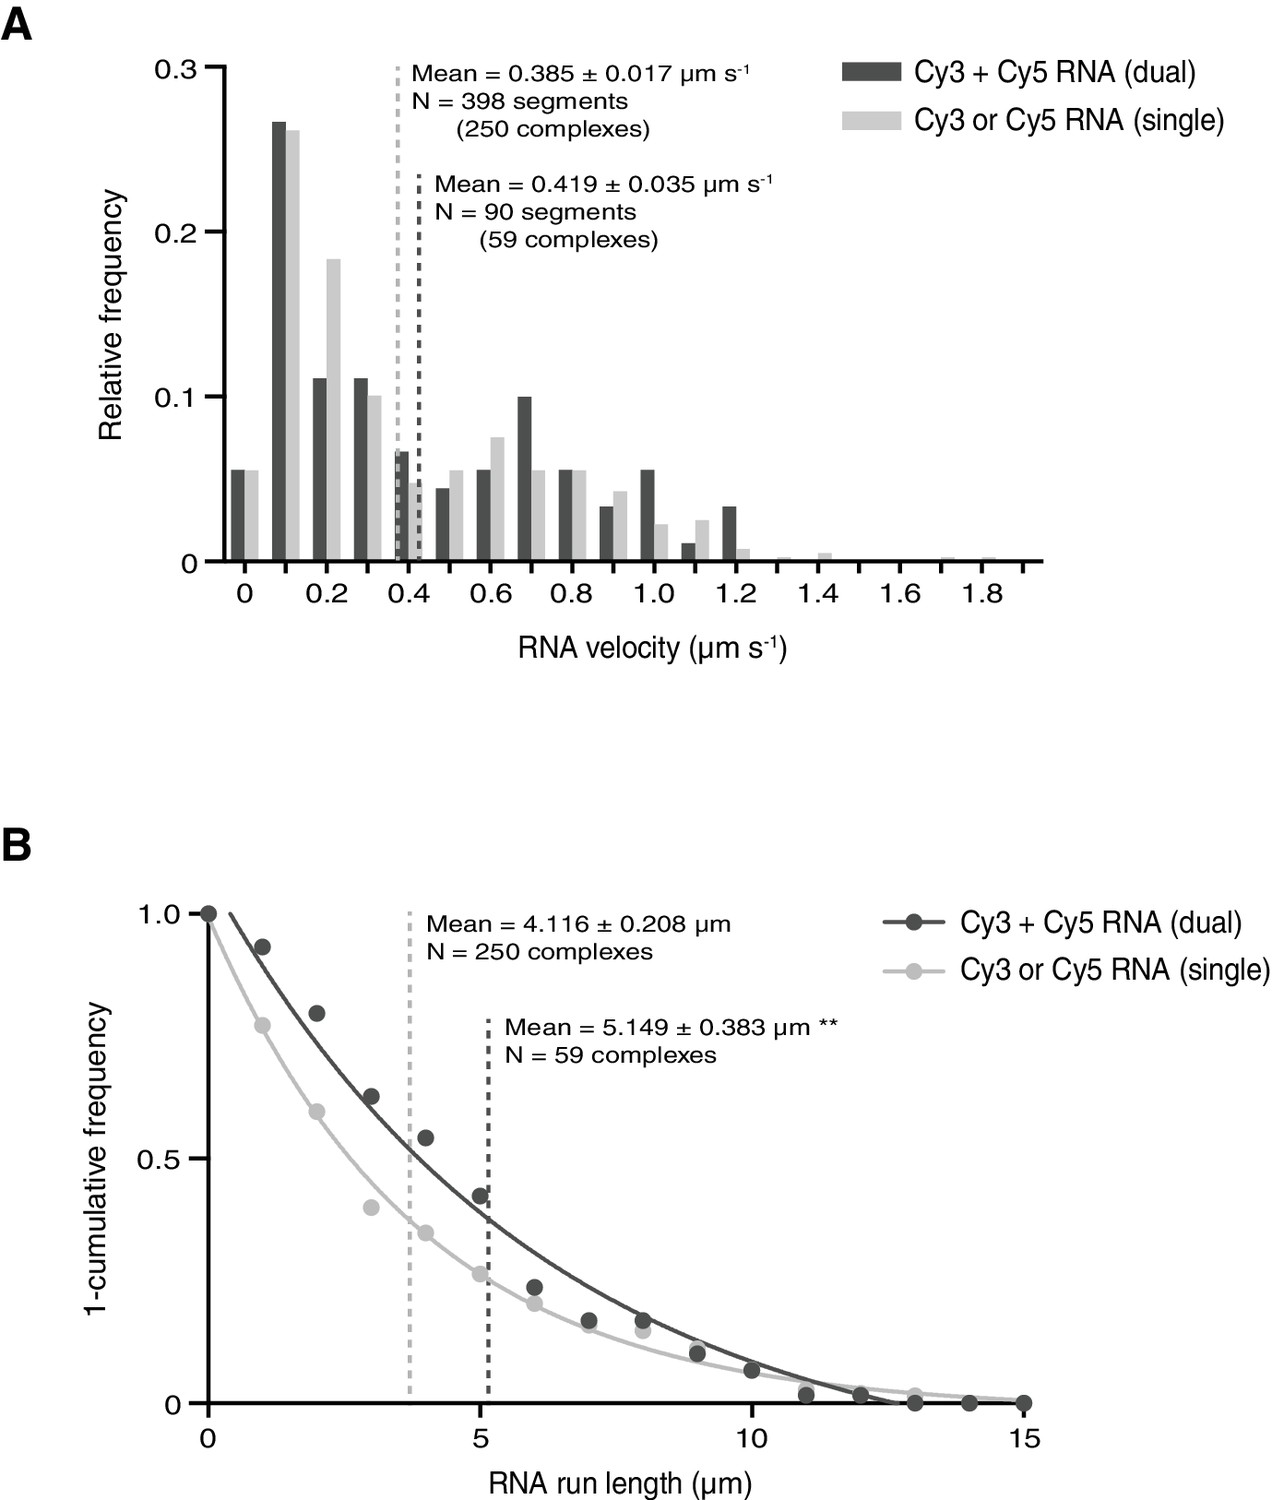
Assessing the influence of RNA copy number on the motile properties of RNPs.
(A and B) Distribution of segmental velocities (A) and run lengths (B) of motile complexes containing both Cy3-hairy and Cy5-hairy (dual) or only one type of labelled RNA (single). Means ± SEM are shown for the raw, unfitted values; statistical significance was evaluated with a Mann-Whitney test. **p<0.01.
-
Figure 7—figure supplement 3—source data 1
Numerical values for plots in Figure 7—figure supplement 3A,B.
Raw, unfitted values for RNA velocity and run length were used to calculate statistical significance in Figure 7—figure supplement 3A,B.
- https://doi.org/10.7554/eLife.36312.047
Figure 8
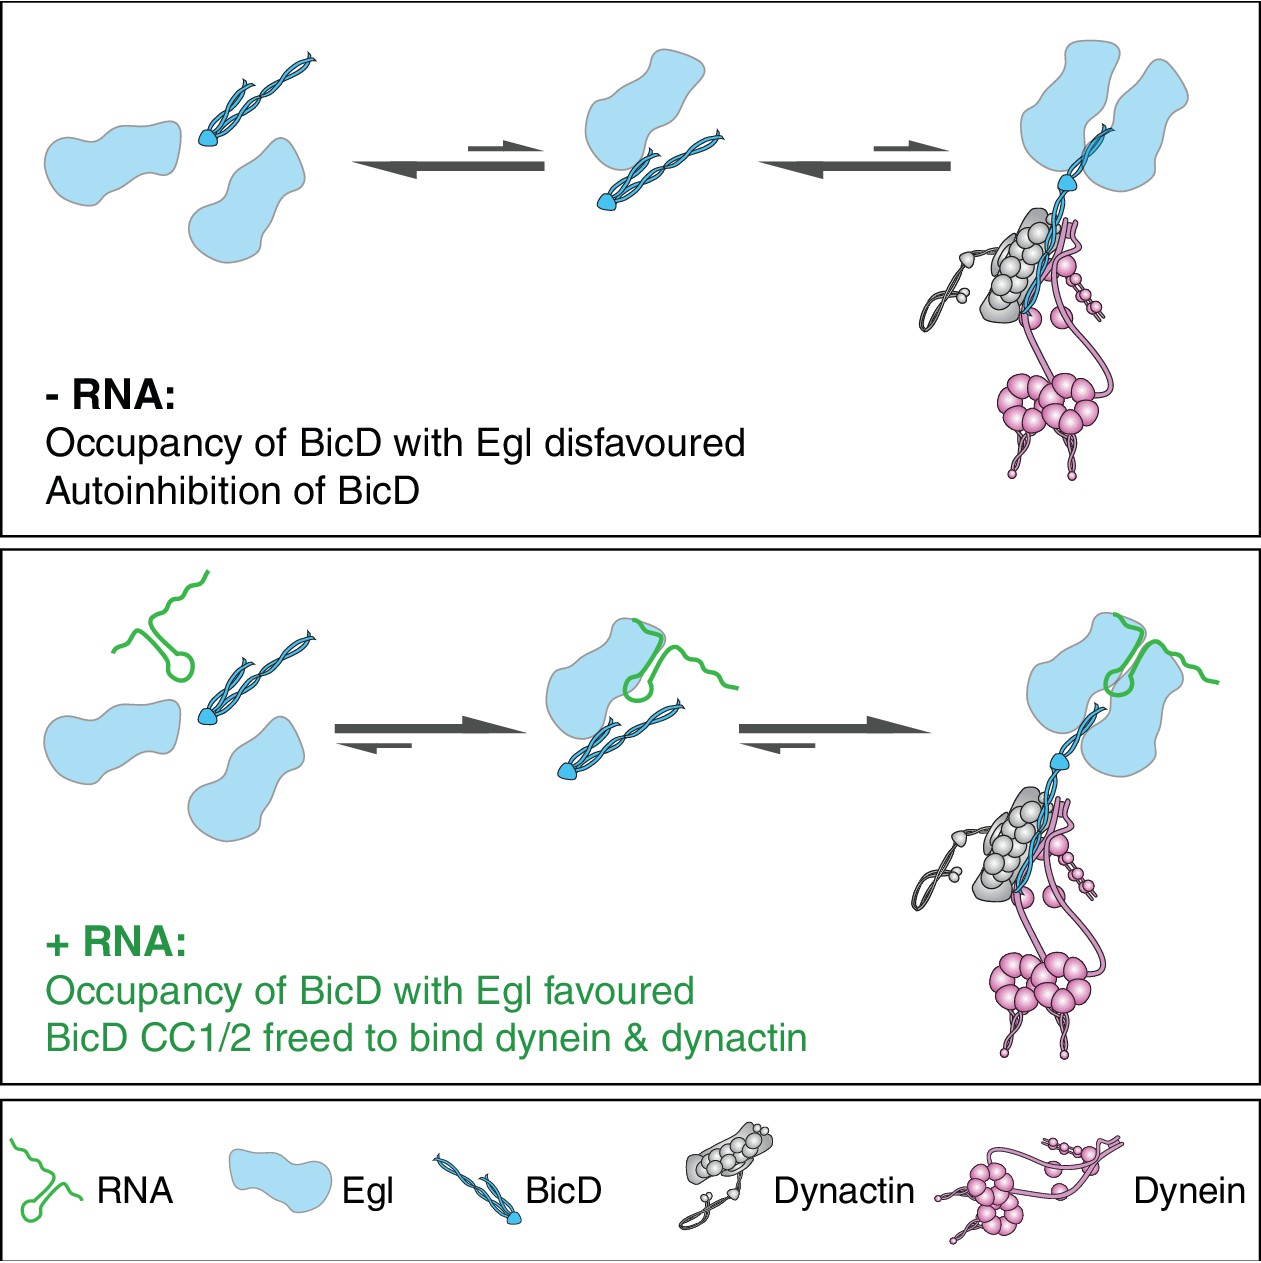
Model for the mechanism of RNA-stimulated assembly of an active dynein-dynactin complex.
The RNA favours the interaction of Egl with CC3 of BicD, which promotes release of CC1/2 of BicD to interact with dynein and dynactin. A single RNA molecule is shown in the transport complex as our data indicate that this scenario is common.
Videos
Video 1
Movements of Cy5-hairy RNAs on surface-immobilised microtubules in the presence of Egl/BICD2, dynactin and dynein.
The RNA signal is shown in green. The position of the microtubules is indicated by a projection of the RNA signal over the course of the movie (magenta). Width of frame is 53.76 μm; movie corresponds to 252 s of real time.
Tables
Key resources table
| Reagent type (species) or resource | Designation | Source or reference | Identifiers | Additional information |
|---|---|---|---|---|
| Recombinant DNA reagent (Drosophila melanogaster) | Egalitarian (Egl) cDNA | Epoch Life Sciences | Corresponding to NCBI:NM_166623 | Codon optimised for Sf9 cell expression |
| Recombinant DNA reagent (D. melanogaster) | Bicaudal-D (BicD) cDNA | Epoch Life Sciences | Corresponding to NCBI:NM_165220 | Codon optimised for Sf9 cell expression |
| Recombinant DNA reagent (Mus musculus) | Bicaudal-D2 (BICD2) cDNA | Epoch Life Sciences | Corresponding to NCBI:NM_001039179 | Codon optimised for Sf9 cell expression |
| Recombinant DNA reagent (Homo sapiens) | Dynein heavy chain (DHC) cDNA | Epoch Life Sciences; PMID:24986880 | Corresponding to NCBI:NM_001376.4 | Codon optimised for Sf9 cell expression |
| Recombinant DNA reagent (H. sapiens) | Dynein intermediate chain 2 (DIC2) cDNA | Epoch Life Sciences; PMID:24986880 | Corresponding to NCBI:AF134477 | Codon optimised for Sf9 cell expression |
| Recombinant DNA reagent (H. sapiens) | Dynein light intermediate chain 2 (DLIC2) cDNA | Epoch Life Sciences; PMID:24986880 | Corresponding to NCBI:NM_006141.2 | Codon optimised for Sf9 cell expression |
| Recombinant DNA reagent (H. sapiens) | Dynein light chain Tctex (Tctex) cDNA | Epoch Life Sciences; PMID:24986880 | Corresponding to NCBI:NM_006519.2 | Codon optimised for Sf9 cell expression |
| Recombinant DNA reagent (H. sapiens) | Dynein light chain LC8 (LC8) cDNA | Epoch Life Sciences; PMID:24986880 | Corresponding to NCBI:NM_003746.2 | Codon optimised for Sf9 cell expression |
| Recombinant DNA reagent (H. sapiens) | Dynein light chain Roadblock (Robl) cDNA | Epoch Life Sciences; PMID:24986880 | Corresponding to NCBI:NM_141183.3 | Codon optimised for Sf9 cell expression |
| Recombinant DNA reagent | pAceBac1 plasmid | PMID:27165327 | ||
| Recombinant DNA reagent | pIDC plasmid | PMID:27165327 | ||
| Recombinant DNA reagent (D. melanogaster) | hairy 3’UTR plasmid | PMID:12743042 | ||
| Recombinant DNA reagent (D. melanogaster) | I-factor plasmid | PMID:15992540 | ||
| Sequence-based reagent | ILS RNA 5’.AAUGCACACCUCCCUCGUCACU CUUGAUUUUUCAAGAGCCUUCG AUCGAGUAGGUGUGCA.3’ | GE Dharmacon | With or without 5’ Dy647 label | |
| Sequence-based reagent | ILS scram RNA 5’.AAAAUGUGGUGCACUAUCUU CGUAUUCCAGUGCCACCGUGG UCUAAUUCACUCGUCGCC.3’ | GE Dharmacon | With or without 5’ Dy547 label | |
| Cell line (Spodoptera frugiperda) | Sf9 | ThermoFisher Scientific | ThermoFisher Scientific: 11496015 | Mycoplasma-free |
| Genetic reagent (D. melanogaster) | P[tub-Egl::GFP] | PMID:19515976 | FLYB:FBal0230300 | |
| Genetic reagent (D. melanogaster) | Sco/CyO P[actin5C-GFP] | Bloomington Drosophila Stock Center | FLYB: FBst0004533; RRID:BDSC_4533 | |
| Antibody | anti-GFP (mouse monoclonal) | Sigma Aldrich | Sigma-Aldrich:11814460001; RRID:AB_390913 | Mix of clones 7.1 and 13.1 (1:1000) |
| Antibody | anti-D. melanogaster Dhc (mouse monoclonal) | Developmental Studies Hybridoma Bank; PMID:10637305 | DSHB:2C11-2; RRID:AB_2091523 | (1:1000) |
| Antibody | anti-D. melanogaster p150-C- term (rabbit polyclonal) | PMID:17325206 | Raised against aa 1,073–1,280 (1:10,000) | |
| Commercial assay, kit | GFP-trap magnetic agarose beads | Chromotek | Chromotek:gtma-20 | |
| Commercial assay, kit | Coomassie protein assay kit | ThermoFisher Scientific | ThermoFisher Scientific: 23200 | |
| Commercial assay, kit | Full-Range Rainbow prestained molecular weight markers | GE Healthcare | GE Healthcare:RPN800E | |
| Commercial assay, kit | Coomassie Instant Blue protein stain | Expedeon | Expedeon:ISB1L | |
| Commercial assay, kit | MEGAScript T7 transcription kit | ThermoFisher Scientific | ThermoFisher Scientific: AM1333 | |
| Commercial assay, kit | MEGAScript SP6 transcription kit | ThermoFisher Scientific | ThermoFisher Scientific: AM1330 | |
| Chemical compound, drug | Alexa488-UTP | ThermoFisher Scientific | ThermoFisherScientific: C11403 | |
| Chemical compound, drug | Cy3-UTP | PerkinElmer | PerkinElmer:NEL582001EA | |
| Chemical compound, drug | Cy5-UTP | PerkinElmer | PerkinElmer: NEL583001EA | |
| Chemical compound, drug | SNAP-Cell TMR-Star | New England Biolabs | NEB:S9105S | |
| Chemical compound, drug | SNAP-Surface Alexa Fluor 647 | New England Biolabs | NEB:S9136S | |
| Chemical compound, drug | PEG | Rapp Polymere | Rapp Polymere:103000–20 | |
| Chemical compound, drug | Biotin-PEG | Rapp Polymere | Rapp Polymere: 133000-25-20 | |
| Chemical compound, drug | PLL-g-PEG | Susos AG | Susos AG:PLL(20)-g[3.5]- PEG(2) | |
| Chemical compound, drug | Pluronic-F127 | Sigma-Aldrich | Sigma-Aldrich:P2243 | |
| Chemical compound, drug | Paclitaxel (taxol) | Sigma-Aldrich | Sigma-Aldrich:T1912 | |
| Chemical compound, drug | GMPCPP | Jena Bioscience | Jena Bioscience:NU-405 | |
| Other, native protein | Glucose oxidase | Sigma-Aldrich | Sigma-Aldrich:G2133 | |
| Other, native protein | Catalase | Sigma-Aldrich | Sigma-Aldrich:C40 | |
| Other, native protein | Streptavidin | Sigma-Aldrich | Sigma-Aldrich:S4762 | |
| Other, native protein | α-casein | Sigma-Aldrich | Sigma-Aldrich:C6780 | |
| Other, native protein | Porcine tubulin, unlabelled | Cytoskeleton Inc. | Cytoskeleton Inc:T240 | |
| Other, native protein | Porcine tubulin, biotin-conjugated | Cytoskeleton Inc. | Cytoskeleton Inc:T333P | |
| Other, native protein | Porcine tubulin, HiLyte 488-conjugated | Cytoskeleton Inc. | Cytoskeleton Inc:TL488M | |
| Software, algorithm | FIJI | PMID:22743772 | RRID:SCR_002285 | |
| Software, algorithm | Prism | Graphpad | RRID:SCR_002798 | |
| Software, algorithm | Sednterp | T. Laue (University of New Hampshire) | RRID:SCR_016253 | |
| Software, algorithm | SEDPHAT 13b | PMID:12895474 | RRID:SCR_016254 | |
| Software, algorithm | GUSSI | PMID:26412649 | RRID:SCR_014962 | |
| Software, algorithm | ASTRA | Wyatt | RRID:SCR_016255 |
Additional files
-
Supplementary file 1
Expected labelling combinations of SNAP::BICD2 or Egl::SNAP if there are two copies of the SNAP-tagged polypeptide per complex.
- https://doi.org/10.7554/eLife.36312.050
-
Supplementary file 2
Observed outcome of dual labelling experiments with SNAP::BICD2 or Egl::SNAP vs expectation for two SNAP-tagged polypeptides per complex.
- https://doi.org/10.7554/eLife.36312.051
-
Supplementary file 3
Correction of Cy3-hairy + Cy5 hairy RNA mixing results (Figure 7G) for the proportion of RNA molecules containing no dye.
- https://doi.org/10.7554/eLife.36312.052
-
Transparent reporting form
- https://doi.org/10.7554/eLife.36312.053
Download links
A two-part list of links to download the article, or parts of the article, in various formats.
Downloads (link to download the article as PDF)
Open citations (links to open the citations from this article in various online reference manager services)
Cite this article (links to download the citations from this article in formats compatible with various reference manager tools)
RNA-directed activation of cytoplasmic dynein-1 in reconstituted transport RNPs
eLife 7:e36312.
https://doi.org/10.7554/eLife.36312


