Arabidopsis formin 2 regulates cell-to-cell trafficking by capping and stabilizing actin filaments at plasmodesmata
- Tsinghua University, China
- Institute of Botany, Chinese Academy of Sciences, China
- University of Chinese Academy of Sciences, China
Figures
Figure 1 with 2 supplements

AtFH2 localizes to plasmodesmata and its PD localization is determined by the TM-containing N-terminus.
(A) Images of AtFH2-mCherry and callose (stained with aniline blue) in Arabidopsis epidermal pavement cells and the merged image. (B) Images of AtFH2-mCherry and PDLP1-eGFP in Arabidopsis epidermal pavement cells and the merged image. (C) Images of AtFH2-mCherry and YFP-PDCB1 in Arabidopsis epidermal pavement cells and the merged image. (D) AtFH2-eGFP, CMV MP-mCherry and the merged image in N. benthamiana leaf epidermal cells. (E) Schematic representation of AtFH2 and the truncated proteins used for the intracellular localization analysis. SP, signal peptide; TMD, trans-membrane domain. (F) AtFH2N437-eGFP, CMV MP-mCherry and the merged image in epidermal cells of N. benthamiana leaves. (G) AtFH2N282-eGFP, CMV MP-mCherry and the merged image in epidermal cells of N. benthamiana leaves. (H) AtFH2N175-eGFP, CMV MP-mCherry and the merged image in epidermal cells of N. benthamiana leaves. (I) AtFH2N282-ΔTMD-eGFP, CMV MP-mCherry and the merged image in epidermal cells of N. benthamiana leaves. Bars = 10 μm in all images, and bars = 5 μm in all inset images.
Figure 1—figure supplement 1
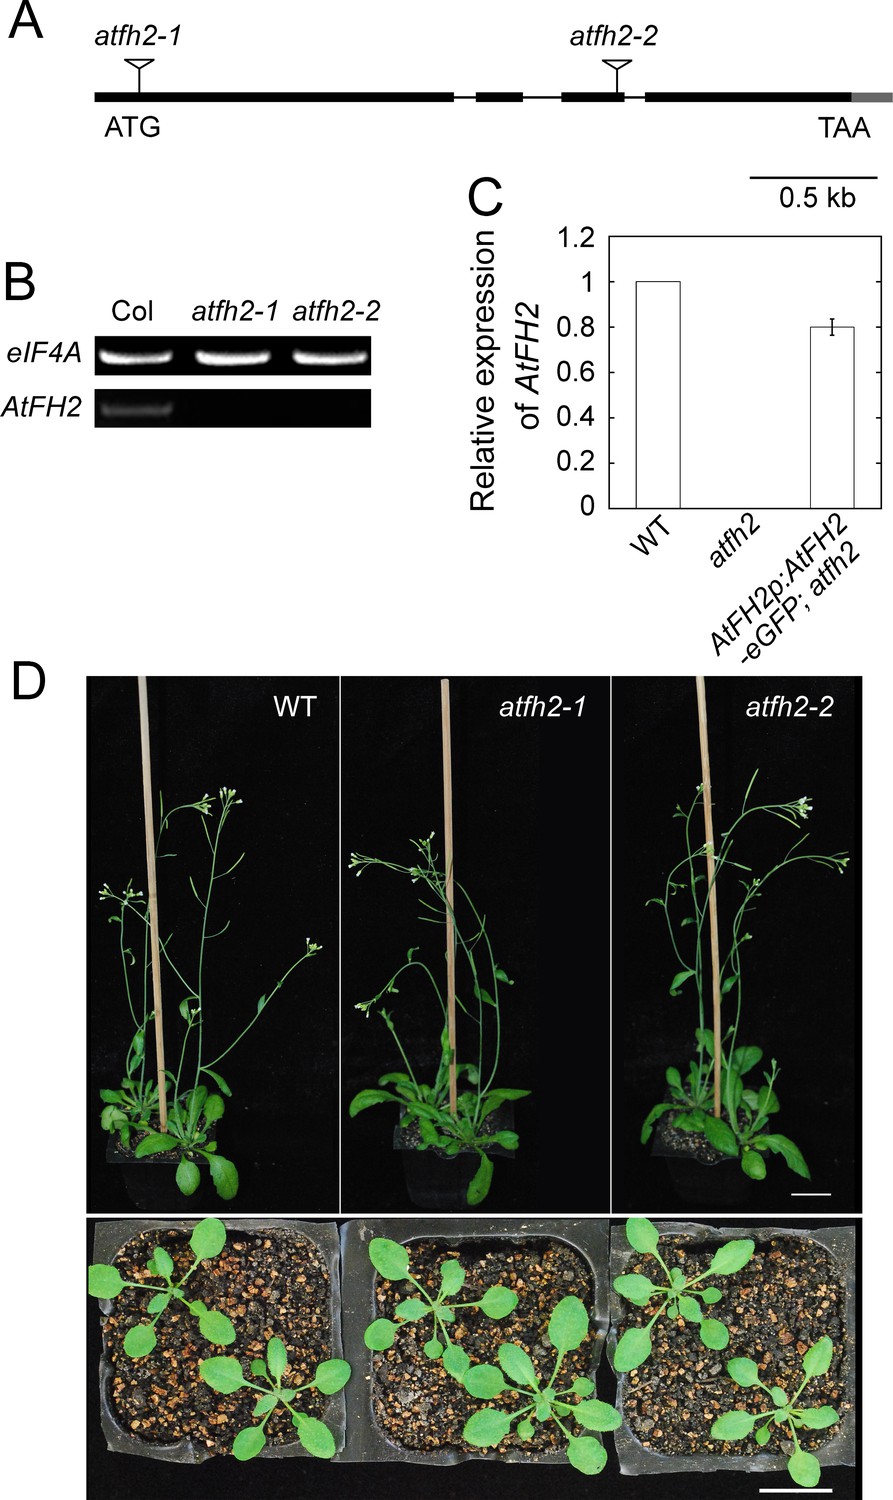
No overt developmental defect is detected in seedlings and adult plants of atfh2 mutants.
(A) Physical structure of the AtFH2 gene. Exons, introns and untranslated regions are represented by black boxes, black lines, and grey boxes, respectively. Two T-DNA insertion lines GK_066D02 and GK_396H03 were designated as atfh2-1 and atfh2-2, respectively. Inverted triangles indicate the position of T-DNA insertions. (B) Determination of the level of AtFH2 transcripts by semi-quantitative (q) RT-PCR analysis. eIF4A was used as an internal control. (C) Determination of the level of AtFH2 transcripts in WT, atfh2-1 and AtFH2p:AtFH2-eGFP;atfh2 by qRT-PCR. AtFH2p:AtFH2-eGFP;atfh2 represents atfh2-1 mutant plants expressing AtFH2-eGFP under the control of the AtFH2 promoter. (D) Images of WT and atfh2 mutant Arabidopsis plants. The upper panel shows 8-week-old adult plants and the lower panel shows 4-week-old seedlings. Bars = 2 cm.
-
Figure 1—figure supplement 1—source data 1
Quantification of relative expression of AtFH2 plotted in Figure 1—figure Supplement 1C.
- https://doi.org/10.7554/eLife.36316.005
Figure 1—figure supplement 2
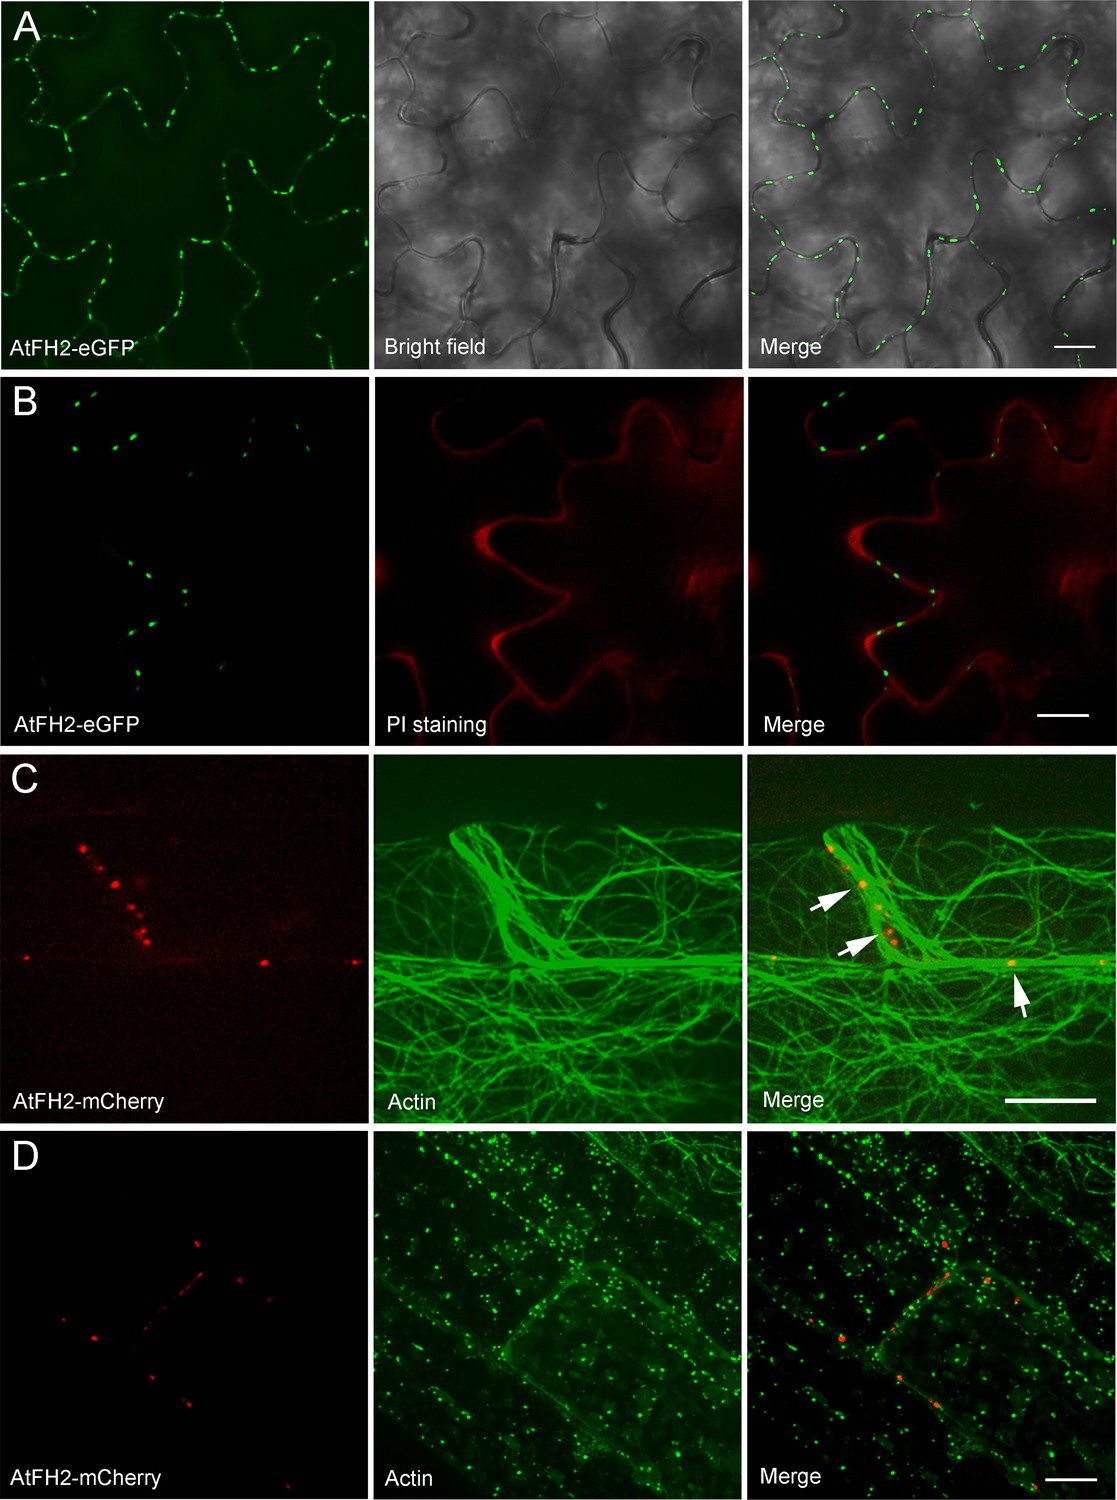
AtFH2 localizes to cell borders and its localization pattern does not depend on the presence of an intact actin cytoskeleton.
(A) Transgenic expression of AtFH2-eGFP in Arabidopsis. eGFP fluorescence is visible as punctate spots on the boundaries of Arabidopsis epidermal pavement cells. (B) AtFH2-eGFP (green) localizes at PI-stained cross-wall regions (red). (C) Images of AtFH2-mCherry (red) and GFP-ABD2 (green) in leaf epidermal cells of AtFH2pro:AtFH2-mCherry;atfh2 Arabidopsis plants expressing 35S:GFP-ABD2. White arrows indicate punctate structures formed by AtFH2. (D) Images of AtFH2-mCherry and GFP-ABD2 in Arabidopsis hypocotyl epidermal cells in the presence of 1 μM latrunculin B (LatB). AtFH2-mCherry still forms punctate spots (left) when actin filaments are depolymerized by LatB in hypocotyl epidermal cells. Bars = 10 μm in (A–D).
Figure 2 with 4 supplements
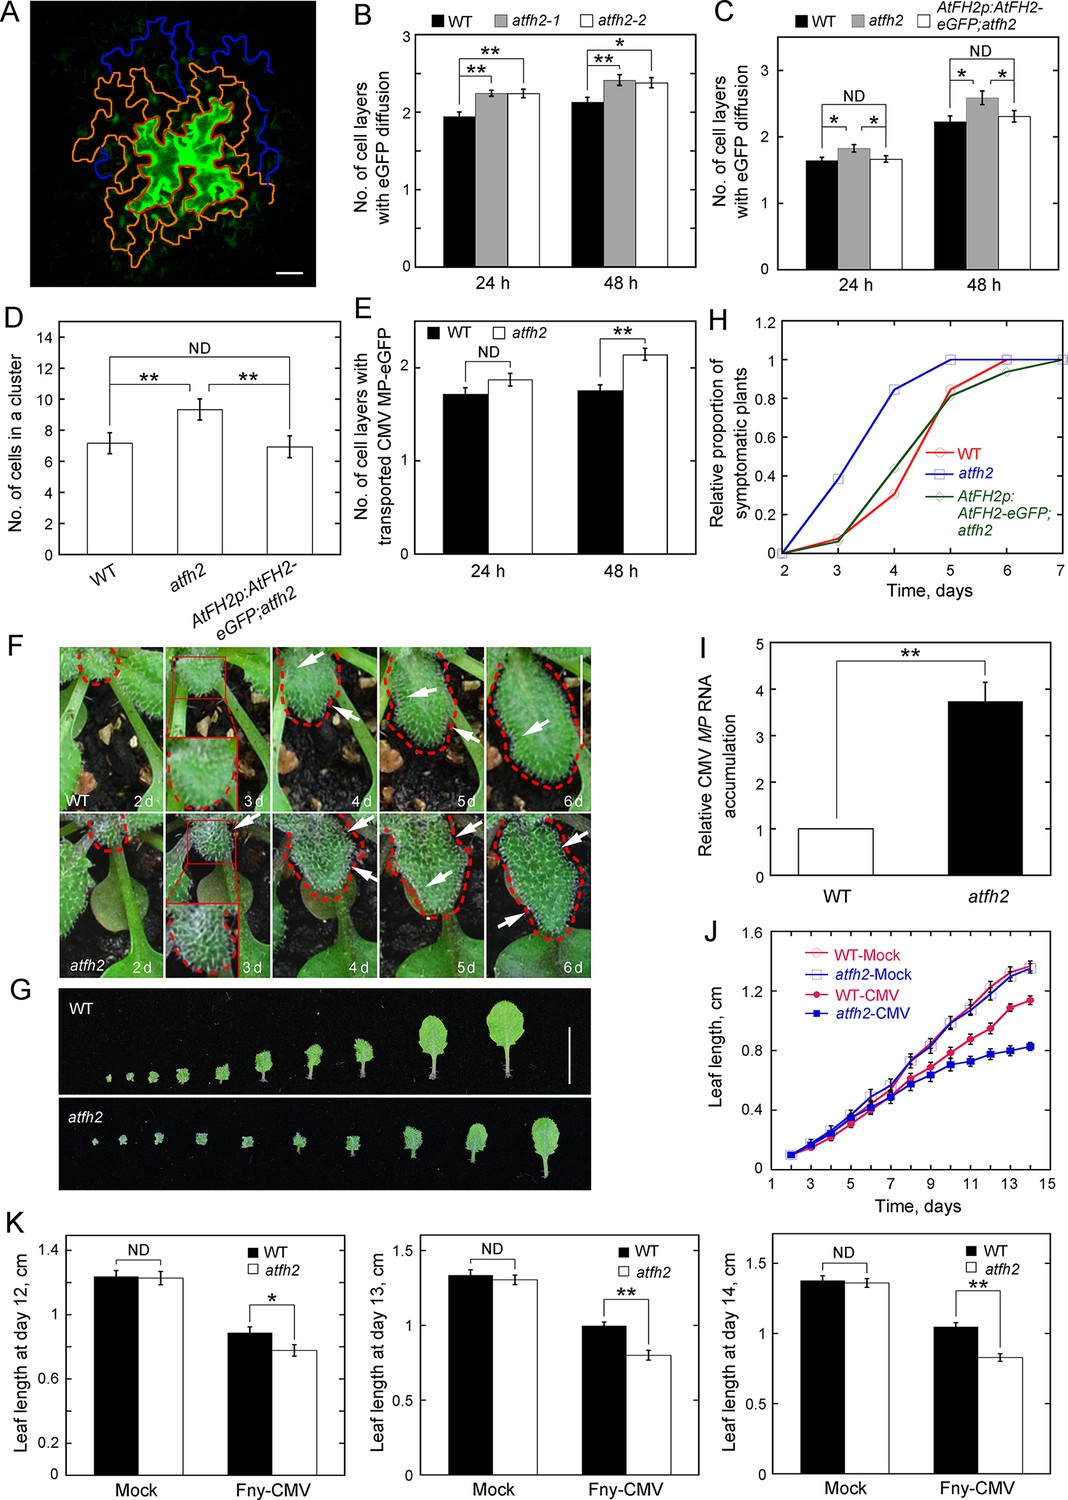
Loss of function of AtFH2 increases SEL of PD.
(A) Diagram of the eGFP diffusion assay in Arabidopsis epidermal pavement cells. The edge of the initial cell expressing eGFP, cells in the first diffusion layer and cells in the second diffusion layer are marked by red, orange and blue lines, respectively. Bar = 10 μm. (B, C) Quantification of the number of cell layers showing eGFP diffusion. The number of eGFP diffusion cell layers at 24 hr and 48 hr after the bombardment was counted and plotted. The experiments were repeated at least three times, and more than 30 cells expressing eGFP were counted each time. Values represent mean ± SE. ND, no statistical difference, **p<0.01 and *p<0.05 by Mann-Whitney U test. Given that atfh2-1 and atfh2-2 exhibit a similar cell-to-cell trafficking phenotype, we only used atfh2-1 as the representative AtFH2 loss-of-function mutant in the following studies. (D) Quantification of the number of cells in an eGFP diffusion cluster. The total number of cells within the cluster was counted and plotted at 24 hr after the bombardment. The experiments were repeated at least three times, and more than 30 GFP-expressing cells were counted each time. Values represent mean ± SE. ND, no statistical difference, **p<0.01 by Mann-Whitney U test. (E) Quantification of the number of cell layers showing cell-to-cell movement of CMV MP-eGFP. The experiments were repeated at least three times, and more than 30 CMV MP-eGFP-expressing cells were counted each time. Values represent mean ± SE. ND, no statistical difference, **p<0.01 by Mann-Whitney U test. (F) Symptoms of Fny-CMV infection in WT and atfh2 mutant plants. WT Arabidopsis leaves start to wrinkle at day 4, whereas atfh2 mutant leaves start to wrinkle at day 3. Wrinkles are indicated by white arrows. The edges of leaves are marked with dashed red lines. Bar = 0.5 cm. (G) Symptoms in wild type (top) and atfh2 mutant (bottom) Arabidopsis 2 weeks after systemic infection with Fny-CMV. All leaves from Arabidopsis plants 14 days after inoculation with Fny-CMV are shown. Bar = 1 cm. (H) Quantification of the Fny-CMV infection rate of WT, atfh2 mutant and AtFH2p:AtFH2-eGFP;atfh2 plants. The number of symptomatic plants (with curly leaves) was counted at different days and the relative proportion of symptomatic plants was plotted. Symptoms were evident earlier in atfh2 mutants than in WT and AtFH2p:AtFH2-eGFP;atfh2 plants. (I) Determination of the relative level of CMV MP transcripts by qRT-PCR in the newly grown small leaves of Fny-CMV-infected WT and atfh2 mutant plants at day 3. Relative CMV MP RNA accumulation represents the relative amount of virus in plants. Values represent mean ± SE, **p<0.01 by Student’s t-test. (J) Quantification of Arabidopsis leaf length 2 weeks after infection with Fny-CMV. Mock (water treatment); CMV (Fny-CMV treatment). The growth of atfh2 leaves is slower than that of WT leaves after infection with Fny-CMV. Values represent mean ± SE, n ≥ 20. (K) Quantification of Arabidopsis leaf length at days 12, 13 and 14 after inoculation with Fny-CMV. Values represent mean ± SE, n ≥ 20. **p<0.01 by Student’s t-test. ND, no statistical difference.
-
Figure 2—source data 1
Quantification of eGFP diffusion plotted in Figure 2B.
- https://doi.org/10.7554/eLife.36316.022
-
Figure 2—source data 2
Quantification of eGFP diffusion plotted in Figure 2C.
- https://doi.org/10.7554/eLife.36316.023
-
Figure 2—source data 3
Quantification of eGFP diffusion plotted in Figure 2D.
- https://doi.org/10.7554/eLife.36316.024
-
Figure 2—source data 4
Quantification of CMV MP transporting plotted in Figure 2E.
- https://doi.org/10.7554/eLife.36316.025
-
Figure 2—source data 5
Quantification of Fny-CMV infection plants plotted in Figure 2H.
- https://doi.org/10.7554/eLife.36316.026
-
Figure 2—source data 6
Quantification of relative CMV MP RNA accumulation plotted in Figure 2I.
- https://doi.org/10.7554/eLife.36316.027
-
Figure 2—source data 7
Quantification of leaf length plotted in Figure 2J.
- https://doi.org/10.7554/eLife.36316.028
-
Figure 2—source data 8
Quantification of leaf length plotted in Figure 2K.
- https://doi.org/10.7554/eLife.36316.029
Figure 2—figure supplement 1
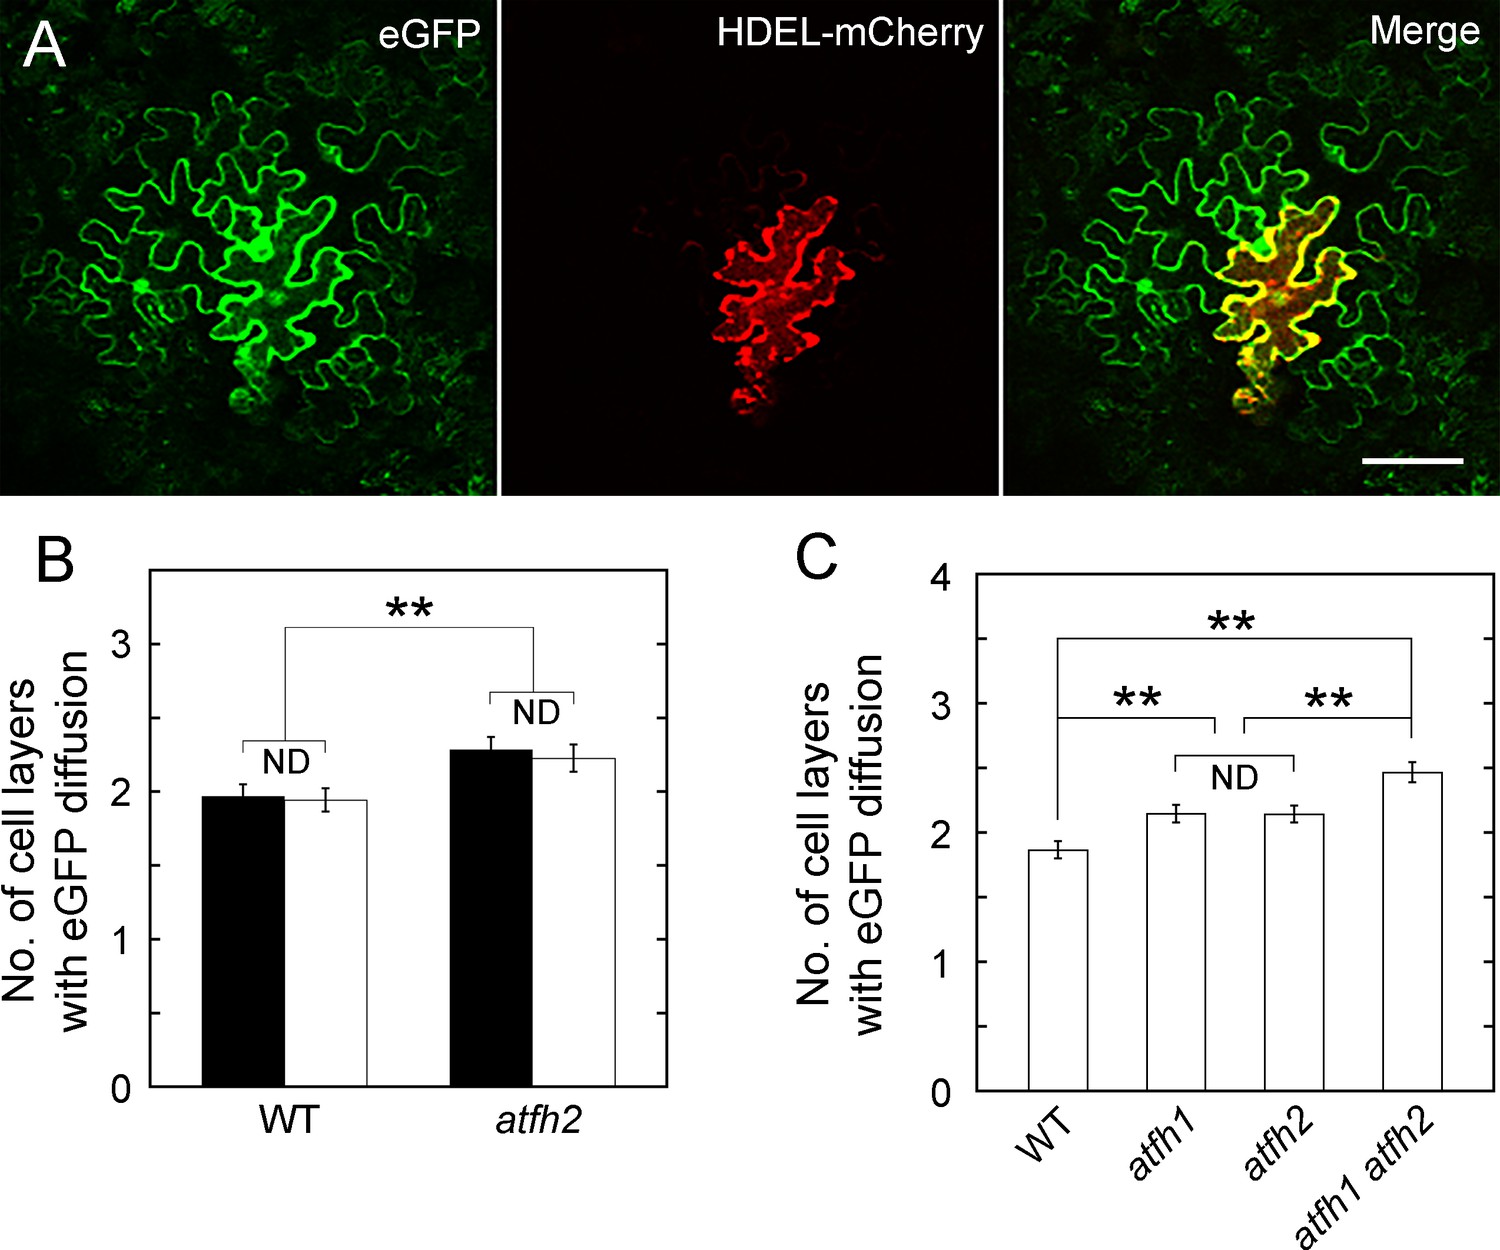
Loss of function of AtFH1 and/or AtFH2 increases SEL of PD.
(A) eGFP, HEDL-mCherry and the merged image. A non-mobile fluorescent protein, HDEL-mCherry, was used to indicate the bombarded cell. Bar = 10 μm. (B) Quantification of eGFP diffusion cell layers in WT and atfh2-1 Arabidopsis leaf epidermal cells. The number of diffusion cell layers at 24 hr was plotted. The bombardments were performed with eGFP expressing pdGN (white columns) or pdGN plus pdGN-35S:HDEL-mCherry (black columns). (C) Quantification of eGFP diffusion cell layers in WT, atfh1, atfh2 and atfh1 atfh2 Arabidopsis leaf epidermal cells. The number of diffusion cell layers at 24 hr was plotted. The bombardments were performed with pdGN and pdGN-35S:HDEL-mCherry. Error bars represent SE, n > 30, ND, no statistical difference; **p<0.01 by Mann-Whitney U test. The experiment was repeated at least three times.
-
Figure 2—figure supplement 1—source data 1
Quantification of eGFP diffusion plotted in Figure 2—Figure Supplement 1B.
- https://doi.org/10.7554/eLife.36316.009
-
Figure 2—figure supplement 1—source data 2
Quantification of eGFP diffusion plotted in Figure 2—Figure Supplement 1C.
- https://doi.org/10.7554/eLife.36316.010
Figure 2—figure supplement 2
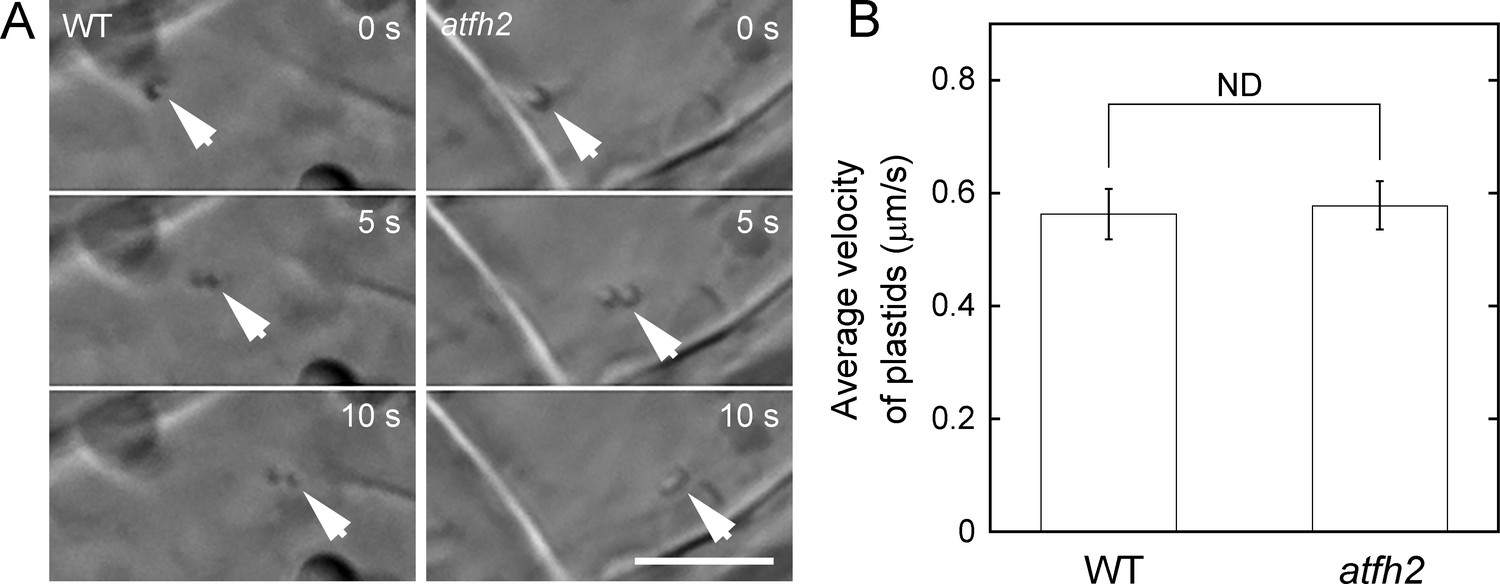
No overt defect of cytoplasmic streaming is detected in hypocotyl cells of atfh2 mutants.
(A) Time-lapse images of plastid movement in the hypocotyl cells of wild type and atfh2-1 Arabidopsis. White arrows indicate the plastid. Bar = 10 μm. (B) Average velocity of plastids in the hypocotyl cells of wild type and atfh2-1 Arabidopsis. More than 50 data sets were collected for each genotype. ND, no statistical difference by Student’s t-test.
-
Figure 2—figure supplement 2—source data 1
Quantification of cytoplasmic streaming plotted in Figure 2—Figure Supplement 1B.
- https://doi.org/10.7554/eLife.36316.012
Figure 2—figure supplement 3
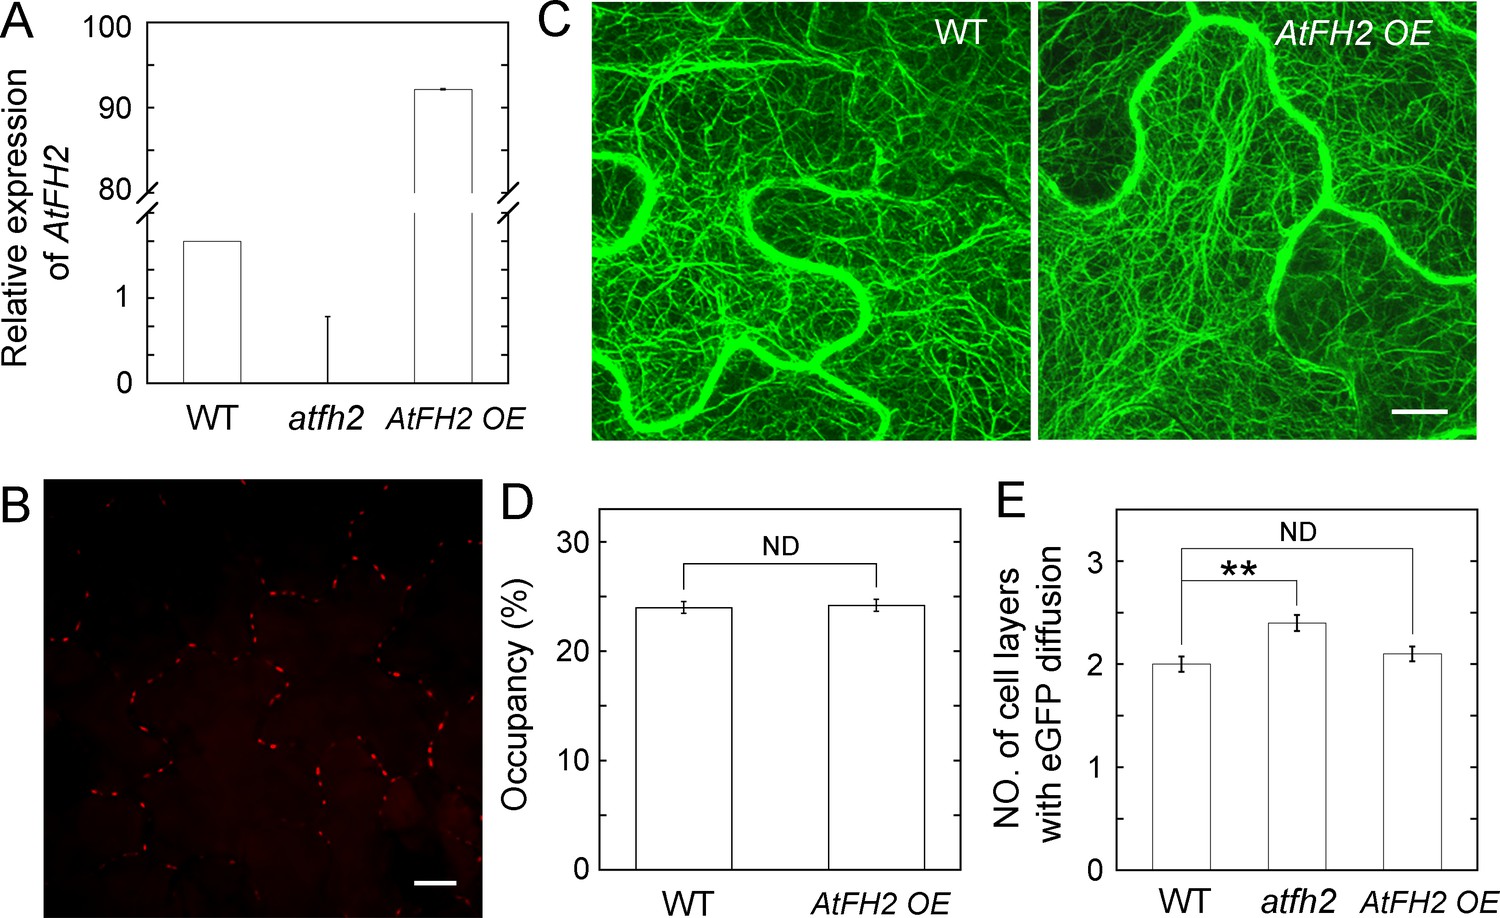
Overexpression of AtFH2 does not affect the overall organization of actin filaments and cell-to-cell trafficking.
(A) Determination of the level of AtFH2 transcripts in WT, atfh2 mutants and AtFH2 OE plants by qRT-PCR. AtFH2 OE represents Arabidopsis plants expressing pCAMBIA1301-35S:AtFH2-mCherry. The expression of AtFH2 is relative to eIF4A. (B) Image of AtFH2-mCherry in leaf epidermal cells from AtFH2 OE plants. Bar = 10 μm. (C) Images of actin filaments decorated with GFP-ABD2 in leaf epidermal cells of WT and AtFH2 OE plants. Bar = 10 μm. (D) Quantification of the density of actin filaments in Arabidopsis leaf epidermal cells. More than 50 cells were measured for each genotype. ND, no statistical difference, by Student’s t-test. (E) Quantification of eGFP diffusion cell layers in Arabidopsis leaf epidermal cells. The number of diffusion cell layers at 24 hr was plotted. Error bars represent SE, n > 30, ND, no statistical difference; and **p<0.01 by Mann-Whitney U test. The experiment was repeated at least three times.
-
Figure 2—figure supplement 3—source data 1
Quantification of relative expression of AtFH2 plotted in Figure 2—Figure Supplement 3A.
- https://doi.org/10.7554/eLife.36316.014
-
Figure 2—figure supplement 3—source data 2
Quantification of actin filament density plotted in Figure 2—Figure Supplement 3D.
- https://doi.org/10.7554/eLife.36316.015
-
Figure 2—figure supplement 3—source data 3
Quantification of eGFP diffusion plotted in Figure 2—Figure Supplement 3E.
- https://doi.org/10.7554/eLife.36316.016
Figure 2—figure supplement 4
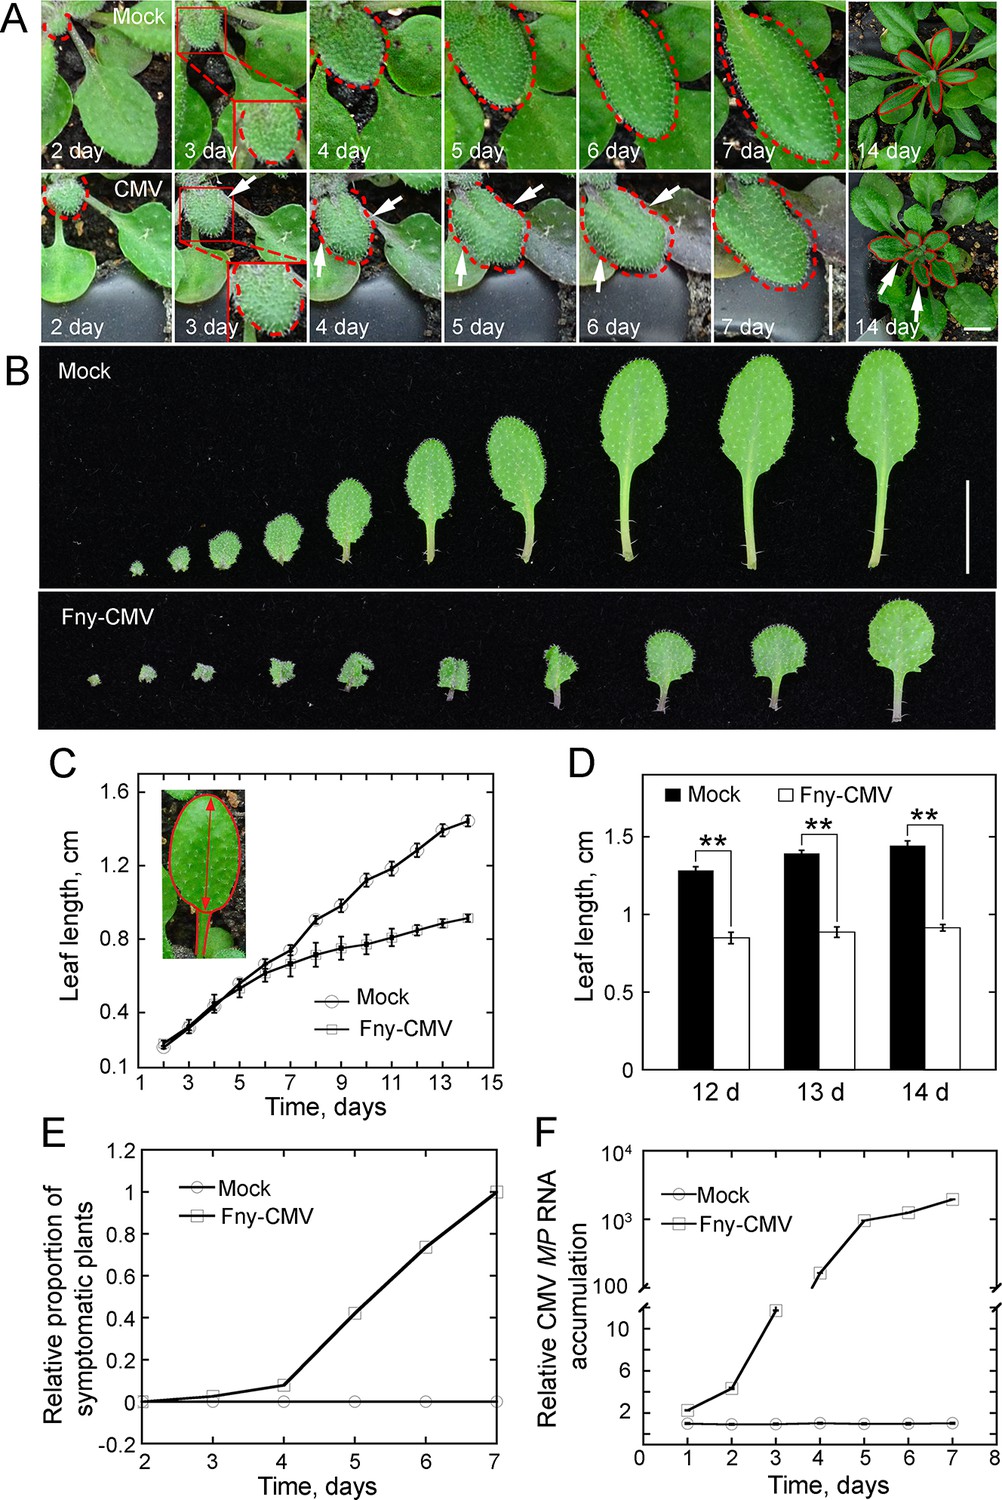
The symptoms of Fny-CMV infection in Arabidopsis plants.
(A) Arabidopsis leaves showing symptoms of viral infection after inoculation with Fny-CMV. Compared to plants treated with water (mock), the leaves of the Fny-CMV-treated plants start to become wrinkled (indicated by white arrows) at day three after inoculation. The edges of leaves are marked with dashed red lines. Fny-CMV inoculation causes obvious distortion of systemically infected small leaves at day 14. Bar = 0.5 cm. (B) Images of Arabidopsis leaves after inoculation with Fny-CMV or mock treatment (water). All leaves from Arabidopsis plants 14 days after treatment are presented. Bar = 1 cm. (C) Quantification of average leaf length in WT Arabidopsis plants 2 weeks after inoculation with Fny-CMV. The long axis of the blade (the red arrow) was measured as the leaf length. Values represent mean ± SE, n ≥ 20. The experiments were repeated at least five times. (D) Quantification of average Arabidopsis leaf length after inoculation with Fny-CMV at days 12, 13 and 14. Values represent mean ± SE, n ≥ 20. **p<0.01 by Student’s t-test. (E) Quantification of the relative proportion of symptomatic plants after inoculation with Fny-CMV or water (mock treatment) in WT plants. The number of symptomatic plants (with curly leaves) was counted at different days and the relative proportion of symptomatic plants was plotted. (F) Determination of the level of CMV MP transcripts by qRT-PCR analysis. The measurement was performed to detect the daily viral changes in the plants after infection with Fny-CMV. Values represent mean ± SE, n > 3.
-
Figure 2—figure supplement 4—source data 1
Quantification of leaf length plotted in Figure 2—figure supplement 4C.
- https://doi.org/10.7554/eLife.36316.018
-
Figure 2—figure supplement 4—source data 2
Quantification of leaf length plotted in Figure 2—figure supplement 4D.
- https://doi.org/10.7554/eLife.36316.019
-
Figure 2—figure supplement 4—source data 3
Quantification of Fny-CMV infection plants plotted in Figure 2—figure supplement 4E.
- https://doi.org/10.7554/eLife.36316.020
-
Figure 2—figure supplement 4—source data 4
Quantification of relative CMV MP RNA accumulationin Figure 2—figure supplement 4F.
- https://doi.org/10.7554/eLife.36316.021
Figure 3 with 1 supplement

Determination of the intracellular localization of Arabidopsis Class I formins.
(A) Phylogenetic analysis of Class I Arabidopsis formins. The phylogenetic tree was made by MEGA 4.0 based on neighbor joining analysis. Numbers on branches represent the bootstrap values. (B–I) Examination of the intracellular localization pattern of Class I Arabidopsis formins by expressing their eGFP fusion constructs in Arabidopsis hypocotyl cells. (B) AtFH1(N)-eGFP; (C) AtFH4(N)-eGFP; (D) AtFH5-eGFP; (E) AtFH6(N)-eGFP; (F) AtFH8(N)-eGFP; (G) AtFH9(N)-eGFP; (H) AtFH10(N)-eGFP; (I) AtFH11(N)-eGFP. White arrows indicate punctate structures. (J) AtFH1(N)-eGFP, callose, and the merged image in Arabidopsis expressing 35S:AtFH1(N)-eGFP. (K) AtFH1(N)-eGFP, AtFH2-mCherry, and the merged image in Arabidopsis plants expressing 35S:AtFH1(N)-eGFP and 35S:AtFH2-mCherry. (L) AtFH4(N)-eGFP, callose, and the merged image in Arabidopsis expressing 35S:AtFH4(N)-eGFP. (M) AtFH8(N)-eGFP, callose, and the merged image in Arabidopsis expressing 35S:AtFH8(N)-eGFP. (N) AtFH9(N)-eGFP, callose, and the merged image in Arabidopsis expressing 35S:AtFH9(N)-eGFP. (O) AtFH9(N)-eGFP, AtFH2-mCherry, and the merged image in Arabidopsis plants expressing 35S:AtFH9(N)-eGFP and AtFH2pro:AtFH2-mCherry. White arrows in (J), (K), (N) and (O) indicate PD. Bars = 10 μm.
Figure 3—figure supplement 1
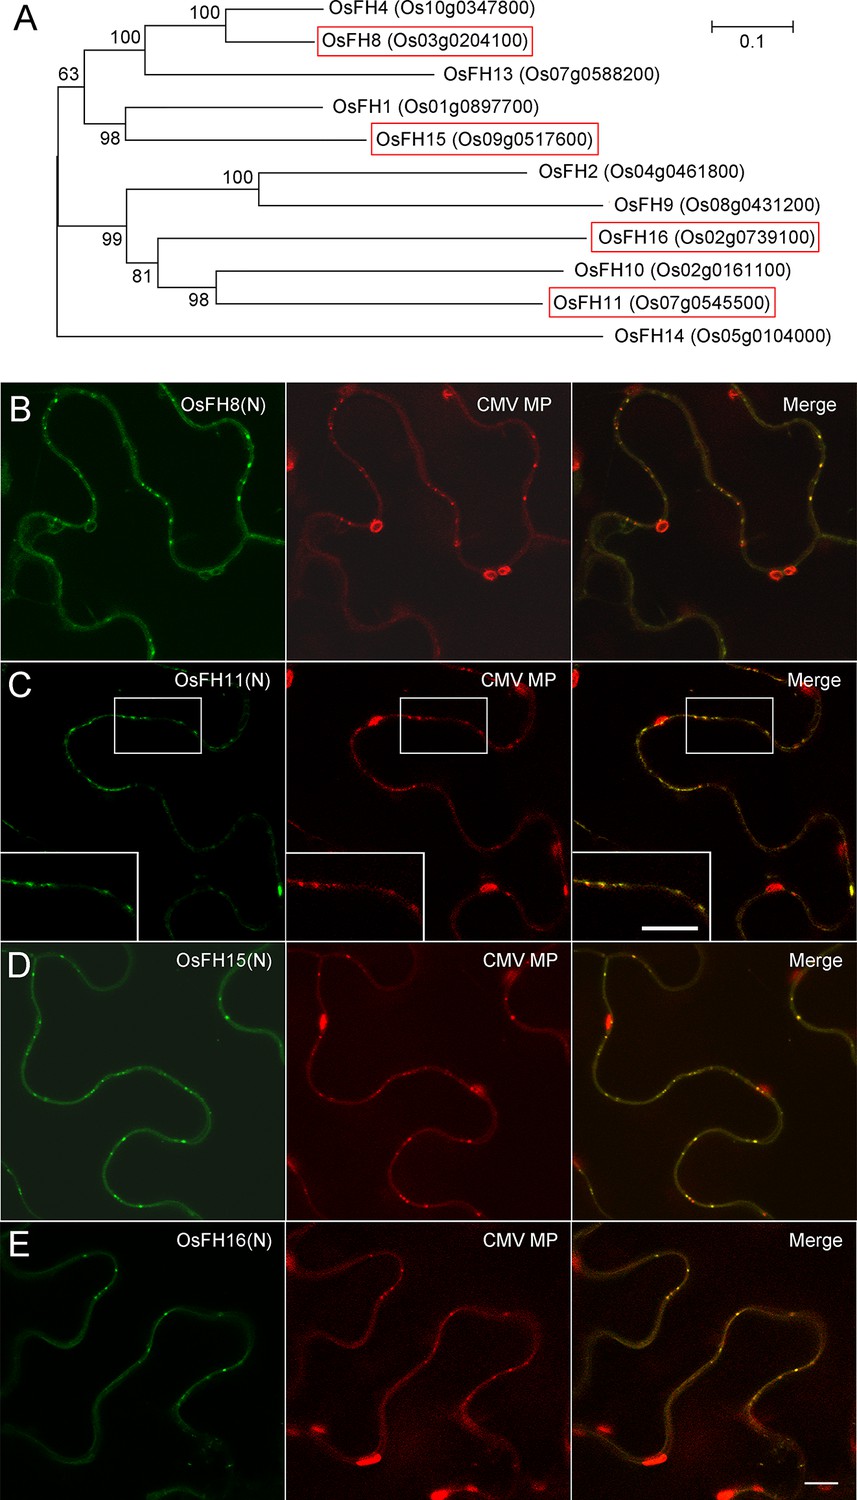
Several Class I rice formins localize to plasmodesmata.
(A) Phylogenetic analysis of Class I Oryza sativa Japonica formins. Phylogenetic tree was made by MEGA 4.0 based on neighbor joining analysis. Numbers on branches represent the bootstrap values. Rice Class I formins boxed in red were shown to have a positive PD localization pattern (see B–E). (B–E) Localization of several rice Class I formins in epidermal pavement cells of N. benthamiana leaves. The PD localization pattern was confirmed by colocalization with CMV MP-mCherry. (B) OsFH8(N) (Os03g0204100); (C) OsFH11(N) (Os07g0545500); (D) OsFH15(N) (Os09g0517600); (E) OsFH16(N) (Os02g0739100). Bar = 10 μm.
Figure 4 with 2 supplements
AtFH1 and AtFH2 redundantly regulate PD permeability.
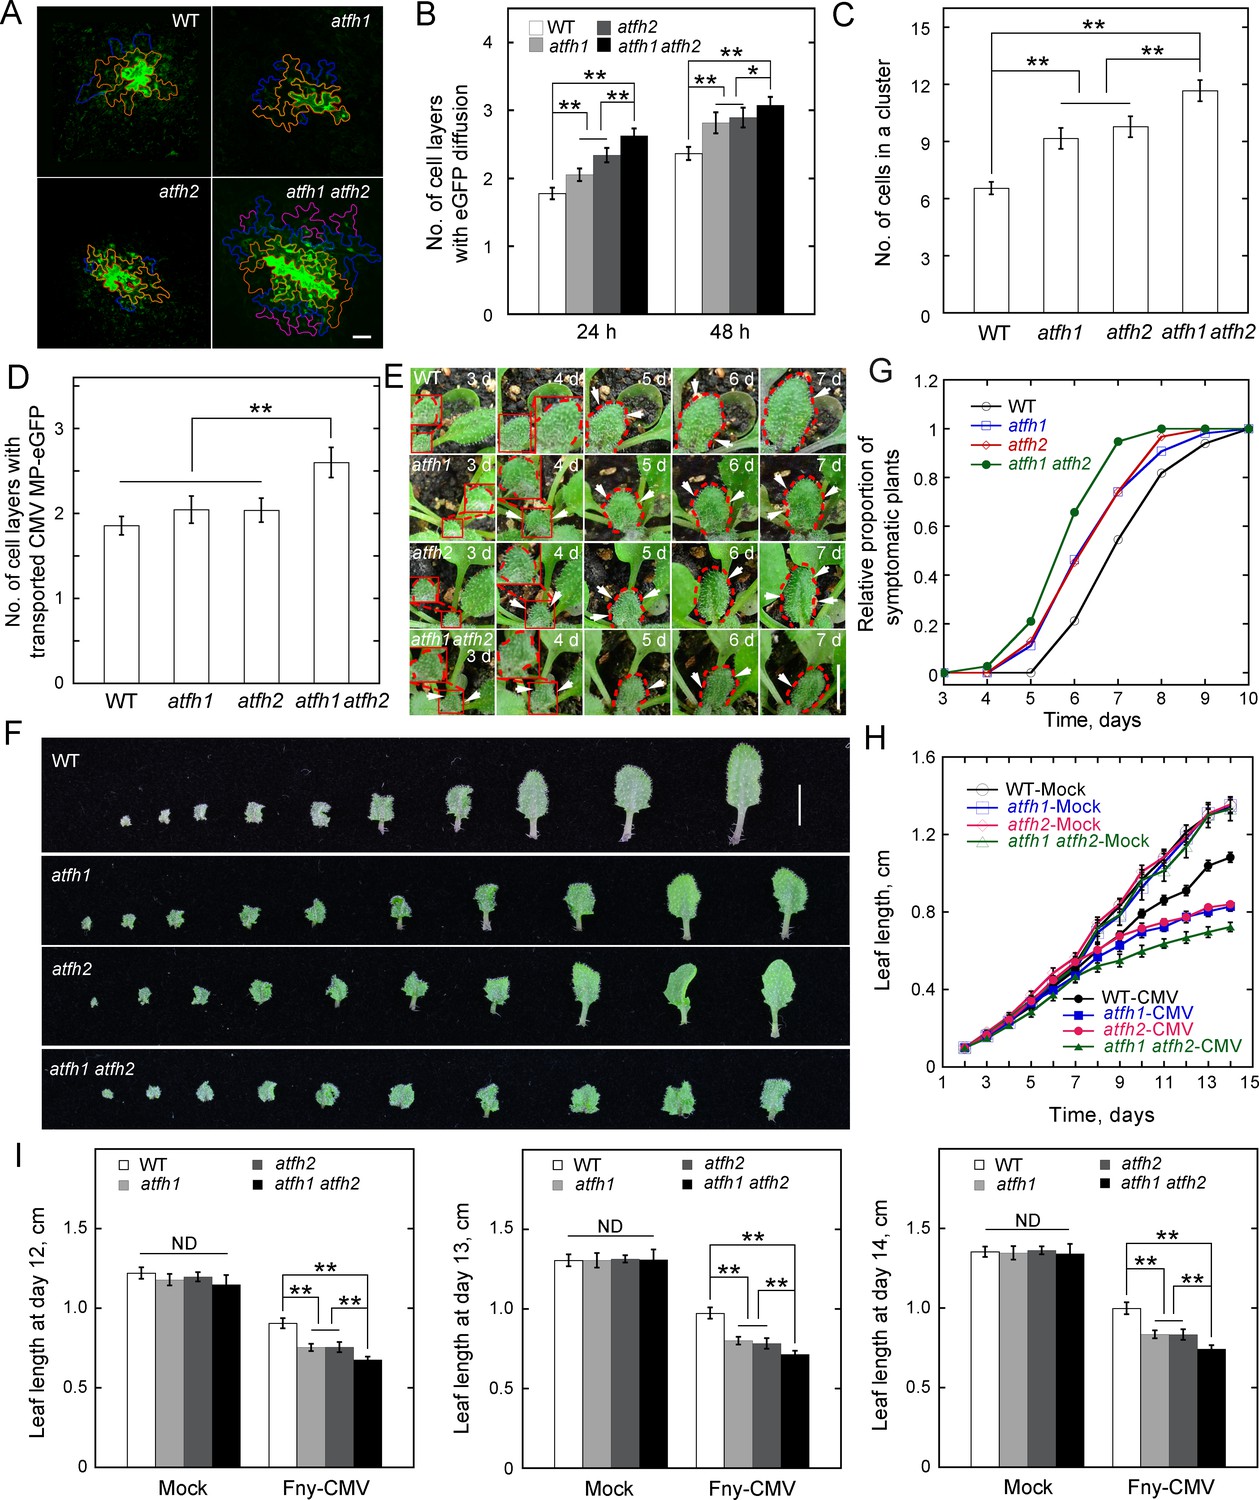
(A) Images of eGFP diffusion in leaf epidermal pavement cells of WT, atfh1, atfh2 and atfh1 atfh2 plants. The edge of the cell that initially expressed eGFP is marked by a red line. The edge of cells within the first, second and third diffusion layers are marked by orange, blue, and pink lines, respectively. Bar = 10 μm. (B) Quantification of the number of eGFP diffusion layers in leaves of WT, atfh1, atfh2 and atfh1 atfh2 plants. The number of cell layers showing eGFP diffusion at 24 hr and 48 hr was measured and plotted. Values represent mean ± SE. *p<0.05, and **p<0.01 by Mann-Whitney U test. More than 30 cells were counted each time and the experiments were repeated at least three times. (C) Quantification of the number of cells in an eGFP diffusion cluster in WT, atfh1, atfh2 and atfh1 atfh2 mutant plants. The number of cells was determined at 24 hr after the bombardment. Values represent mean ± SE. **p<0.01 by Mann-Whitney U test. More than 30 cells were counted each time and the experiments were repeated at least three times. (D) Quantification of the number of cell layers showing cell-to-cell movement of CMV MP-eGFP in leaves of WT, atfh1, atfh2 and atfh1 atfh2 plants. The number of diffusion cell layers at 48 hr was measured and plotted. Values represent mean ± SE. **p<0.01, by Mann-Whitney U test. More than 30 cells were counted and the experiments were repeated at least three times. (E) Symptom of Fny-CMV infection in WT, atfh1, atfh2 and atfh1 atfh2 mutant Arabidopsis plants. Small leaves started to become wrinkled (indicated by white arrows) between days 3 to 7. The edges of leaves are marked with dashed red lines. Bar = 1 cm. (F) Images of Arabidopsis leaves from WT, atfh1, atfh2 and atfh1 atfh2 plants 14 days after inoculation with Fny-CMV. Bar = 1 cm. (G) Quantification of the relative proportion of symptomatic plants in WT, atfh1, atfh2 and atfh1 atfh2 plants after infection with Fny-CMV. The number of symptomatic plants (with curly leaves) was counted at different days and the relative proportion of symptomatic plants was plotted. (H) Quantification of Arabidopsis leaf length after Fny-CMV infection. The length of leaves was defined according to the method shown in Figure 2—figure supplement 4C. The average length of Arabidopsis leaves was traced for 2 weeks. (I) Quantification of Arabidopsis leaf length at days 12, 13 and 14 after inoculation. Values represent mean ± SE, n ≥ 20. **p<0.01 by Student’s t-test. ND, no statistical difference.
-
Figure 4—source data 1
Quantification of eGFP diffusion plotted in Figure 4B.
- https://doi.org/10.7554/eLife.36316.042
-
Figure 4—source data 2
Quantification of eGFP diffusion plotted in Figure 4C.
- https://doi.org/10.7554/eLife.36316.043
-
Figure 4—source data 3
Quantification of CMV MP transporting plotted in Figure 4D.
- https://doi.org/10.7554/eLife.36316.044
-
Figure 4—source data 4
Quantification of Fny-CMV infection plants plotted in Figure 4G.
- https://doi.org/10.7554/eLife.36316.045
-
Figure 4—source data 5
Quantification of leaf length plotted in Figure 4H.
- https://doi.org/10.7554/eLife.36316.046
-
Figure 4—source data 6
Quantification of leaf length plotted in Figure 4I.
- https://doi.org/10.7554/eLife.36316.047
Figure 4—figure supplement 1

Characterization of atfh1 and atfh1 atfh2 mutants.
(A) Physical structure of the AtFH1 gene. Exons, introns and untranslated regions are represented by black boxes, black lines, and grey boxes, respectively. Salk_143939 was designated as atfh1-3. Information about Salk_032981 (atfh1-1) has been presented previously (Rosero et al., 2013). (B) Determination of the level of AtFH1 transcripts in WT and atfh1-3 mutants by semi-quantitative (q) RT-PCR. (C) Determination of the relative levels of AtFH1 transcripts in WT and atfh1-3 mutants by qRT-PCR. The results in (B) and (C) showed that AtFH1 transcripts are absent in atfh1-3 mutants. eIF4A was selected as the internal control. (D) Quantification of the circularity of pavement cells from cotyledons. The circularity of epidermal pavement cells from cotyledons of seedlings at day 5 was measured. Values represent mean ± SE, n ≥ 30. *p<0.05 by Student’s t-test. The experiments were repeated at least five times. The phenotypic results of leaf epidermal cell circularity are consistent with previously published results (Rosero et al., 2016). (E) Quantification of the number of cell layers showing eGFP diffusion in leaves of WT, atfh1-1 and atfh1-3 plants. The number of eGFP diffusion layers was measured at 24 hr and 48 hr after the bombardment. Values represent mean ± SE, n > 30; *p<0.05 and **p<0.01 by Mann-Whitney U test. The experiments were repeated at least three times. atfh1-3 was crossed with atfh2 to generate atfh1 atfh2 double mutants. In the following studies, atfh1-3 and used as the representative AtFH1 loss-of-function mutant. (F) Determination of the relative levels of AtFH1 transcripts in formin mutants by qRT-PCR analysis. (G) Determination of the relative levels of AtFH2 transcripts in formin mutants by qRT-PCR analysis. (H) Images of Arabidopsis seedlings of WT, atfh1, atfh2 and atfh1 atfh2 plants. Bar = 1 cm. (I) Images of 4-week-old WT, atfh1, atfh2 and atfh1 atfh2 plants. Bar = 2 cm. Based on the plant morphology data in (H) and (I), atfh1, atfh2, and atfh1 atfh2 mutants do not exhibit obvious developmental phenotypes compared to WT plants.
-
Figure 4—figure supplement 1—source data 1
Quantification of relative expression of AtFH1 plotted in Figure 4—figure supplement 1C.
- https://doi.org/10.7554/eLife.36316.034
-
Figure 4—figure supplement 1—source data 2
Quantification of circularity plotted in Figure 4—figure supplement 1D.
- https://doi.org/10.7554/eLife.36316.035
-
Figure 4—figure supplement 1—source data 3
Quantification of eGFP diffusion plotted in Figure 4—figure supplement 1E.
- https://doi.org/10.7554/eLife.36316.036
-
Figure 4—figure supplement 1—source data 4
Quantification of relative expression of AtFH1 plotted in Figure 4—figure supplement 1F.
- https://doi.org/10.7554/eLife.36316.037
-
Figure 4—figure supplement 1—source data 5
Quantification of relative expression of AtFH2 plotted in Figure 4—figure supplement 1G.
- https://doi.org/10.7554/eLife.36316.038
Figure 4—figure supplement 2
Callose accumulation is not affected in atfh1, atfh2 and atfh1 atfh2 mutants.
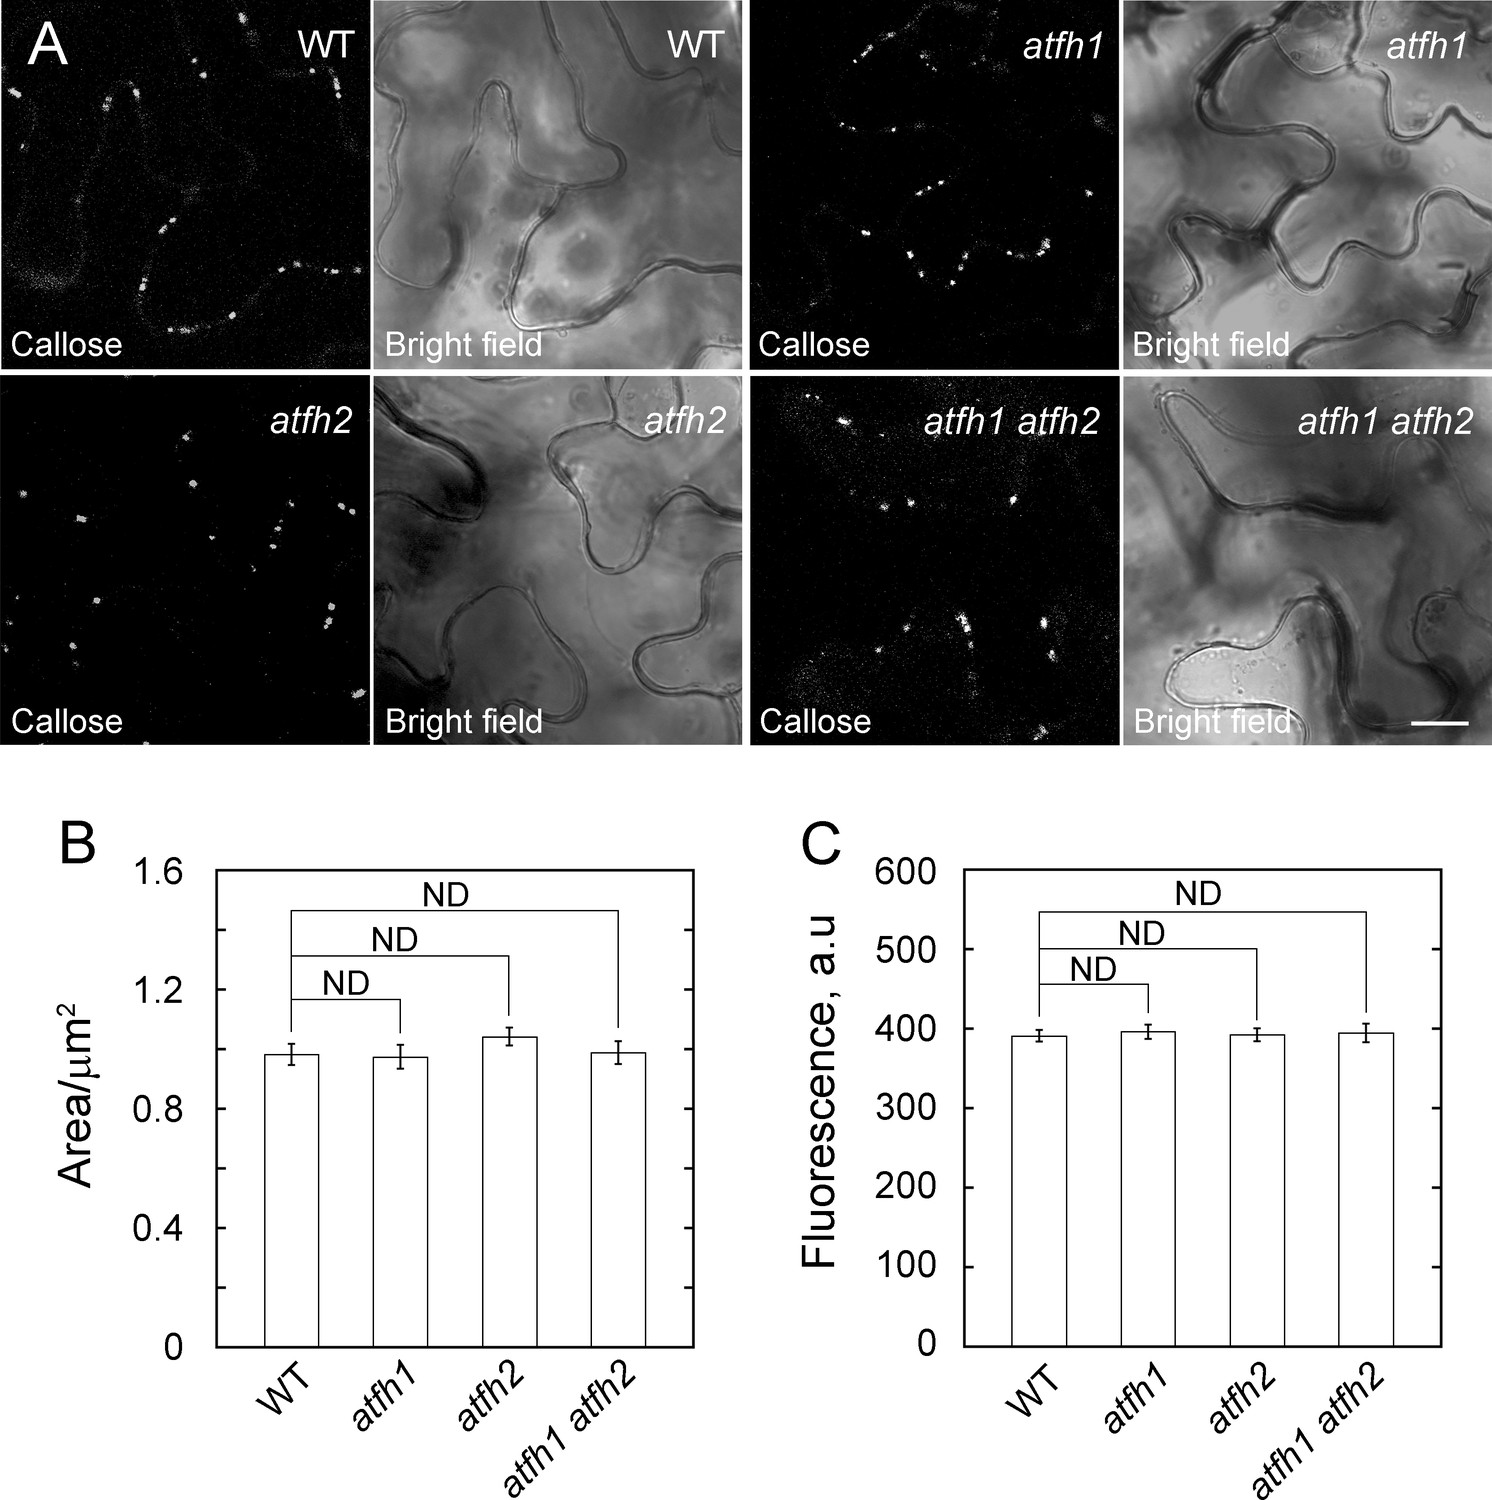
(A) Confocal micrographs of leaf tissue from wild-type Col-0 plants, atfh1 plants, atfh2 plants and atfh1 atfh2 plants stained with 0.1% aniline blue to reveal callose accumulation. Images were collected using identical confocal microscope settings. Bars = 10 μm. (B) Quantification of the area of aniline blue-stained callose foci. More than 100 foci were measured from at least 20 separate images for each genotype. Statistical comparison was performed with a Mann-Whitney U test, error bars represent SE. ND, no statistical difference. (C) Quantification of the average fluorescence intensity of aniline blue-stained callose foci. More than 100 foci were measured from at least 20 separate images for each genotype. Statistical comparison was performed with a Mann-Whitney U test, error bars represent SE. ND, no statistical difference.
-
Figure 4—figure supplement 2—source data 1
Quantification of the size of aniline blue-stained foci in Figure 4—figure supplement 2B.
- https://doi.org/10.7554/eLife.36316.040
-
Figure 4—figure supplement 2—source data 2
Quantification of the gray values of aniline blue-stained foci in Figure 4—figure supplement 2C.
- https://doi.org/10.7554/eLife.36316.041
Figure 5
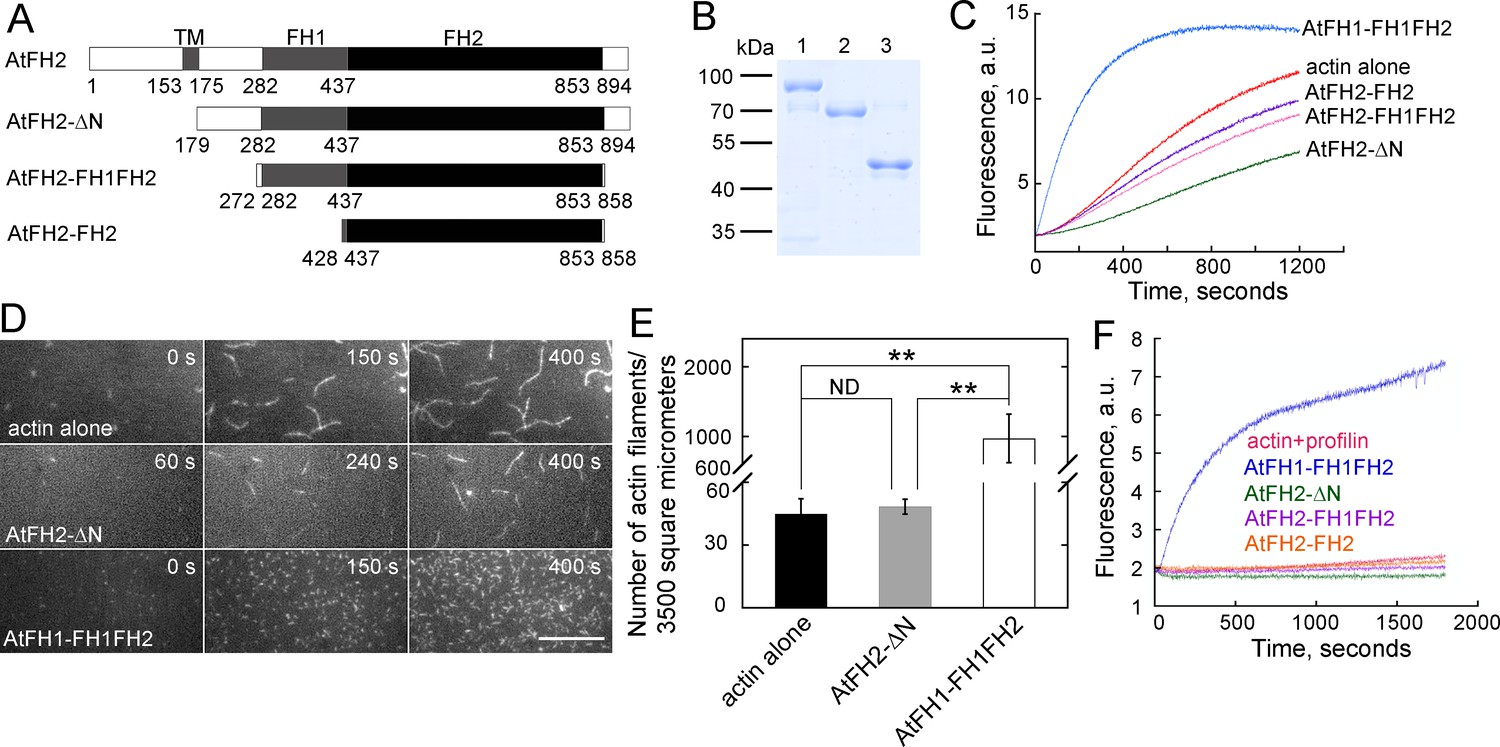
AtFH2 fails to nucleate actin assembly from actin or actin bound to profilin, and slightly inhibits spontaneous actin polymerization in vitro.
(A) Schematic representation of the domain organization of AtFH2 and the fragments used for the generation of recombinant truncated AtFH2 proteins. (B) Purified recombinant truncated AtFH2 proteins. The recombinant AtFH2 proteins were resolved on 10% SDS-PAGE and stained with Coomassie blue. Lane 1, AtFH2-ΔN; lane 2, AtFH2-FH1FH2; lane 3, AtFH2-FH2. (C) The effect of AtFH2 on spontaneous actin assembly from G-actin alone. Actin (10% pyrene-labeled, 3 μM) was incubated with recombinant formin proteins (1 μM) for 5 min at room temperature before the addition of 10 × KMEI to initiate actin polymerization, and actin polymerization was traced by monitoring the changes in pyrene fluorescence. (D) Time-lapse images of actin filaments in the absence or presence of formin proteins. [Actin], 1.5 μM (33.3% Oregon Green-labeled); [AtFH2-ΔN], 400 nM; [AtFH1-FH1FH2], 100 nM. Bar = 10 μm. (E) Quantification of the number of actin filaments per microscope field. Values represent mean ± SE, n = 3. **p<0.01 by Student’s t-test. (F) AtFH2 fails to utilize profilin-actin complexes. Actin (10% pyrene-labeled, 3 μM) plus human profilin I (3 μM) were incubated with recombinant formin proteins (1 μM) for 5 min at room temperature before the addition of 10 × KMEI to initiate actin polymerization, and actin polymerization was traced by monitoring the changes in pyrene fluorescence. AtFH1-FH1FH2 (Michelot et al., 2005) was used as the control in (C) and (F).
-
Figure 5—source data 1
Quantification of number of actin filaments plotted in Figure 5E.
- https://doi.org/10.7554/eLife.36316.049
Figure 6
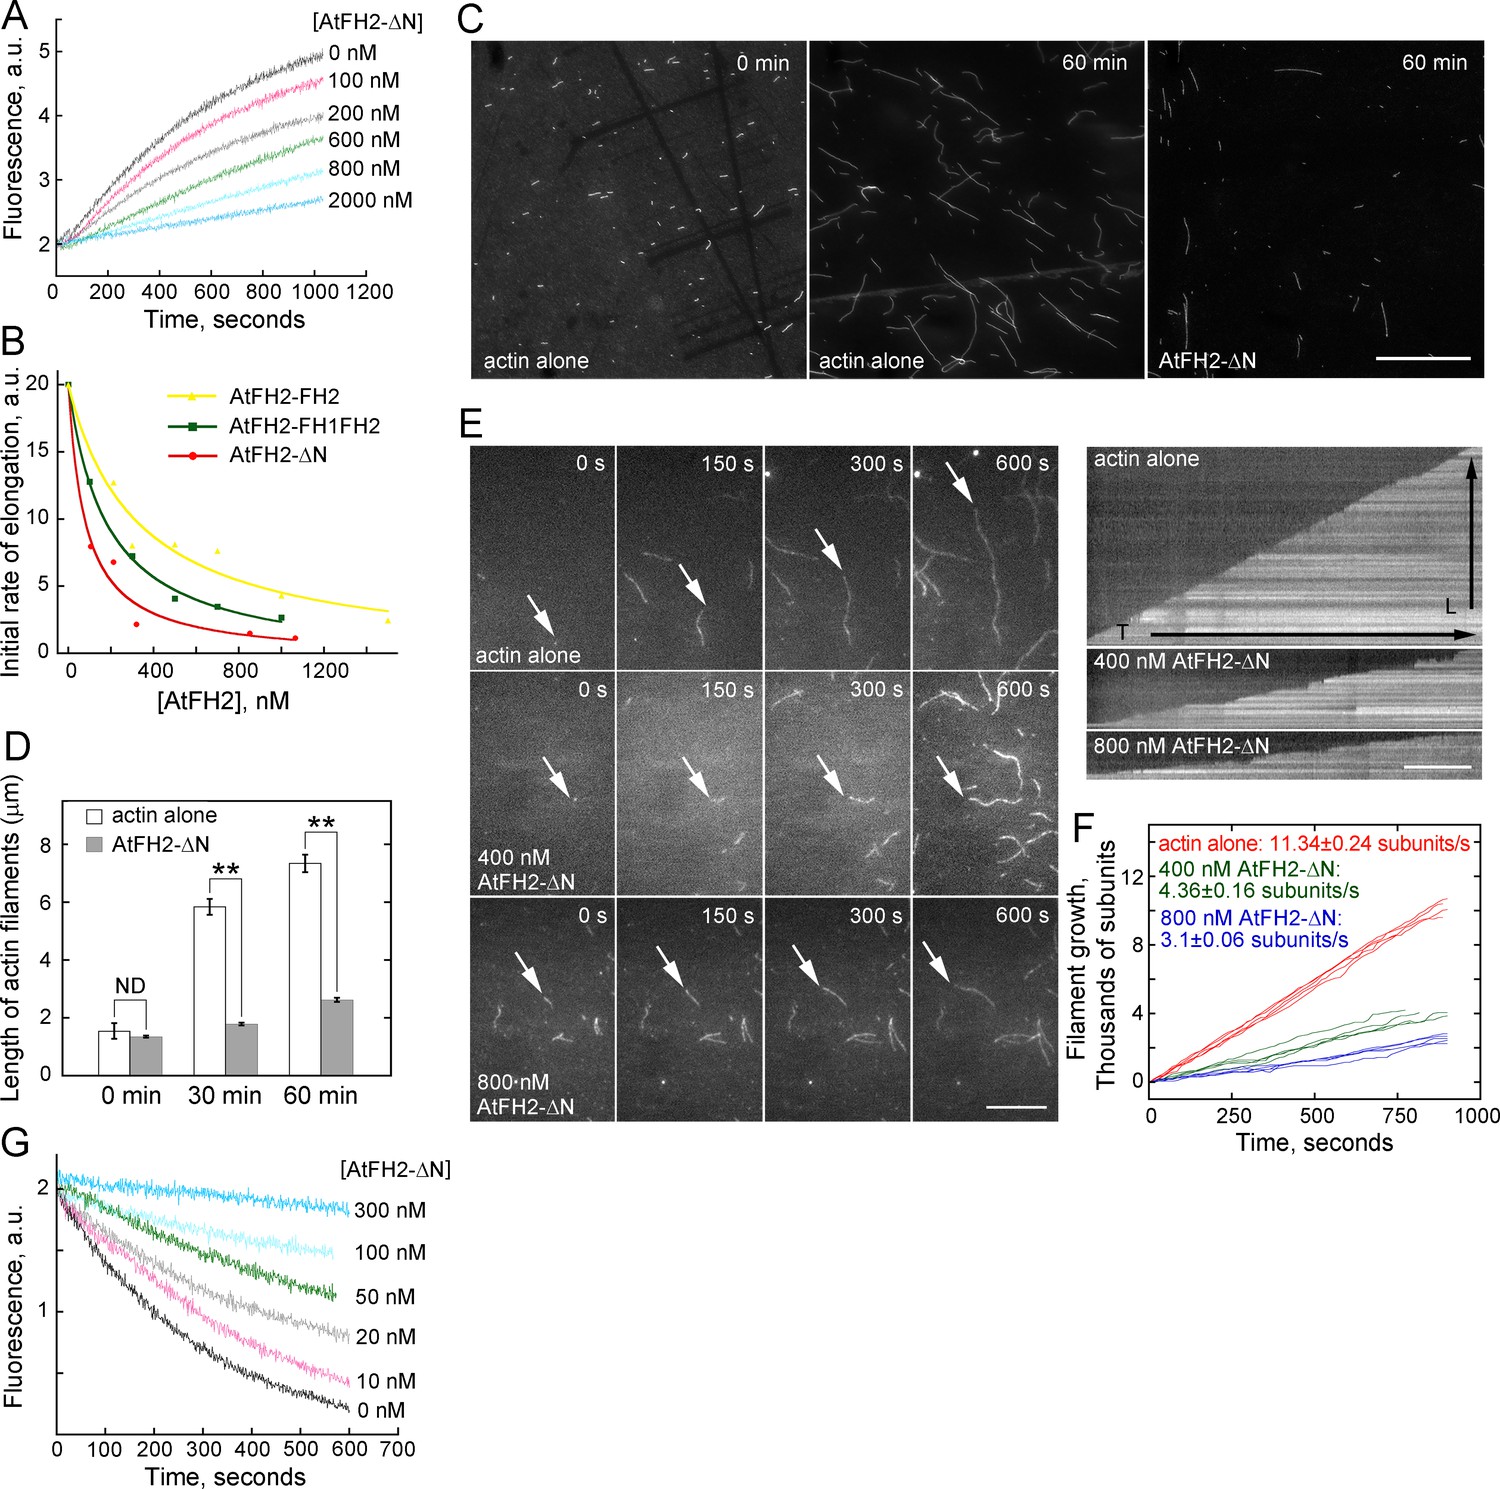
AtFH2 caps the barbed end of actin filaments and stabilizes them from dilution-mediated actin depolymerization.
(A) AtFH2-ΔN inhibits actin barbed end elongation in a dose-dependent manner. Pre-formed F-actin seeds (0.8 μM) were incubated with different concentrations of AtFH2-ΔN for 5 min at room temperature, and 1 μM G-actin (10% pyrene-labeled) saturated with 4 μM human profilin I was subsequently added to initiate actin elongation at the barbed end. (B) Determination of the dissociation constant (Kd) for the interaction between AtFH2 recombinant proteins and the barbed end of actin filaments. The initial rates of elongation were plotted versus the concentration of recombinant formin proteins (AtFH2-ΔN, AtFH2-FH1FH2 and AtFH2-FH2). The Kd values were calculated to be 80 nM, 183 nM and 329 nM for AtFH2-ΔN, AtFH2-FH1FH2 and AtFH2-FH2, respectively. (C) Micrographs of actin filaments before and after annealing. Preassembled actin filaments (4 μM) labeled with equimolar rhodamine-phalloidin were sheared with needles in the absence or presence of AtFH2-ΔN (2 μM). Bar = 10 μm. (D) Quantification of the length of actin filaments before and after annealing. The average length of actin filaments at 0 min, 30 min and 60 min was plotted; values represent mean ± SE, n ≥ 100. **p<0.01 by Student’s t-test. ND, no statistical difference. (E) Time-lapse images of actin filaments in the absence or presence of recombinant formin proteins (left panel). White arrows indicate the elongating end of actin filaments. The right panels are the kymograph analyses of growing actin filaments shown in the left panels. [Actin], 1.5 μM (33.3% Oregon Green-labeled); [AtFH2-ΔN], 400 nM; [AtFH1-FH1FH2], 400 nM. Bars = 10 μm. (F) Quantification of the elongation rates of actin filaments in the absence or presence of recombinant formin proteins. The average elongation rates (mean ± SE, n ≥ 20; subunits/s) of actin filaments are 11.34 ± 0.24, 4.36 ± 0.16 and 3.1 ± 0.06 for actin alone, actin +400 nM AtFH2-ΔN and actin +800 nM AtFH2-ΔN, respectively. (G) Plot of dilution-induced actin depolymerization curves. Various concentrations of AtFH2-ΔN were incubated with preformed actin filaments (5 μM, 50% pyrene-labelled) for 5 min at room temperature before being diluted 25-fold into Buffer G.
-
Figure 6—source data 1
Quantification of of the dissociation constant (Kd) of AtFH2 plotted in Figure 6B.
- https://doi.org/10.7554/eLife.36316.051
-
Figure 6—source data 2
Quantification of the length of actin filaments plotted in Figure 6D.
- https://doi.org/10.7554/eLife.36316.052
-
Figure 6—source data 3
Quantification of the elongation rates of actin filaments plotted in Figure 6F.
- https://doi.org/10.7554/eLife.36316.053
Figure 7
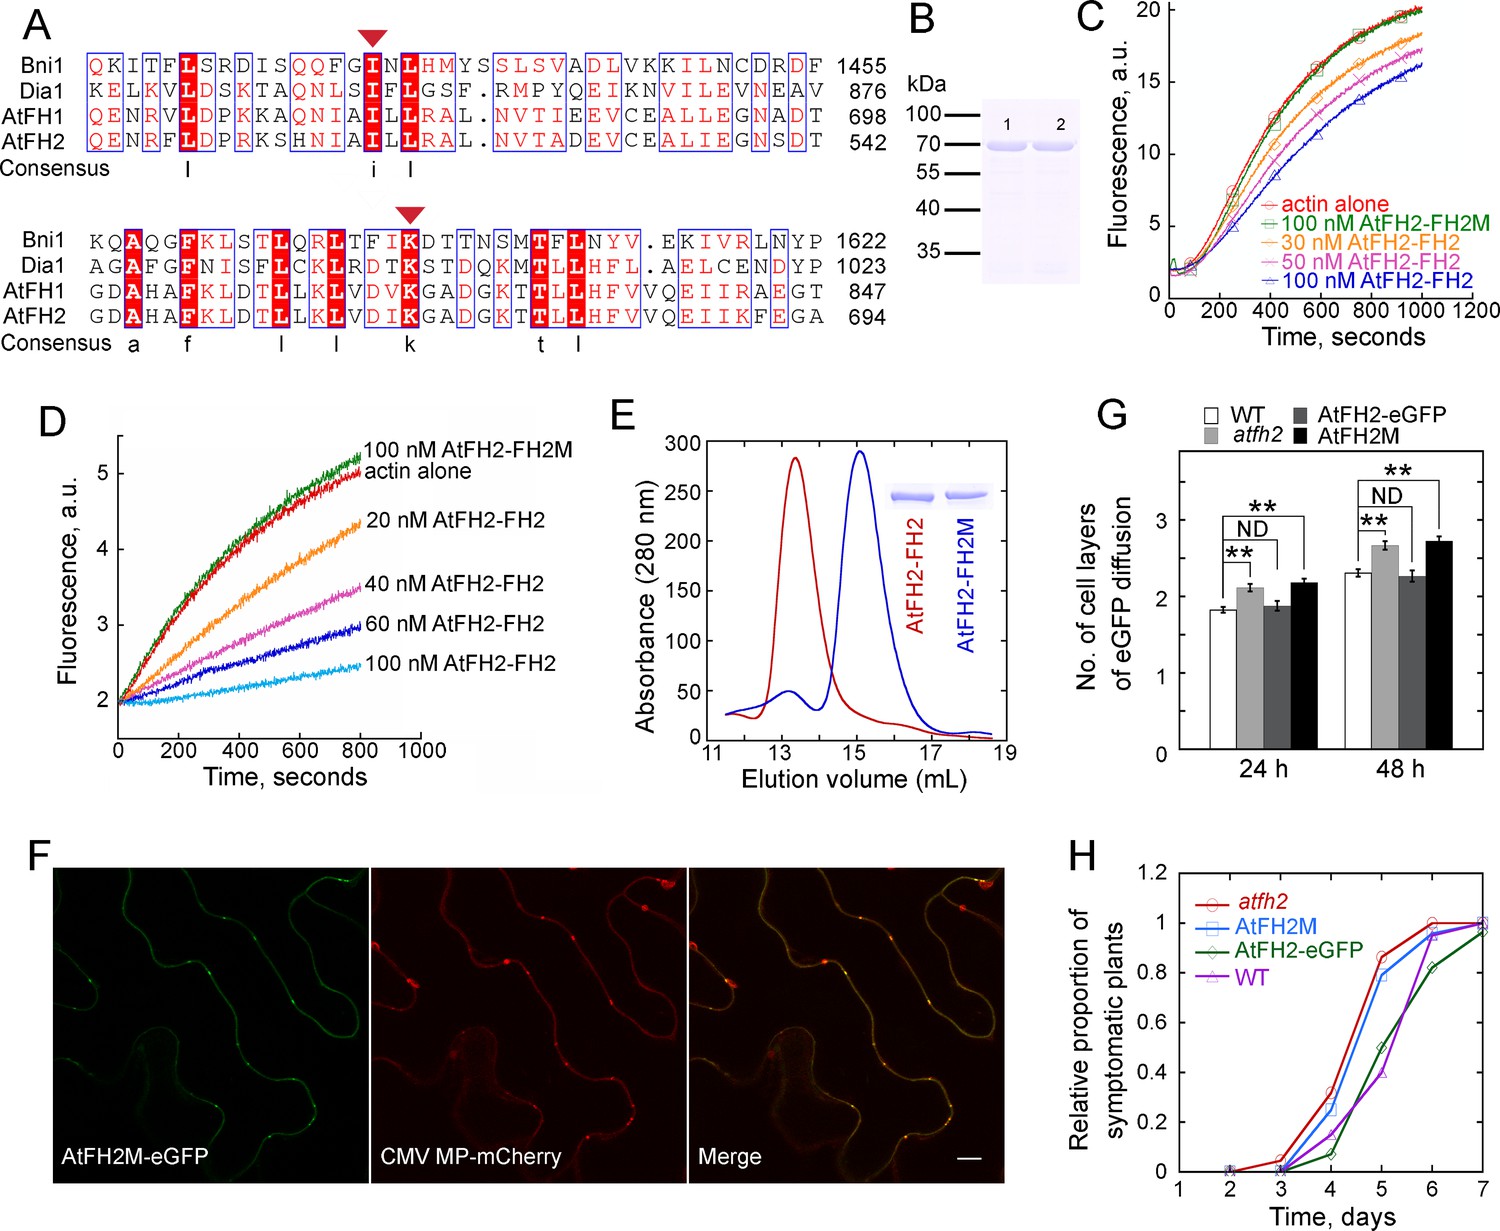
Interaction of AtFH2 with actin filaments is required for its function in regulating the permeability of PD.
(A) Protein sequence alignment of the FH2 domains in AtFH2 and three other well-characterized formins. Ile519 (I) and Lys672 (K) in AtFH2 (red triangles) correspond to Ile1431 and Lys1601 in Bni1p. These residues were previously shown to be important for the dimer formation and actin nucleation activity of Bni1p (Xu et al., 2004). S. cerevisiae Bni1p (Bni1), P41832; human diaphanous protein 1 (Dia1), O60610; AtFH1, Q9SE97. (B) SDS-PAGE analysis of recombinant AtFH2-FH2 and AtFH2-FH2M. Lane 1, GST-AtFH2-FH2; lane 2, GST-AtFH2-FH2M. (C) The effect of AtFH2-FH2 and AtFH2-FH2M on spontaneous actin assembly. The conditions for actin assembly are described in Figure 5C. (D) The effect of AtFH2-FH2 and AtFH2-FH2M on seeded actin elongation. The conditions for actin assembly are described in Figure 6A. (E) Elution volume of AtFH2-FH2 (red line) and AtFH2-FH2M (blue line) by size exclusion chromatography. To exclude the potential interference of GST in dimer formation, His-tag fusion proteins were generated. The inset shows SDS-PAGE analysis of 6His-AtFH2-FH2 and 6His-AtFH2-FH2M. The estimated molecular weight is about 100 kDa for AtFH2-FH2 and 50 kDa for AtFH2-FH2M. (F) Subcellular localization of AtFH2M-eGFP and CMV MP-mCherry in epidermal pavement cells of N. benthamiana leaves. Bar = 10 μm. (G) Quantification of eGFP diffusion cell layers in Arabidopsis leaf epidermal cells. AtFH2M represents AtFH2p:AtFH2M;atfh2, and AtFH2-eGFP represents AtFH2p:AtFH2-eGFP;atfh2. The number of diffusion cell layers at 24 hr and 48 hr was plotted. Error bars represent SE, n > 30, **p<0.01 by Mann-Whitney U test. ND, no statistical difference. The experiment was repeated at least three times. (H) Quantification of Fny-CMV infection rates in Arabidopsis plants. The number of symptomatic plants (with curly leaves) was counted at different days and the relative proportion of symptomatic plants was plotted.
-
Figure 7—source data 1
Quantification of eGFP diffusion plotted in Figure 7G.
- https://doi.org/10.7554/eLife.36316.055
-
Figure 7—source data 2
Quantification of Fny-CMV infection plants plotted in Figure 7H.
- https://doi.org/10.7554/eLife.36316.056
Tables
Key resources table
| Reagent type (species) or resource | Designation | Source or reference | Identifiers | Additional information |
|---|---|---|---|---|
| Gene (Arabidopsis thaliana) | AtFH1 | PMID: 14671023 | TAIR: At3g25500 | |
| Gene (Arabidopsis thaliana) | AtFH2 | this paper | TAIR: At2g43800 | |
| Gene (Arabidopsis thaliana) | AtFH4 | PMID: 16313636 | TAIR: At1g24150 | |
| Gene (Arabidopsis thaliana) | AtFH5 | PMID: 15765105 | TAIR: At5g54650 | |
| Gene (Arabidopsis thaliana) | AtFH6 | PMID: 15319477 | TAIR: At5g67470 | |
| Gene (Arabidopsis thaliana) | AtFH8 | PMID: 16313636 | TAIR: At1g70140 | |
| Gene (Arabidopsis thaliana) | AtFH9 | NA | TAIR: At5g48360 | |
| Gene (Arabidopsis thaliana) | AtFH10 | NA | TAIR: At3g07540 | |
| Gene (Arabidopsis thaliana) | AtFH11 | NA | TAIR: At3g05470 | |
| Gene (Oryza sativa) | OsFH8 | PMID: 15256004 | RAP-DB: Os03g0204100 | |
| Gene (Oryza sativa) | OsFH11 | PMID: 15256004 | RAP-DB: Os07g0545500 | |
| Gene (Oryza sativa) | OsFH15 | PMID: 15256004 | RAP-DB: Os09g0517600 | |
| Gene (Oryza sativa) | OsFH16 | PMID: 15256004 | RAP-DB: Os02g0739100 | |
| Genetic reagent (Arabidopsis thaliana) | atfh2-1 | this paper | GK_066D02 | |
| Genetic reagent (Arabidopsis thaliana) | atfh2-2 | this paper | GK_396H03 | |
| Genetic reagent (Arabidopsis thaliana) | atfh1-1 | PMID: 23202131 | Salk_032981 | |
| Genetic reagent (Arabidopsis thaliana) | atfh1-3 | this paper | Salk_143939 | |
| Strain, strain background (Escherichia coli) | DH5α | PMID: 6345791 | ||
| Strain, strain background (Agrobacterium tumefaciens) | GV3101 | other | widely distributed | |
| Strain, strain background (Escherichia coli) | Tuner (DE3) (pLysS) | other | Novagen, Schwalbach, Germany | |
| Transfected construct | pdGN (vector) | PMID: 16126836 | ||
| Transfected construct | pdGN-35S:HDEL- mCherry | this paper | vector-promoter: protein construct | |
| Transfected construct | pCambia1301 (vector) | other | GenBank: AF234297.1 | binary vector |
| Transfected construct | pBI101 (vector) | other | GenBank: U12639.1 | binary vector |
| Biological sample (Arabidopsis thaliana) | PDLP1pro:PDLP1- GFP | PMID: 18215111 | ||
| Biological sample (Arabidopsis thaliana) | PDCB1pro:YFP- PDCB1 | PMID: 19223515 | ||
| Biological sample (Arabidopsis thaliana) | AFH2p:AFH2- eGFP; atfh2 | this paper | promoter:eGFP fusion protein; atfh2-1 mutant background | |
| Biological sample (Arabidopsis thaliana) | AFH2p:AFH2- mCherry; atfh2 | this paper | promoter:eGFP fusion protein; atfh2-1 mutant background | |
| Biological sample (Arabidopsis thaliana) | 35S:AFH2- mCherry; Col-0 | this paper | promoter:eGFP fusion protein; Col-0 background | |
| Biological sample (Arabidopsis thaliana) | 35S:AtFH1(N)- eGFP; Col-0 | this paper | promoter:eGFP fusion protein; Col-0 background | |
| Biological sample (Arabidopsis thaliana) | 35S:AtFH4(N)- eGFP; Col-0 | this paper | promoter:eGFP fusion protein; Col-0 background | |
| Biological sample (Arabidopsis thaliana) | 35S:AtFH5-eGFP; Col-0 | this paper | promoter:eGFP fusion protein; Col-0 background | |
| Biological sample (Arabidopsis thaliana) | 35S:AtFH6(N)- eGFP; Col-0 | this paper | promoter:eGFP fusion protein; Col-0 background | |
| Biological sample (Arabidopsis thaliana) | 35S:AtFH8(N)- eGFP; Col-0 | this paper | promoter:eGFP fusion protein; Col-0 background | |
| Biological sample (Arabidopsis thaliana) | 35S:AtFH9(N)- eGFP; Col-0 | this paper | promoter:eGFP fusion protein; Col-0 background | |
| Biological sample (Arabidopsis thaliana) | 35S:AtFH10(N)- eGFP; Col-0 | this paper | promoter:eGFP fusion protein; Col-0 background | |
| Biological sample (Arabidopsis thaliana) | 35S:AtFH11(N)- eGFP; Col-0 | this paper | promoter:eGFP fusion protein; Col-0 background | |
| Biological sample (Arabidopsis thaliana) | 35S:GFP-ABD2; Col-0 | PMID: 15557099 | promoter:eGFP fusion protein; Col-0 background | |
| Biological sample (Arabidopsis thaliana) | AFH2p:AFH2M; atfh2 | this paper | promoter:recombinant protein; atfh2-1 background | |
| Recombinant DNA reagent | pGD-CMV MP-mCherry | PMID: 20435906 | ||
| Recombinant DNA reagent | pBI101-35S:AtFH2N175- eGFP-NOS | this paper | vector-promoter:protein construct | |
| Recombinant DNA reagent | pBI101- 35S:AtFH2N282- eGFP-NOS | this paper | vector-promoter:protein construct | |
| Recombinant DNA reagent | pBI101-35S: AtFH2N437-eGFP- NOS | this paper | vector-promoter:protein construct | |
| Recombinant DNA reagent | pBI101-35S: AtFH2N282-TMD- eGFP-NOS | this paper | vector-promoter:protein construct | |
| Recombinant DNA reagent | pBI101-35S: OsFH8(N)-eGFP- NOS | this paper | vector-promoter:protein construct | |
| Recombinant DNA reagent | pBI101-35S: OsFH11(N)-eGFP- NOS | this paper | vector-promoter:protein construct | |
| Recombinant DNA reagent | pBI101-35S: OsFH15(N)-eGFP- NOS | this paper | vector-promoter:protein construct | |
| Recombinant DNA reagent | pBI101-35S: OsFH16(N)-eGFP- NOS | this paper | vector-promoter:protein construct | |
| Recombinant DNA reagent | pCambia1301-35S: AtFH2M-eGFP- NOS | this paper | vector-promoter:protein construct | |
| Recombinant protein | AtFH1-FH1FH2 | PMID: 15994911 | Q9SE97 | |
| Recombinant protein | 6His-AtFH2-ΔN | this paper | ||
| Recombinant protein | 6His-AtFH2-FH1FH2 | this paper | ||
| Recombinant protein | 6His-AtFH2-FH2 | this paper | ||
| Recombinant protein | 6His-AtFH2-FH2M | this paper | ||
| Recombinant protein | GST-AtFH2-FH2 | this paper | ||
| Recombinant protein | GST-AtFH2-FH2M | this paper | ||
| Chemical compound, drug | latrunculin B | Calbiochem | 428020 | |
| Software, algorithm | ImageJ | https://imagej.nih.gov/ij/ | version 1.51 | |
| Software, algorithm | IBM SPSS Statistics | other | version 25 |
Additional files
-
Supplementary file 1
Primer form
- https://doi.org/10.7554/eLife.36316.057
-
Transparent reporting form
- https://doi.org/10.7554/eLife.36316.058
Download links
A two-part list of links to download the article, or parts of the article, in various formats.
Downloads (link to download the article as PDF)
Open citations (links to open the citations from this article in various online reference manager services)
Cite this article (links to download the citations from this article in formats compatible with various reference manager tools)
Arabidopsis formin 2 regulates cell-to-cell trafficking by capping and stabilizing actin filaments at plasmodesmata
eLife 7:e36316.
https://doi.org/10.7554/eLife.36316


