Background selection and biased gene conversion affect more than 95% of the human genome and bias demographic inferences
- University of Bern, Switzerland
- Swiss Institute of Bioinformatics, Switzerland
- University of Zurich, Switzerland
Figures
Figure 1 with 10 supplements
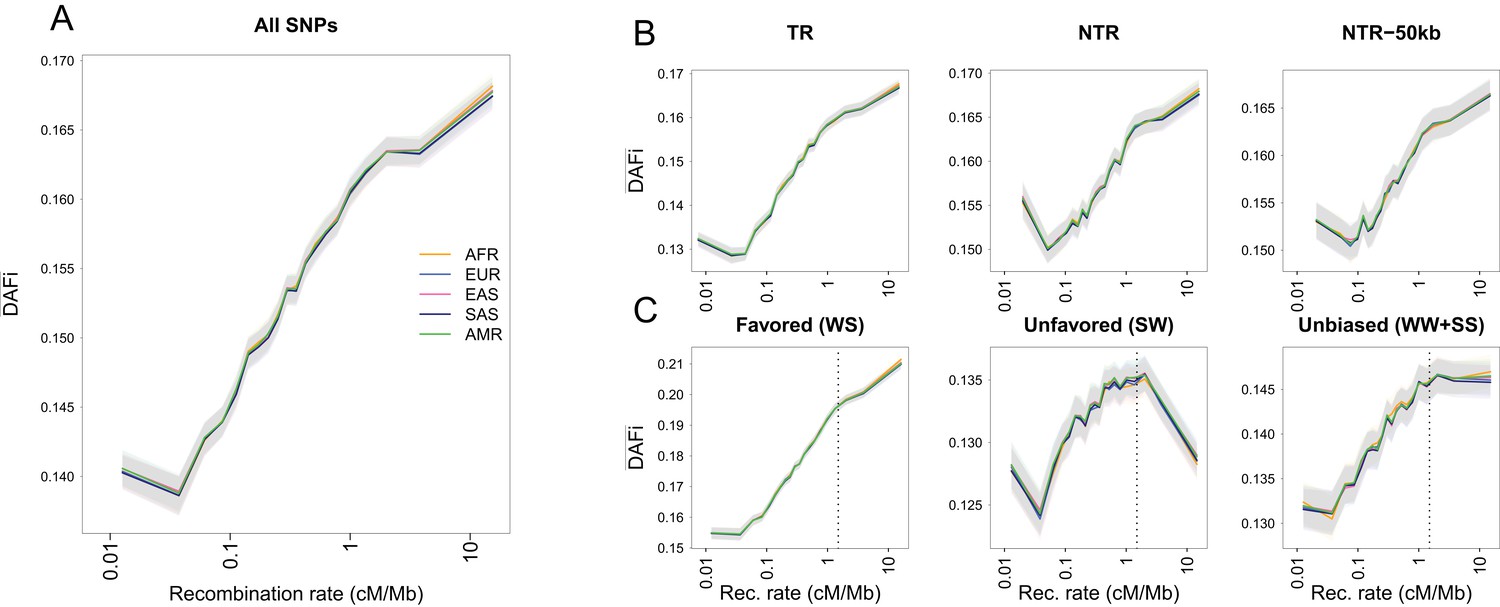
Average derived allele frequency per individual () as a function of recombination rate.
1000G SNPs were ranked by their local recombination rate and divided into 20 bins of equal size. was computed for each individual as the number of heterozygous sites plus two times the number of derived homozygous sites and averaged per geographic region. (A) vs. recombination rate on a log10 scale for all 17,129,351 1000G SNPs. (B) Same as panel A for SNPs in transcribed regions (TR), non-transcribed regions (NTR), or non-transcribed regions more than 50 kb away from TR (NTR-50kb). (C) Same as panel A for SNPs differently affected by GC-biased gene conversion (gBGC). Left: WS sites, where the derived allele is favored by gBGC. Center: SW sites, where the ancestral allele is favored by gBGC. Right: WW and SS sites, which are not affected by gBGC. The vertical dashed lines at 1.5 cM/Mb delimit an approximate threshold above which BGS has no effect on WW and SS sites, but where gBGC has a strong and opposite effect on WS and SW sites. Each group (AFR: Africans, EUR: Europeans, EAS: East-Asians, SAS: South Asians, AMR: Admixed Americans) includes individuals from two populations (see Supplementary file 1 - Table S1). Shaded areas delimit the 95% confidence interval of each group, estimated using a block-bootstrap approach (see Materials and methods).
Figure 1—figure supplement 1

Genealogy of a sample of two diploid individuals at an arbitrary locus.
It illustrates the fact that the expected number of derived mutations counted as the number of heterozygous sites plus two times the number of homozygous sites is the same for the two individuals assuming a constant mutation rate over the whole genealogy. Mutations accumulating over a single line of a given color will appear as heterozygous sites in a given individual, whereas mutations occurring along a double line of the same color will appear as homozygous. Since the orange path has the same length as the blue path, the expected number of mutations accumulated since the global MRCA of the sample will be identical in the two individuals. This argument generalizes to an arbitrary number of individuals, and this irrespective of the fact that these individuals belong to the same population or not, which includes the case where different populations have different demographic histories. The same argument thus holds for any locus and can thus be extended to a collection of loci with similar mutation rate. Differences in the number of derived alleles between individuals from different populations should thus reflect differences in mutation rates, selection intensity or generation time between populations.
Figure 1—figure supplement 2

Individual number of derived alleles (ni) for 1000G individuals.
Each panel compares the distributions of ni among five geographic regions, with 20 individuals per region. The distribution of ni is broadly similar among geographic regions for all categories of SNPs. (A) ni computed on 17,129,351SNPs. Asians (Eastern, EAS and Southern Asians, SAS) have a significantly lower mean ni than the other three regions (Tukey test, p<0.01). (B) ni computed on synonymous sites. SAS have a lower mean ni than AFR (Africans) (Tukey test, p=0.0004). C) ni computed on non-synonymous sites. SAS have a lower mean ni than AFR (Africans) (Tukey test, p=0.009). D) ni computed on a set of sites assumed to be evolving neutrally (see text and Figure 1). SAS have a significantly lower mean ni count than non-Asians (Tukey test, p=0.0000006). This difference remains in transcribed regions (E) where SAS have a lower mean ni count than AFR (p=0.00005) and EUR (Europeans, p=0.002) but disappears in neutrally evolving non-transcribed regions (F), which suggests that background selection could still be acting in transcribed regions with relatively large recombination in South Asian populations (SAS).
Figure 1—figure supplement 3
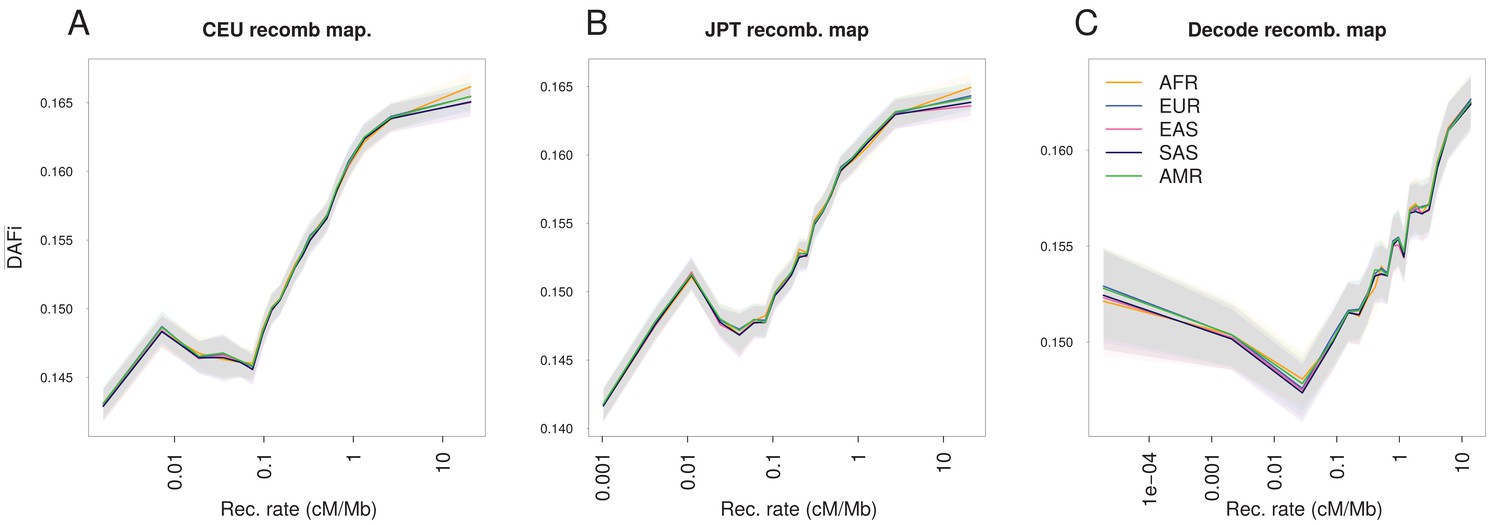
The increase of with recombination rate is robust to the choice of the recombination map.
Panels are analogous to Figure 1A, but based on different recombination maps. (A) LD-based HapMap recombination map derived from a European population (CEU, log-linear regression). (B) LD-based HapMap recombination map derived from a Japanese population (JPTC) Pedigree-based sex-averaged recombination map from deCODE (Kong et al., 2010; Wegmann et al., 2011). increases almost linearly with the logarithm of the recombination rate except for the lowest recombination class (<0.1 cM/Mb for all three maps), which could be due to the difficulty in estimating very low-recombination rates with both LD-based and pedigree-based methods. Both methods are likely to miss rare recombination events, such that the true recombination rate around some SNPs of the lowest recombination class could be higher than that reported. Shaded areas represent the 95% confidence interval of each group of individuals estimated using a block-bootstrap approach (see Materials and methods).
Figure 1—figure supplement 4
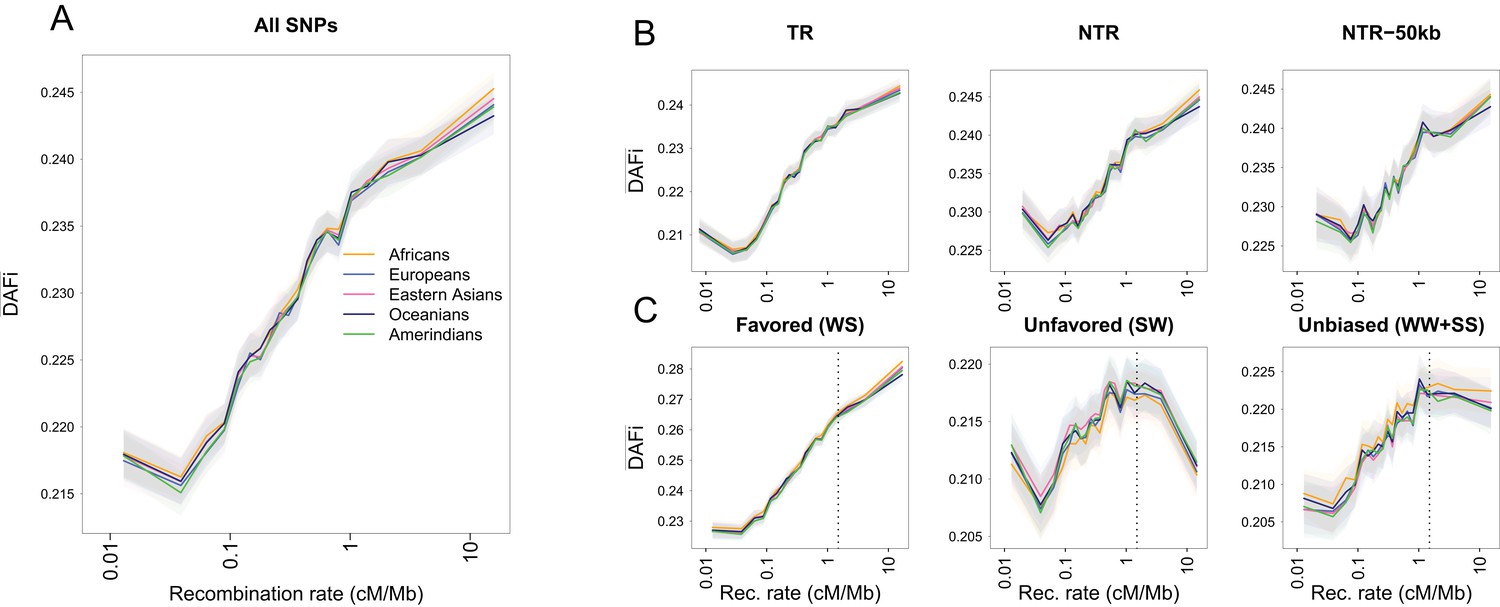
Same Figure and legend as Figure 1 but based on 20 SGDP individuals sequenced at high-coverage (Mallick et al., 2016).
Note that is larger than for 1000G (Figure 1). This is because this data sets has fewer rare alleles, as polymorphic sites are identified among 20 individuals only, as compared to 100 individuals for the SGDP data set. Shaded areas represent the 95% confidence interval of each group of individuals estimated using a block-bootstrap approach (see Materials and methods).
Figure 1—figure supplement 5

as a function of various genomic predictors for the 1000G dataset.
(A) as a function of recombination rate for random individuals from three different populations. The same filtering criteria were used as in Figure 1A. (B) as a function of the recombination distance to the nearest exon. Non-exonic SNPs in our 1000G dataset were classified according to their distance to the nearest exonic region in centiMorgans into 20 equal-size bins. Individuals are grouped by geographic region as in Figure 1A. The vertical dashed line denotes a distance 0.01 cM. C—E) as a function of recombination rate for mutations associated with different GERP RS conservation scores. (C) SNPs considered as neutral (–2≤GERP RS<2) (D) SNPs with slightly deleterious mutations (2≤GERP RS<4) (E) SNPs with deleterious mutations (GERP RS >4). (F) Relationship between the average B-statistic and for SNPs for which an estimate of B is available. Both statistics are computed in 20 bins defined as in Figure 1A. The solid lines link the 20 bins from the lowest to the highest recombination rate and the black arrow indicates the bin of SNPs with the lowest average recombination rates. In all panels, shaded areas represent the 95% confidence interval estimated using a block-bootstrap approach (see Materials and methods).
Figure 1—figure supplement 6
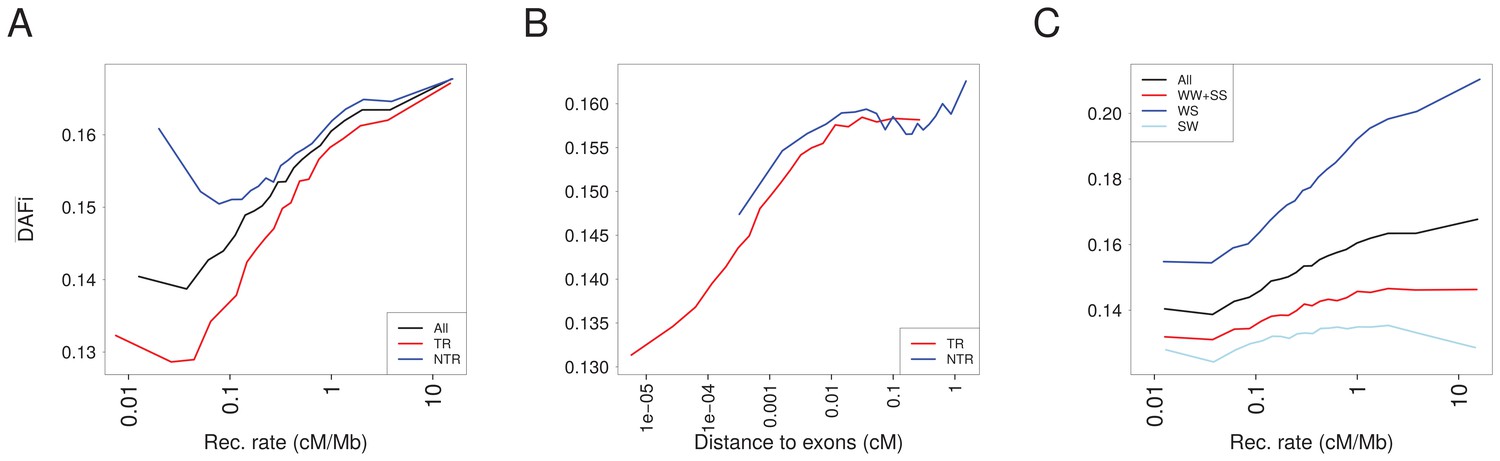
in 1000G populations as a function of recombination rate for various sites.
(A) in transcribed regions (TR, red) and in non-transcribed regions (NTR, blue) are compared to computed over all sites (all, black). converges to the same values for both TR and NTR for high-recombination rates where BGS does not act. (B) for TR and NTR regions increases with recombination distance to exons. In the interval between ~0.001 and~0.1 cM where SNP can be either in TR or NTR regions, s are similar for TR and NTR. (C) Comparison between computed for three gBGC categories of sites. In regions of high-recombination rate, S alleles are favored by gBGC, such that for WS sites increases, and for SW sites decreases with recombination. As expected, values diverge for different gBGC sites in genomic regions with high-recombination rate.
Figure 1—figure supplement 7
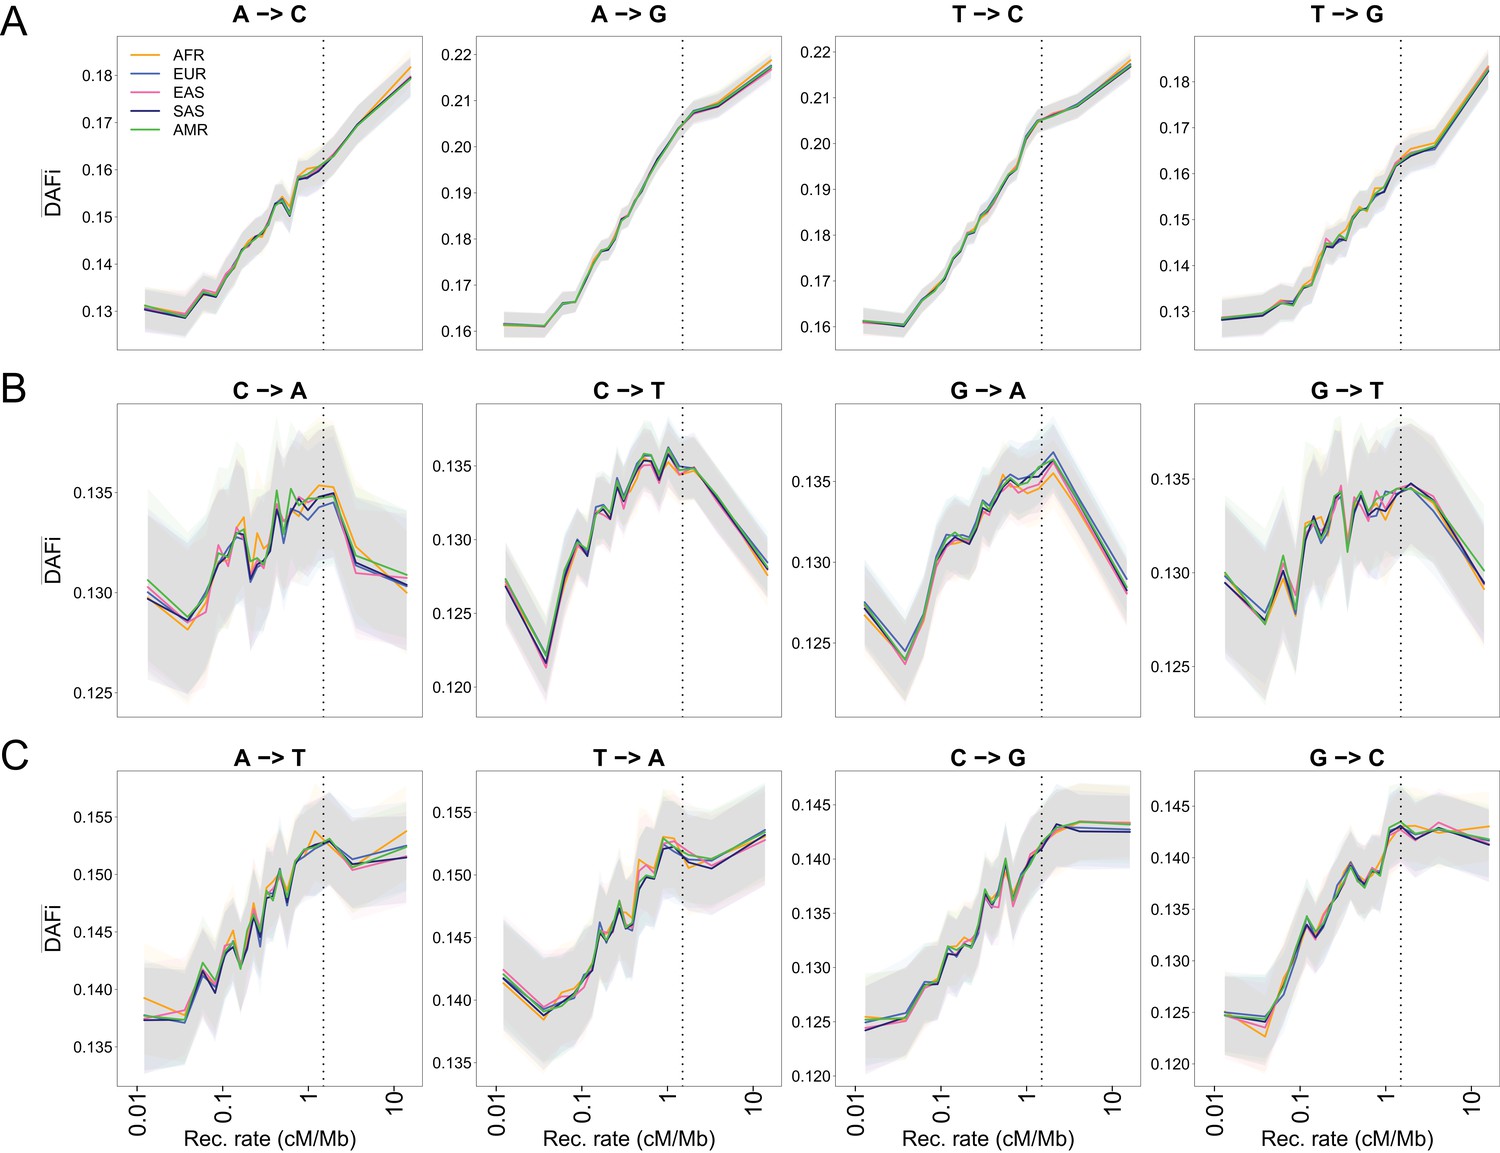
as a function of recombination rate for different mutation types in 1000G individuals.
The figure is a decomposition of Figure 1C for all possible substitutions. (A) WS mutations. (B) SW mutations. (C) WW and SS mutations. Note that WW and SS sites should only be affected by BGS and not by gBGC. Dashed vertical lines show the approximate limit of the influence of BGS (1.5 cM/Mb), above which reaches a plateau for sites unaffected by gBGC. Shaded areas correspond to 95% CI obtained by a block-bootstrap approach (see Materials and methods).
Figure 1—figure supplement 8
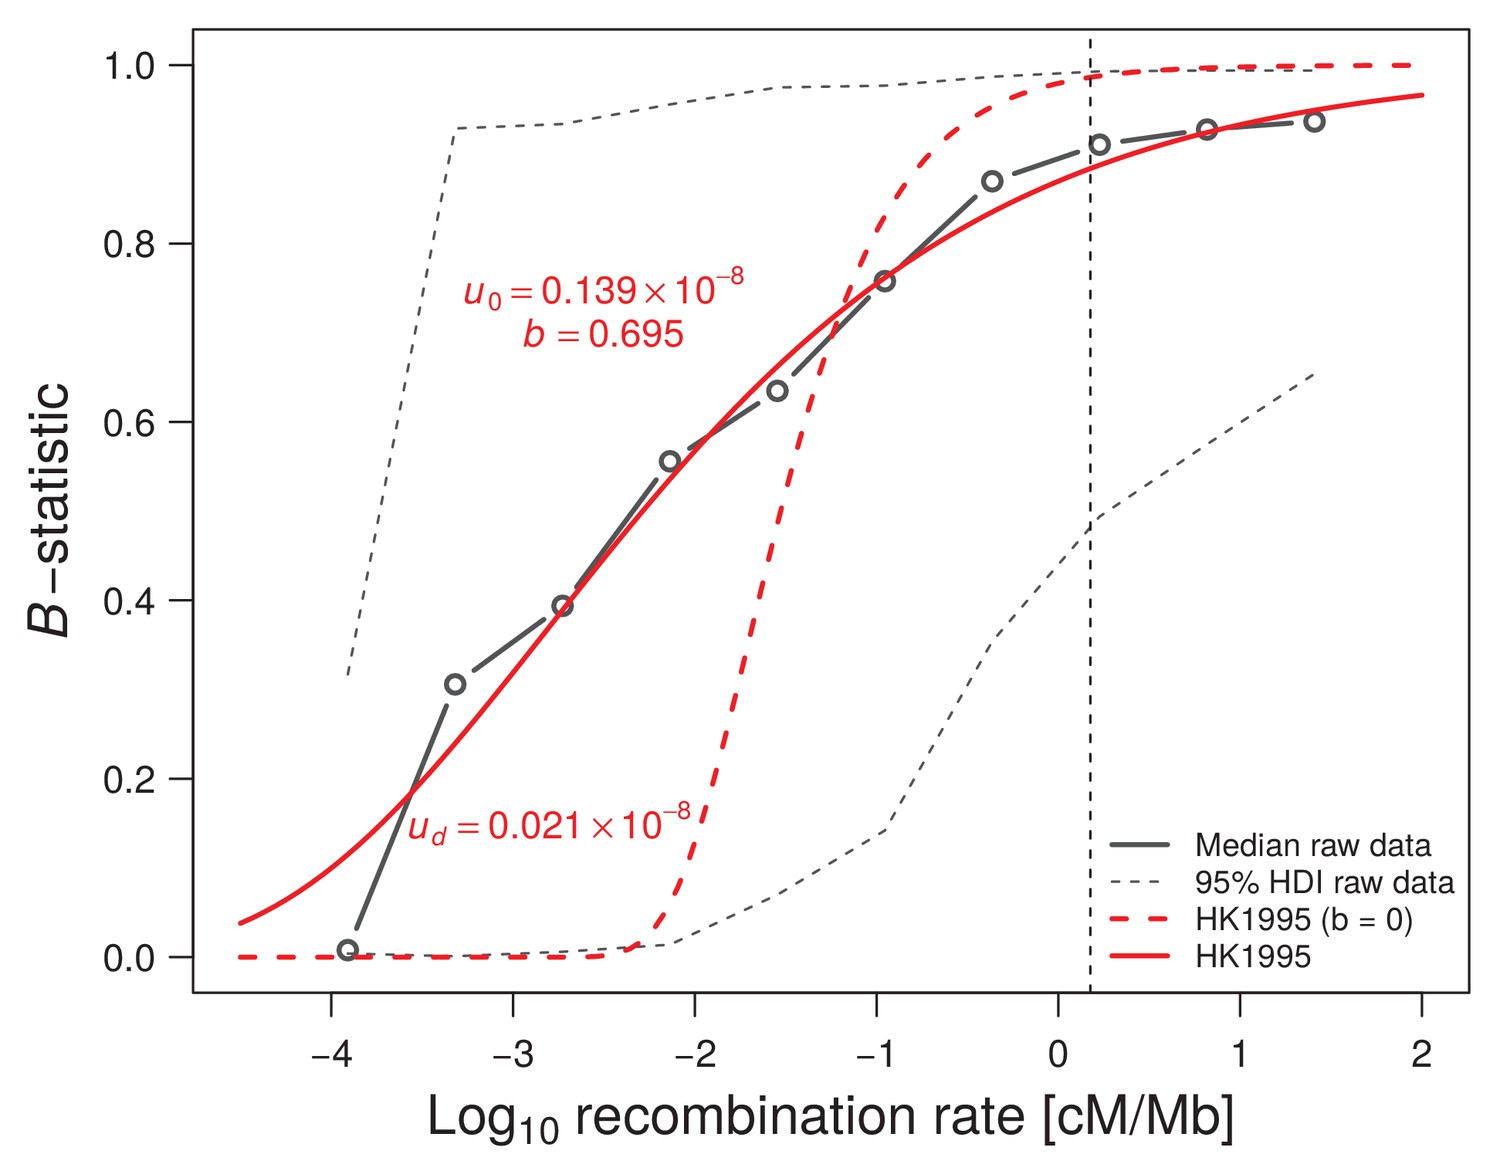
Influence of recombination on diversity (B-statistic).
McVicker et al. (2009) median B-statistics are reported as a function of recombination rate (solid black line). The observed data is fitted either under Hudson and Kaplan (1995) simple model of background selection (BGS) with , where is the genome-wide constant deleterious mutation rate, and r is the recombination rate in cM/Mb (red dashed line), or by allowing a log-log linear dependence of the deleterious mutation rate on the recombination rate as (solid red line). The existence of a correlation between mutation and recombination considerably improves the fit to the B-statistics and thus better explains the signature of background selection (BGS) in the human genome. The vertical black dashed line indicates the recombination rate of 1.5 cM/Mb that we used as an approximate threshold to define our set of neutrally evolving SNPs in the remainder of the study. Note that this threshold also marks the beginning of a plateau for the observed B-statistics.
Figure 1—figure supplement 9

of WW + SS sites with RR ≥1.5 cM/Mb from the 1000G data set as a function of various covariates.
(A) recombination rate, (B) B statistic, (C) recombination distance to hotspots that are defined as having RR >10 cM/Mb, (D) distance to PhastCons conserved elements and (E) distance to exons. is positively correlated with the distance to conserved elements and to a smaller extent to B and the distance to exons, whereas it is negatively correlated to the distance to hotspots which suggest that BGS continues to play a marginal role on . SNPs were divided into 20 bins of equal size. Shaded areas correspond to 95% CI obtained by a block-bootstrap approach (see Materials and methods).
Figure 1—figure supplement 10
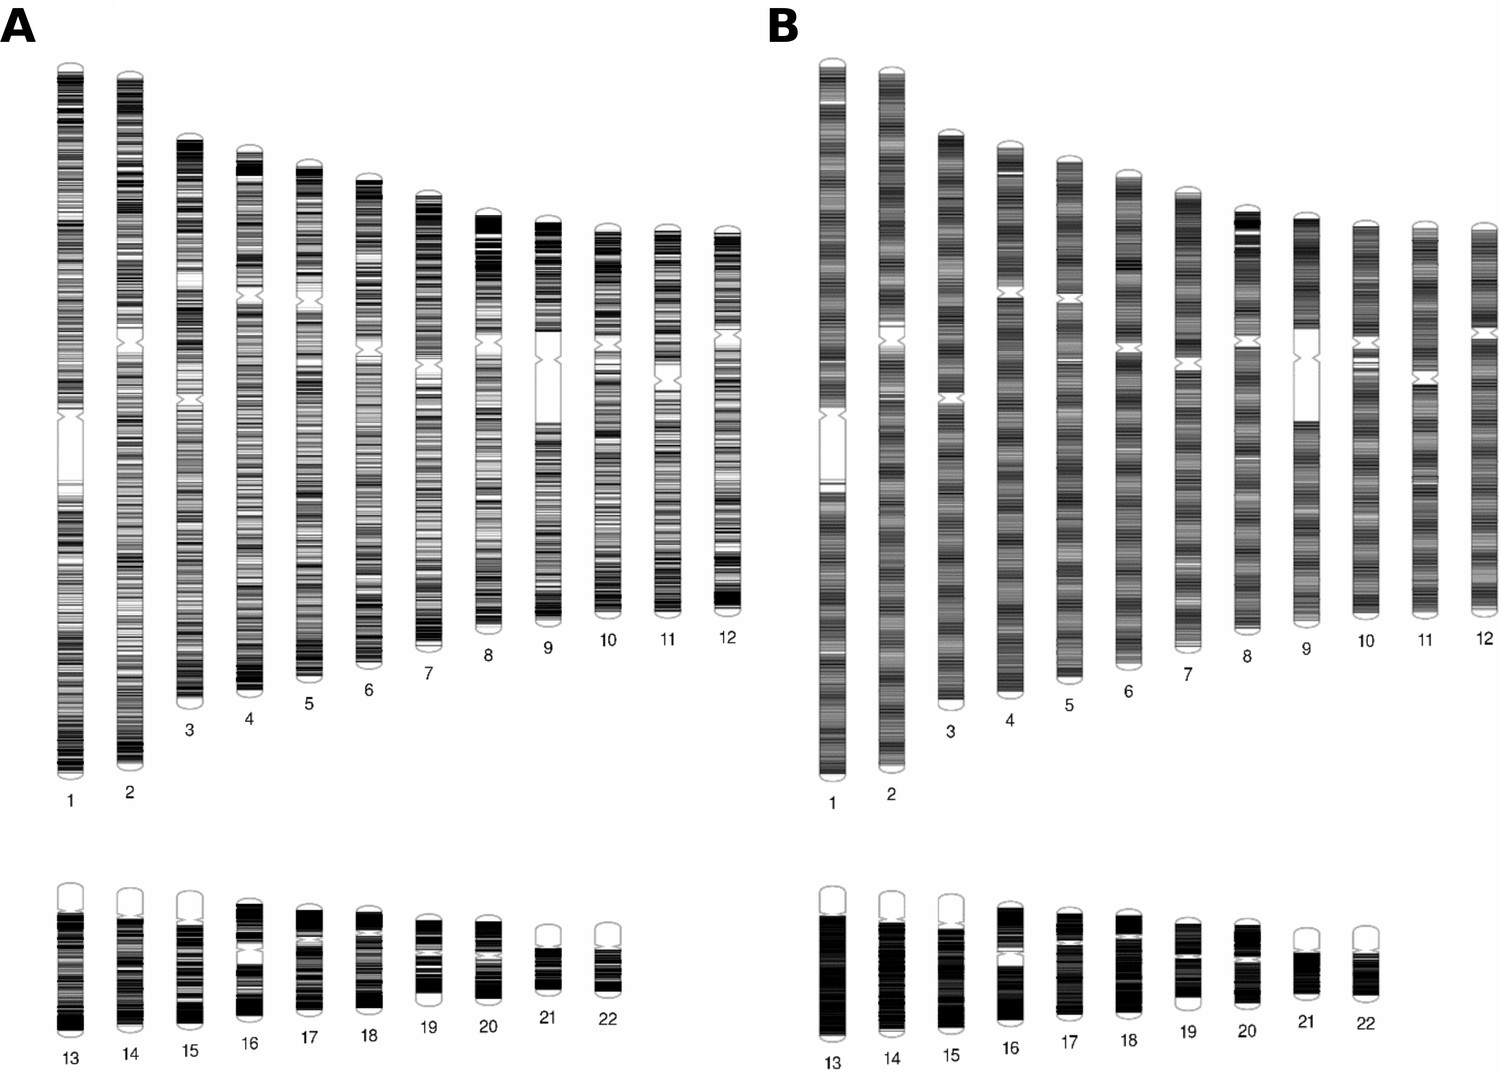
Genomic distribution of SNPs.
https://doi.org/10.7554/eLife.36317.013
Figure 2 with 4 supplements
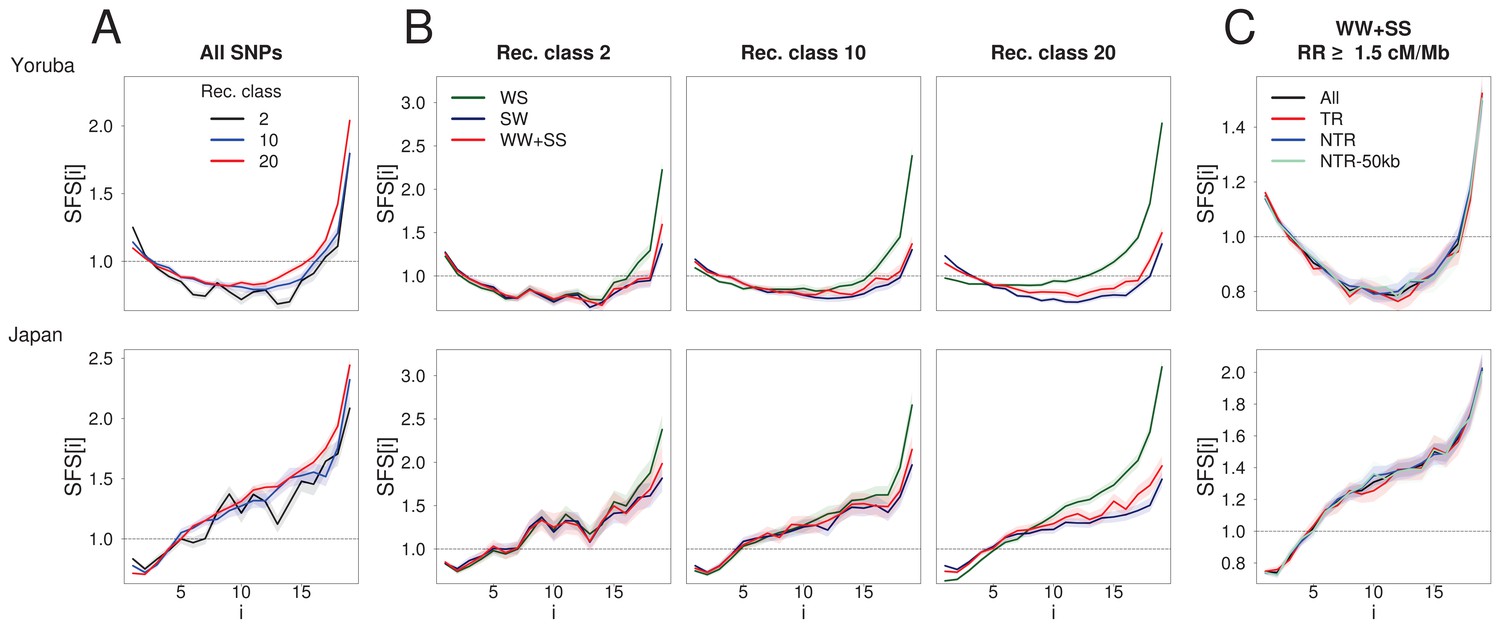
BGS and gBGC both have an impact on the SFS.
Each panel corresponds to the normalized unfolded SFS of Yoruba (top, YRI) and Japanese (bottom, JPT) populations. (A) SFS computed for all SNPs in the 2nd, 10th and 20th recombination classes (as defined in Figure 1). For each panel, pairwise comparisons of the SFS are significant with p-values<10–3 (see Materials and methods). The SFS for all ten 1000G populations are shown in Figure 2—figure supplement 1. (B) SFS for three gBGC mutation categories computed for three recombination classes. Note that WW and SS sites (in red) are unaffected by gBGC. All SFS are different from each other (site permutation test, p-values<10–3) except for the Yoruba recombination class two between WS and WWSS where p=0.0135. (C) SFS for sites unaffected by BGS and gBGC (WW + SS sites with RR ≥1.5 cM/Mb). The four SFSs are not significantly different from each other at the 1% significance level, as revealed by a permutation approach (see Materials and methods). Shaded areas delimit 95% confidence intervals using a block-bootstrap strategy (see Materials and methods).
Figure 2—figure supplement 1

SFS of ten 1000G populations for sites belonging to three recombination classes.
Recombination classes 2 (low), 10 (medium), and 20 (high) correspond to the respective recombination bins as defined in the main text. (A) Normalized unfolded SFS, (B) unfolded SFS. Low-recombination classes show increased singleton frequencies and a lower proportion of intermediate- and high-frequency variants. For each panel, pairwise comparisons of the SFS are significant with p-values<10–3 (see Materials and methods). Shaded areas correspond to 95% CI obtained by a block-bootstrap approach (see Materials and methods).
Figure 2—figure supplement 2

(A) Normalized unfolded SFS of ten 1000G populations for sites belonging to three recombination classes in NTR regions more than 50 kb away from transcribed regions (NTR-50kb sites).
(B) Zoom on singletons and doubletons categories. The singletons show a significantly increased frequency in the low-recombination class, in keeping with the action of BGS in non-coding regions. For each panel, pairwise comparisons of the three SFS are significant with p-values<10–3 (see Materials and methods). Shaded areas (panel A) and segments (panel B) correspond to 95% CI obtained by a block-bootstrap approach (see Materials and methods).
Figure 2—figure supplement 3

Impact of covariates on the normalized unfolded SFS for WW + SS sites with RR ≥ 1.5 cM/Mb (in red) on Yoruba (top) and Japan (bottom) population.
(A) Recombination distance to hotspots (i.e. RR > 10 cM/Mb). SFS of sites belonging to the first (d ≤ 0.01647 cM, in green) and fourth quartile (d ≥ 0.08728 cM, in blue) are significantly different from the SFS computed on all SNPs (p=0.017 and p=0.005 respectively for Yoruba, p<10−3 for Japan, see Materials and methods). (B) Recombination distance to PhastCons conserved elements (see Materials and methods for definition). SFS of sites belonging to the first (d ≤ 0.0000543 cM, in green) and fourth quartile (d ≥ 0.0024580 cM, in blue) are significantly different from the SFS computed all SNPs (p<10−3 for all but the 4th quartile of Yoruba population for which p=0.003). (C) The SFS of exonic sites (green) are significantly different from that computed on all SNPs (p=0.004 and p<10−3 for Yoruba and Japan resp.) while the SFS of non-exonic sites (blue) are not different from the SFS of all SNPs (p=1). The SNPs furthest to hotspots have both an enrichment for singletons and high-frequent variants, whereas the SNPs closest to conserved elements and exonic sites have only an enrichment for singletons. Shaded areas correspond to 95% CI obtained by a block-bootstrap approach (see Materials and methods).
Figure 2—figure supplement 4
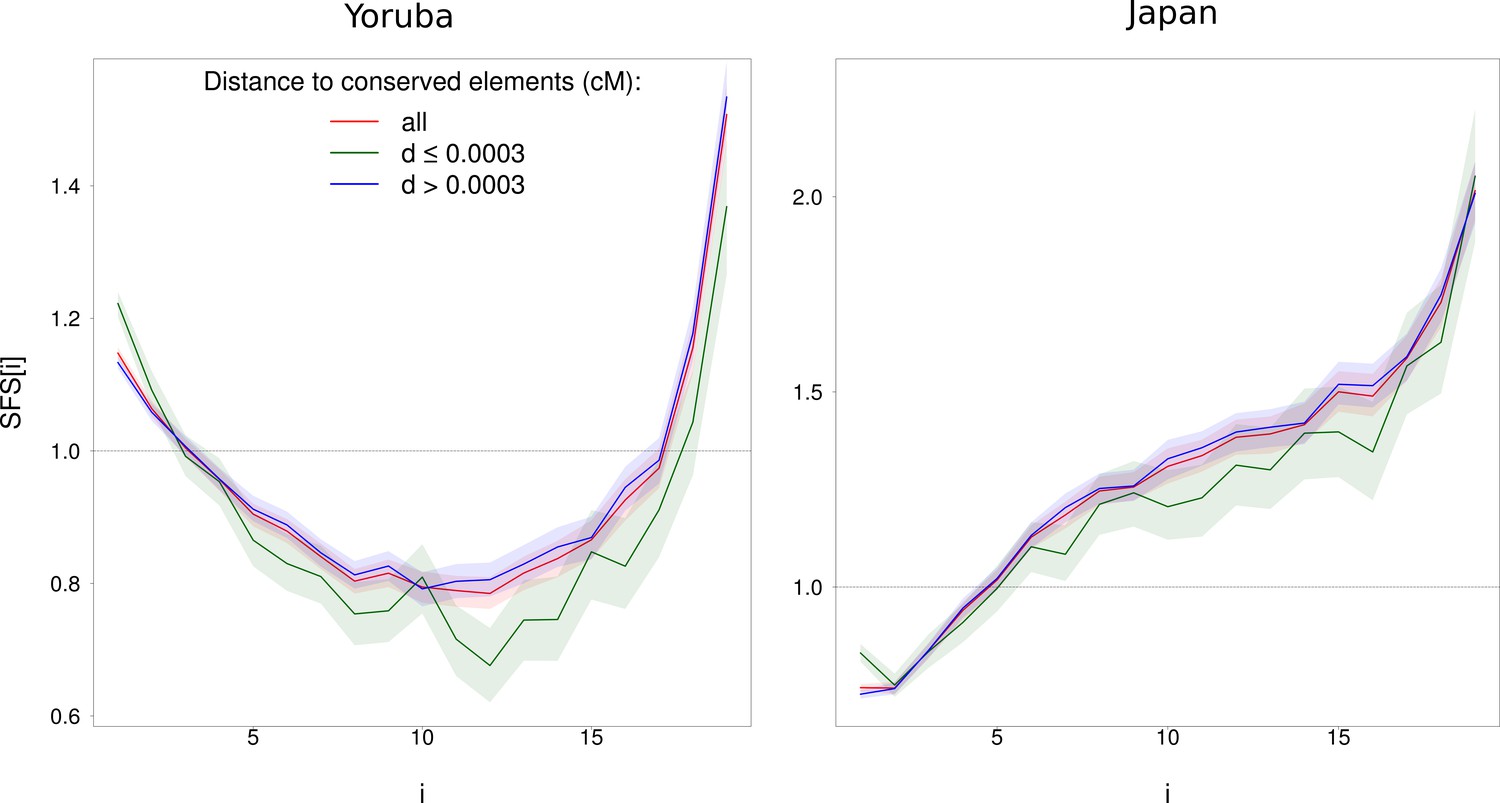
Impact of physical distance to phastCons conserved elements on the normalized SFS for WW + SS sites with RR ≥ 1.5 cM/Mb (in red) on Yoruba (left) and Japan (right) populations.
Sites that are less (resp. more) than 0.0003 cM from conserved elements are in green (resp. in blue). phastCons elements are defined in the Materials and methods section. The SFS of sites with d > 0.0003 cM is not different from all sites for both populations while the SFS of sites with d ≤ 0.0003 cM is (p<10−3). Shaded areas correspond to 95% CI obtained by a block-bootstrap approach (see Materials and methods).
Figure 3 with 3 supplements
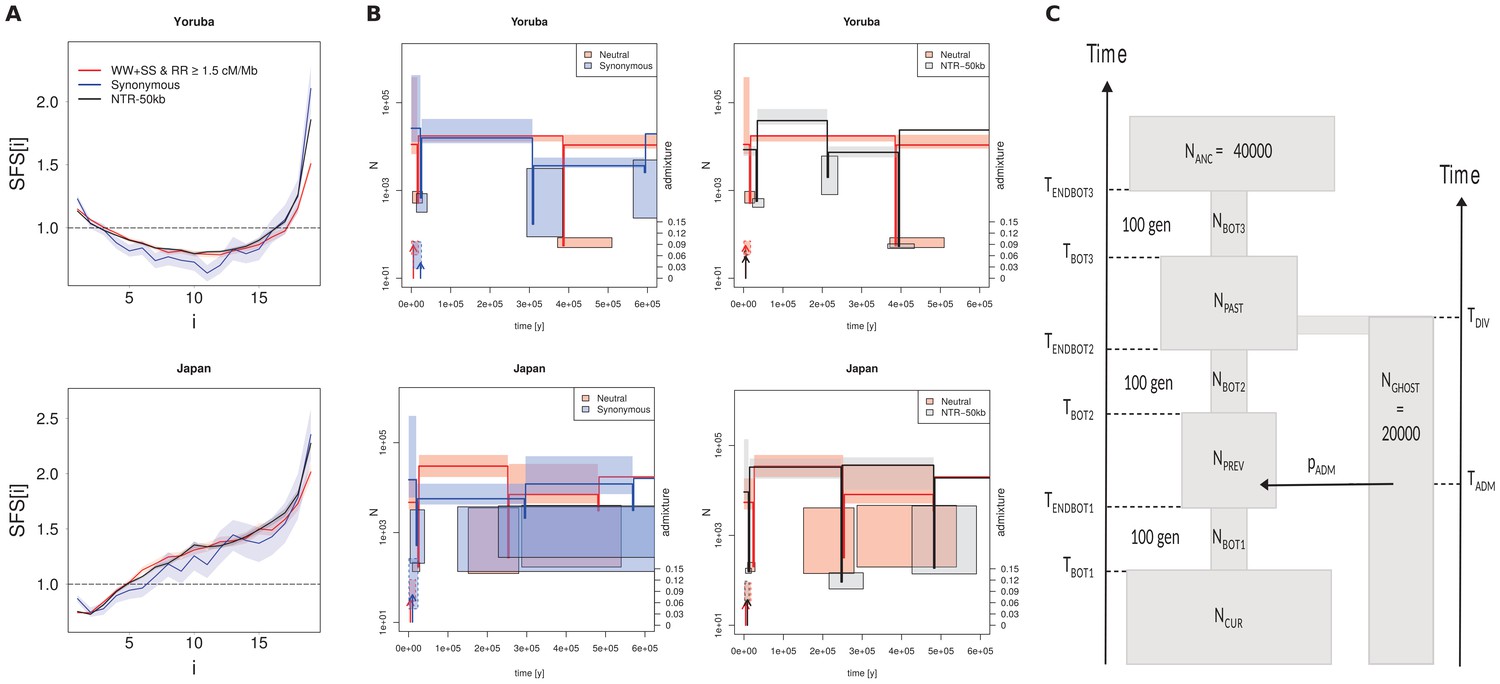
Recent demography inferred from three different datasets in the Yoruba and Japan 1000G populations.
(A) Observed SFS computed on the three datasets. Neutral: neutral SFS computed on WW +SS sites in regions with recombination rate (RR) ≥1.5 cM/Mb; Synonymous: synonymous SFS; NTR-50kb: SFS computed on sites in non-transcribed regions more than 50 kb away from any transcribed region. Synonymous and NTR-50kb SFS are significantly different from neutral SFS with p-values<10−3. (B) Comparison of inferred demographic events in the last 600,000 years under the model shown in panel C. Left and right panels compare neutral estimations to those of different datasets. All parameter values are given in Supplementary file 3 - Table S3. Solid lines represent maximum-likelihood (ML) estimates of population sizes and bottleneck times. Vertical arrows indicate ML estimates of admixture times; their height is proportional to the admixture estimates shown on the right axis. Boxes delimit 99% confidence intervals obtained by a block-bootstrap approach (see Materials and methods). Boxes surrounded by a solid line are for bottleneck parameters (size and time), open boxes are for population size between bottleneck events, and boxes surrounded by a dashed line are for admixture rates and times. Note that bottlenecks have been modeled with a fixed duration of 100 generations, and the width of the boxes denotes the range covered by 99% of the bootstrap estimations. (C) Sketch of the demographic model used for SFS-based demographic inferences. The model includes three possible bottlenecks of a fixed duration of 100 generations in the direct ancestry of the sampled population, and it allows some sampled genes (a fraction pADM) to have ancestors coming from an unsampled (ghost) population at any time (TADM) since its divergence from the sampled population TDIV generations ago. Note that in this model, NANC and NGHOST have been arbitrarily fixed to 40,000 and 20,000 (haploid sizes), respectively. Note also that the ghost population is used here to allow for some gene flow from some unspecified source, and so to account for the non-isolated nature of human populations.
Figure 3—figure supplement 1
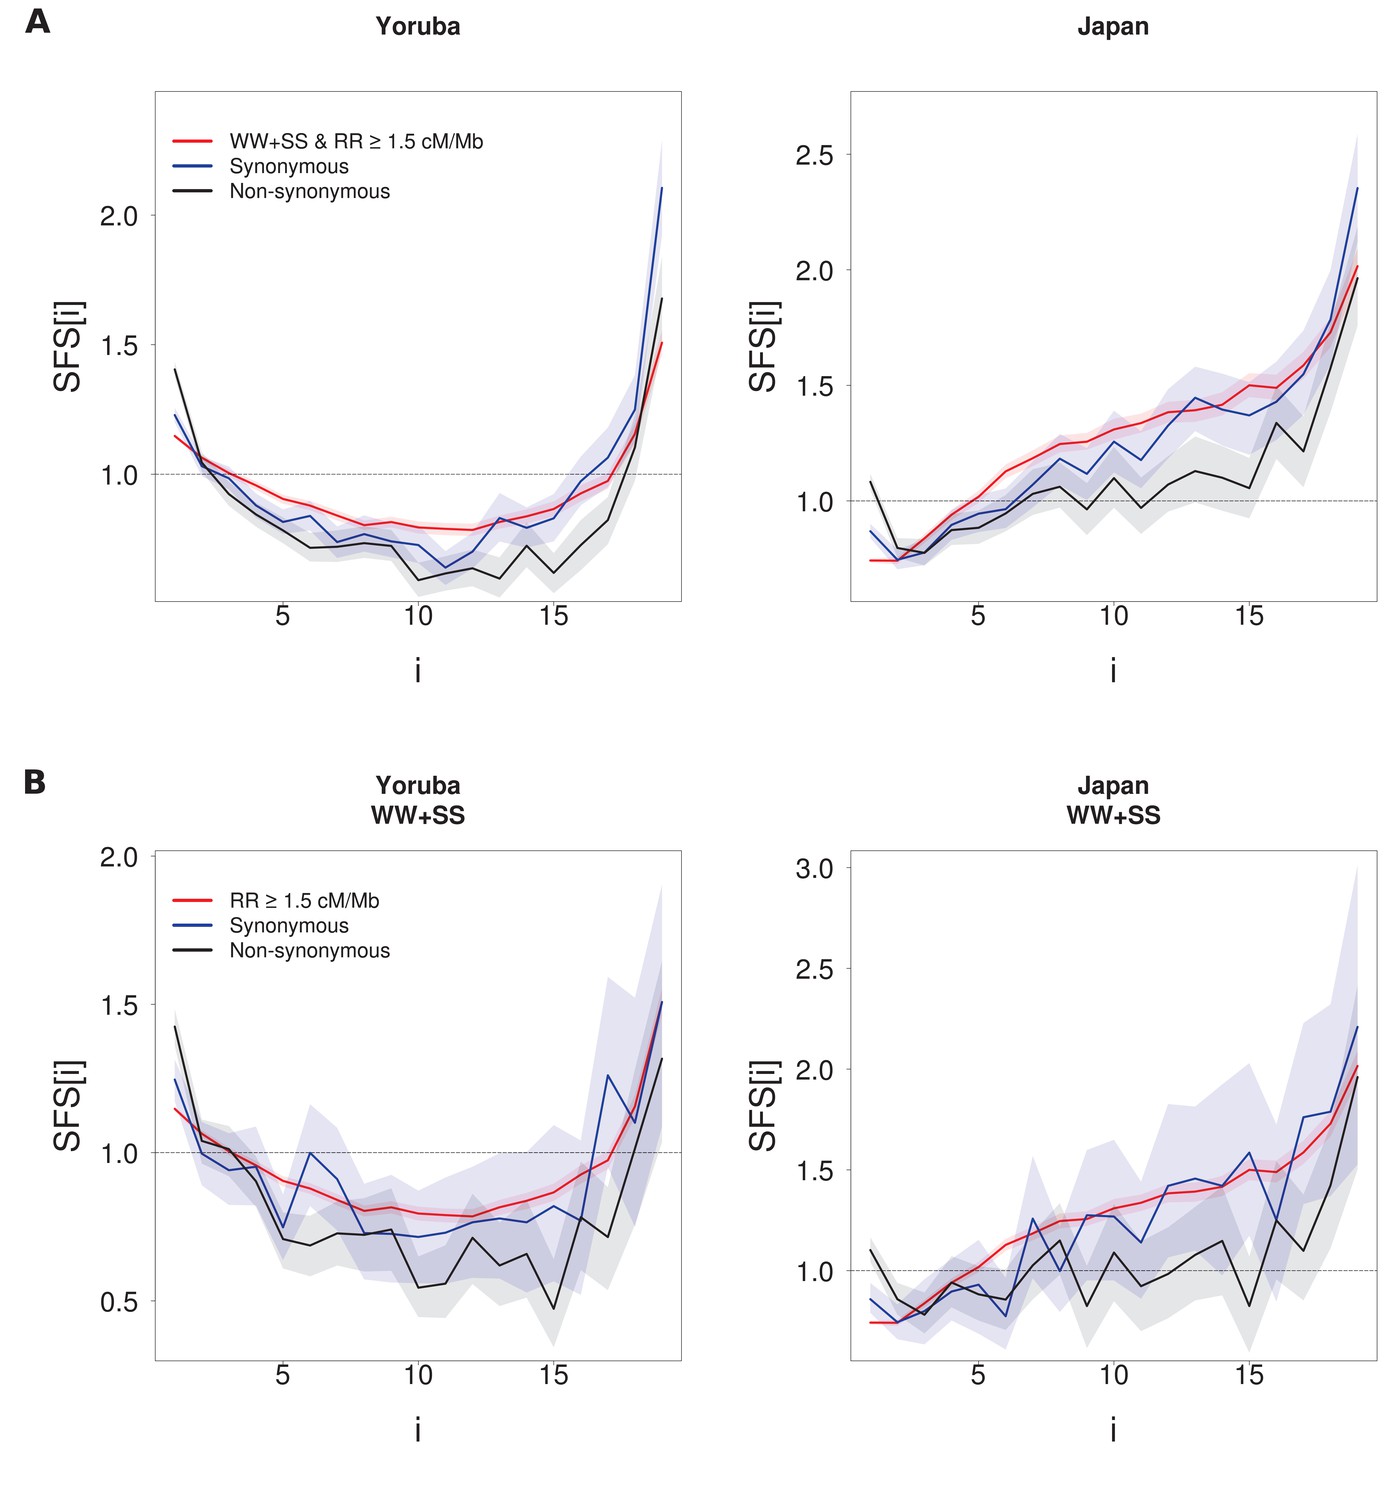
Comparison of the unfolded SFS computed for synonymous, non-synonymous and ‘neutral’ sites (SS + WW sites with RR ≥ 1.5 cM/Mb) (A).
(B) Same as A), but with SW and WS sites removed from the synonymous and non-synonymous SFS. For each panel, SFS of synonymous or non-synonymous sites differ significantly from the neutral SFS with p-values<10–3 (see Materials and methods) except for the Japan population in panel B) where p=0.002 between neutral and synonymous sites. Shaded areas correspond to 95% CI intervals obtained by a block-bootstrap approach (see Materials and methods).
Figure 3—figure supplement 2

Observed and fitted SFS for the Yoruba and the Japanese samples under the demographic model shown in Fig.
Figure 3C for five sets of SNPs. The ‘Neutral’ set of SNPs corresponds to WW + SS sites in regions with a recombination rate above 1.5 cM/Mb.
Figure 3—figure supplement 3
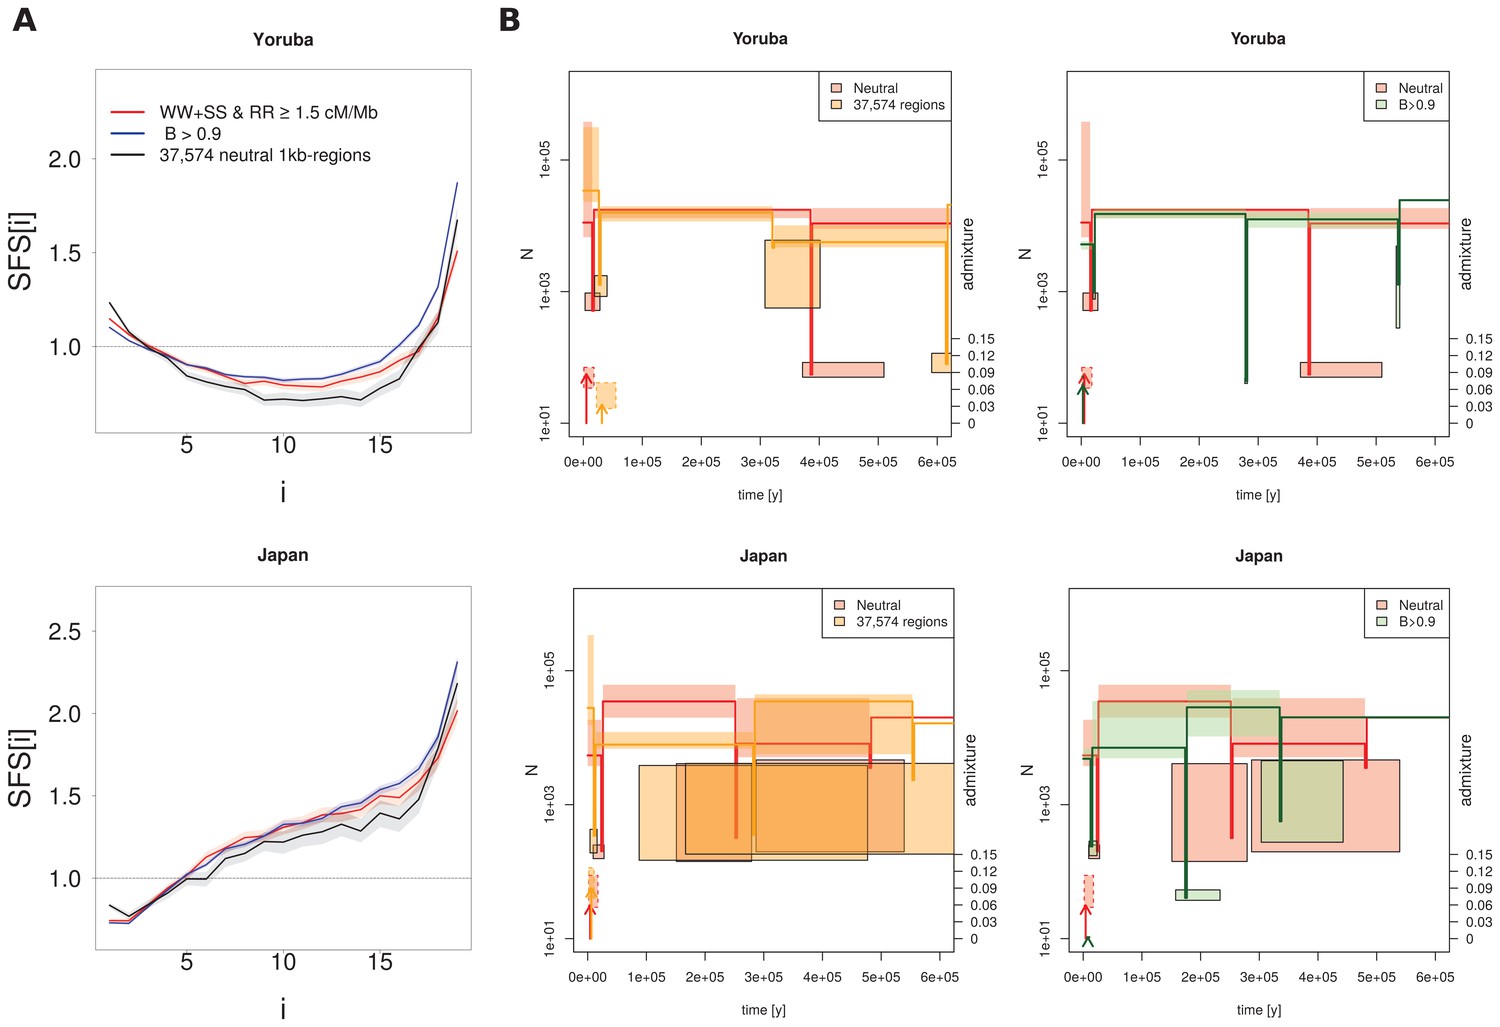
Recent demography inferred from three different datasets in the Yoruba and Japan 1000G populations.
(A) Observed SFS computed on the three datasets. Neutral: neutral SFS computed on WW + SS sites in regions with recombination rate (RR) ≥ 1.5 cM/Mb; 37,574 neutral 1kb-regions: 37,574 1 kb neutral segments defined in Gronau et al. (2011); B > 0.9 corresponds to SNPs in segments with McVicker et al. (2009) B-statistics values larger than 0.9. For each panel, SFS of 37,574 regions or of B > 0.9 are significantly different from the neutral SFS with p-values<10−3. (B) Comparison of inferred demographic events in the last 600,000 years under the model shown in Figure 3C. Left and right panels compare neutral estimations to those of different datasets. Solid lines represent maximum-likelihood (ML) estimates of population sizes and bottleneck times. Vertical arrows indicate ML estimates of admixture times; their height is proportional to the admixture estimates shown on the right axis. Boxes delimit 99% confidence intervals obtained by a block-bootstrap approach (see Materials and methods). Boxes surrounded by a solid line are for bottleneck parameters (size and time), open boxes are for population size between bottleneck events, and boxes surrounded by a dashed line are for admixture rates and times. Note that bottlenecks have been modelled with a fixed duration of 100 generations, and the width of the boxes denotes the range covered by 99% of the bootstrap estimations.
Figure 4 with 2 supplements
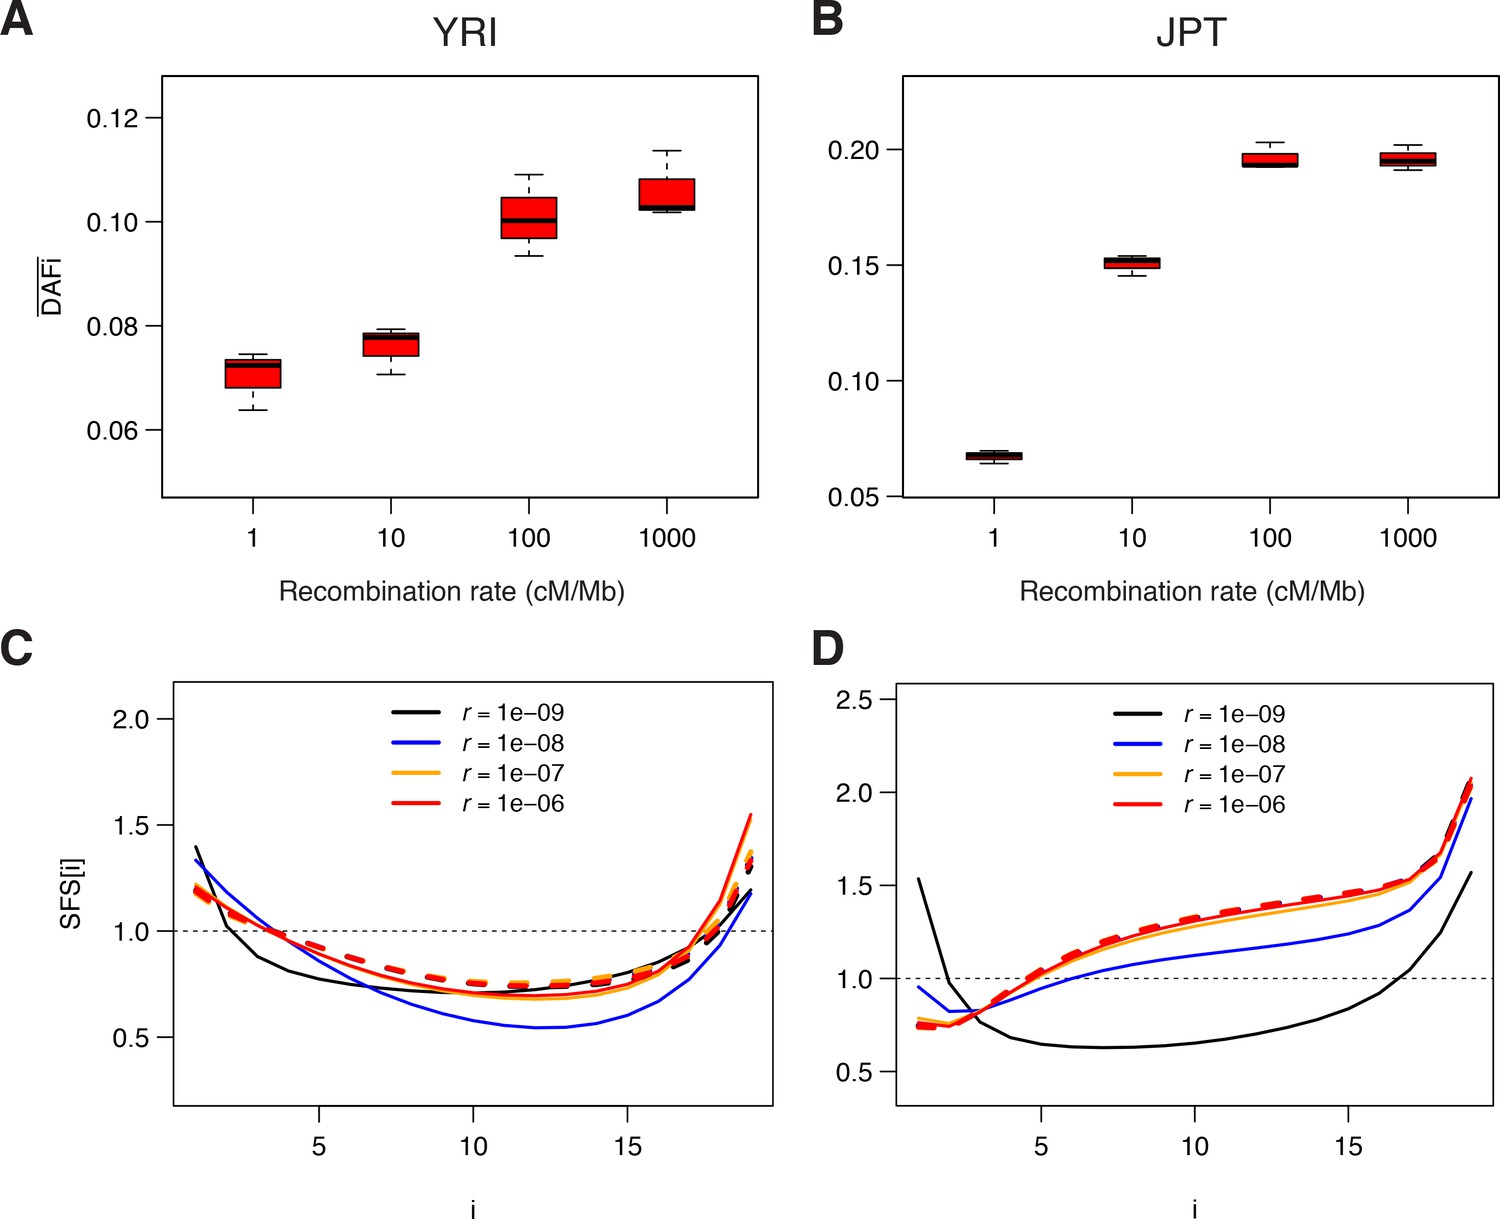
Genomic data simulated under a model of background selection (BGS).
We used the demographic parameters estimated for the Yoruba (YRI) and Japanese (JPT) populations from neutral sites (WW + SS sites with RR ≥1.5 cM/Mb) as reported in Supplementary file 3 - Table S3. Forward simulations of diploid individuals were performed with SLiM v. 2.3 (Haller and Messer, 2017). We simulated the evolution of a chromosome of 50 Mb made up of 1000 5 kb regions, each consisting of a 1 kb region experiencing purifying selections followed by a 4 kb region with neutral mutations. A, B) Average derived allele frequency per individual (). C, D) Unfolded normalized SFS. Solid and dashed lines correspond to simulations performed with and without BGS, respectively. The transition to effective neutrality occurs between a recombination rate of 1e–8 (blue curve) and 1e–7 (orange curve), a range that includes our proposed threshold of 1.5 cM/Mb.
Figure 4—figure supplement 1
Simulated SFS under neutrality and with background selection for various recombination rates.
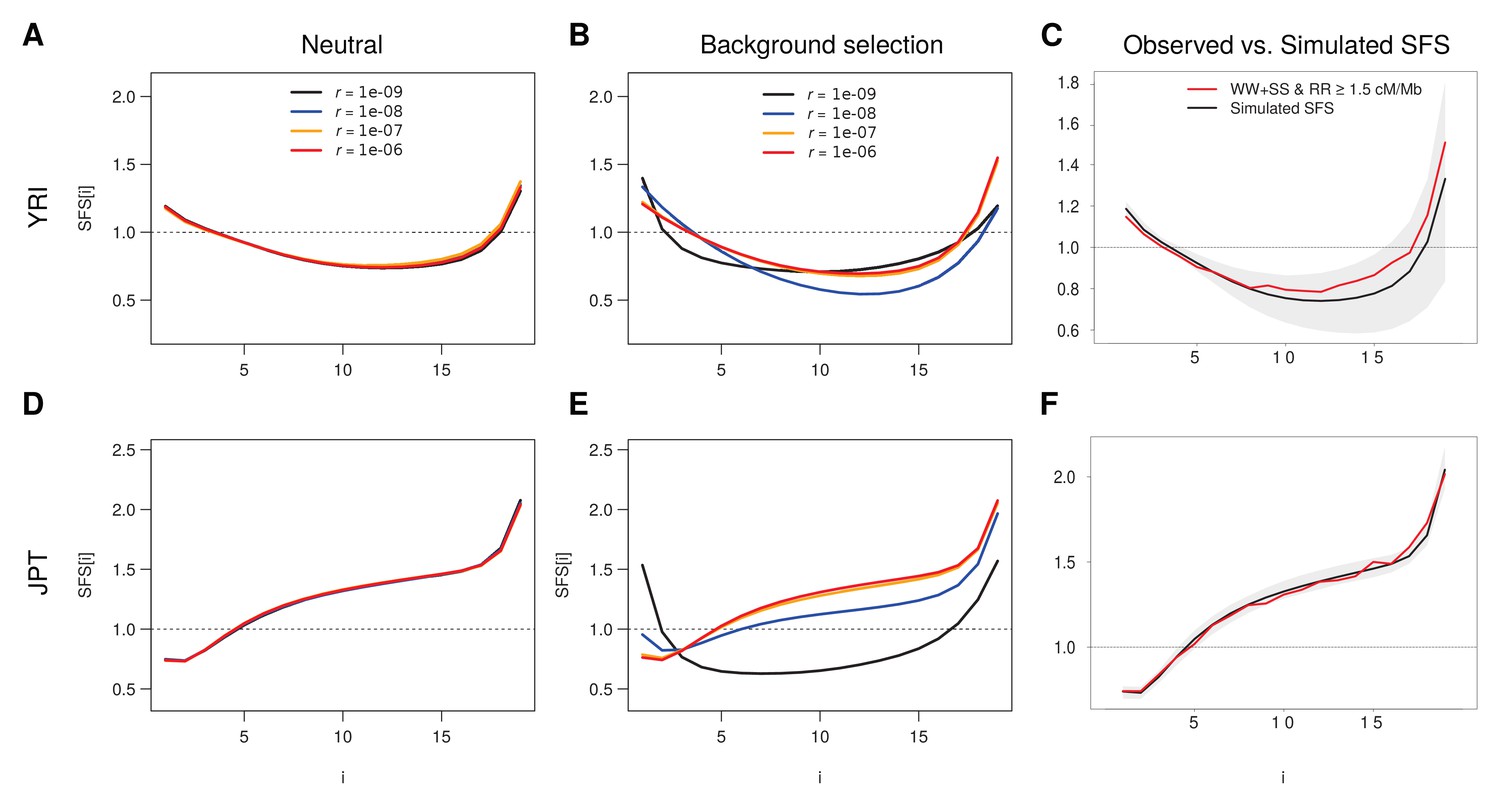
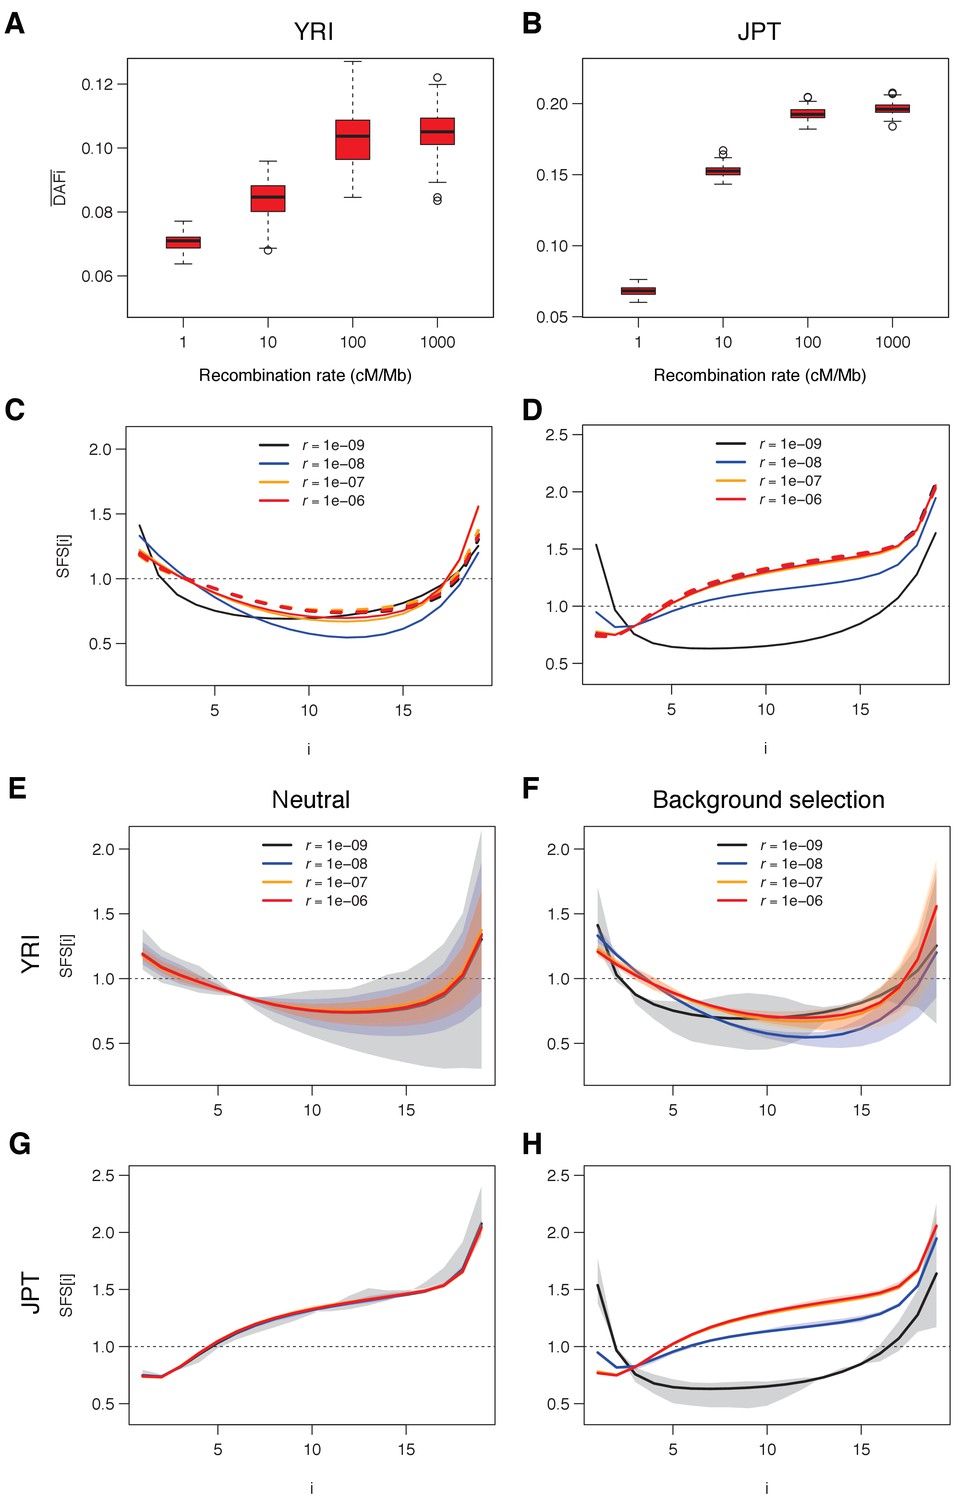
Individual based simulations under demographic parameters inferred from neutral sites (WW + SS sites with r ≥ 1.5 cM/Mb) as reported in Supplementary file 3 - Table S3 were done for the Yoruba (YRI) and Japan (JPT) populations. (A, B) Unfolded SFS based on the YRI demographic parameters without (A) and with (B) BGS. (D, E) Unfolded SFS based on the JPT demographic parameters without (D) and with (E) BGS. Shaded areas delimit a 95% range obtained from 100 simulations. A recombination rate of r = 10–8 corresponds here to 1 cM/Mb. See Materials and methods for details of simulations. (C, F) Comparisons between the simulated unfolded neutral SFS with r = 10−6 and the observed neutral SFS (WW + SS sites with r ≥ 1.5 cM/Mb) for YRI (C) and JPT (F).
Figure 4—figure supplement 2
Simulated and SFS under neutrality and with background selection for various recombination rates.
Individual based simulations were done as described in Figure 4 and Figure 4—figure supplement 1, but with shorter alternating segments of sequence under purifying selection (100 bp instead of 1000 bp) and neutral sequence (400 bp instead of 4000 bp). (A, B) Average derived allele frequency per individual (). (C, D) Unfolded normalized SFS. Other details as in Figure 4. (E, F) Unfolded SFS based on the YRI demographic parameters without (E) and with (F) BGS. (G, H) Unfolded SFS based on the JPT demographic parameters without (G) and with (H) BGS. Shaded areas delimit a 95% range obtained from 100 simulations. Other details as in Figure 4—figure supplement 1. See Materials and methods for details of simulations.
Additional files
-
Supplementary file 1
Table S1: Individuals analyzed in this study
- https://doi.org/10.7554/eLife.36317.026
-
Supplementary file 2
Table S2: Properties of the different data sets after filtering
- https://doi.org/10.7554/eLife.36317.027
-
Supplementary file 3
Table S3: Maximum-likelihood estimates of parameters of the demographic model shown in Figure 3—figure supplement 3, with limits of 99% confidence intervals.
- https://doi.org/10.7554/eLife.36317.028
-
Supplementary file 4
Table S4: Parameter estimates and quality-of-fit statistics for models of BGS with and without a mutation–recombination correlation.
- https://doi.org/10.7554/eLife.36317.029
-
Transparent reporting form
- https://doi.org/10.7554/eLife.36317.030
Download links
A two-part list of links to download the article, or parts of the article, in various formats.
Downloads (link to download the article as PDF)
Open citations (links to open the citations from this article in various online reference manager services)
Cite this article (links to download the citations from this article in formats compatible with various reference manager tools)
Background selection and biased gene conversion affect more than 95% of the human genome and bias demographic inferences
eLife 7:e36317.
https://doi.org/10.7554/eLife.36317


