Ultra-Rapid serial visual presentation reveals dynamics of feedforward and feedback processes in the ventral visual pathway
- Massachusetts Institute of Technology, United States
- Freie Universität Berlin, Germany
Figures
Figure 1
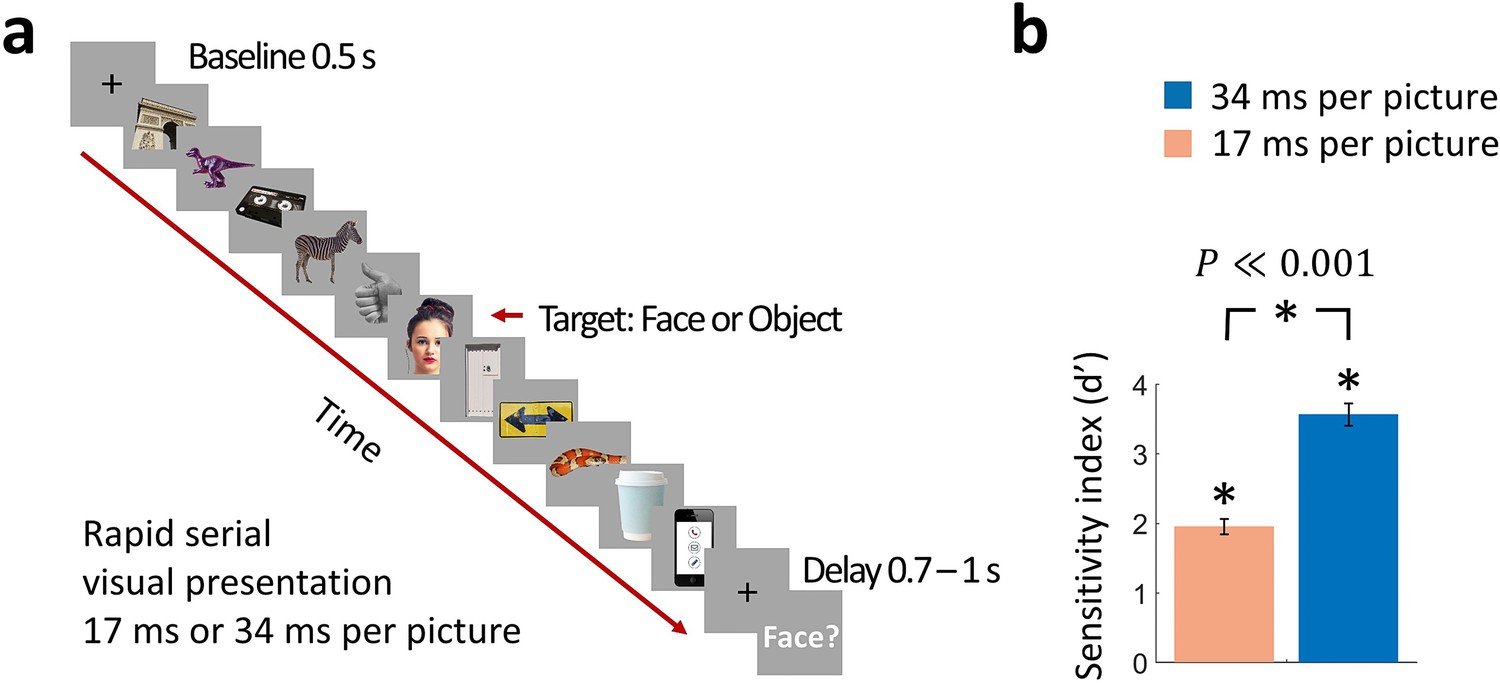
Rapid serial visual presentation (RSVP) task.
(a) Experimental procedure. The stimulus set comprised 12 face targets, 12 object targets, and 45 masks of various objects. Participants viewed a RSVP sequence of 11 images, with the middle image (target) either a face or an object. The images were presented at a rate of 17 ms per picture or 34 ms per picture in separate trials. Following a delay of 0.7 - 1 s to prevent motor artifacts, subjects were prompted to respond by pressing a button whether they have seen a face or not. (Images shown are not examples of the original stimulus set due to copyright; the exact stimulus set is visualized at https://megrsvp.github.io. Images shown are in public domain and available at pexels.com under a Creative Commons Zero (CC0) license.) (b) Behavioral performance in the two RSVP conditions. Bars indicate d’ performance and error bars indicate SEM. Stars above each bar and between bars indicate significant performance and significant differences between the two conditions, respectively (n=17; two-sided signed-rank test; P0.001).
Figure 2
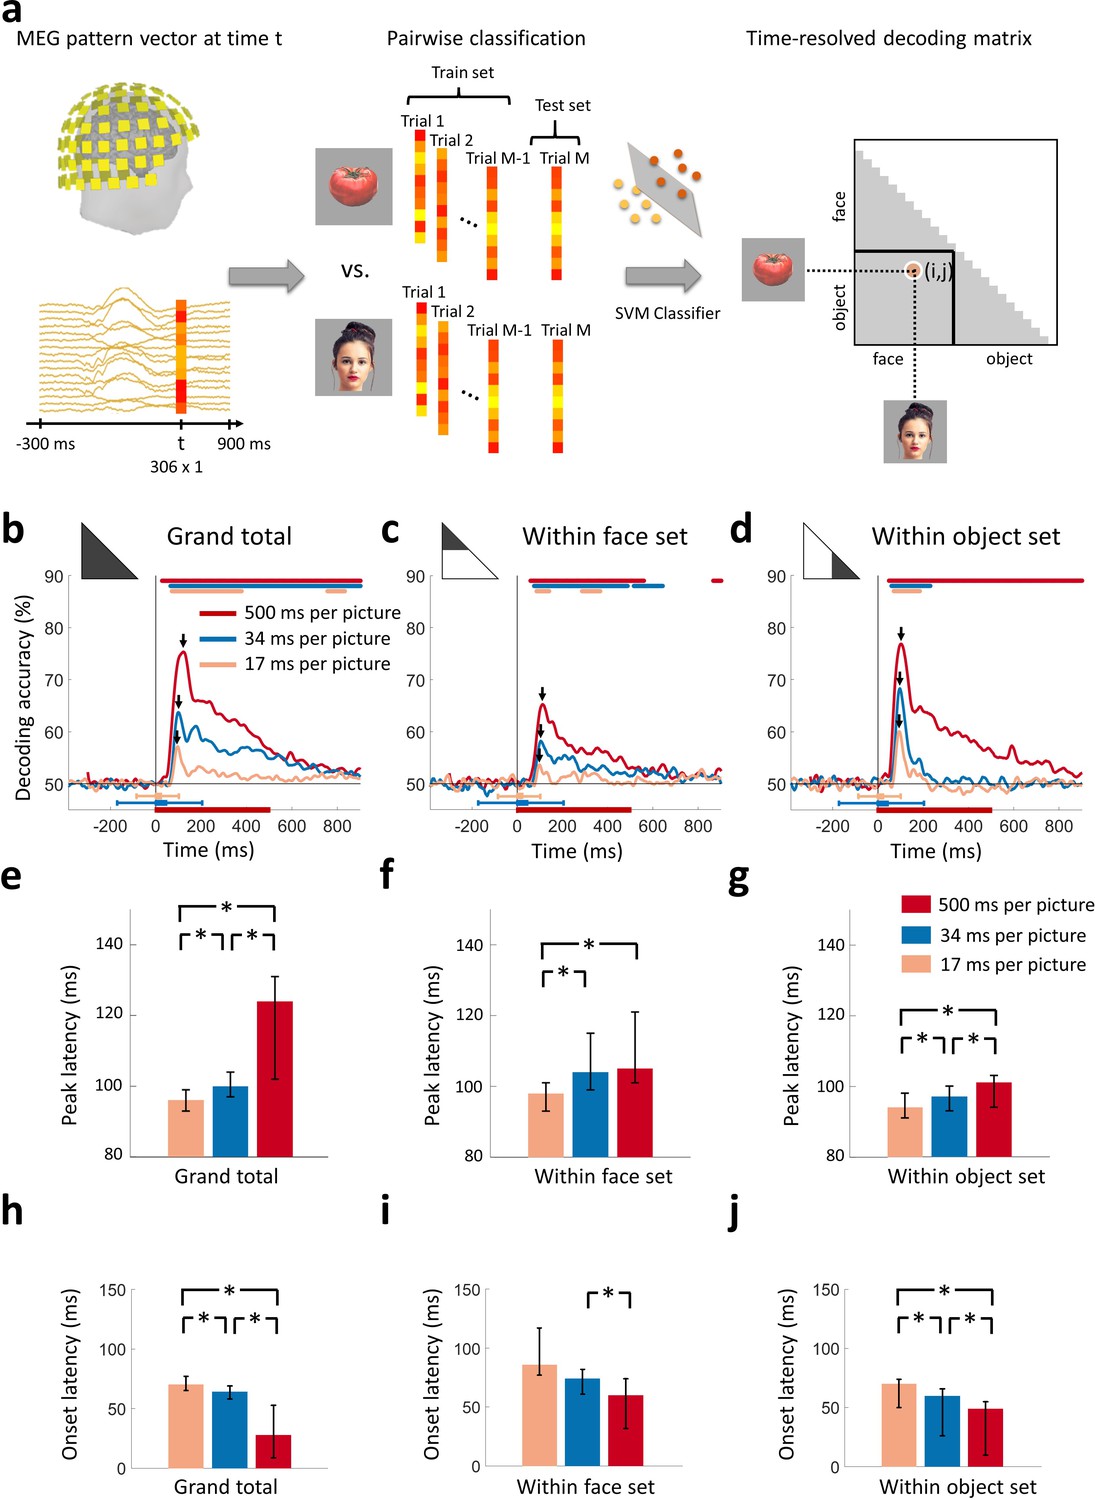
Decoding of target images from MEG signals.
(a) Multivariate pattern analysis of MEG signals. A support vector machine (SVM) classifier learned to discriminate pairs of target images using MEG data at time point t. The decoding accuracies populated a 24 × 24 decoding matrix at each time point t. (Images shown are not examples of the original stimulus set due to copyright; see Figure 1 caption for details) (b) Time course of grand total target image decoding for the 500, 34, and 17 ms per picture conditions. Pairwise decoding accuracies were averaged across all elements of the decoding matrix. Time is relative to target image onset. Color coded lines above plots indicate significant times. Color coded interval lines below plots indicate stimuli presentation times, with thick and thin lines indicating target and mask presentations. Arrows indicate peak latencies. (c, d) Time course of within category target image decoding for faces and objects. The decoding matrix was divided into 2 segments for pairs of within-face and within-object comparisons, and the corresponding decoding accuracies were averaged. (e–g) Peak latency times for the above target decoding time courses and corresponding 95% confidence intervals are depicted with bar plots and error bars, respectively. (h–j) Onset latency times for the above decoding time courses and 95% confidence intervals. Stars above bars indicate significant differences between conditions. (n=16 for 500 ms per picture and n=17 for RSVP conditions; time courses were evaluated with one-sided sign permutation tests, cluster defining threshold P0.05, and corrected significance level P0.05; bar plots were evaluated with bootstrap tests for 95% confidence intervals and two-sided hypothesis tests; false discovery rate corrected at P0.05).
Figure 3 with 1 supplement
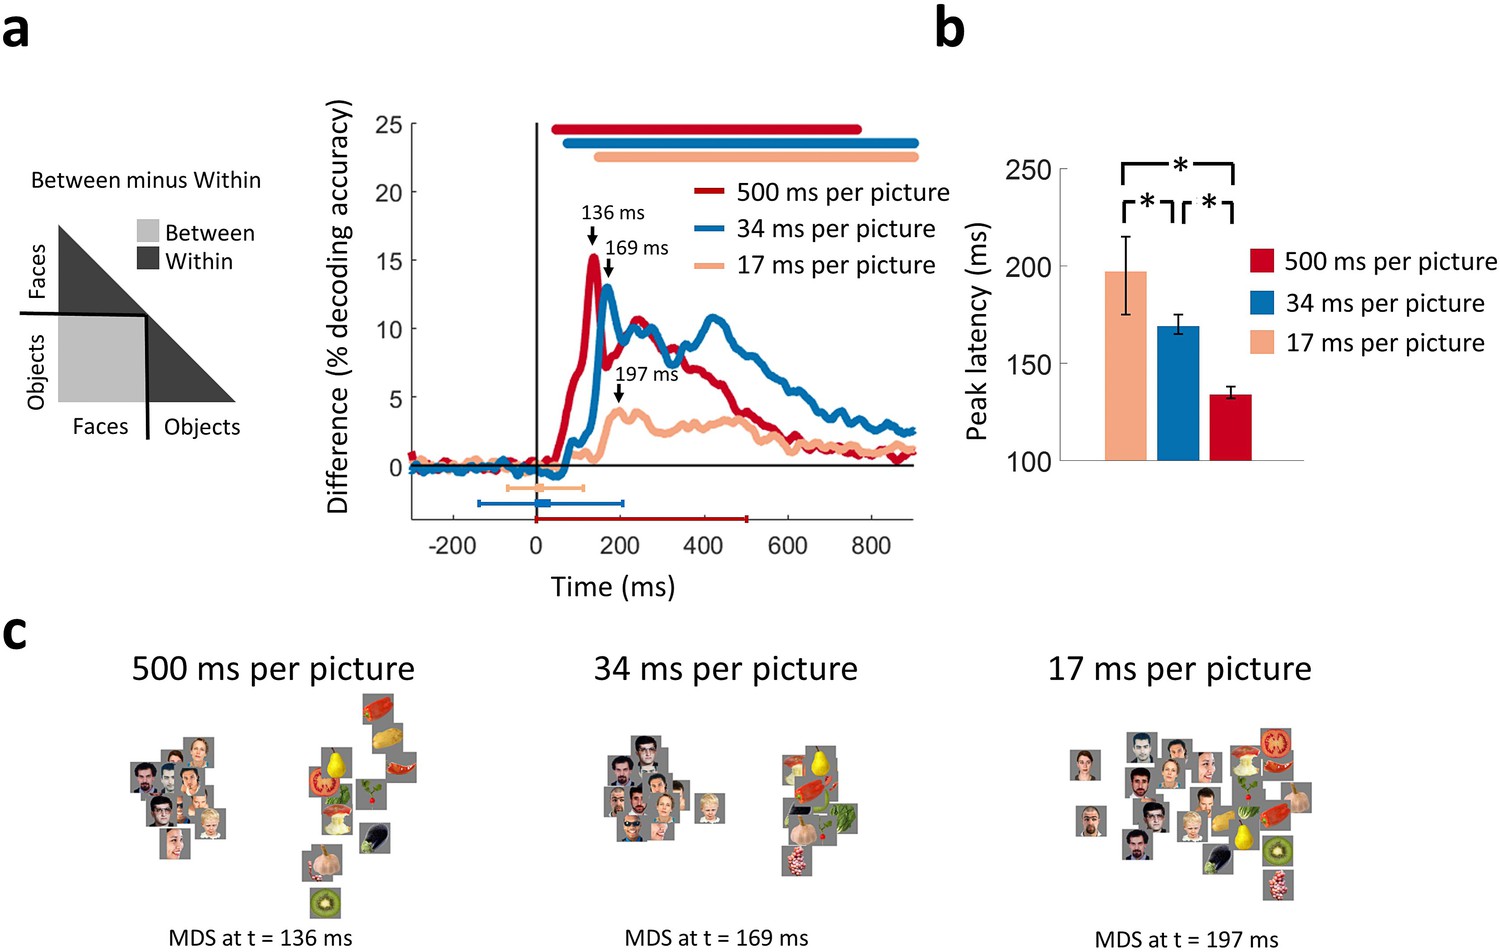
Categorical information encoded in MEG signals.
(a) Time course of categorical division depending on presentation rate. For each condition, the MEG decoding matrix was divided into 3 segments for pairs of within-face, within-object, and between-face/object comparisons, and a categorical effect was estimated by contrasting the averaged decoding accuracies of the within from the between segments. Time is relative to target image onset. Color coded lines above plots, interval bars below plots, and arrows same as in Figure 2. (b) Peak latency times for the categorical information time courses and 95% confidence intervals are depicted with bar plots and error bars, respectively. Stars above bars indicate significant differences between conditions. (c) The first two dimensions of multidimensional scaling (MDS) of the MEG decoding matrices are shown for the times of peak categorical information for the 3 conditions. (n=16 for 500 ms per picture and n=17 for RSVP conditions; time courses were evaluated with one-sided sign permutation tests, cluster defining threshold P0.05, and corrected significance level P0.05; bar plots were evaluated with bootstrap tests for 95% confidence intervals and two-sided hypothesis tests; false discovery rate corrected at P0.05).
Figure 3—Figure supplement 1
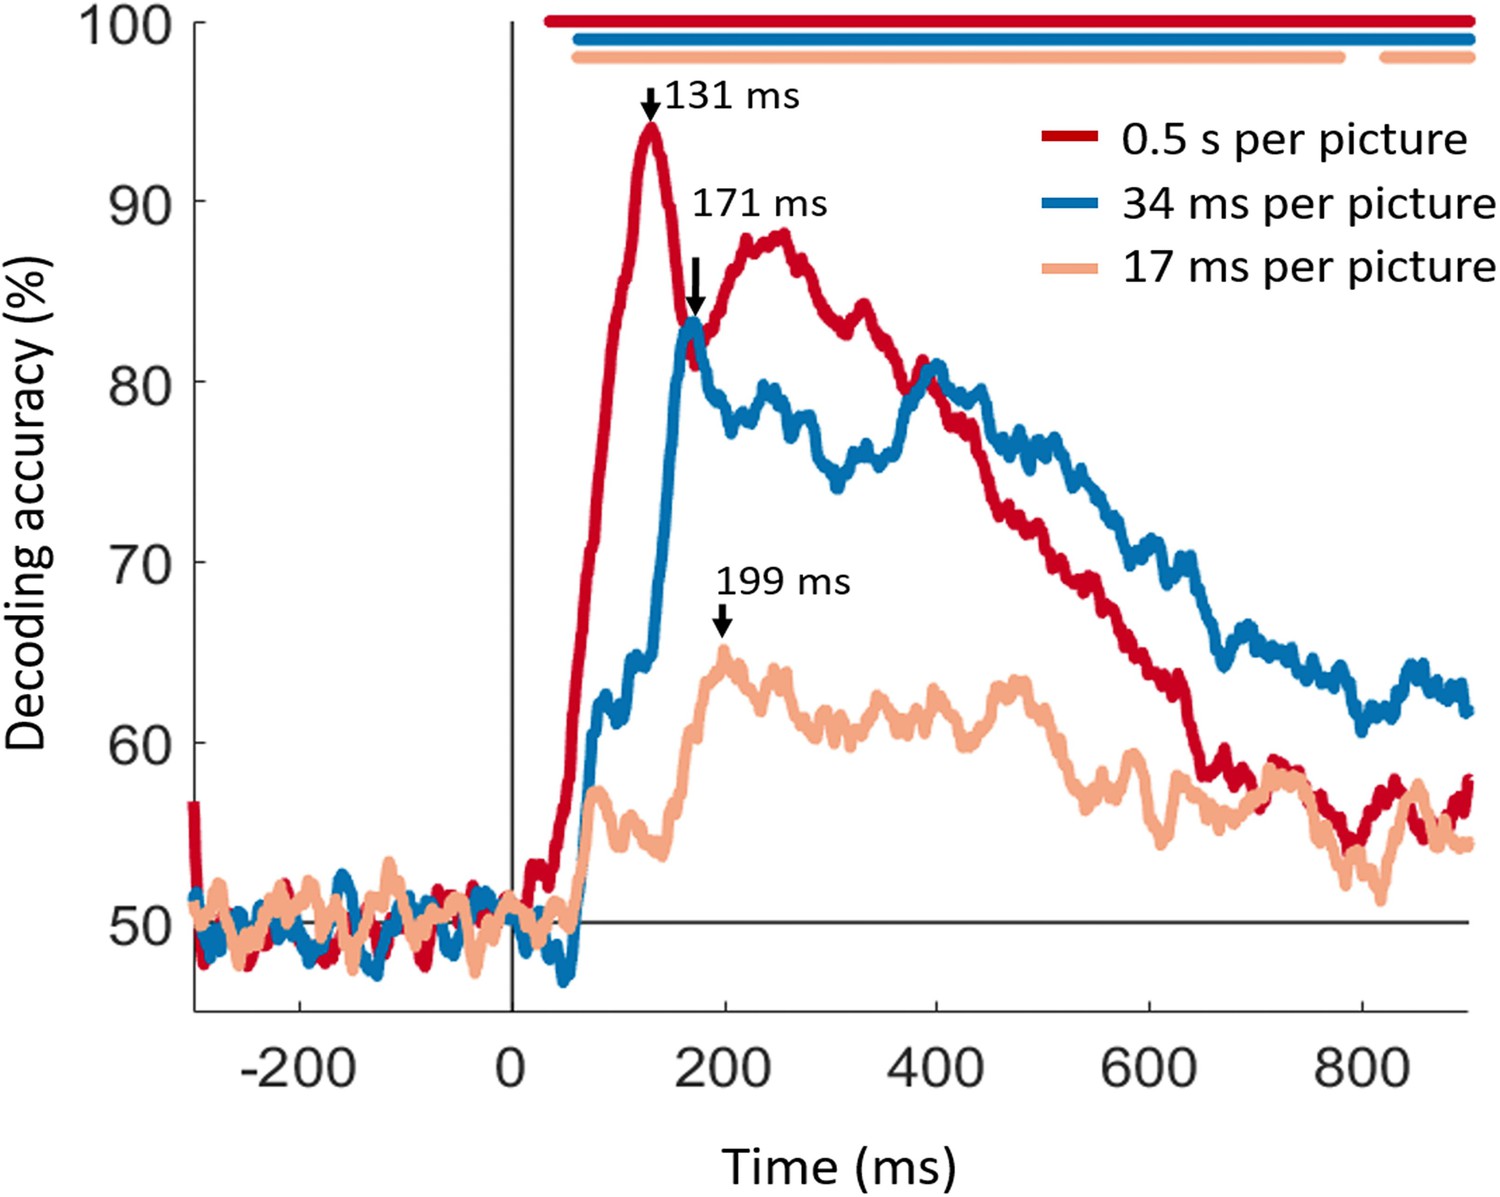
Linear decoding of faces vs. objects category.
For each condition and at each time point a SVM classifier was trained to decode object versus face trials with a leave-one-out procedure. The shape and peaks of the time series largely match the results in Figure 3a. This indicates that binary image classification followed by comparison of inter- vs intra-class averaging (as performed in Figure 3a) is consistent with a direct classification of faces vs. objects (shown in supplement). The color coded lines above the curves indicate significant time points (one-sided sign permutation tests, cluster defining threshold p<0.05, and corrected significance level p<0.05).
Figure 4
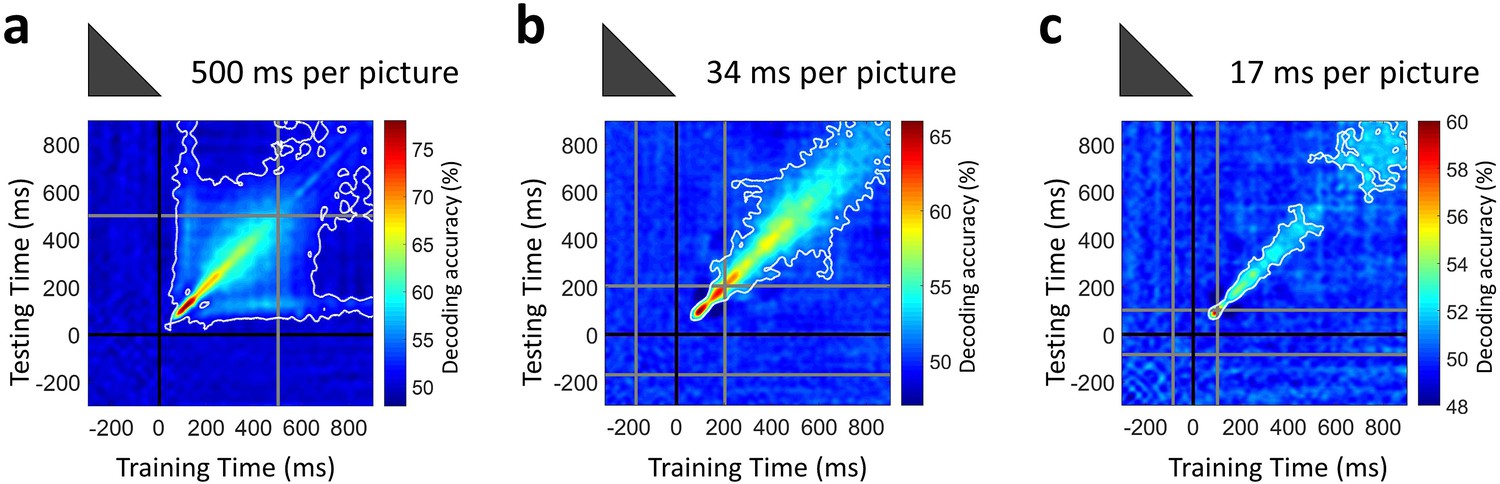
Temporal generalization of target image decoding for the 500, 34, and 17 ms per picture conditions.
The SVM classifier was trained with MEG data from a given time point t (training time) and tested on all other time points (testing time). The temporal generalization decoding matrix was averaged over all image pairs and all subjects, thus corresponding to the temporal generalization of the grand total decoding time series in Figure 2b. The black line marks the target image onset time. The gray lines mark the image offset in the 500 ms per picture condition and the RSVP sequence onset/offset times in the rapid presentation conditions. The white contour indicates significant decoding values (n=16 for 500 ms per picture and n=17 for RSVP conditions; one-sided sign permutation tests, cluster defining threshold P0.05, and corrected significance level P0.05).
Figure 5

Representational similarity of MEG to fMRI signals at EVC and IT.
(a) For every time point t, the EVC-specific MEG RDM was compared (Spearman’s rho) with the EVC-specific fMRI RDM, yielding a time series of MEG-fMRI representational similarity at EVC. (b) Same as in (a) but for IT. (c–e) Time series of MEG-fMRI representational similarity at EVC and IT for the 3 conditions. Time is shown relative to target image onset. Color coded lines below plots indicate significant times. Peak latencies are indicated with arrows. While the 202 ms peak of the EVC time series in (e) is not significant, it is marked to indicate comparable temporal dynamics with the 34 ms per picture condition. (f–h) Peak latency times for the representational similarity time courses and 95% confidence intervals are depicted with bar plots and error bars, respectively. Stars above bars indicate significant differences between conditions. (n=16 for 500 ms per picture and n=17 for RSVP conditions; time courses were evaluated with one-sided sign permutation tests, cluster defining threshold P0.05, and corrected significance level P0.05; bar plots were evaluated with bootstrap tests for 95% confidence intervals and two-sided hypothesis tests; false discovery rate corrected at P0.05).
Author response image 1
Decoding seen versus unseen faces in the 17ms per picture condition.
https://doi.org/10.7554/eLife.36329.014Tables
Table 1
Peak and onset latency of the time series for single image decoding (Figure 2) and categorical division decoding (Figure 3), with 95% confidence intervals in brackets.
https://doi.org/10.7554/eLife.36329.005| Presentation rate | Peak latency (ms) | Onset latency (ms) | |
|---|---|---|---|
| Grand total | 500 ms per picture | 121 (102–126) | 28 (9–53) |
| 34 ms per picture | 100 (96–107) | 64 (58–69) | |
| 17 ms per picture | 96 (93–99) | 70 (63–76) | |
| Within-faces | 500 ms per picture | 113 (104–119) | 59 (30–73) |
| 34 ms per picture | 104 (96–109) | 74 (62–81) | |
| 17 ms per picture | 98 (96–104) | 86 (78–117) | |
| Within-objects | 500 ms per picture | 102 (93–102) | 48 (10–55) |
| 34 ms per picture | 97 (90–97) | 60 (27–67) | |
| 17 ms per picture | 94 (87–95) | 70 (64–74) | |
| Between minus within | 500 ms per picture | 136 (130–139) | 46 (15–51) |
| 34 ms per picture | 169 (165–177) | 73 (67–78) | |
| 17 ms per picture | 197 (175–218) | 139 (67–155) |
Table 2
Peak and onset latency of the time series for MEG-fMRI fusion at EVC and IT, with 95% confidence intervals in brackets.
https://doi.org/10.7554/eLife.36329.009| Peak latency (ms) | Onset latency (ms) | ||
|---|---|---|---|
| 500 ms per picture | IT | 131 (127–135) | 63 (50–75) |
| EVC | 104 (93–120) | 53 (50–57) | |
| 34 ms per picture | IT | 166 (162–173) | 70 (50–88) |
| EVC | 87 (83–97) and 169 (164-176)* | 71 (61–81) | |
| 17 ms per picture | IT | 195 (170–203) | 162 (55–183) |
| EVC | 80 (75–100) and 202 (190-219)* | 71 (50–76) |
-
*Time series had two early peaks.
Additional files
-
Source data 1
Figures 2, 3 and 5 source data and code.
Decoding target images; resolving categorical information; and computing MEG-fMRI representational similarities.
- https://doi.org/10.7554/eLife.36329.011
-
Transparent reporting form
- https://doi.org/10.7554/eLife.36329.012
Download links
A two-part list of links to download the article, or parts of the article, in various formats.
Downloads (link to download the article as PDF)
Open citations (links to open the citations from this article in various online reference manager services)
Cite this article (links to download the citations from this article in formats compatible with various reference manager tools)
Ultra-Rapid serial visual presentation reveals dynamics of feedforward and feedback processes in the ventral visual pathway
eLife 7:e36329.
https://doi.org/10.7554/eLife.36329


