Irreversible temperature gating in trpv1 sheds light on channel activation
- Facultad de Medicina, México
- Instituto de Fisiología Celular, México
Figures
Figure 1 with 1 supplement
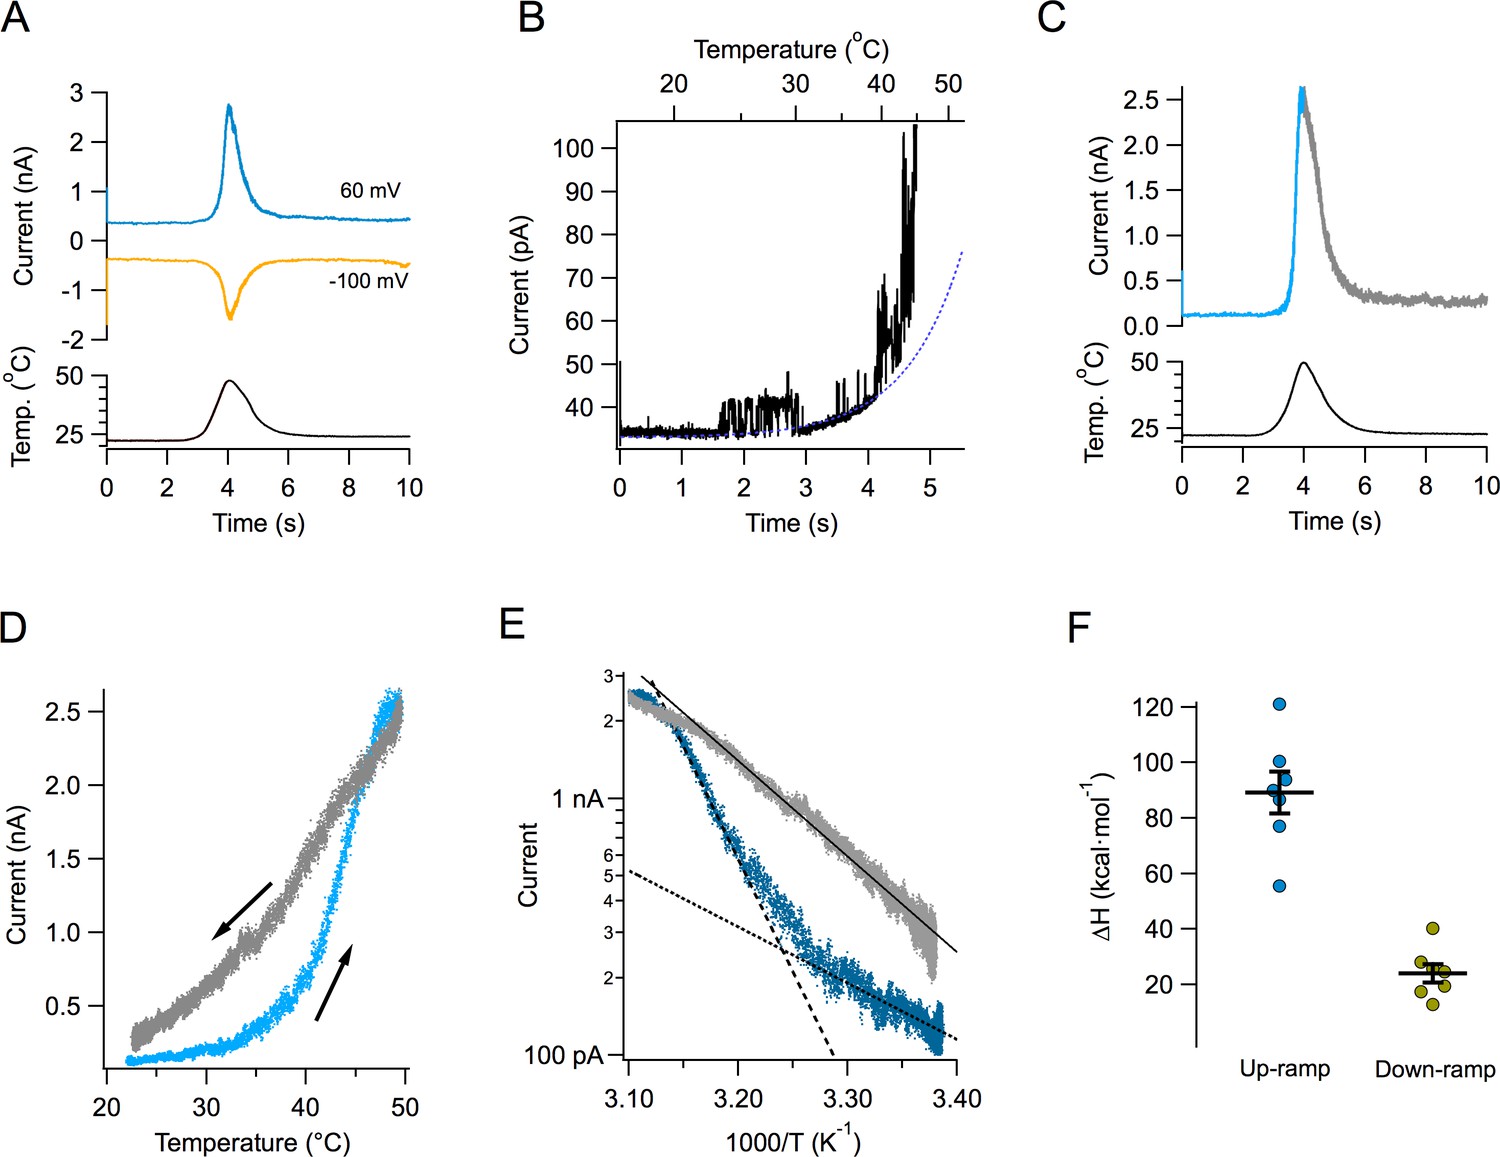
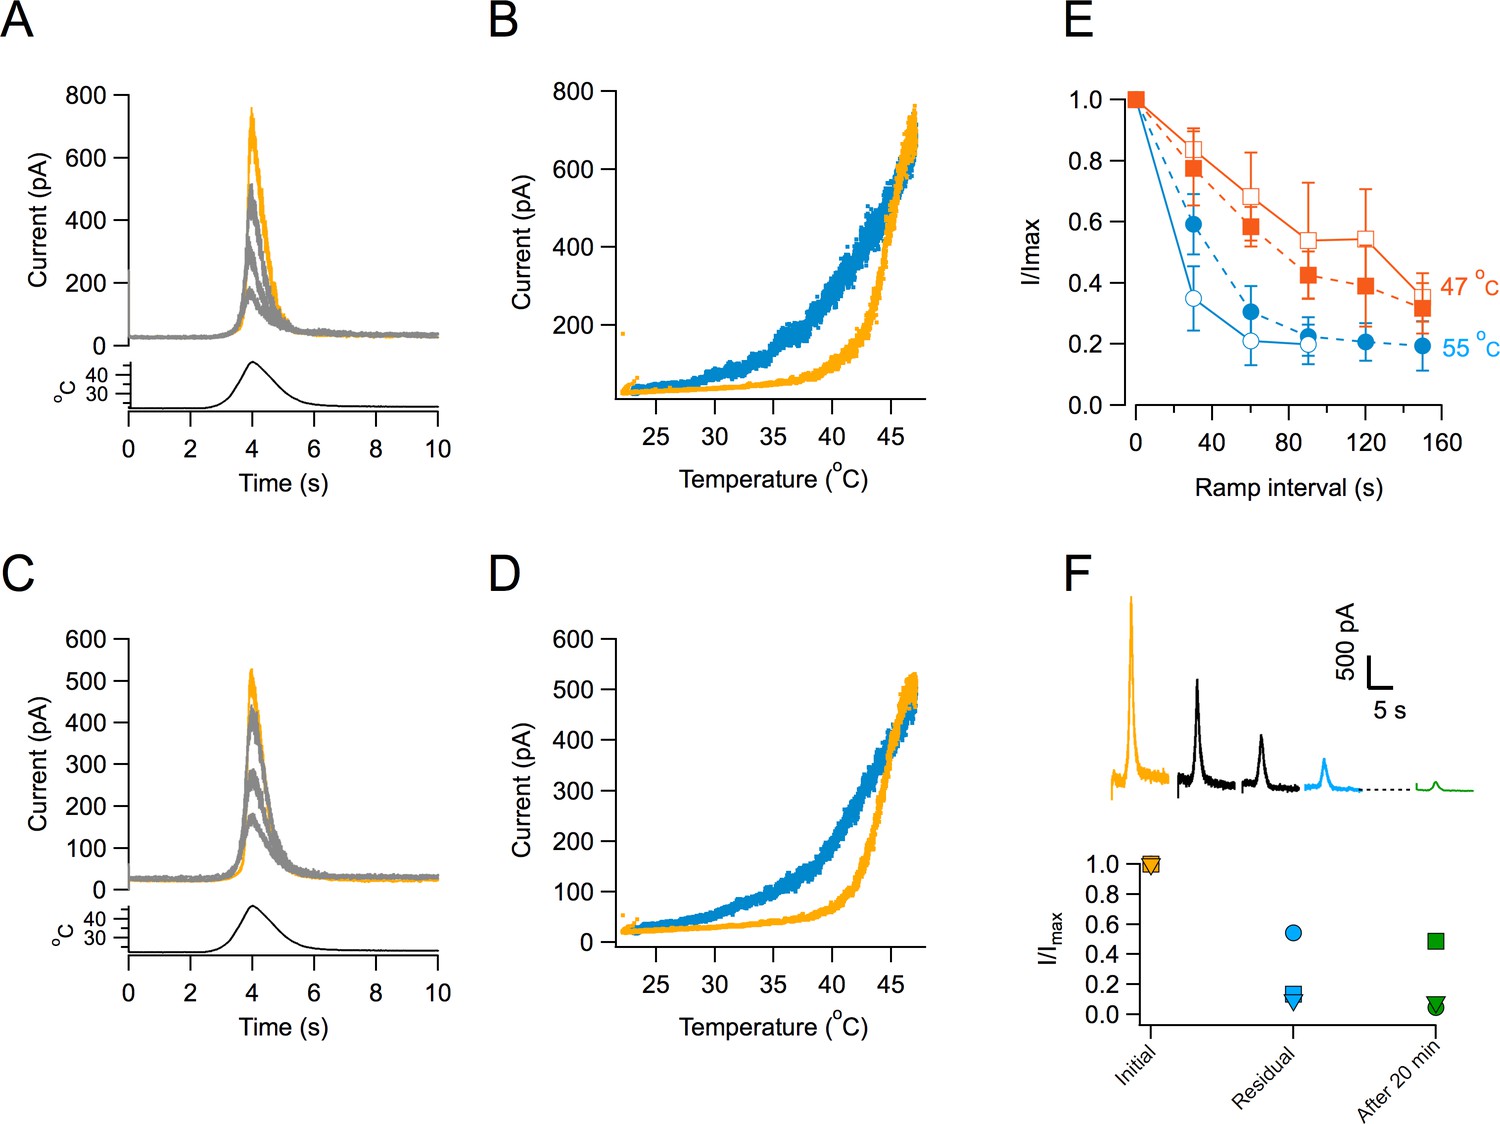
Activation of TRPV1 current by temperature ramps.
(A) TRPV1-mediated Na+ currents in an inside-out patch, activated by a temperature ramp while the voltage was held constant at the indicated value. The ramp had a total duration of 4 s (2 up and 2 down) and is shown below the currents. The maximum temperature reached was 47.8°C. (B) Single channels can be observed in a patch containing hundreds of TRPV1 channels. In this patch, the detectable increase in open probability happens around 40°C. (C) A different patch showing the up and down regions of the current in response to the temperature ramp in different color. Notice the asymmetry in the kinetics of the current. (D) The current in panel (C) is plotted as a function of the temperature ramp. The arrows indicate the direction of temperature increase (blue) or decrease (gray). It is evident that the paths followed by activation and deactivation are different. (E) Van’t Hoff representation of the current during the up section of the ramp (blue) and the down section (grey) as a function of inverse temperature. The threshold of current activation is determined from the intersection of the two exponential functions representing the leak current (black dotted line, enthalpy 10 kcal⋅ mol−1) and the TRPV1 current (black dashed line, enthalpy 40 kcal⋅mol−1). The continuous black line is an exponential fit to the deactivating (down ramp, enthalpy 17 kcal⋅mol−1) current. (F) Activation properties of TRPV1 by heat. The enthalpy was obtained from seven patches.
-
Figure 1—source data 1
Enthalpy values for Figure 1F.
- https://doi.org/10.7554/eLife.36372.004
Figure 1—figure supplement 1
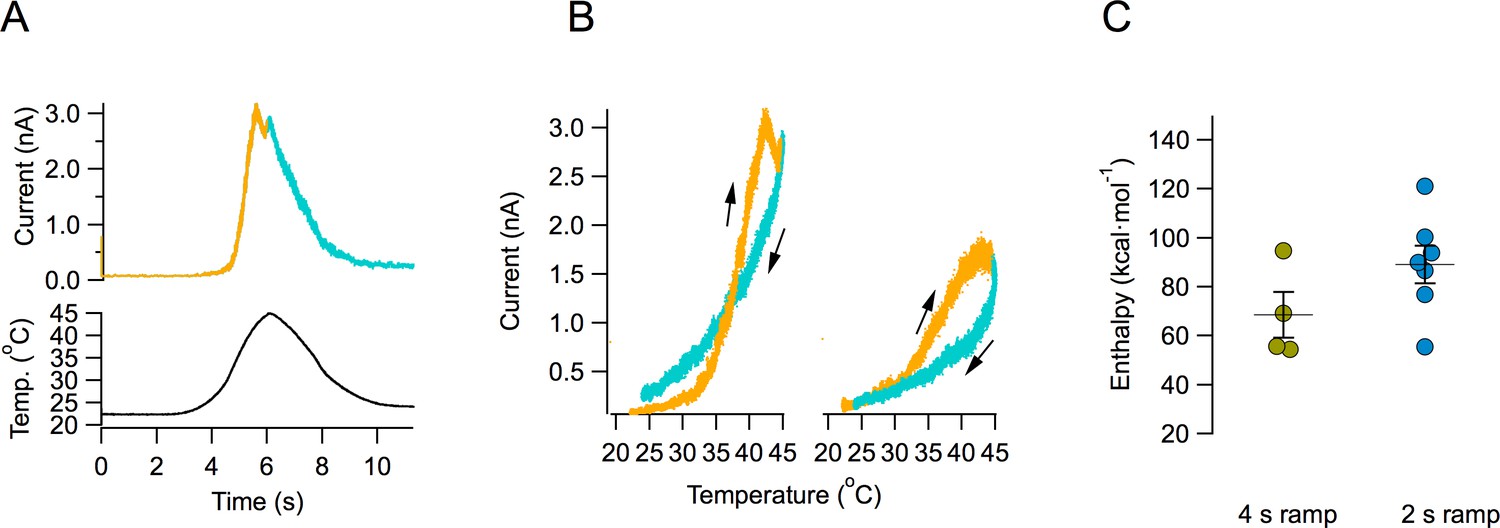
Hysteresis is present and identical in longer temperature ramps.
(A) Temperature ramps lasting 8 s (4 s up and 4 s down) elicit currents that show asymmetric up and down components (upper panel). (B) The temperature-dependence of the activation and deactivation of TRPV1 in longer ramps is identical to that observed in shorter ramps and the loss of current is present with subsequent application of activation ramps. (C) Enthalpy associated with activation is indistinguishable for currents activated by 4 s (up) or 2 s (up) ramps.
Figure 2 with 2 supplements
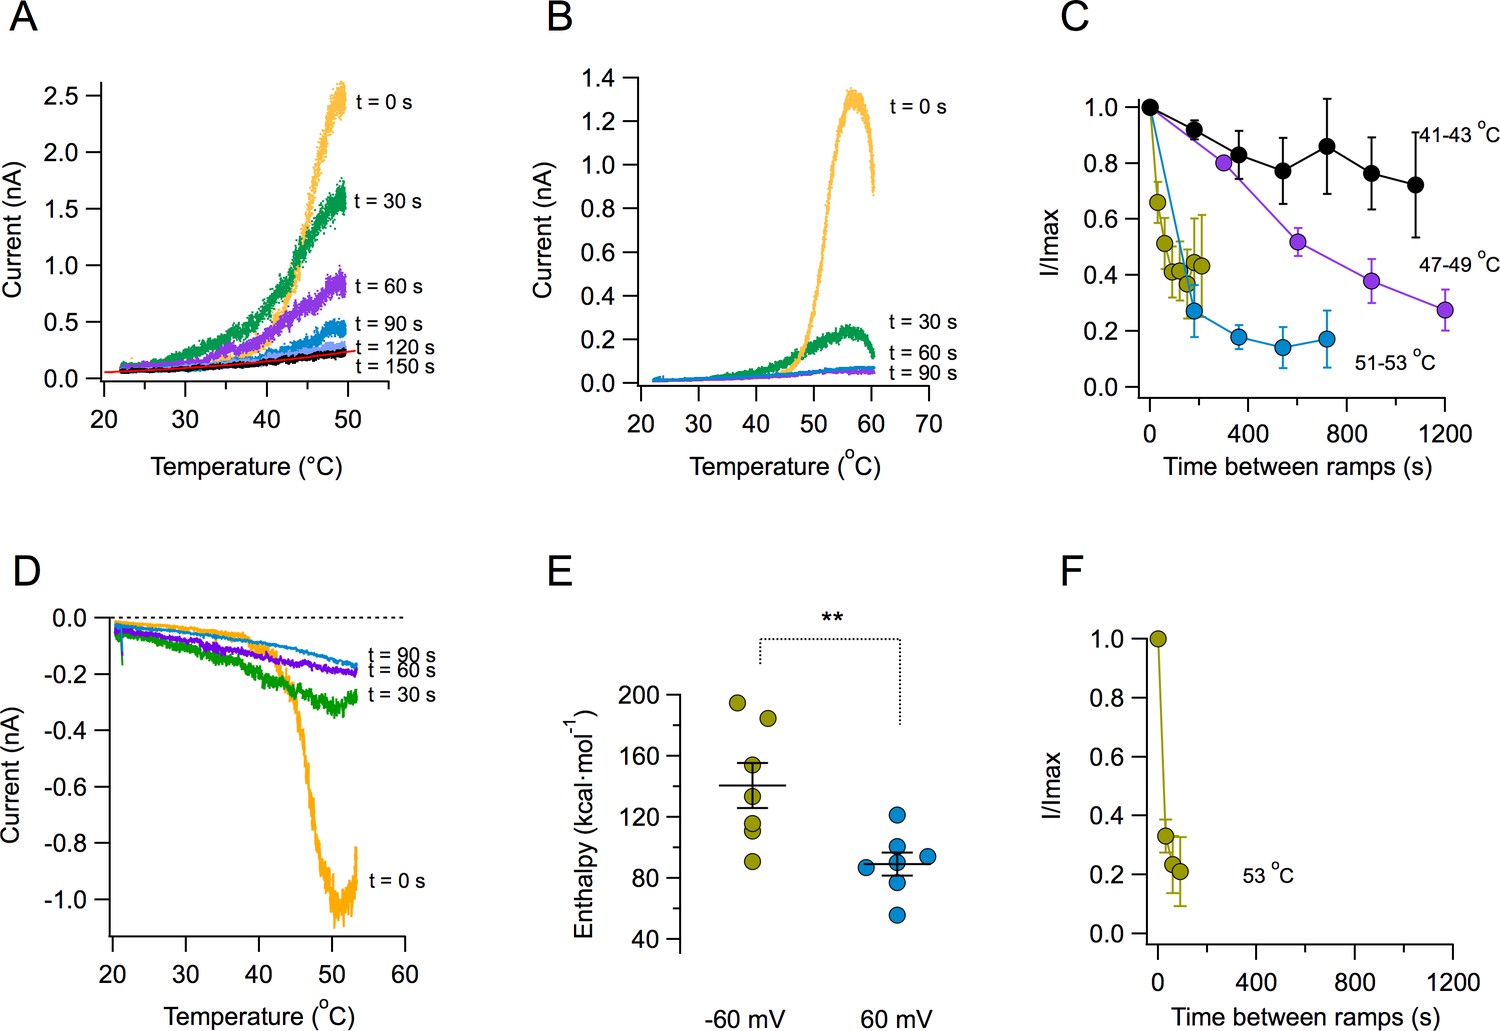
Loss of current with repetitive activation in TRPV1.
(A) Activation (up) part of the response to a temperature ramp in an inside-out patch expressing TRPV1 channels. The membrane potential was 60 mV. The maximum temperature attained was 49.7°C. Ramps of total (up and down) duration of 4 s were applied every 30 s. Note the marked reduction of peak current as well as the decreased slope of activation of every subsequent ramp-activated current. The trace at 150 s is essentially the response of the patch, since all TRPV1 current has been lost. This trace is fitted to an exponential dependence of temperature with an associated enthalpy of 14 kcal⋅mol−1. (B) Response of a different patch to a ramp of higher temperature (peak temperature 59°C). The loss of current is evident even during the up ramp response before the ramp has reached its maximum temperature. The response to subsequent ramps is much more diminished at this higher temperature. (C) Time course of current loss as a function of different maximum ramp temperatures. Maximum temperatures attained during the activation ramps are: Black circles, 41–43°C, purple circles, 47–49°C, blue circles, 51–53°C, lemon circles, 51–53°C, with a shorter interval between ramps. (D) Current loss also happens at negative voltages. Response of a patch held at −60 mV to repetitive ramps applied every 30 s. The maximum temperature attained by the ramp was 52.9°C. (E) Activation is more temperature-dependent at negative voltages. Enthalpy of activation estimated from the slope of activation of several independent patches at −60 and 60 mV. The mean enthalpy is different at the two voltages (p<0.001). (F) Current loss proceeds faster at negative voltages. Currents at −60 mV decay faster than currents at 60 mV at the same temperature (~53°C, compare with the lemon symbols in part C).
-
Figure 2—source data 1
Raw data for Figures 2C, E and F.
- https://doi.org/10.7554/eLife.36372.008
Figure 2—figure supplement 1

Current loss with repetitive stimulation is observed in whole-cell and outside-out recordings.
(A) Whole-cell recoding forms a HEK293 cell. Inactivation of the current is obvious, as is the reduced steepness of the response to a second and third temperature ramp. Interval between ramps is 30 s. (B) Temperature-activated TRPV1 currents recorded in the outside-out configuration. As is the case in whole-cell and inside-out recordings, current loss remains to be present with consecutive activations. Interval between ramps is 30 s. (C) Fractional reduction of current between the first and third activation ramp, for whole-cell and outside-out recordings. (D) Time course of current decay for cells in whole–cell recording mode (green circles, n = 4) and outside-out mode (purple squares, n = 3). The continuous and dotted black curves are the mean for whole-cell and outside-out, respectively. Maximum ramp temperature was 53.2°C.
Figure 2—figure supplement 2
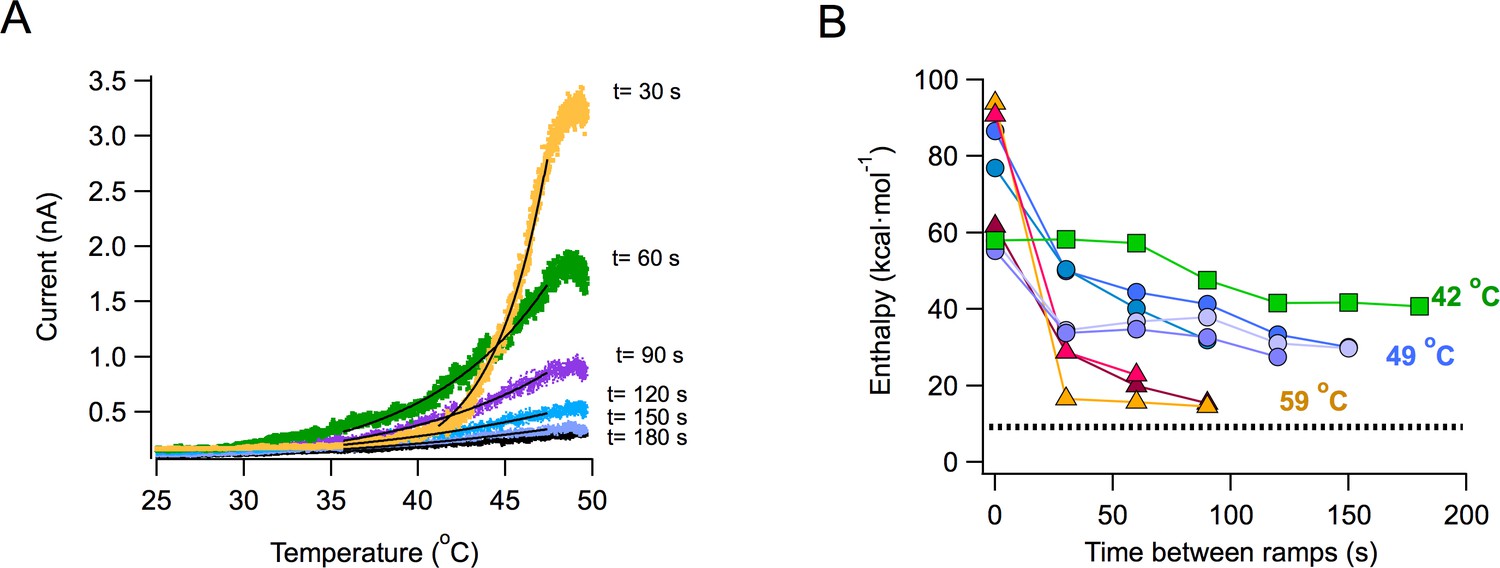
Inactivation by heat is accompanied by a loss of heat sensitivity.
(A) Color traces are the activation curves from the same patch in response to six temperature ramps with a maximum temperature of 49.6°C applied at 30 s intervals. Black traces are fits to an exponential function, from which the ΔH was obtained. The values of ΔH for each time interval are: t = 0, 163.02 kcal⋅mol−1; t = 30 s, 70.954 kcal⋅mol−1; t = 60 s, 55.254 kcal⋅mol−1; t = 90 s, 38.092 kcal⋅mol−1; t = 120 s, 32.482 kcal⋅mol−1, t = 150 s, 28.91 kcal⋅mol−1. (B) Activation enthalpy is reduced with every consecutive activation ramp and the reduction is temperature dependent. Enthalpy estimated from the slope of the activation plotted as a function of the activation time interval. Each color represents a separate patch at the indicated maximum ramp temperature. The dotted line represents 10 kcal⋅mol−1, which is near the enthalpy of a diffusion process.
Figure 3 with 1 supplement
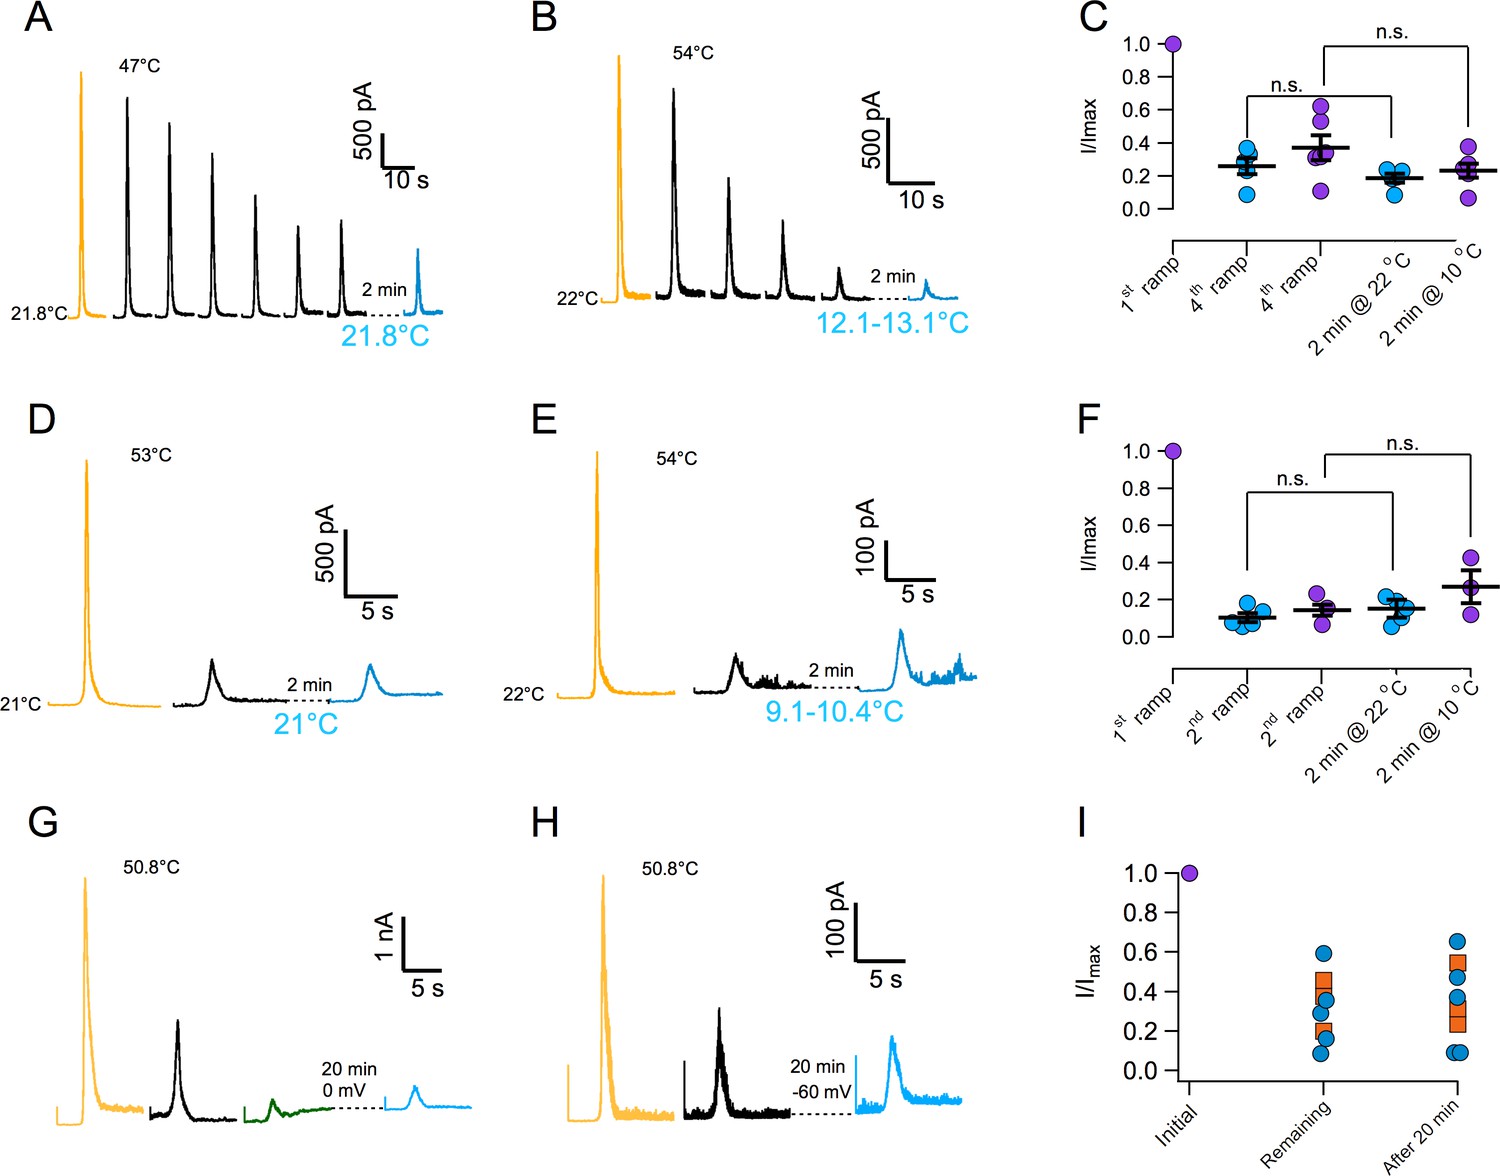
Inactivation of TRPV1 by multiple temperature ramps is irreversible.
(A) In this particular patch, seven consecutive ramps to the temperature indicated were applied with an interval of 30 s to produce ~60% inactivation. The patch was left at the bath temperature (21.8°C) for a 2 min recovery period, after which another identical activation ramp did not elicit a current larger than the residual current after inactivation, indicating absence of recovery from inactivation. (B) Another patch was subjected to five activation ramps that produced ~80% inactivation. This time, during the 2 min recovery period, bath temperature was lowered to between 12 and 13°C. Again, no current was produced by an activation ramp, indicating no recovery. Maximal temperature during the ramp is indicated in each panel. (C) Summary of results from several experiments indicating no recovery of current after a 2 min period at normal bath temperature (~22°C, blue circles) or in a cooled bath (10°C, purple circles). Statistical difference was tested with a Student-t test, n.s. indicates no difference (p>0.2). (D) Similar to (A) but in this patch the current was elicited by a ramp to a larger temperature, indicated in each panel, which produced a larger inactivation in a single ramp (80%). After a 2 min period at 21°C, no current was recovered. (E) Same as in (C) but with a recovery period at 10°C. No recovery of current is evident. (F) Summary of results from several experiments as in (D) and (E) indicating no recovery of current after a 2 min period at normal bath temperature (~22°C, blue circles) or in a cooled bath (10°C, purple circles). Absence of significant recovery was based on a Student t-test with p>0.2. The label n.s. indicates non-significance. (G) No recovery of current is observed with a longer recovery period of 20 min at 0 mV or at −60 mV (H). (I) Summary of recovery of five patches held at 0 mV for 20 min after current inactivation (blue circles) and three patches held at −60 mV for 20 min after current inactivation (orange squares). No current is recovered, regardless of the fraction of inactivated current.
-
Figure 3—source data 1
Raw data for Figures 3C, 3F and 3I.
- https://doi.org/10.7554/eLife.36372.011
Figure 3—figure supplement 1
The presence of ATP fails to affect inactivation or produce recovery from inactivation.
(A) Family of currents elicited by a temperature ramp applied at 30 s intervals in control solutions. Inside-out patch. Current amplitude is reduced with each consecutive ramp. (B) Current vs. temperature plot of the first ramp response from (A), showing the typical hysteretic activation profile of TRPV1 channels. Up-ramp response shown in yellow and down-ramp response in blue. (C) Response of a patch in the presence of 10 mM ATP to the same temperature ramp as in (A), showing the decrease of current with each stimulus. (D) Current vs. temperature plot of the first ramp response from (C), also showing hysteresis. Color code is the same as in (B). (E) Time course of current decay induced by multiple ramps. Two maximum ramp temperatures are shown. Empty symbols are the decay in control solution and filled symbols are the response in the presence of 10 mM ATP. The plot shows the mean ±s.e.m from five control inside-out patches and six patches in the presence of ATP. (F) The presence of ATP did not produce recovery of current after a recovery period of 20 min. Upper panel shows an experiment in which a ramp with a maximum temperature of 50°C applied four times produced a marked inactivation. After 20 min the ramp was re-applied and no current is recovered. Lower panel; summary from three experiments with varying degrees of inactivation, showing that the current is permanently lost, even in the presence of ATP. The color-coding corresponds to the traces in the upper panel. Each patch is shown with a different symbol.
Figure 4
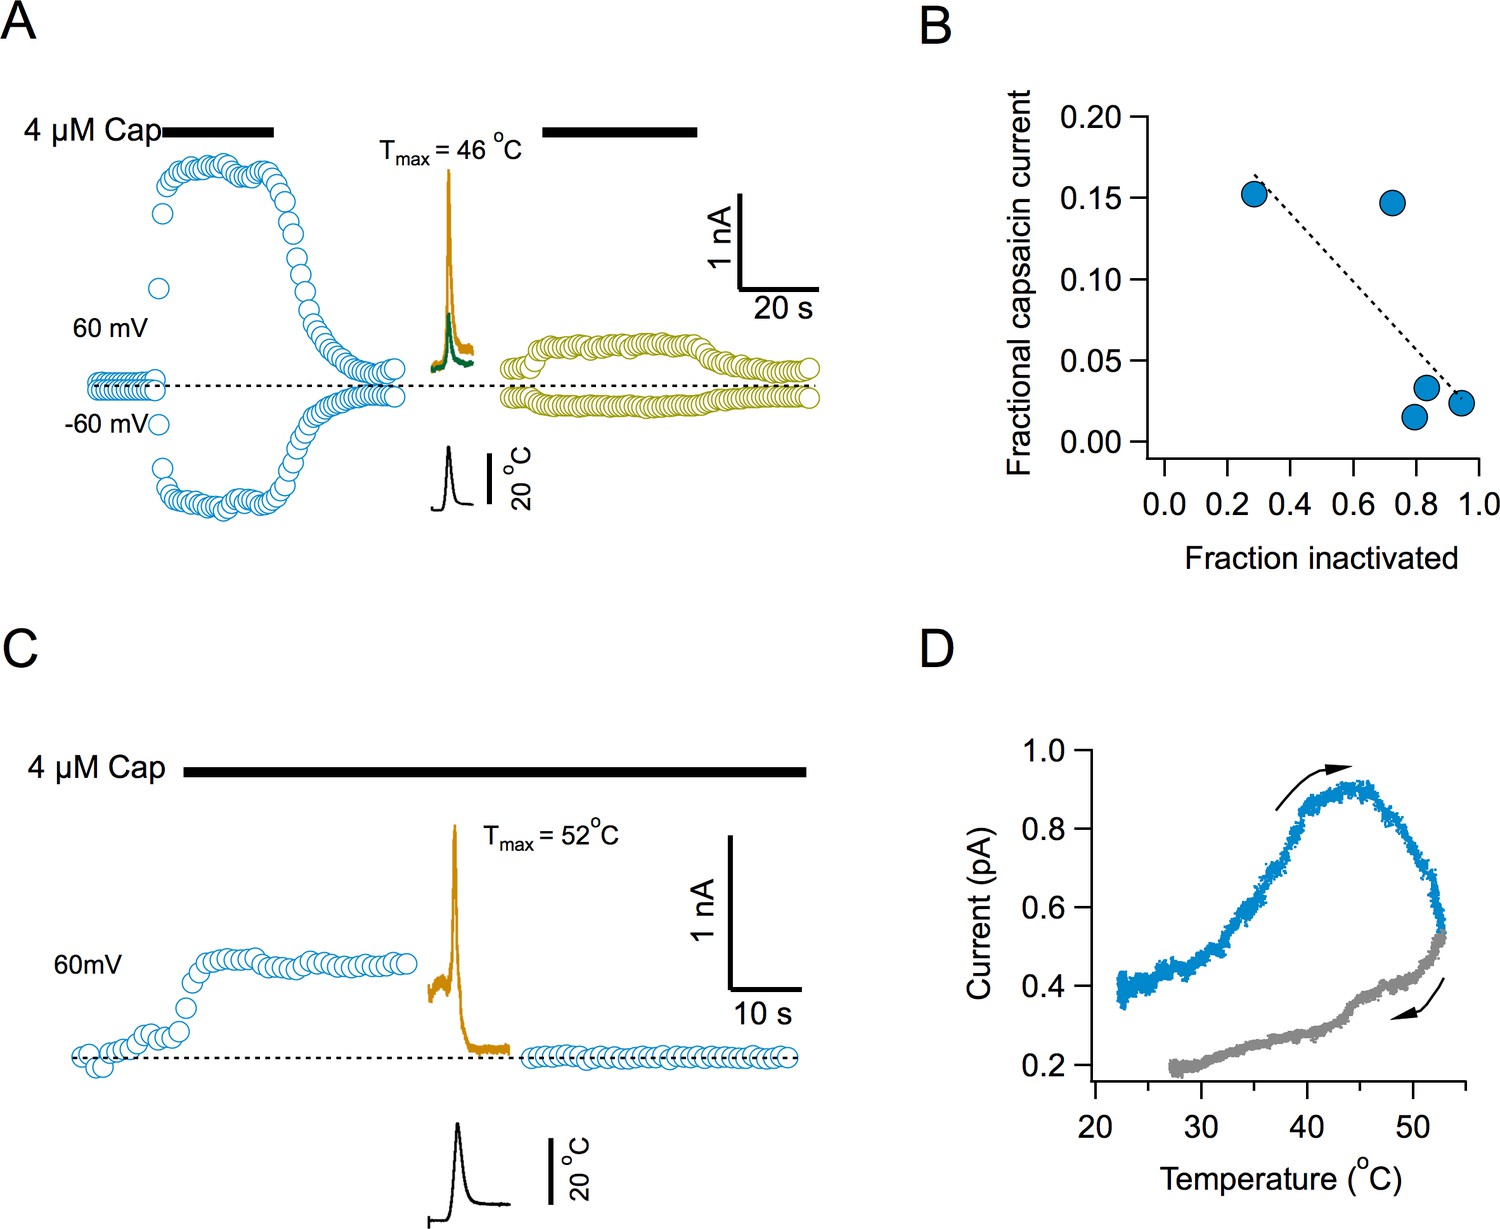
Inactivation by temperature renders the channel irresponsive to activation by capsaicin.
(A) Response of channels in an inside-out patch to application of a saturating concentration of capsaicin before (blue) and after (lemon) application of 4 activation ramps to the indicated temperature (Middle traces, shown are the first and fourth temperature activation ramps, applied between the two applications of capsaicin). (B) Inverse correlation between the degree of inactivation of TRPV1 currents and the response to reapplication of 4 μM capsaicin. The dotted line is a fitted linear function through the data, with a correlation coefficient, r = −0.77. (C) Application of a temperature ramp while the channel is being activated by capsaicin causes loss of current. A saturating concentration of capsaicin was applied to an inside-out patch producing outward currents. A ramp to a high temperature that normally produces inactivation was applied in the continued presence of capsaicin. This ramp produces first an increase of current and an immediate reduction of current to leak levels, indicating current loss. (D) Plot of the current activated by the ramp as a function of temperature, indicating that current starts to decay even as the temperature is still increasing. The arrows indicate the direction of change of temperature.
-
Figure 4—source data 1
Data for Figure 4B.
- https://doi.org/10.7554/eLife.36372.013
Additional files
-
Transparent reporting form
- https://doi.org/10.7554/eLife.36372.014
Download links
A two-part list of links to download the article, or parts of the article, in various formats.
Downloads (link to download the article as PDF)
Open citations (links to open the citations from this article in various online reference manager services)
Cite this article (links to download the citations from this article in formats compatible with various reference manager tools)
Irreversible temperature gating in trpv1 sheds light on channel activation
eLife 7:e36372.
https://doi.org/10.7554/eLife.36372


