Ciliary and rhabdomeric photoreceptor-cell circuits form a spectral depth gauge in marine zooplankton
- Max Planck Institute for Developmental Biology, Germany
- University of Exeter, United Kingdom
- Emory University, United States
- University of Vienna, Austria
- University of Tübingen, Germany
Figures
Figure 1 with 2 supplements
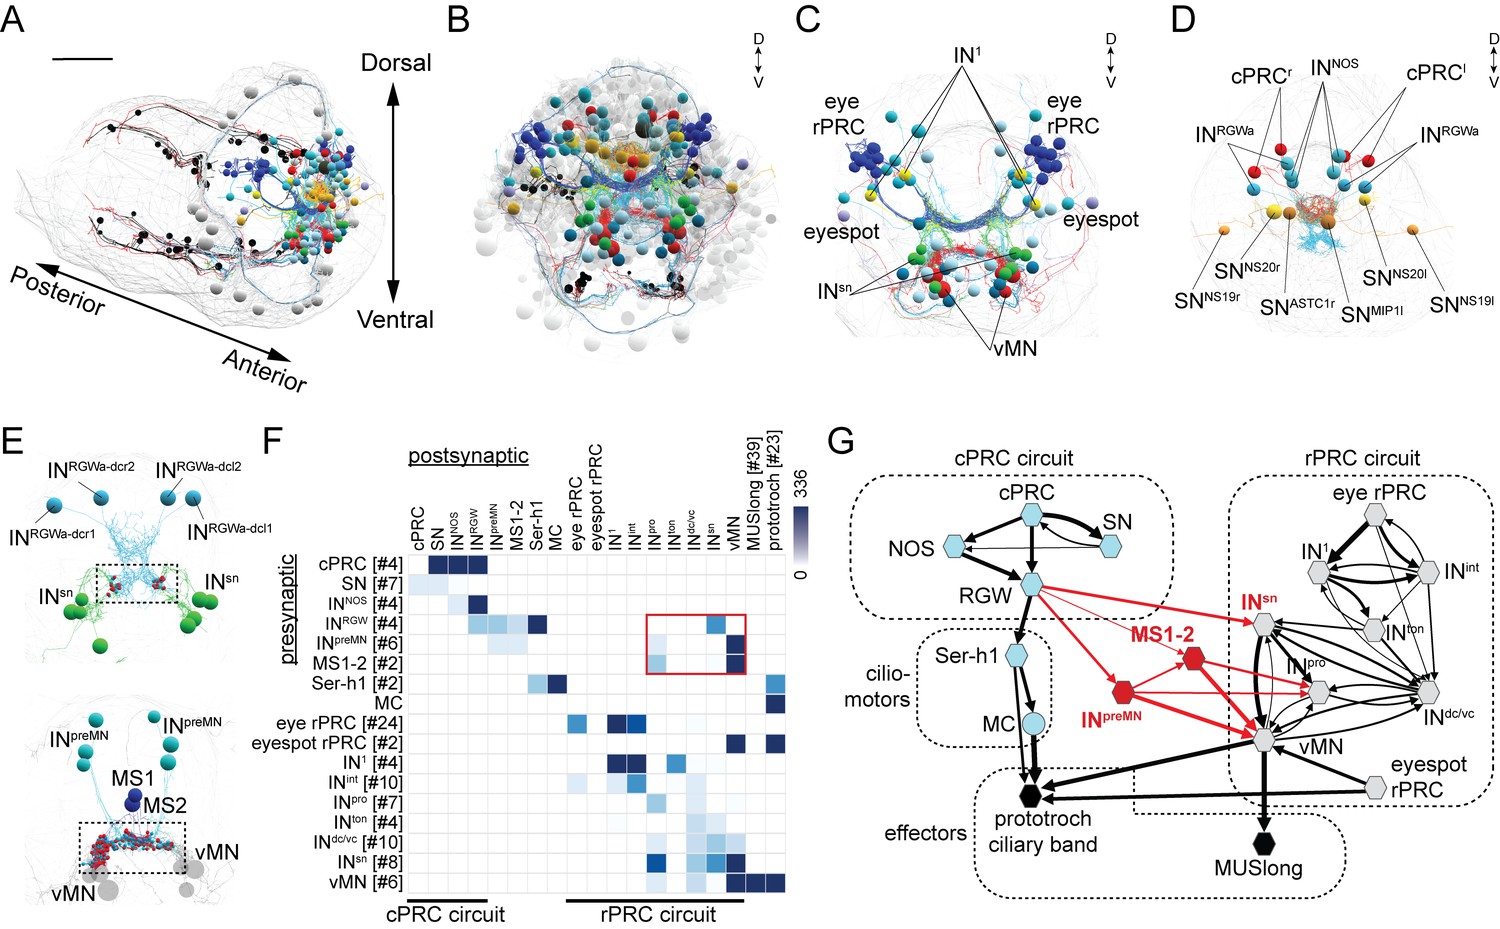
Wiring diagram of cPRC and rPRC circuits in the Platynereis larval head.
(A) All cells of the cPRC and rPRC circuits in the larva (in color). The body outline is shown in grey. (B) All cells of the cPRC and rPRC circuits (in color), anterior view. All other neurons are shown in grey. Circuits were reconstructed from a whole-body ssTEM volume of a 72 hpf larva. (C) All neurons of the rPRC circuit. (D) The four cPRCs and all neurons directly postsynaptic to them. (E) Connections between the cPRC and rPRC circuits. Top panel: the four RGW interneurons (INRGW) are presynaptic to the INsn cells. Bottom panel: the six INpreMN cells and the two MS cells are presynaptic to the ventral motoneurons. (F) Grouped connectivity matrix of the cPRC and rPRC circuits. The connections from the cPRC to the rPRC circuit are outlined in red. (G) Wiring diagram of the cPRC and rPRC circuits. Nodes represent groups of neurons (number indicated in square brackets), arrows represent synaptic connections. Synaptic connections from the cPRC to the rPRC circuit are in red. Edge width is a function of log synaptic count.
-
Figure 1—source data 1
Grouped connectivity matrix of the cPRC and rPRC circuits.
- https://doi.org/10.7554/eLife.36440.006
-
Figure 1—source data 2
Full ungrouped connectivity matrix of the cPRC and rPRC circuits.
- https://doi.org/10.7554/eLife.36440.007
Figure 1—figure supplement 1
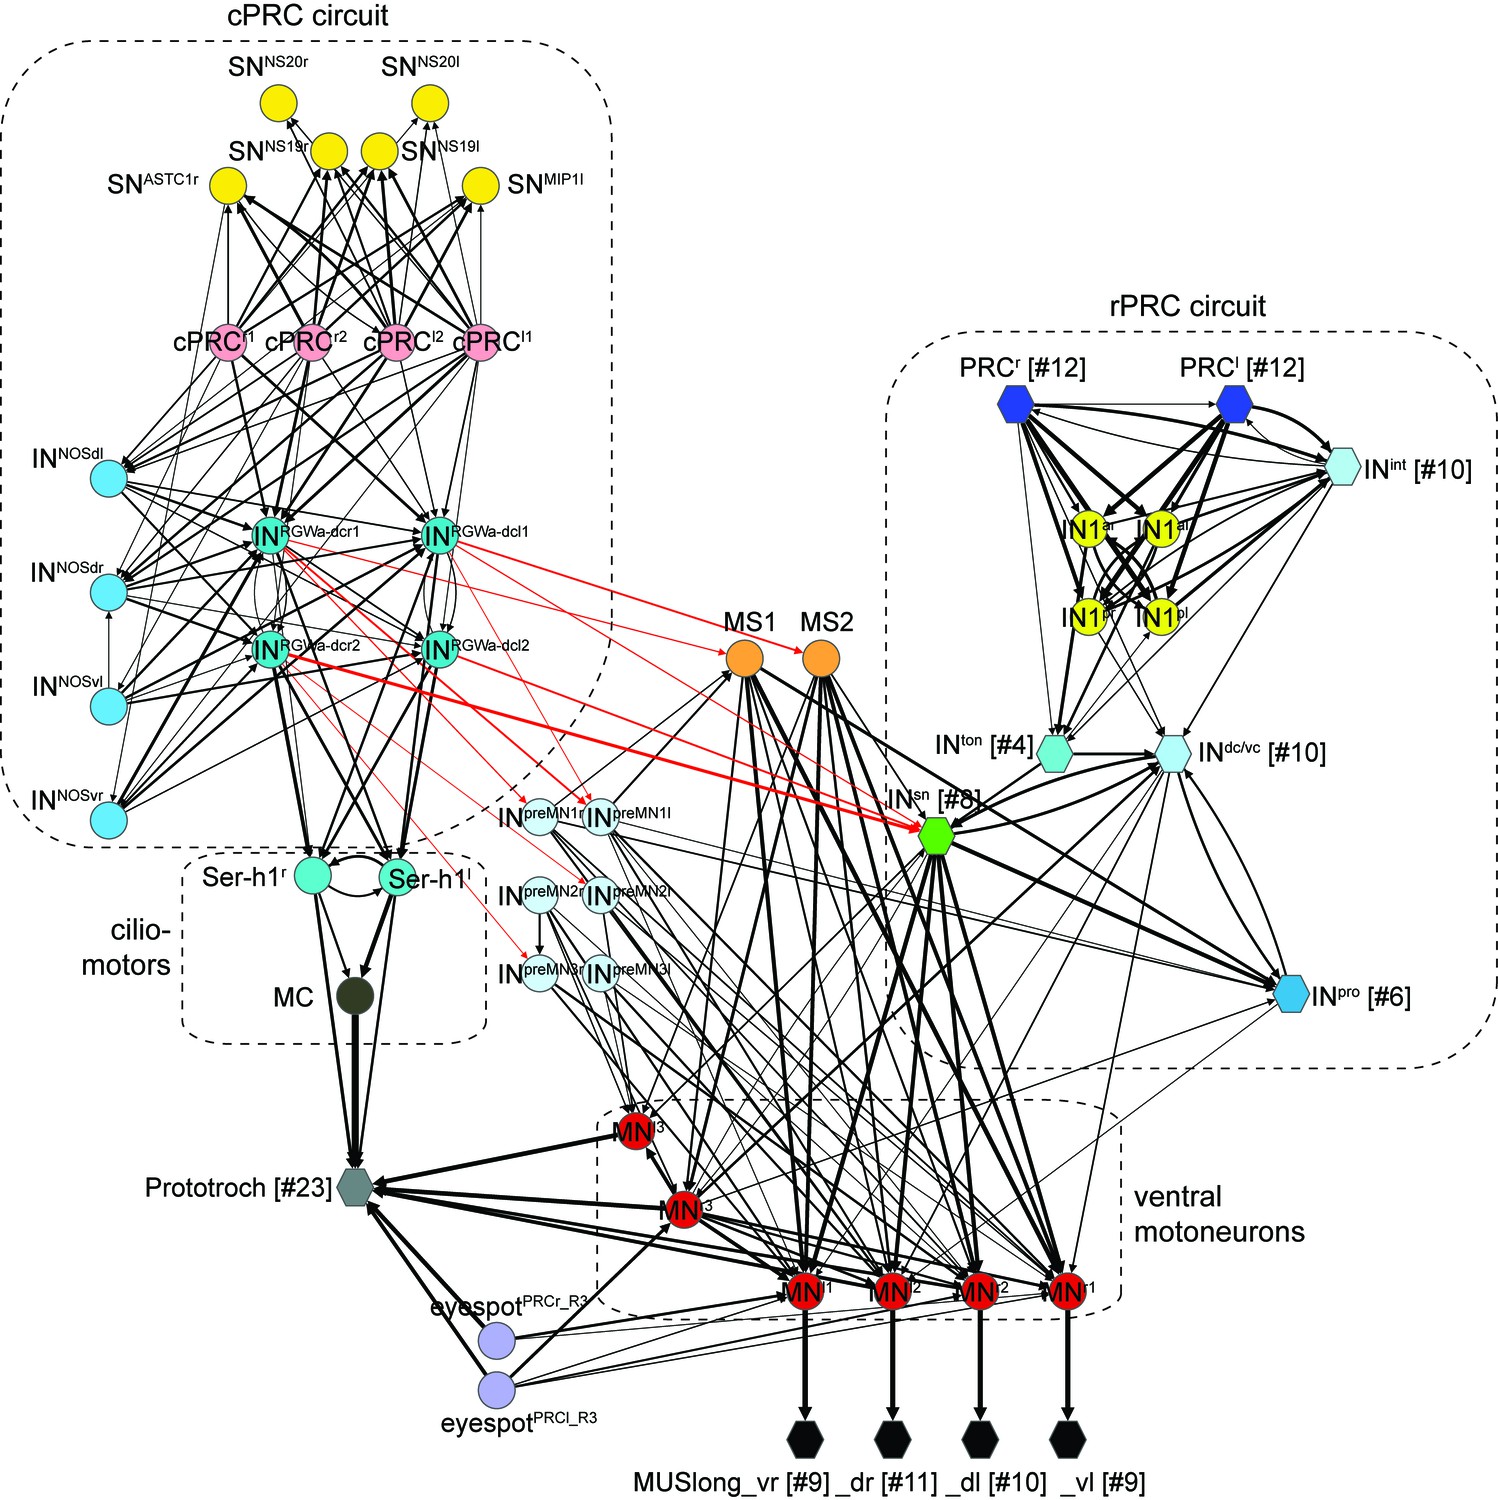
Detailed wiring diagram of the cPRC and rPRC circuits.
Nodes represent single neurons or groups of neurons (number indicated in []), arrows represent synaptic connections. Synaptic connections from the RGW cells to INSN, MS and INpreMN neurons are in red. Edge width is a function of log synaptic count.
Figure 1—figure supplement 2
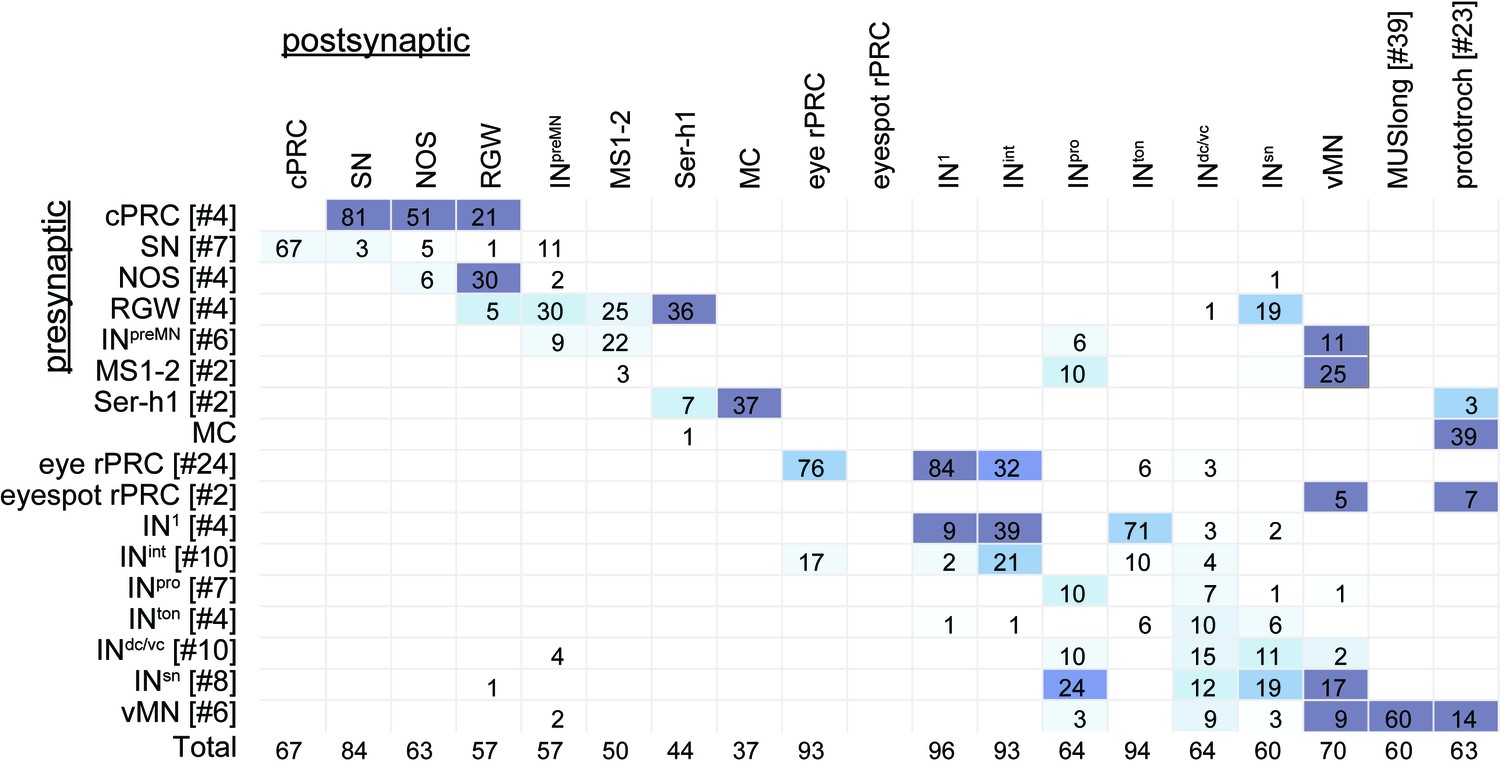
Percent of inputs (number of synapses) from the presynaptic cell to the postsynaptic cell, relative to the total number of inputs.
Data are given for groups of cells. The matrix is the same as in Figure 1F.
Figure 2 with 3 supplements
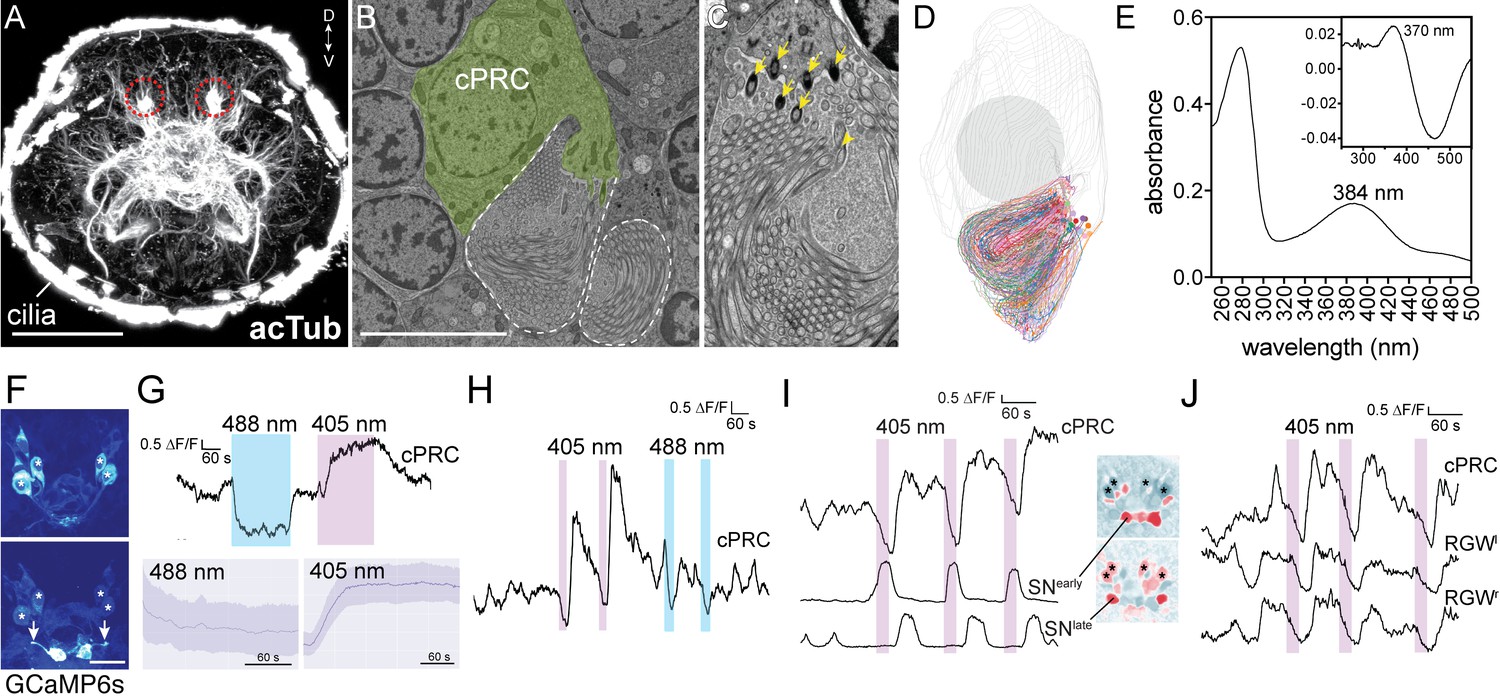
Light responses of brain ciliary photoreceptors and their downstream circuitry in Platynereis larvae.
(A) Acetylated tubulin staining of a 72 hpf larva. The ramified sensory cilia of cPRCs are marked with dashed lines. (B) TEM image of a section with a cPRC. Cell body in green, sensory cilia outlined in dashed white. (C) TEM image of a cPRC with sensory cilia. Yellow arrows mark the basal bodies of a cPRC. (D) Serial TEM reconstruction of the sensory cilia of a cPRC. (E) Absorption spectrum of purified Platynereis c-opsin1. Inset: dark-light difference spectrum. (F) Top: high GCaMP6s signal in the cPRCs during imaging conditions. Asterisks mark cPRC nuclei. Bottom: activation of two sensory neurons (SNearly) upon violet stimulation of cPRCs. (G) Top: representative example of cPRC response to prolonged local 488 nm and 405 nm stimulation. The colored boxes show the duration of the stimulation. Bottom: average cPRC response during continuous 488 nm and 405 nm stimulation. Data show mean and s.d. of mean, 488 nm N = 8, 405 nm N> 30. (H) Responses of a cPRC to repeated 405 nm and 488 nm (duration: 20 s) stimulation. (I) Responses of SNearly and SNlate sensory neurons to cPRC 405 nm stimulation. Correlation images are shown for SNearly and SNlate. Asterisks mark cPRC nuclei. (J) Responses of RGW cells to UV stimulation of a cPRC. Scale bars: (A) 50 μm (B) 10 μm, (F) 20 μm.
-
Figure 2—source data 1
Light and dark-light difference spectrum of Platynereis c-opsin1 and calcium imaging traces for panels G-J.
- https://doi.org/10.7554/eLife.36440.014
Figure 2—figure supplement 1
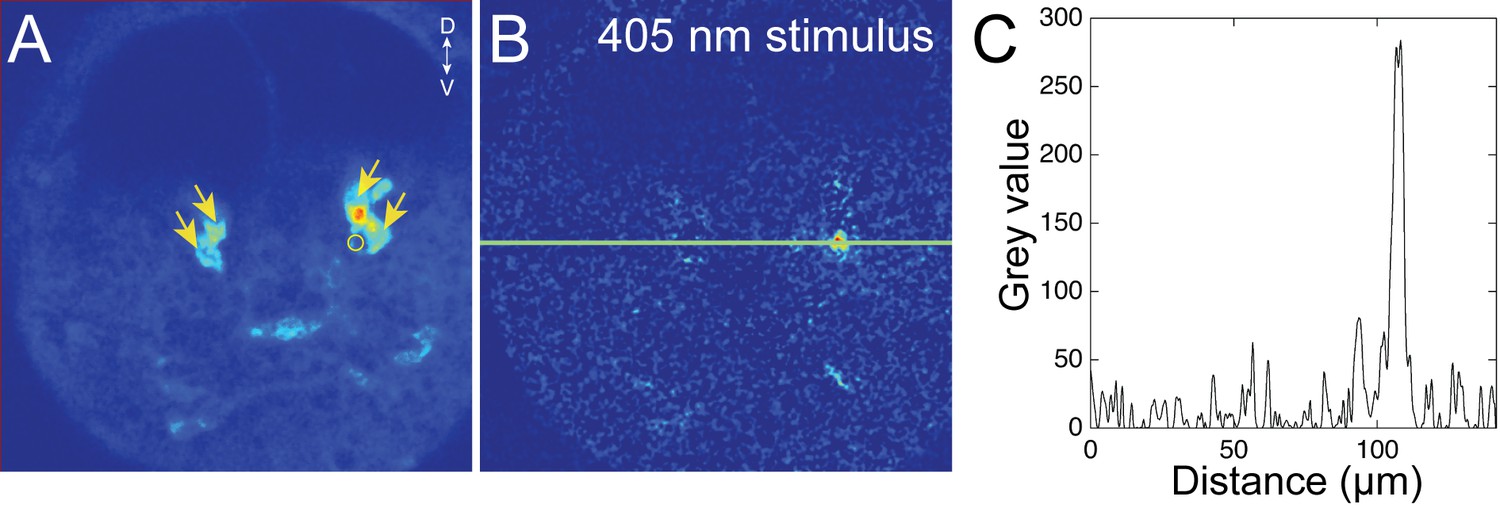
Quantification of stimulus-light intensity during the local stimulation of cPRC cilia.
(A) The four cPRCs (arrows) are recognized based on their high GCaMP6s fluorescence. A region of interest used to deliver the 405 nm stimulation with the independent SIM scanner is shown (circle). (B) Distribution of 405 nm light scattered by the sample. (C) Quantification of signal intensity based on the line shown in (B).
Figure 2—figure supplement 2
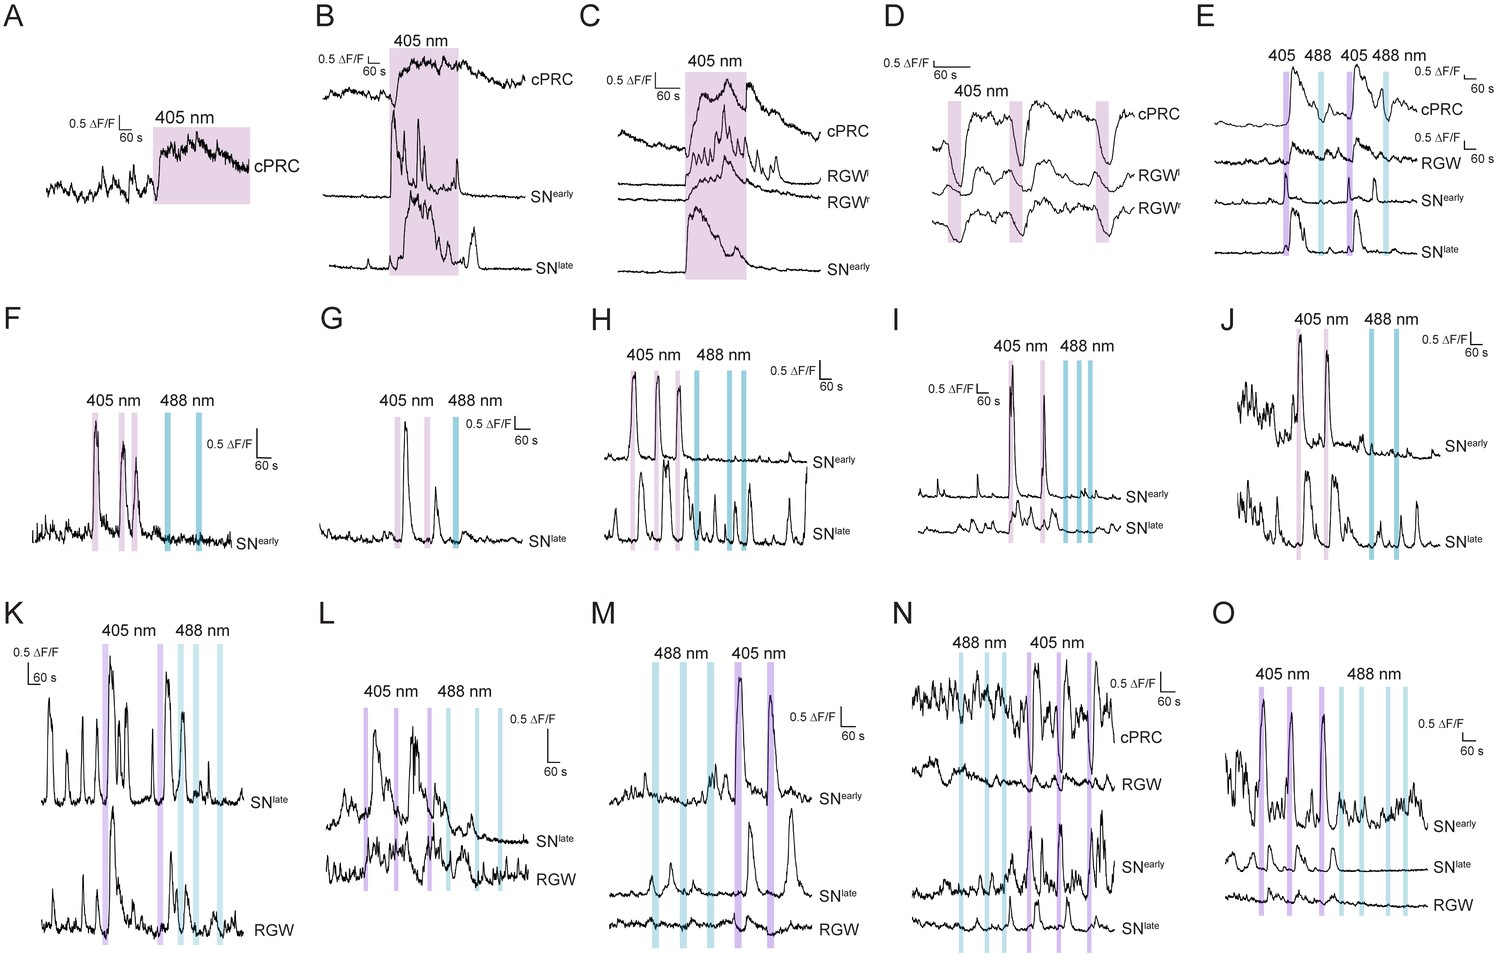
Calcium imaging in Platynereis larvae combined with the stimulation of cPRCs.
(A) cPRC response to prolonged local 405 nm stimulation. (B) Response of a cPRC, an SNearly and an SNlate sensory neuron to prolonged 405 nm stimulation. (C) Response of a cPRC, two RGW interneurons, and an SNearly sensory neuron to prolonged 405 nm stimulation. (D) Responses of a cPRC and two RGW interneurons to repeated 405 nm stimulation of 20 s duration. (E) Responses of a cPRC, RGW, SNearly and SNlate neuron to alternating 405 and 488 nm light. (F) Responses of an SNearly sensory neuron to repeated 405 and 488 nm stimulation. (G) Responses of an SNlate sensory neuron to repeated 405 and 488 nm stimulation. (H–J) Responses of SNearly and SNlate sensory neurons to repeated 405 and 488 nm stimulation. (K–O) Responses of cPRC, RGW, SNearly and SNlate neurons to repeated 405 and 488 nm stimulation. The stimulation in D-O was 20 s.
-
Figure 2—figure supplement 2—source data 1
Source data of Figure 2—figure supplement 2 panels A-I.
- https://doi.org/10.7554/eLife.36440.012
Figure 2—figure supplement 3
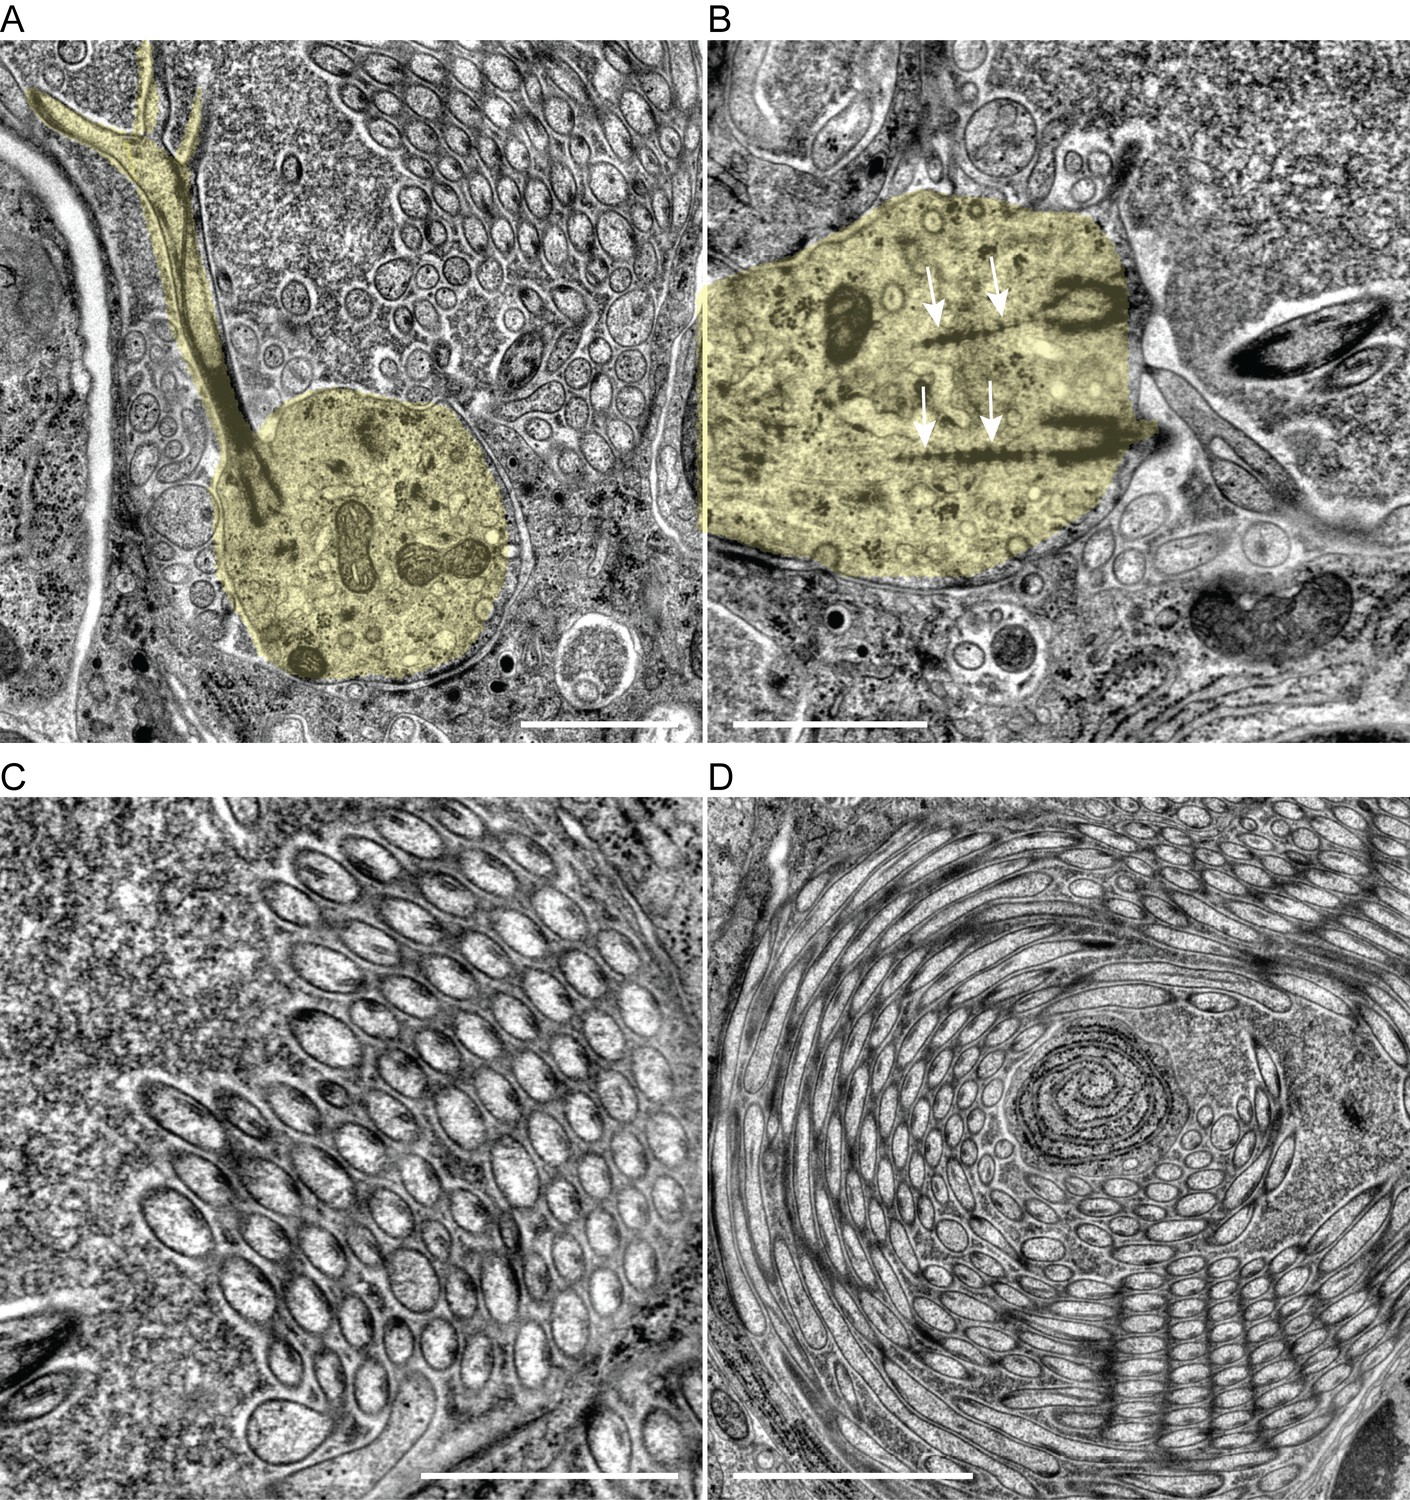
Ultrastructure of cPRCs in a Platynereis larva.
(A) TEM image of the sensory area of a cPRC showing a branching cilium. The sensory dendrite and cilium are highlighted. (B) TEM image showing ciliary roots in a cPRC. The sensory dendrite is highlighted. Arrows point to ciliary roots. (C, D) TEM images showing the curved parallel branches of cPRCs. Each branch is supported by a single microtubule doublet. Scale bars: 1 μm.
Figure 3

UV-violet avoidance and phototaxis form a ratio-chromatic depth gauge in Platynereis larvae.
(A) Larval trajectories recorded in a vertical column in the dark (left) and under illumination with UV light from the side (right). (B) Action spectrum of non-directional light avoidance in 48 hpf larvae (n = 20 batches). (C) Developmental onset of UV-avoidance behavior and phototaxis in Platynereis larvae (n > 7 batches for each stage). (D) Time course (30 s bins) of vertical swimming in different larval stages following 380 nm illumination from above (n > 11 batches for each stage). (E) Action spectrum of vertical swimming in early- and late-stage larvae, under stimulus light coming from the top of the column. The responses between 1.5–3.5 min after stimulus onset are shown (n > 7 batches for each stage). (F) Repeated switching between upward and downward swimming in different larval stages under 380 and 520 nm stimulus light coming from above. The responses between 1.5–4.5 min after stimulus onset are shown (n = 4 batches for 53 hpf, >11 for the other stages). (G) Vertical displacement of 3-day-old larvae swimming in a column and stimulated from above with different ratios of 380/480 nm or 380/660 nm monochromatic light (n > 7 batches for each condition). T-tests with Holm-Sidak correction (alpha = 0.05) were used. Significant differences are indicated (*** p-value<0.005).
-
Figure 3—source data 1
Source data of Figure 3B–G.
- https://doi.org/10.7554/eLife.36440.016
Figure 4
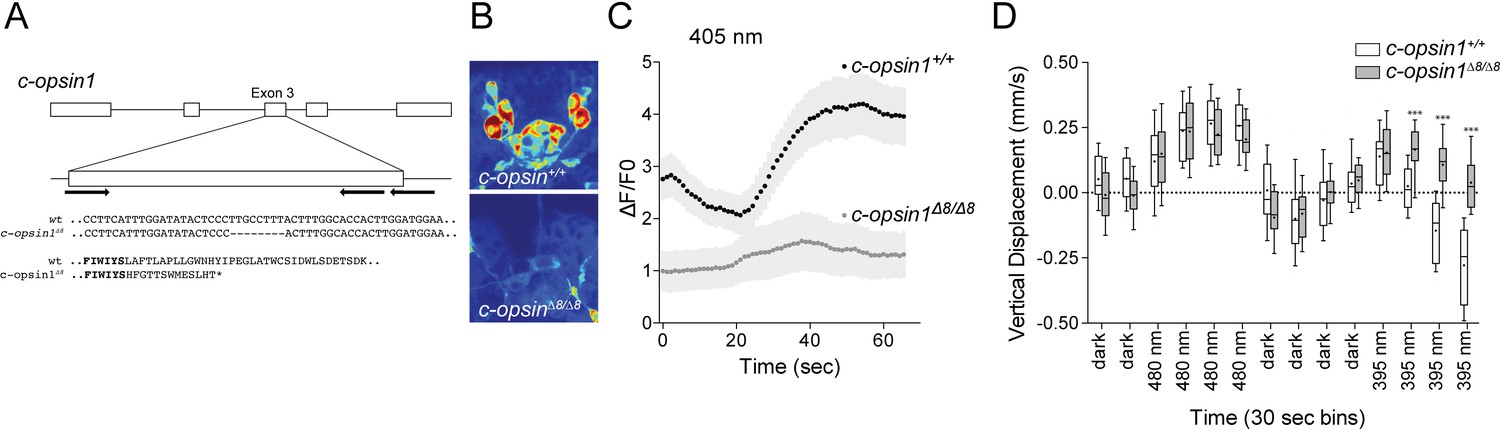
c-opsin1 knockout larvae lack UV-violet responses.
(A) Schematic of the Platynereis c-opsin1 gene and the c-opsin1Δ8/Δ8 mutation. (B) Background GCaMP6s signal during calcium imaging in wild type and c-opsin1Δ8/Δ8 mutant larvae. (C) Calcium responses to 70 s 405 nm stimulation in wild type and mutant larvae (n > 28 individual larvae for both genotypes). The stimulus light was switched on at 0 s. (D) Vertical swimming in wild type and mutant trochophore larvae stimulated with blue (480 nm) and UV (395 nm) light from above (n = 19 for both genotypes). The data are shown in 30 s bins. P-values: ***<0.0001; T-test with Sidak-Bonferroni correction.
-
Figure 4—source data 1
Source data of Figure 4C.
- https://doi.org/10.7554/eLife.36440.019
-
Figure 4—source data 2
Source data of Figure 4D.
- https://doi.org/10.7554/eLife.36440.020
Videos
Video 1
Wiring diagram of cPRC and rPRC circuits in the Platynereis larval head.
The anatomy of the reconstructed neurons is shown together with the position of the same cells in the wiring diagram.
Video 2
Behavioral responses of Platynereis larvae to 380 nm illumination from above.
The magenta square in the top corner marks when the UV stimulus light was switched on. The tracks are color-coded based on heading direction (red, upward; blue, downward). The Video is sped up 2x.
Tables
Key resources table
| Reagent type (species) or resource | Designation | Source or reference | Identifiers | Additional information |
|---|---|---|---|---|
| Strain (Platynereis dumerilii) | c-opsin1Δ8/Δ8 knockout | This paper | Knockout generated by TALEN-induced gene editing | |
| Cell line (Cercopithecus aethiops) | COS1 | RRID:CVCL_0223 | ATCC® CRL1650™ | |
| Transfected construct (Platynereis dumerilii) | pMT5-c-opsin1 | This paper | Expression plasmid | |
| Biological sample (Platynereis dumerilii) | Wild type Tübingen strain | Other | Jékely lab strain (Tübingen, Exeter) | |
| Sequence-based reagent | cops1_F1 | This paper | GACCTACCTCCCAAATAAGTGATG | |
| Sequence-based reagent | cops1_R1 | This paper | CTGTGGCGGACGAGGCTGGCC | |
| Sequence-based reagent | cops1_F2 | This paper | GACCCGTAGCAGCCACTCCC | |
| Sequence-based reagent | cops1_R2 | This paper | GGTCTGGGAGCCCTGATGACTC | |
| Sequence-based reagent | cops1_F3 | This paper | CGCTGGAACTTACCTTTCTGAC | |
| Sequence-based reagent | cops1_R3 | This paper | GCCTTCATTTGGATATACTCCC | |
| Sequence-based reagent | cops1_F4 | This paper | CACCTGCTTATTCATGAAGACG | |
| Sequence-based reagent | cops1_R4 | This paper | GGTGGCTAAAACTGGTGGAAG | |
| Sequence-based reagent | cops1_F5 | This paper | GCTGGCAACTTATGTAAACAAACAG | |
| Sequence-based reagent | cops1_R5 | This paper | CTTTTTTCATTGCAGTTCCGAAG | |
| Sequence-based reagent | TAL_F1 | This paper | TTGGCGTCGGCAAACAGTGG | |
| Sequence-based reagent | TAL_R2 | This paper | GGCGACGAGGTGGTCGTTGG | |
| Sequence-based reagent | cops1_TAL_R1 | This paper | GCCTTCATTTGGATATACTCCCTTG | |
| Sequence-based reagent | cops1_TAL_L2 | This paper | CGCTGGAACTTACCTTTCTGAC | |
| Sequence-based reagent | cops1_del8m_F | This paper | ATACTCCCTTGCCTTTACCACTT | |
| Sequence-based reagent | cops1_del8w_F | This paper | TATACTCCCTTGCCTTTACTTTGG | |
| Sequence-based reagent | cops1_com_R | This paper | CAAGTTTTGTAAGTGAAATTGCATCC | |
| Sequence-based reagent | cops1_ del8_2F | This paper | AGCCTTCATTTGGATATACTCCC | |
| Sequence-based reagent | cops1_del8_2R | This paper | TTATAAACGATGGAACTTACCTTTCTG | |
| Sequence-based reagent | cops1_F1 | This paper | GACCTACCTCCCAAATAAGTGATG | |
| Sequence-based reagent | cops1_R1 | This paper | CTGTGGCGGACGAGGCTGGCC | |
| Sequence-based reagent | cops1_F2 | This paper | GACCCGTAGCAGCCACTCCC | |
| Sequence-based reagent | cops1_R2 | This paper | GGTCTGGGAGCCCTGATGACTC | |
| Sequence-based reagent | cops1_F3 | This paper | CGCTGGAACTTACCTTTCTGAC | |
| Sequence-based reagent | cops1_R3 | This paper | GCCTTCATTTGGATATACTCCC | |
| Sequence-based reagent | cops1_F4 | This paper | CACCTGCTTATTCATGAAGACG | |
| sequence-based reagent | cops1_R4 | This paper | GGTGGCTAAAACTGGTGGAAG | |
| Sequence-based reagent | cops1_F5 | This paper | GCTGGCAACTTATGTAAACAAACAG | |
| Sequence-based reagent | cops1_R5 | This paper | CTTTTTTCATTGCAGTTCCGAAG | |
| Sequence-based reagent | TAL_F1 | This paper | TTGGCGTCGGCAAACAGTGG | |
| Sequence-based reagent | TAL_R2 | This paper | GGCGACGAGGTGGTCGTTGG | |
| Sequence-based reagent | cops1_TAL_R1 | This paper | GCCTTCATTTGGATATACTCCCTTG | |
| Sequence-based reagent | cops1_TAL_L2 | This paper | CGCTGGAACTTACCTTTCTGAC | |
| Sequence-based reagent | cops1_del8m_F | This paper | ATACTCCCTTGCCTTTACCACTT | |
| Sequence-based reagent | cops1_del8w_F | This paper | TATACTCCCTTGCCTTTACTTTGG | |
| Sequence-based reagent | cops1_com_R | This paper | CAAGTTTTGTAAGTGAAATTGCATCC | |
| Sequence-based reagent | cops1_ del8_2F | This paper | AGCCTTCATTTGGATATACTCCC | |
| Sequence-based reagent | cops1_del8_2R | This paper | TTATAAACGATGGAACTTACCTTTCTG | |
| Sequence-based reagent | cops1_nest_seq | This paper | ATGAGACCATACGAAACCAC | |
| Commercial assay or kit | Phusion Human Specimen Direct PCR Kit | Thermofisher | ||
| Commercial assay or kit | mMESSAGE mMACHINE Sp6 kit | Thermofisher | ||
| Commercial assay or kit | Golden Gate TAL Effector Kit 2.0, | Addgene 1000000024 | ||
| Software, algorithm | Fiji | PMID: 22743772 | RRID:SCR_002285 | |
| Software, algorithm | perl and Fiji scripts for tracking | https://github.com/JekelyLab/Veraszto_et_al_2018 (copy archived at https://github.com/elifesciences-publications/Veraszto_et_al_2018) | 0000d2a |
Additional files
-
Transparent reporting form
- https://doi.org/10.7554/eLife.36440.021
Download links
A two-part list of links to download the article, or parts of the article, in various formats.
Downloads (link to download the article as PDF)
Open citations (links to open the citations from this article in various online reference manager services)
Cite this article (links to download the citations from this article in formats compatible with various reference manager tools)
Ciliary and rhabdomeric photoreceptor-cell circuits form a spectral depth gauge in marine zooplankton
eLife 7:e36440.
https://doi.org/10.7554/eLife.36440


