Hair follicle dermal condensation forms via Fgf20 primed cell cycle exit, cell motility, and aggregation
- Institute of Biotechnology, University of Helsinki, Finland
Figures
Figure 1 with 1 supplement
Changes in dermal cell characteristics upon dermal condensation induction.
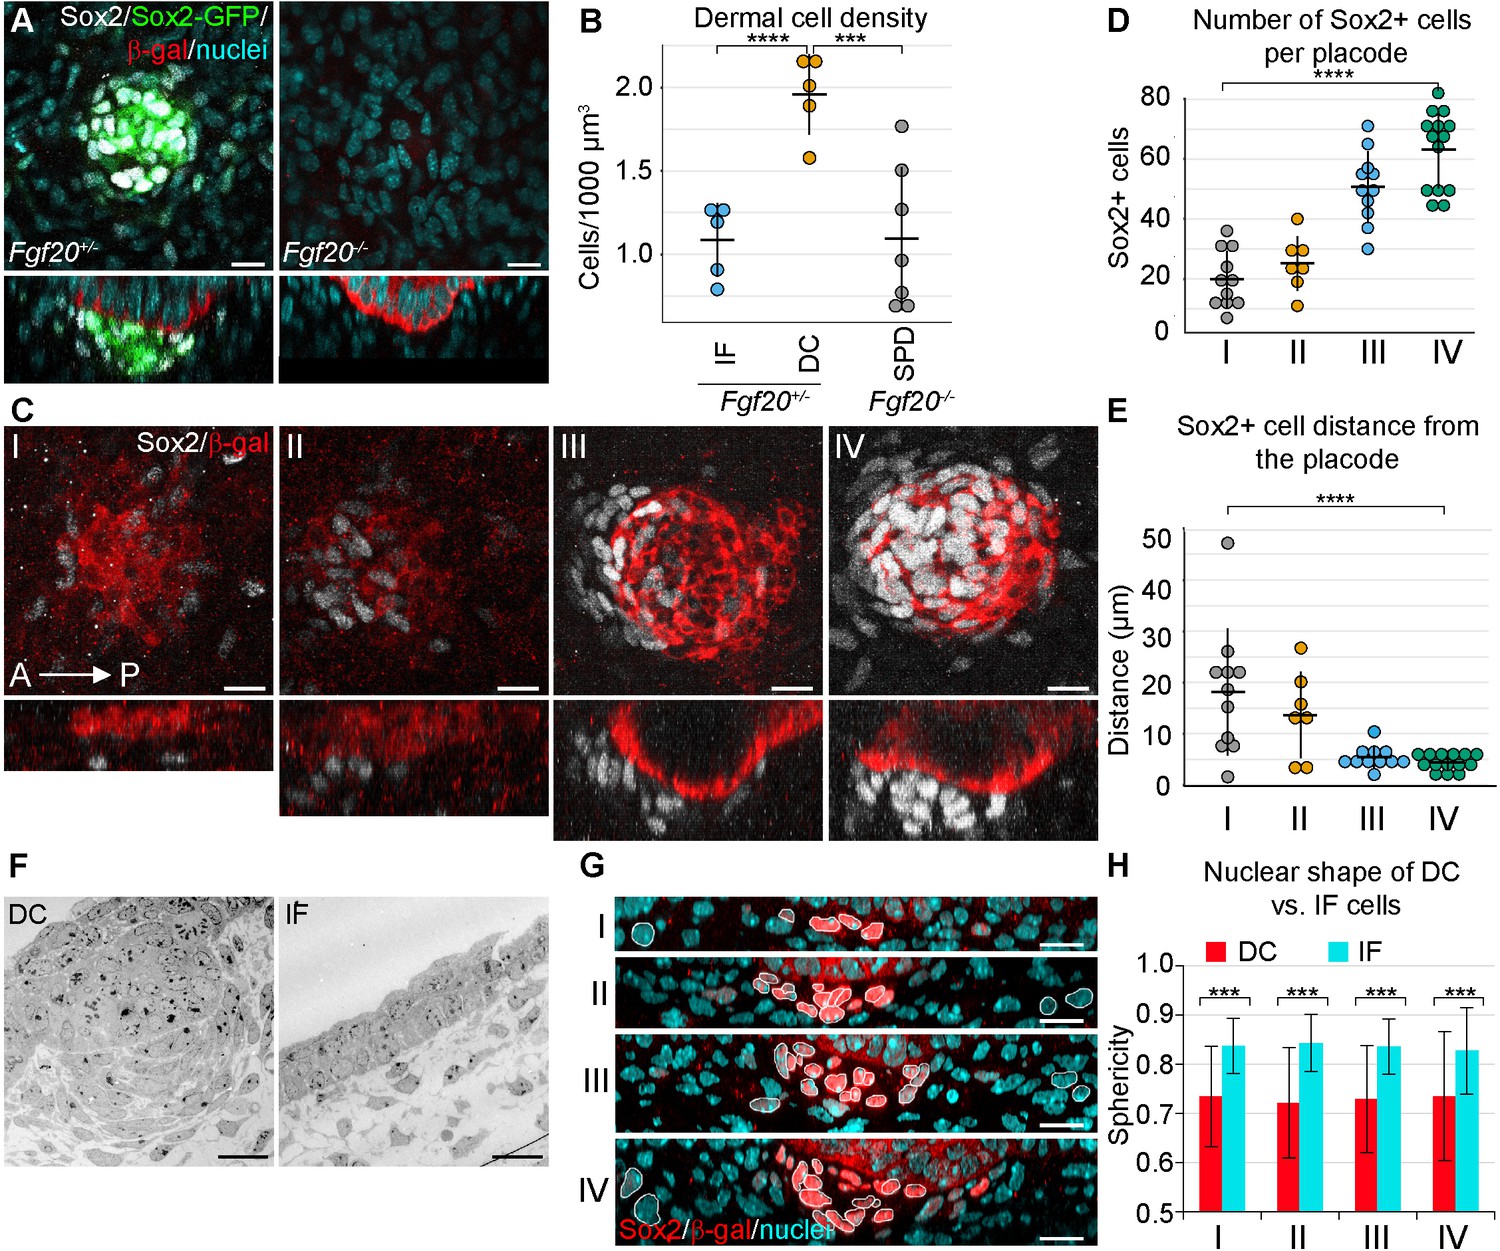
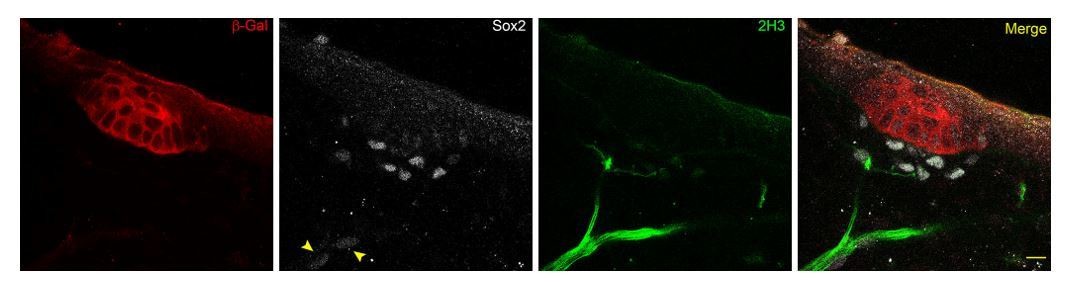
(A) Confocal microscopy immunofluorescent optical sections (planar and sagittal views) of E14.5 control (Fgf20+/-;Sox2-GFP) and Fgf20-/-;Sox2-GFP (green) embryonic skin labelled with antibodies against Sox2+ (white) and β-galactosidase (β-gal, red) to visualize DC and placodes, respectively. Note the absence of Sox2 antibody staining and Sox2-GFP reporter in Fgf20-/- HFs. (B) Quantification of fibroblasts in E14.5 Sox2-GFP DC volume in Fgf20+/- DC and interfolliclular upper dermis (IF) as well as in Fgf20-/- dermis immediately adjacent to placodes (SPD), (n = 5 placodes from two skins Fgf20+/-; n = 6 placodes from two skins Fgf20-/-) unpaired Student’s T-test. (C) Confocal microscopy immunofluorescent optical sections (planar and sagittal views) of Fgf20+/- HF between E13.5 and E14.5, labeled with antibodies against Sox2 (white) and β-Gal (red). Placode morphogenesis was divided into four categories based on advancing development (I–IV). (D) Quantification of Sox2+ cells at each stage of placode morphogenesis (one-way ANOVA, n = 11, 7, 11, 13 placodes from 6, 4, 11, and 8 skins for stages I – IV, respectively). (E) Quantification of the median distance of Sox2+ cells to the nearest placode surface (one-way ANOVA, n = 11, 7, 11, 13 placodes from 6, 4, 11, and eight skins for stages I – IV, respectively) (F) Transmission electron micrographs of E14.5 wild-type skin dermal condensation (DC) and an interfollicular (IF) region. Note the convex nuclei and lack of space between the cells in the DC compared to the non-DC region. (G) Confocal optical sections (sagittal view) of advancing HF morphogenesis (stages I-IV); Sox2+ nuclei (red) are contrasted with Sox2- nuclei (blue); white outlines provide an example of cells compared. (H) Quantification of sphericity of Sox2+ and Sox2- nuclei; significance was assessed using Student’s T-test (nI = 92 and 162 (6 placodes, three skins), nII = 253 and 163 (6 placodes, two skins), nIII = 332 and 217 (6 placodes, two skins), nIV = 125 and 137 (8 placodes, three skins) DC and IF cells, respectively). A, anterior; P, posterior; SPD, sub-placodal dermis. Error bars represent standard deviation (SD). *p≤0.05; **p≤0.01; ***p≤0.001; ****p≤0.0001. Scale bar = 10 µm. See also Figure 1—video 1 and Figure 1—source data 1.
-
Figure 1—source data 1
Values for quantification of morphological analysis of DC.
Values for quantification of cell density in Fgf20+/- DC, Fgf20+/- IF, and Fgf20-/- sub-placodal dermis (Figure 1B). Values for quantification of Sox2+ cell number in stages I, II, III, and IV (Figure 1D). Values for quantification of Sox2+ cell distance to nearest placode surface in stages I, II, III, and IV (Figure 1E). Values for quantification of nuclear sphericity of Sox2+ (DC) and IF cells in stages I, II, III, and IV (Figure 1H).
- https://doi.org/10.7554/eLife.36468.004
Figure 1—video 1
Cell shapes of DC cells and non-DC fibroblasts at placode stage IV.
3D renderings of Sox2+ DC cells (white) and non-DC (Sox2-) fibroblasts (blue) based on the expression of membrane-bound Tomato. Selected DC cells (red) are contrasted with selected non-DC fibroblasts (yellow). Note the convex shape of the DC cells compared to the more round non-DC fibroblasts. See also Figure 1.
Figure 2 with 1 supplement
Dermal condensation cells acquire Sox2 expression de novo and populate the DC upon Sox2 acquisition.
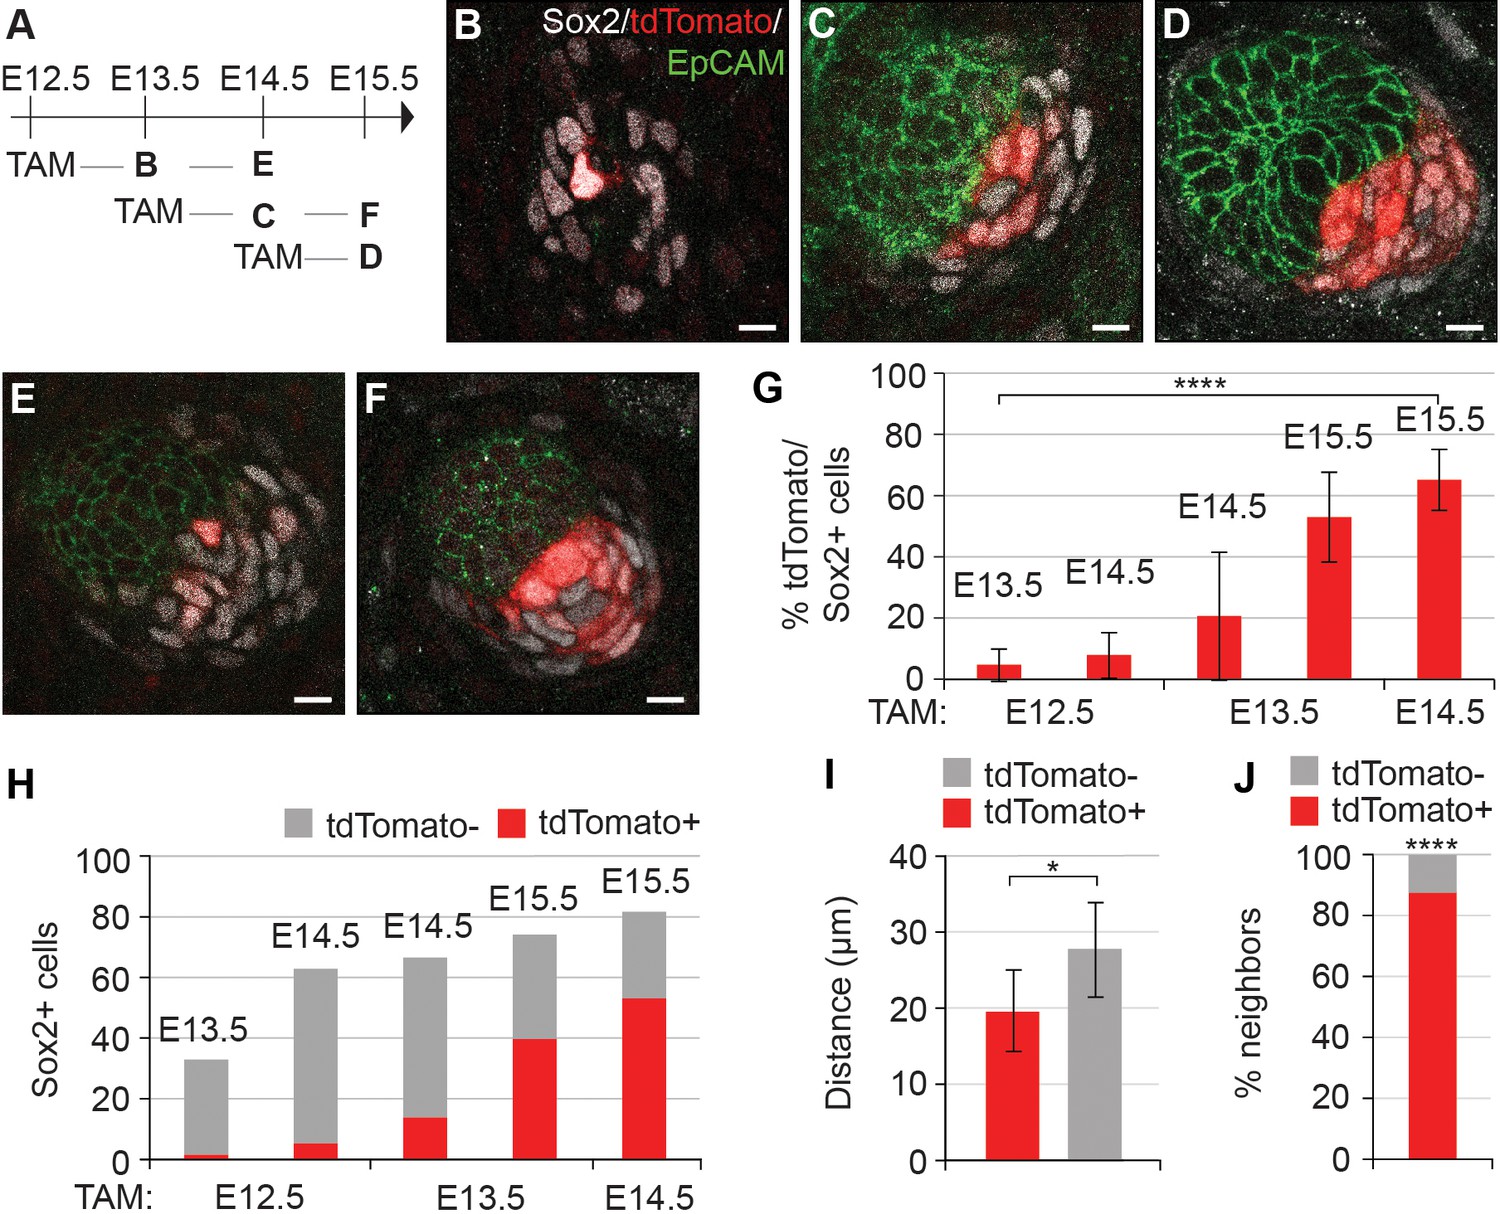
(A) Scheme of tamoxifen (TAM) injection and analysis. A single labeling dose of TAM was administered to pregnant dams at E12.5, E13.5, or E14.5. (B–F) Confocal microscopy immunofluorescent optical sections (planar view) of Sox2creERT;R26RtdTomato skins immunolabeled with Sox2 (white), tdTomato label (red), and EpCAM (green) at 24 or 48 hr after TAM administration (n > 4 injections; E12.5 + 24 hr, n = 23 DCs from nine skins; E12.5 + 48 hr, n = 23 DCs from seven skins; E13.5 + 24 hr, n = 33 DCs from 11 skins; E13.5 + 48 hr, n = 23 DCs from eight skins; E14.5 + 24 hr, n = 21 DCs from nine skins). (B) E12.5 + 24 hr resulted in very few labeled Sox2 cells. (C) E13.5 + 24 hr showed increased labeling of Sox2+ cells. (D) TAM induction at E14.5 resulted in a majority of Sox2+ cells labeled within 24 hr. (E) E12.5 + 48 hr resulted in a low number of tdTomato+, Sox2+ cells. (F) E13.5 + 48 hr resulted in a large number of Sox2+ cells labeled with tdTomato. (G) Quantification of Sox2+ cells positive for tdTomato label at indicated time points; significance was assessed with one-way ANOVA. (H) Quantification of the average number of tdTomato+ cells as part of the whole Sox2+ cell population (E12.5 + 24 hr=2 of 33 cells; E12.5 + 48 hr=5 of 63 cells; E13.5 + 24 hr=14 of 67 cells; E13.5 + 48 hr=40 of 74 cells; E14.5 + 24 hr=53 of 82 cells). (I) Quantification of the distance of tdTomato+ and tdTomato- (n = 11 placodes from four skins) Sox2+ cells from placode surface, significance was assessed with Student’s T-test. (J) Nearest neighbor analysis of Sox2+ cells for tdTomato label (87.7%) vs unlabeled (12.2%) at E15.5 (n = 635), significance was assessed with Chi-square test. Error bars represent SD. *p≤0.05; ****p≤0.0001. Scale bar = 10 µm. See also Figure 2—source data 1 and Figure 2—figure supplement 1.
-
Figure 2—source data 1
Values for quantification of Sox2 lineage tracing in primary placodes.
Values for quantification of percent of Sox2+ cells labeled with tdTomato (Figure 2G). Values for quantification of numbers of Sox2+ cells and tdTomato+,Sox2+ cells (Figure 2H). Values for quantification of distance of tdTomato+,Sox2+ and tdTomato-,Sox2+ cells to center of placode surface adjacent to DC at E14.5-> E15.5 (Figure 2I). Values for quantification of nearest neighbor of tdTomato+,Sox2+ cells in E14.5- > E15.5 (Figure 2J).
- https://doi.org/10.7554/eLife.36468.009
Figure 2—figure supplement 1
Secondary HF DC gain Sox2 expression de novo.
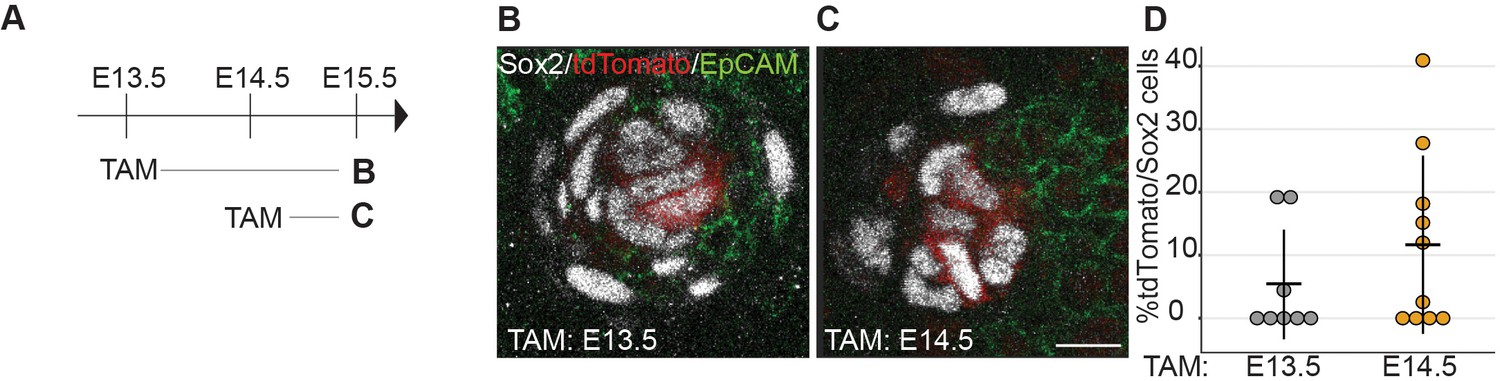
(A) Scheme of tamoxifen (TAM) injection and analysis. A single labeling dose of TAM was administered to pregnant dams at E13.5, or E14.5. (B, C) Confocal optical section of secondary DCs from Sox2CreERT;R26RtdTomato/+ skins at E15.5; tdTomato (red), and labelled with antibodies against Sox2 (white), EpCAM (green) from E13.5 (B), and E14.5 (C) tamoxifen injection. E13.5 + 48 hr resulted in very few labeled Sox2 cells. (C) E14.5 + 24 hr showed labeling of more Sox2 cells. (D) Quantification of percent tdTomato labeled Sox2+ cells (n = 2 injections per time point, E13.5 + 48 hr, n = 8 DCs from five skins and E14.5 + 24 hr, n = 10 DCs from six skins). Error bars represent SD. Scale bar = 10 µm. See also Figure 2—figure supplement 1—source data 1 and Figure 2.
-
Figure 2—figure supplement 1—source data 1
Values for quantification of Sox2 lineage tracing in secondary placodes.
Values used in quantification of percent Sox2+ cells also positive for tdTomato (Figure 2—figure supplement 1D).
- https://doi.org/10.7554/eLife.36468.008
Figure 3 with 1 supplement
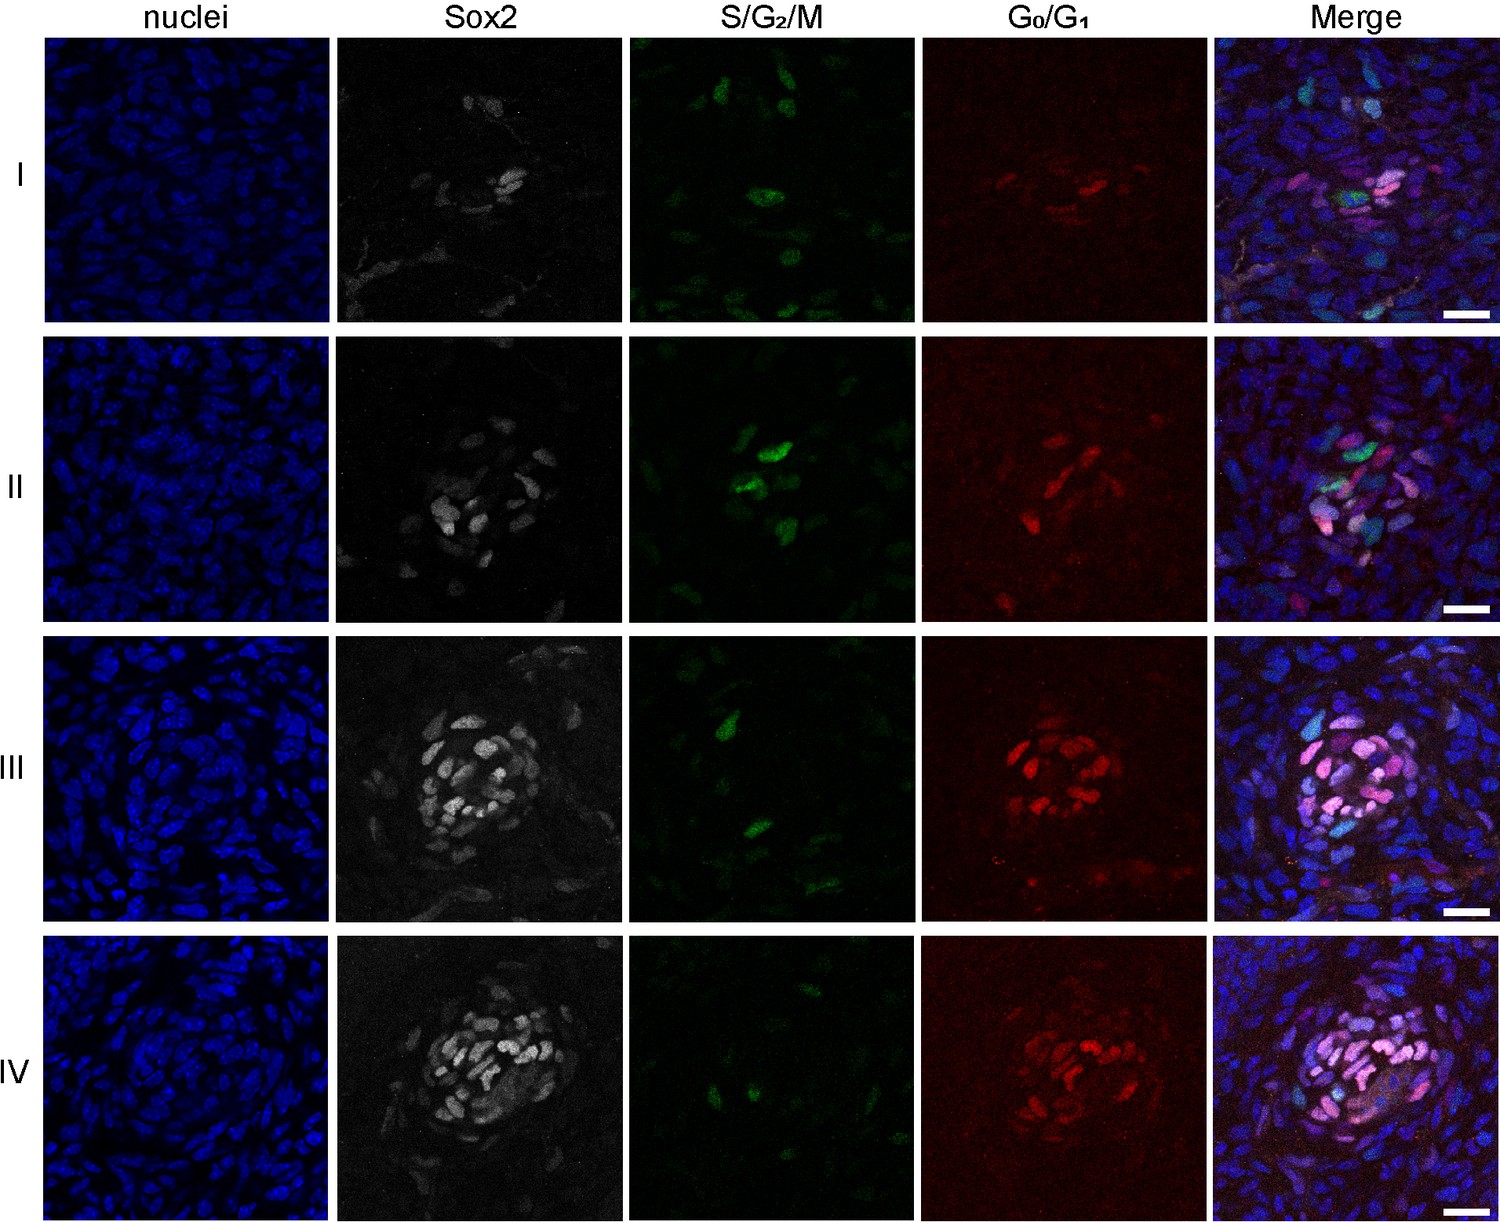
Dermal condensation cells exhibit cell cycle exit.
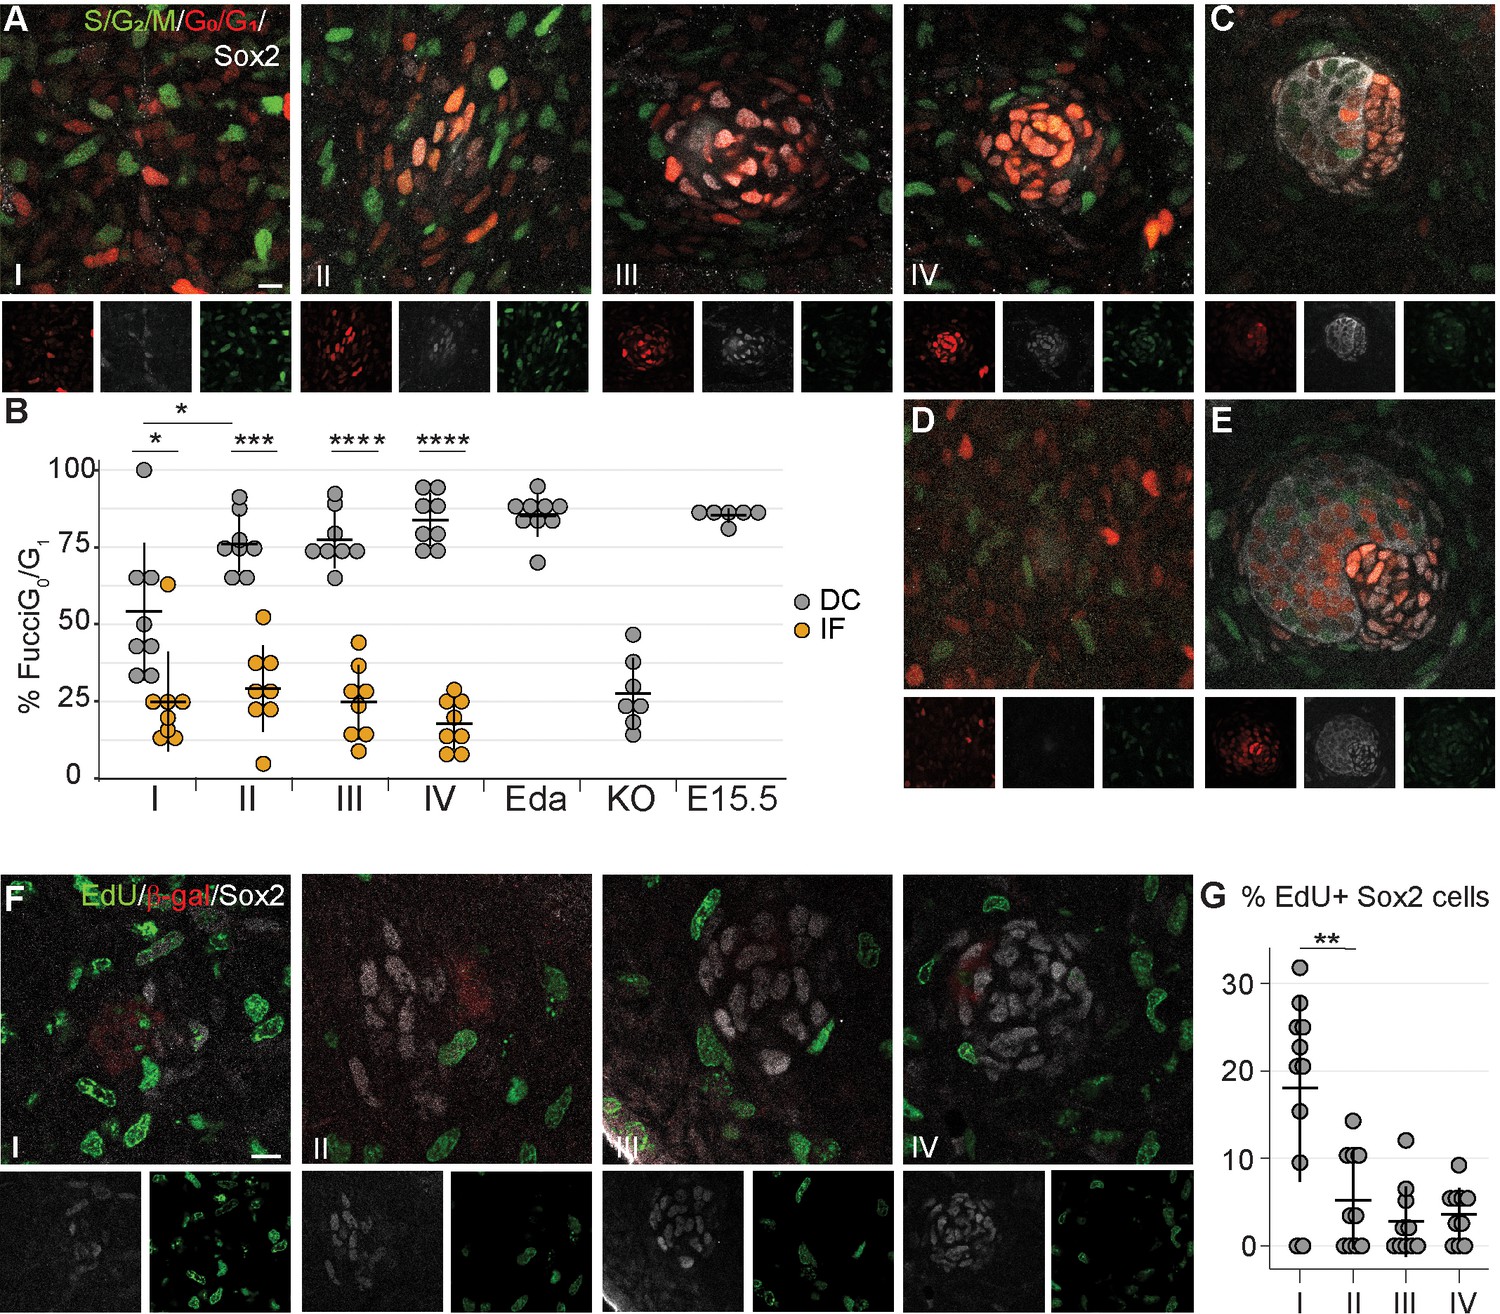
(A, C–E) Confocal microscopy optical planar sections of Fgf20+/-;Fucci (G1 red; S/G2/M green) skins at indicated stages of HF placode morphogenesis (I–IV) were labeled with antibodies against β-Gal (cytoplasmic white) and Sox2 (nuclear white). (A) The Sox2+ nuclei were scored as red, green, both, or neither and compared to the interfollicular Sox2- fibroblasts (n = eight placodes per stage from seven, four, five, and five skins in stages I, II, III, and IV, respectively). (B) Quantification of percent Sox2+ (DC) cells and Sox2- (IF) fibroblasts in G0/G1 phase during HF placode morphogenesis (I–IV), in E14.5 K14-Eda (Eda), in E14.5 Fgf20-/- (KO), and in E15.5 Fgf20+/- (E15.5), paired Student’s T-test. (C–E) Expression of Fucci transgenes in (C) E15.5 control DCs (n = nine placodes from four skins), (D) E14.5 Fgf20-/- dermis immediately adjacent to the placode (n = seven placodes from three skins), and (E) E14.5 K14-Eda (n = six placodes from two skins) DCs. (F) Confocal microscopy optical planar sections of Fgf20+/- skins at indicated stages of HF placode morphogenesis (I–IV). Embryos were subjected to 2 hr EdU pulse in utero prior to sacrifice. Skins were treated with Click-It detection to visualize EdU-positive cells (green) and immunolabeled with Sox2 (white) and β-gal (red, not shown). (G) Quantification of EdU-positive Sox2 DC cells (nI = 11 placodes from three skins, nII = 10 placodes from five skins, nIII = 10 placodes from five skins, nIV = 11 placodes from five skins). *, p≤0.05; ***, p≤0.001 ****, p≤0.0001. Error bars represent SD. Scale bar = 10 µm. See also Figure 3—source data 1.
-
Figure 3—source data 1
Values for quantification of cell cycle analysis during DC morphogenesis.
- https://doi.org/10.7554/eLife.36468.012
Figure 3—figure supplement 1
R26Fucci2aR expression during DC morphogenesis.
Confocal optical section of DC during DC morphogenesis (stages I-IV) from R26Fucci2aR;Fgf20+/- skins immunolabeled with Sox2 (white). Red represents G0/G1 phase while green represents S/G2/M phase of the cell cycle.
Figure 4 with 2 supplements

Dermal condensate formation is driven by directed migration of dermal fibroblasts.
(A) Maximum intensity projections of indicated time points from live confocal imaging of E13.75 Sox2-GFP; FuccimKOskins. (B) Representative 2D plots of movement tracks of condensate forming (left) or IF (right) cells that are initially >30 µm (grey) and <30 µm (red) from the DC center. (C) Vectors of escape angles (the angle between cell trajectory in respect to center of the DC/interfollicular area and endpoint of trajectory) of cells that were initially >30 µm (left, n = 49 cells from eight placodes, images from six skin explants) and <30 µm (center, n = 127 cells from eight placodes, images from six skin explants) from the DC center, and interfollicular cells (right, n = 97 cells from eight placodes, images from six skin explants). Condensate-forming cells initially >30 µm from condensate center preferentially migrate toward condensate center (median 22°) whereas condensate-forming cells initially <30 µm from the center (median 48°) and interfollicular (median 68°) cells show no preferential direction of movement. Watson’s U2 test shows a significant difference in escape angles in DC cells initially further away (>30 µm) from DC center versus interfollicular cells (p<0.001) or DC cells initially close (<30 µm) to the DC center (p<0.05). (D–F) Distribution of (D) cell velocity, (E) straightness, and (F) net velocity during DC formation. Significance was assessed with Mann-Whitney test. Condensate forming cells migrating initially >30 µm away from the DC center migrate faster than condensate-forming cells initially close (<30 µm) to the DC center (p=0.0022) and interfollicular cells (0.0051), but no difference was observed in track straightness (p=0.8945 and p=0.2376, respectively) or net velocity (p=0.5949 and p=0.139, respectively) between the groups. n.s., not significant; *p≤0.05; **p≤0.01; ***p≤0.001. Error bars represent SD. See also Video 1, Figure 4—source data 1, and Figure 4—figure supplement 1.
-
Figure 4—source data 1
Values used for quantification of Sox2+ cell and IF fibroblast movement.
- https://doi.org/10.7554/eLife.36468.018
Figure 4—figure supplement 1
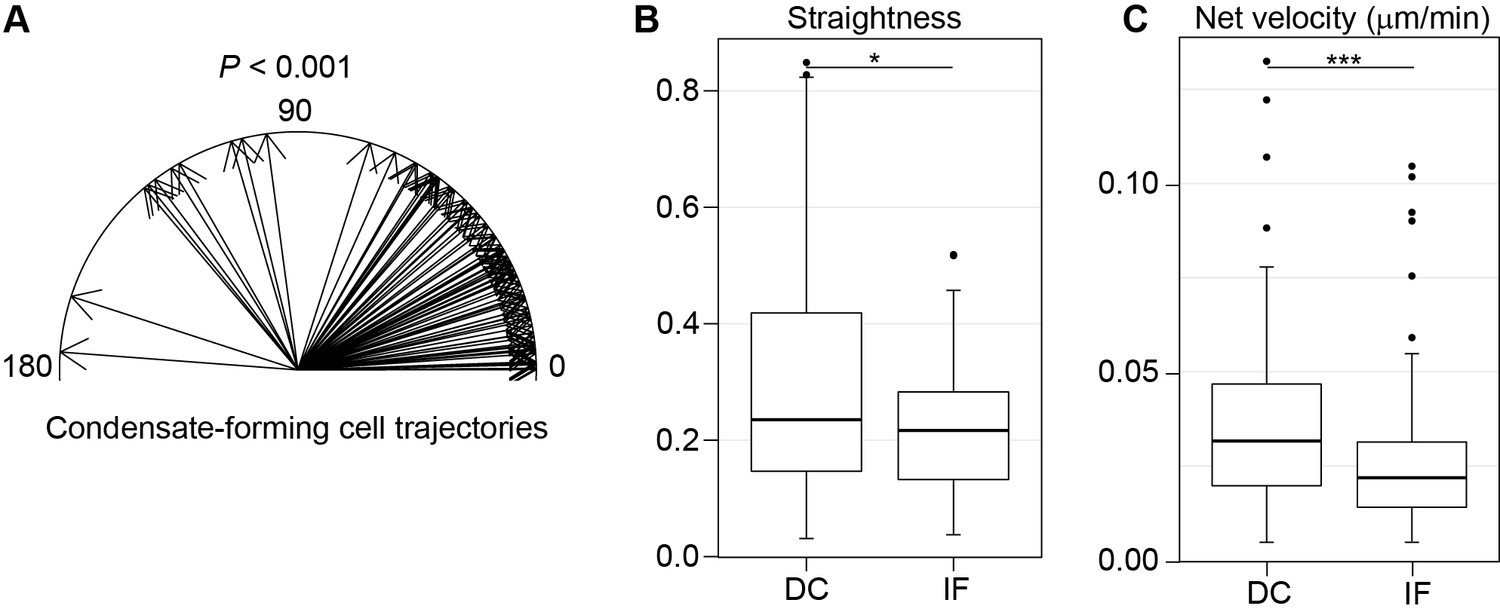
Condensate forming cells show directed migration before DC entry.
(A) 2D plot of escape angles of condensate-forming cells until entry to DC. Cell movement showed preferential movement toward condensate center (median 27.7°) and this directionality was significantly different from the IF cell migration (see Figure 4) (ncells = 80 and 97 DC and IF, respectively, from eight placodes images from six skin explants, Watson’s U2 test). (B) Distribution of straightness of cell tracks. Condensate-forming cells migrate on a straighter track than interfollicular cells (Mann-Whitney test). (C) Distribution of net velocities. Condensate-forming cells display higher net velocity than interfollicular cells (Mann-Whitney). *, p≤0.05; ***, p≤0.001. Error bars represent SD. See also Figure 4—figure supplement 1—source data 1 and Figure 4.
-
Figure 4—figure supplement 1—source data 1
Values used for quantification of Sox2+ cell movement until entry into DC.
Values used to quantify the escape angle (Figure 4—figure supplement 1A), track straightness (Figure 4—figure supplement 1B), and net velocity (Figure 4—figure supplement 1C) of Sox2+ cells before entry into the DC and the IF fibroblasts.
- https://doi.org/10.7554/eLife.36468.015
Figure 4—figure supplement 2
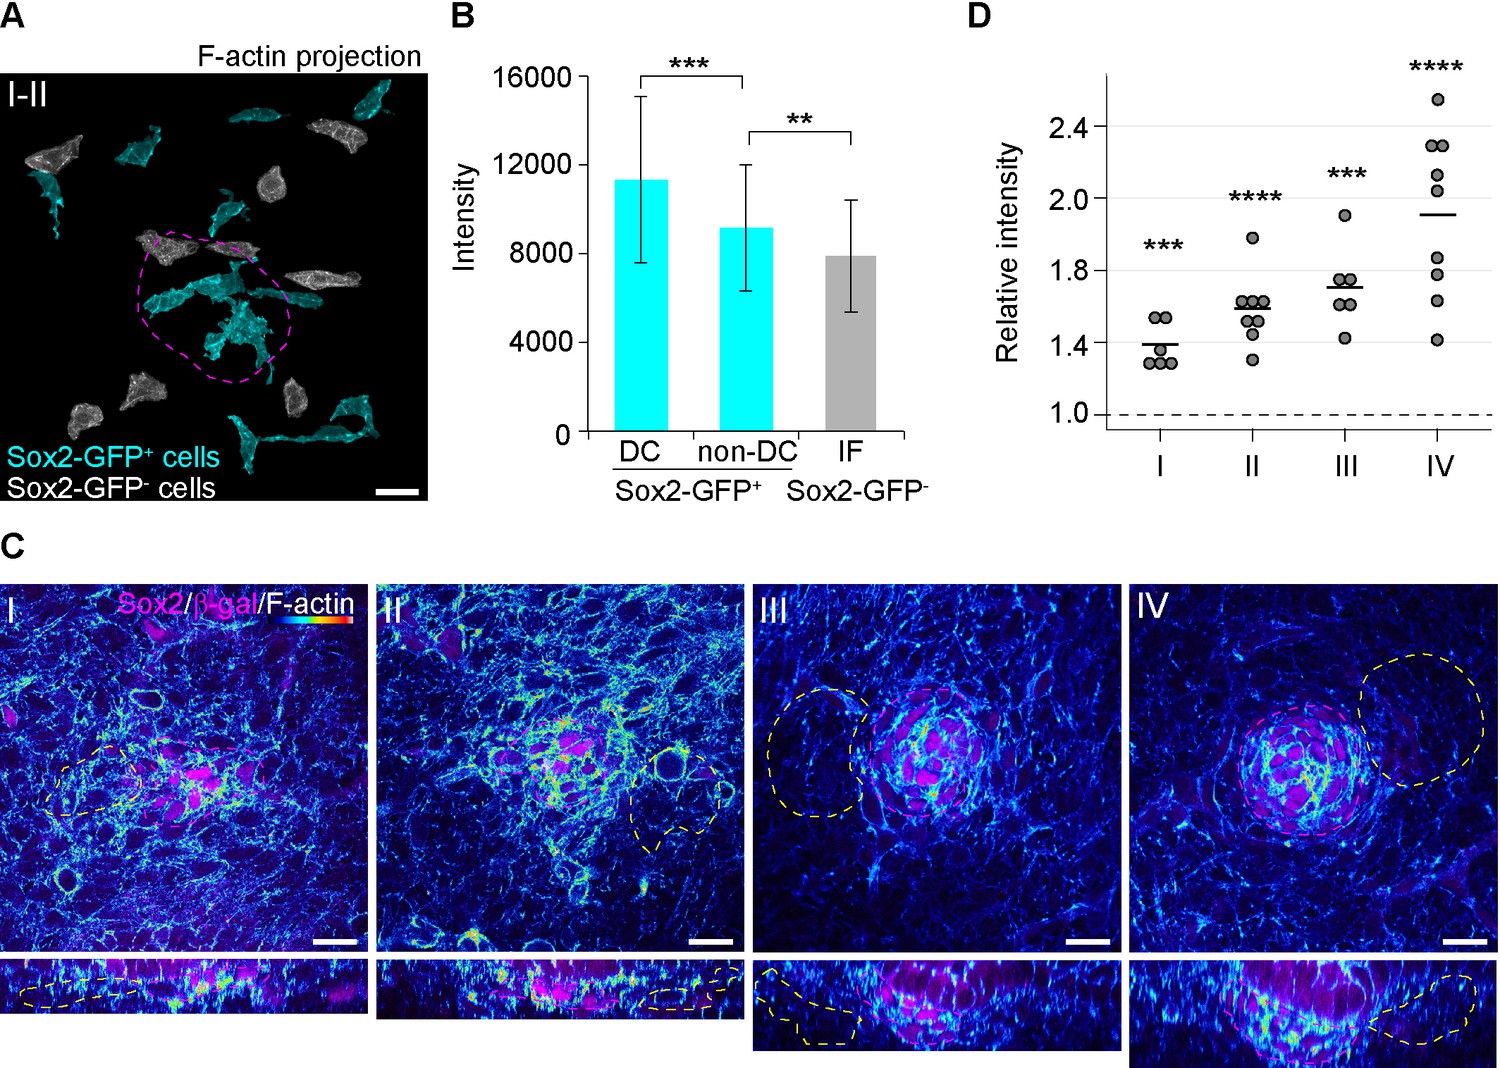
Condensate-forming cells display elevated levels of F-actin.
(A) Maximum intensity projections of F-actin in Sox2-GFP-positive cells (cyan) and dermal fibroblasts (grey). Placode position is marked by magenta dashed line. (B) Quantification of F-actin signal in DC and non-DC Sox2-GFP-positive cells and in Sox2-GFP-negative dermal fibroblasts (nSox2-GFP+DC = 49, nSox2-GFP+non-DC=76, and nIF = 76 cells, eight placodes from two skins). (C) Confocal microscopy immunofluorescent optical sections (planar and sagittal views) of Fgf20+/-HF between E13.5 and E14.5, labeled with antibodies against Sox2 and β-Gal (magenta) and phalloidin for F-actin (heatmap). Placode morphogenesis was divided into four categories based on advancing development (I–IV). (D) Quantification of F-actin signal inside DC selection (magenta dashed line) and dermal selection (yellow dashed line) at each stage of placode morphogenesis (nI = six placodes, nII = eight placodes, nIII = six placodes, nIV = eight placodes; two skins analyzed for each stage). **, p≤0.01; ***, p≤0.001, ****, p≤0.0001. Error bars represent SD. See also Figure 4—figure supplement 2—source data 1 and Figure 4.
-
Figure 4—figure supplement 2—source data 1
Values used to quantify phalloidin intensity.
Values used to quantify the phalloidin intensity between the Sox2-GFP+ cells found in the DC and outside the DC as well as the Sox2-GFP- interfollicular fibroblasts (Figure 4—figure supplement 2B). Values used to quantify the phalloidin intensity between the DCs during DC morphogenesis (Figure 4—figure supplement 2D).
- https://doi.org/10.7554/eLife.36468.017
Figure 5 with 1 supplement

Fgf20 transcriptional targets in the dermis.
(A) Schematic of the experimental setup. E13.5 Fgf20-/- dermises were separated into halves along the dorsal midline, each half was cultured for 3 hr in the presence of either 1 µg/ml FGF20 or with 0.1% BSA vehicle control. RNA was extracted and processed for RNA sequencing. (B) qRT-PCR was carried out on replicate samples for Spry4 (n = 8), Dusp6 (n = 7), Etv5 (n = 7), Spred1 (n = 6), and Bcl6 (n = 7). Significance was assessed with one-sample T-test, **=p < 0.01. Error bars represent SD. (C) Skins from E15.5 Fgf20+/- (control), K14-Edar;Fgf20+/-, and K14-Edar;Fgf20-/- embryos (n = 6 embryos each) were assayed for β-galactosidase activity to assess the expression of the Fgf20β-Gal knock-in allele (top). Note the follicular localization of β-Gal activity in Fgf20+/- embryos, which is localized throughout the epidermis in K14-Edar;Fgf20+/-, and K14-Edar;Fgf20-/- embryos. Radioactive in situ hybridization was utilized to detect Cdkn1a (p21) (middle) and Sox2 (bottom) at E16.5. Note that Cdkn1a was restricted to the DC in the dermis in control embryos, but was localized throughout the upper dermis in K14-Edar embryos in an Fgf20-dependent manner. Cdkn1a was also strongly expressed in the differentiating epidermis and the panniculus carnosus muscle. See also Table 1, Figure 5—source data, and Figure 5—figure supplement 1.
-
Figure 5—source data 1
Values used for qRT-PCR analysis of FGF20-treated Fgf20-/- dermis.
Values used to quantify fold change in expression of Etv5, Spry4, Dusp6, and Spred1 in FGF20-treated vs. BSA-treated Fgf20-/- dermis (Figure 5—figure supplement 1C).
- https://doi.org/10.7554/eLife.36468.023
Figure 5—figure supplement 1
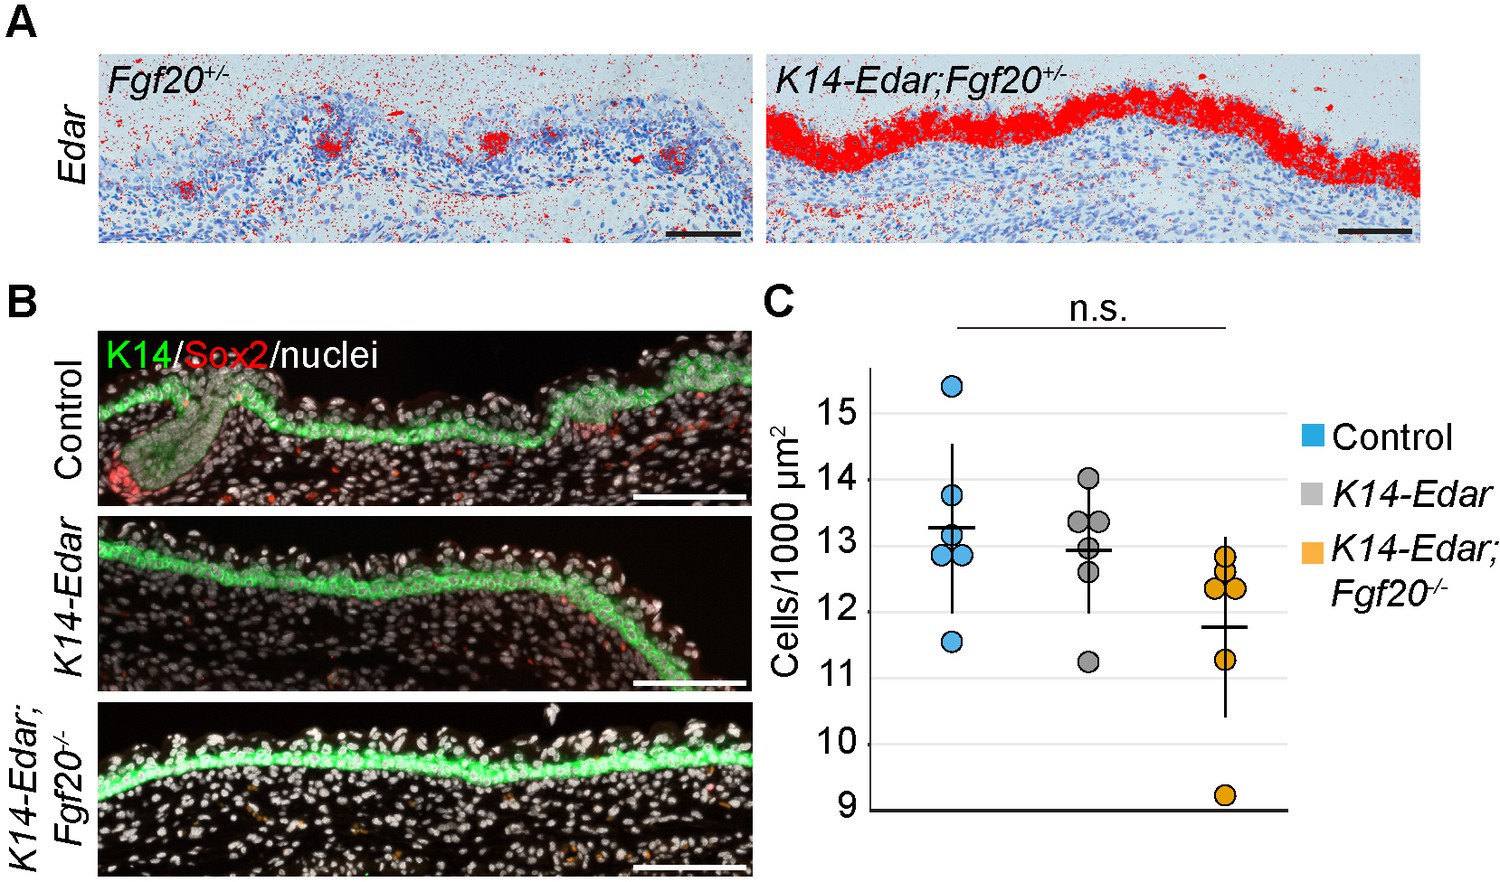
Analysis of Edar expression and dermal cell density in control, K14-Edar;Fgf20+/- skins K14-Edar;Fgf20-/- embryos.
(A) In situ hybridization for Edar at E16.5. (n = 5 embryos) (B) E16.5 skins from Fgf20+/-, K14-Edar;Fgf20+/-, and K14-Edar;Fgf20-/- embryos (n = 6 embryos) were used to determine the density of cells 30 µm below the epidermis, excluding the Sox2+ DCs (K14, green; Sox2, red; nuclei, white). (C) Quantification of fibroblast density in the upper dermis (One-way ANOVA). n.s., not significant. Error bars indicate SD. Scale bar = 100 µm. See also Figure 5—figure supplement 1—source data 1 and Figure 5.
-
Figure 5—figure supplement 1—source data 1
Values used to quantify fibroblast density in dermis.
Values used to quantify cell density in E16.5 dermis in wildtype, K14-Edar, and K14-Edar;Fgf20-/- samples (Figure 5—figure supplement 1—source data).
- https://doi.org/10.7554/eLife.36468.022
Figure 6 with 2 supplements
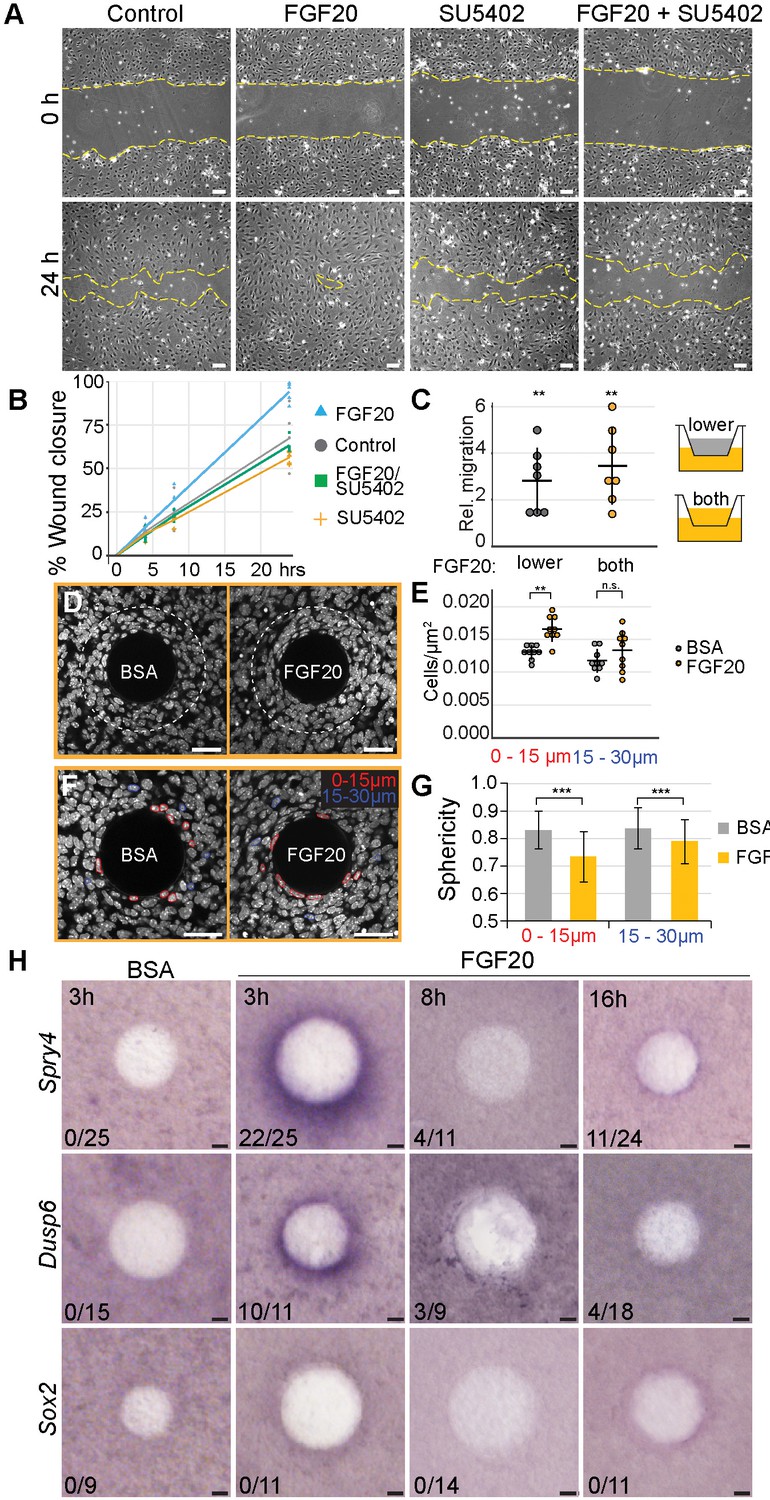
Fgf20 induces cell migration, condensation, and cell shape change ex vivo.
(A, C) E13.5 cell cycle inhibited wild-type primary fibroblasts were utilized in scratch wound and transwell assays. (A) Phase-contrast images of scratch wounds (border denoted by dashed lines) at 0 hr (top) and 24 hr (bottom) post-wounding. The following treatments were added immediately prior to scratch induction: control (left) FGF20 (center left, 200 ng/ml), SU5402 (center right, 20 µM), or FGF20 +SU5402 (right). (B) Quantification of wound closure. At 24 hr, FGF20-treatment induced significantly faster wound healing relative to baseline control (closures 93.9 ± 5.73 and 67.3 ± 16.13% respectively, Student’s t-test), and this effect was suppressed with SU5402 (closure 63.2 ± 4.22%). SU5402 alone had no effect on wound closure (all treatments n = 5 experiments each performed with freshly extracted primary dermal fibroblast cell population). (C) Transwell migration assay. Migration was significantly increased when Fgf20 (200 ng/ml) was added to lower or both upper and lower chambers (n = 7 experiments each performed with freshly extracted primary dermal fibroblast cell population, one-sample T-test). No statistical difference was observed between the two FGF20-treatments (Student’s T-test). (D, F) Confocal images of E13.5 dermal explants cultured 3 hr with beads loaded with FGF20 or 0.1% BSA vehicle control and counterstained with Hoechst33342. Dashed line marks 30 µm radius from bead; nuclei within 15 µm (red) and 15–30 µm (blue) radii from beads. (E) Quantification of cell density from a single optical slice at mid-bead. FGF20 bead induced an increase in density within 15 µm radius from the bead relative to BSA control (paired Student’s t-test,), but not between 15 and 30 µm radius (one-sample t-test, n = 9 beads). (G) Quantification of nuclear sphericity. Within 15 µm from the bead nuclear shapes of Fgf20 treated samples are significantly less spherical than control (data are from eight beads; n BSA 0-15µm= 124; n BSA 15-30µm = 85; n Fgf20 0-15µm=136; n Fgf20 15-30µm = 69 cells), significance was assessed with Mann-Whitney test. (H) Whole-mount RNA in situ hybridization of dermal samples cultured with FGF20 or 0.1% BSA control beads for 3, 8, or 16 hr. Induction of Spry4 and Dusp6, but not Sox2 expression (purple) was observed around the bead at 3 hr. n indicates induction/total samples, induction was tested in two independent experiments with skin samples derived from ≥2 different litters. n.s., not significant *, p≤0.05; **, p≤0.01; ***, p≤0.001. Error bars represent SD. Scale bars: A = 100 µm; D, F, and H = 30 µm. See also Figure 6—source data and Figure 6—figure supplement 1.
-
Figure 6—source data 1
Values used to quantify FGF20-induced cellular changes.
Values used to quantify fibroblast wound closure in the presence of DMSO, SU5402, FGF20+ DMSO, or FGF20+ SU5402 (Figure 6B). Values used to quantify E13.5 primary fibroblast transwell migration in control, FGF20 in lower chamber, and FGF20 in seeding and lower chambers (Figure 6C). Values used to quantify fibroblast density in response to BSA or FGF20-loaded beads at 0–15 µm and 15–30 µm distance from the bead (Figure 6E). Values used to quantify fibroblast nuclear sphericity in response to BSA or FGF20-loaded beads at 0–15 µm and 15–30 µm distance from the bead (Figure 6G).
- https://doi.org/10.7554/eLife.36468.030
Figure 6—figure supplement 1
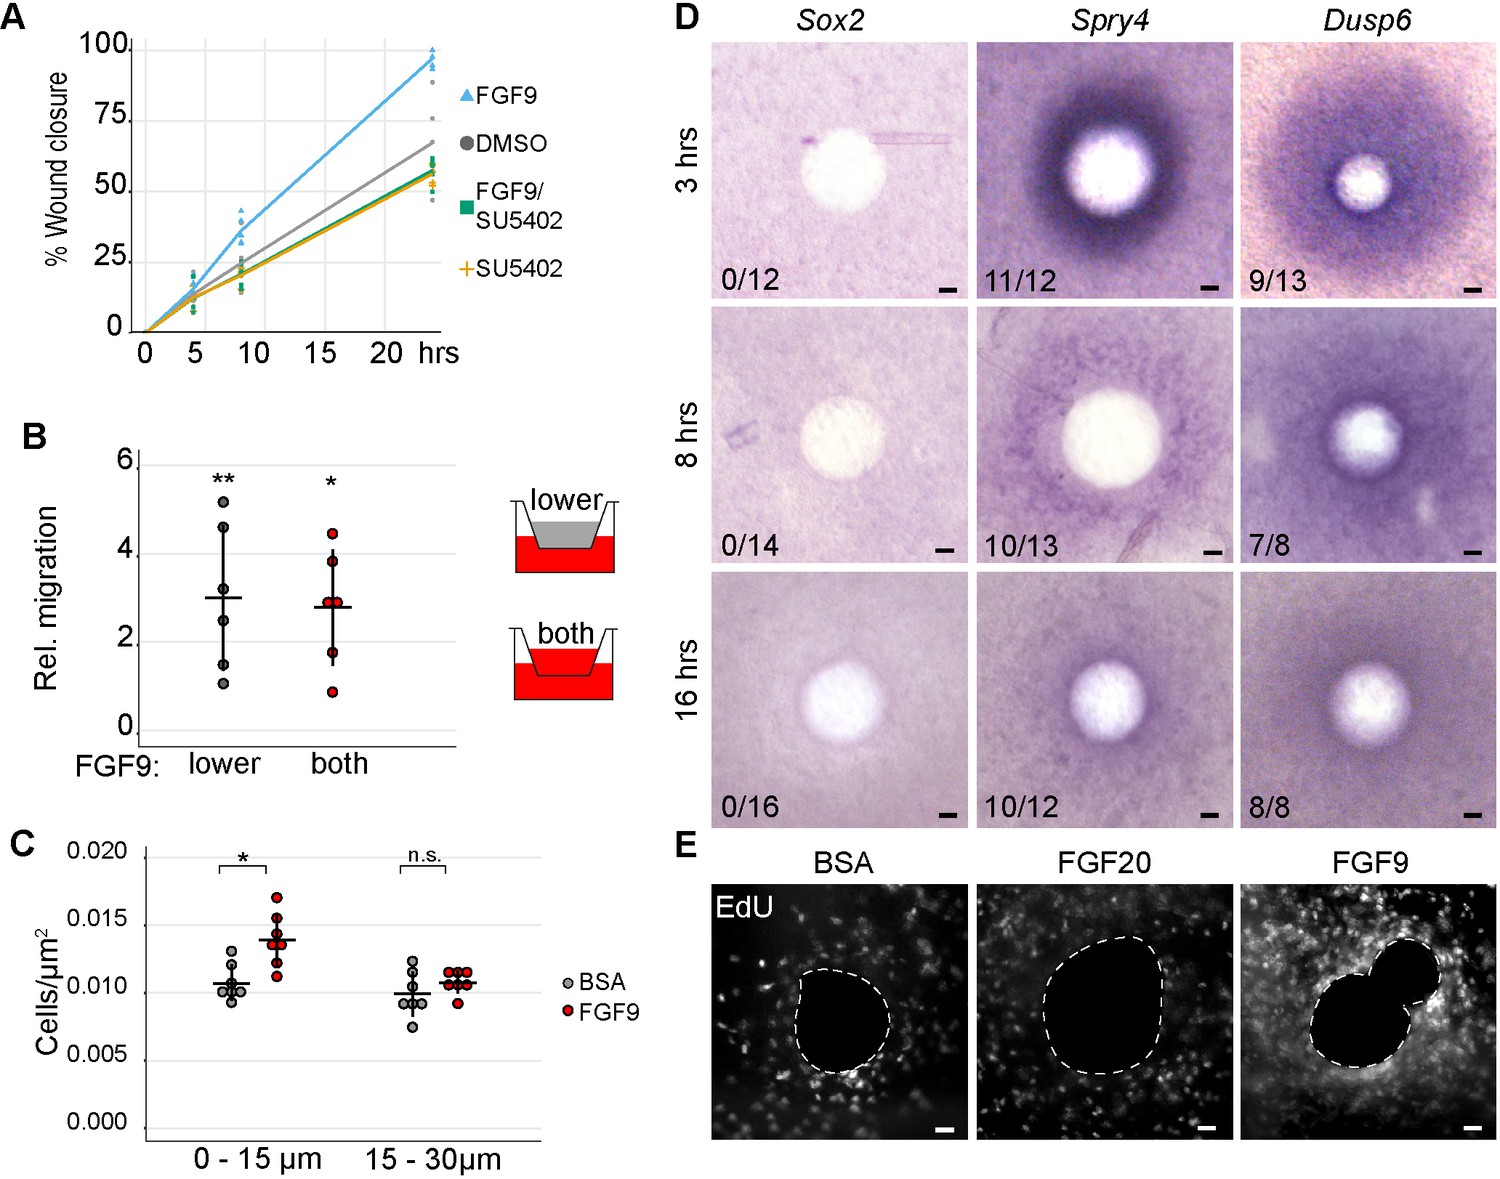
Dermal fibroblasts migrate in vitro and condense ex vivo in response to FGF9-treatment.
(A) Quantification of scratch wound closure of E13.5 growth-arrested primary dermal fibroblasts treated with FGF9 (200 ng/ml) or FGF9 and SU5402 (20 µM). At 24 hr, FGF9 treatment resulted in greater wound-closure at 8 hr (36.17 ± 5.04%, p=0.0490) and at 24 hr (97.11 ± 3.09%, p=0.0133) compared to DMSO control (all treatments n = 5 experiments, each performed with freshly extracted primary dermal fibroblast cell population). Wound closure was not altered when cells were treated with both FGF9 and SU5402 inhibitor (p=0.2563). (B) Quantification of transwell migration assay of E13.5 primary dermal fibroblasts. Migration was significantly increased when FGF9 (200 ng/ml) was added to lower or both upper and lower chambers (p=0.0003 and p=0.0010, respectively; for both n = 6 experiments, each performed with freshly extracted primary dermal fibroblast cell population). No statistical difference was observed between FGF9 treatments (p=0.4033). (C) Quantification of nuclei density in E13.5 dermis explants treated for 3 hr with beads loaded with FGF9 (100 µg/ml) or 0.1% BSA vehicle control. Density measured from a single optical slice at mid-bead. FGF9 bead induces an increase in density within 15 µm radius from the bead relative to BSA control (p=0.033, n = 7 explants), but not between 15 and 30 µm radius (p=0.236, n = 7 explants). (D) Whole-mount RNA in situ hybridization of dermal samples treated with FGF9 beads for 3, 8, and 16 hr. Induction of Spry4 and Dusp6, but not Sox2 expression (purple) was observed around the bead at all time points (n indicates induction/total samples, induction was tested in two independent experiments with skin samples derived from at least two different litters.). (E) 2 hr EdU incorporation into dermis organ cultures after overnight incubation with BSA (left), FGF20 (center), FGF9 (right) loaded beads. Note the increased number of proliferating cells around the FGF9 bead (n = 5 explants). Error bars represent SD. *, p≤0.05; **, p≤0.01; ***, p≤0.001. Scale bar = 30 µm. See also Figure 6—figure supplement 1—source data 1 and Figure 6.
-
Figure 6—figure supplement 1—source data 1
Values used to quantify FGF9-induced cellular changes.
Values used to quantify fibroblast wound closure in the presence of DMSO, SU5402, FGF9 +DMSO, or FGF9 +SU5402 (Figure 6—figure supplement 1A). Values used to quantify E13.5 primary fibroblast transwell migration in control, FGF9 in lower chamber, and FGF9 in seeding and lower chambers (Figure 6—figure supplement 1B). Values used to quantify fibroblast density in response to BSA or FGF9-loaded beads at 0–15 µm and 15–30 µm distance from the bead (Figure 6—figure supplement 1C).
- https://doi.org/10.7554/eLife.36468.027
Figure 6—figure supplement 2
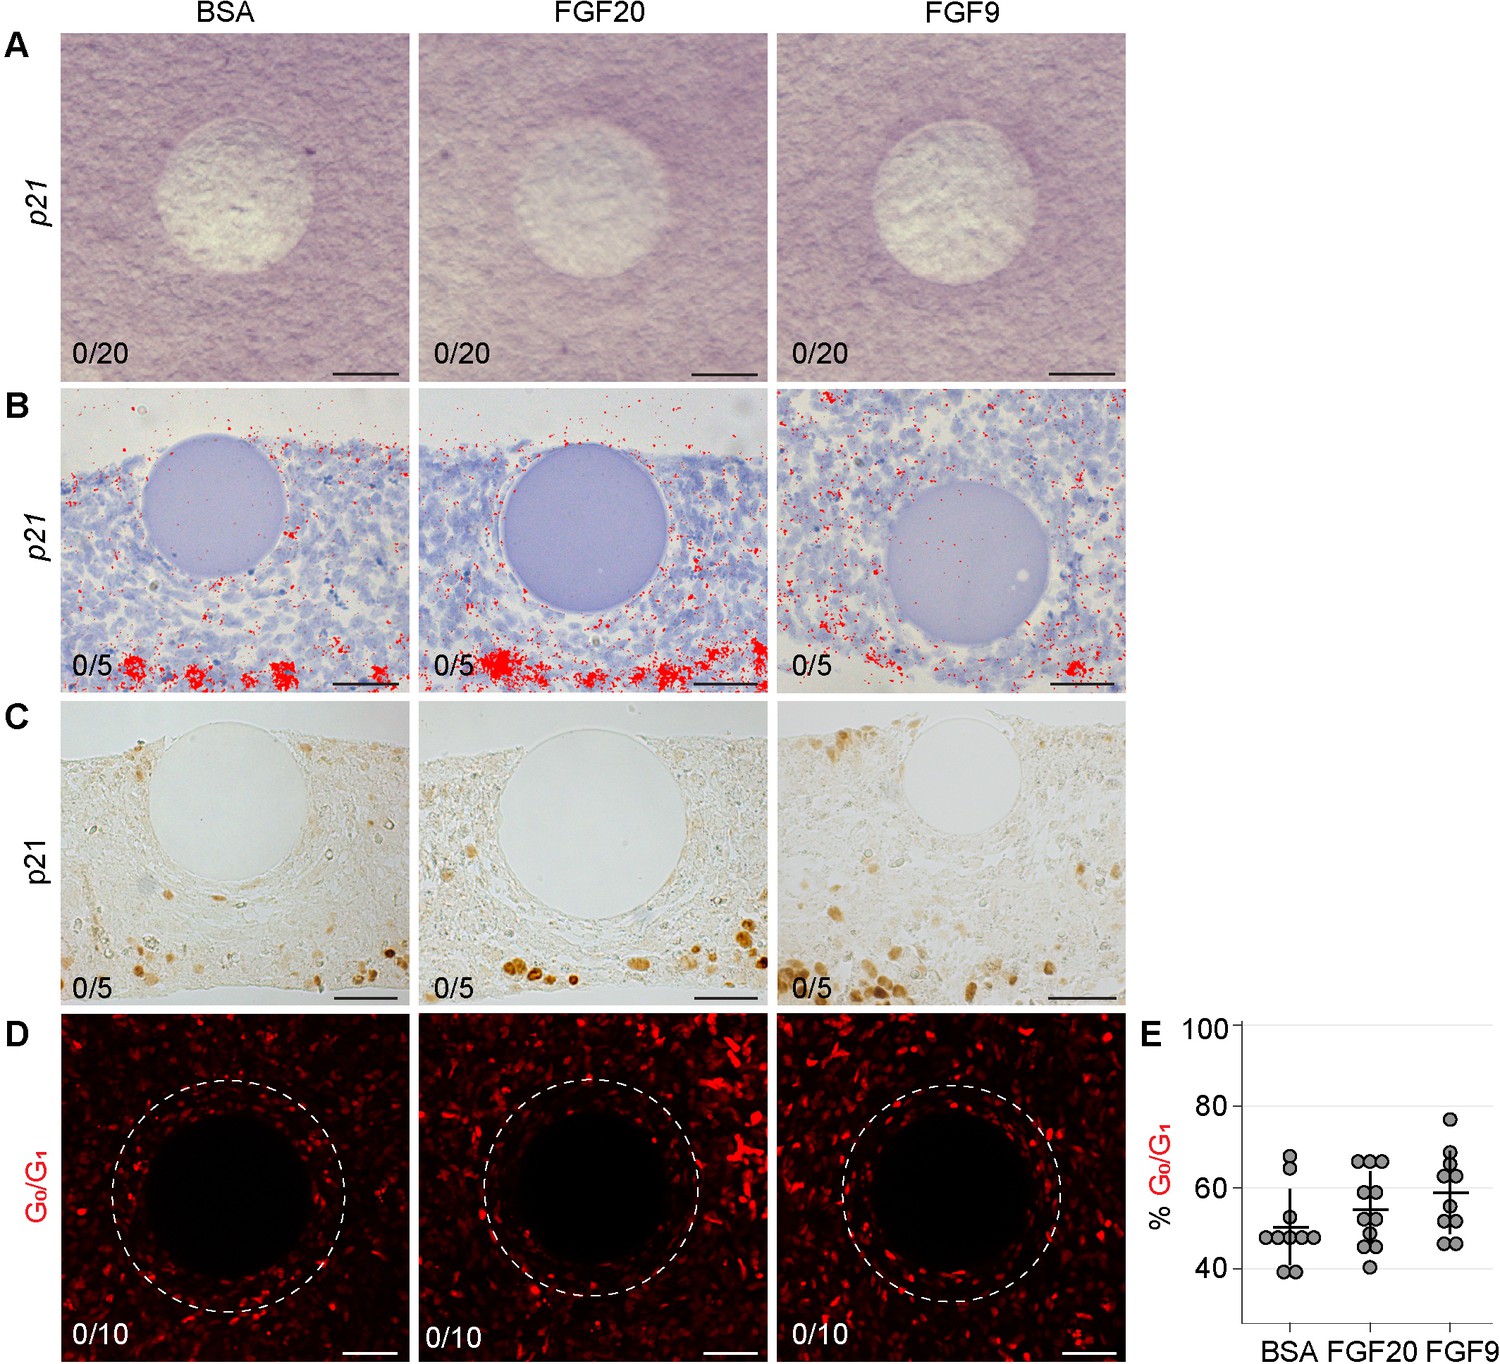
FGF20 does not induce Cdkn1a expression nor FuccimKO+-cells.
3 hr incubation of BSA-, FGF20- or FGF9-loaded beads with E13.5 wildtype (A, B, C) or FuccimKO (D) dermises. Cdkn1a expression was assayed in these samples using (A) whole-mount RNA in situ hybridization of dermal samples. Cdkn1a expression (purple) was not observed around the bead (0/20 each condition, in four independent experiments with skin samples derived from four different litters.) (B) section radioactive in situ hybridization (0/5 each condition in two independent experiments with skin samples from two different litters), and (C) section in situ hybridization (0/5 each condition in two independent experiments with skin samples from two different litters). (D) Cell cycle exit was assessed using FuccimKO reporter allele (representing G0/G1 cell cycle phase) in the 30 µm surrounding the center of the bead (0/10 each condition in two independent experiments with skin samples from two different litters). (E) Quantification of percent total cells surrounding the bead positive for Fucci-mKO. No significant difference was observed between any of the groups. Error bars represent SD. Scale bar = 50 µm. See also Figure 6—figure supplement 2—source data 1 and Figure 6.
-
Figure 6—figure supplement 2—source data 1
Values used to quantify FGF20 or FGF9 induced Fucci-mKO expression.
Values used to quantify the percent of total cells expressing Fucci-mKO 30 µm surrounding the center of the bead (Figure 6—figure supplement 2E).
- https://doi.org/10.7554/eLife.36468.029
Figure 7 with 2 supplements
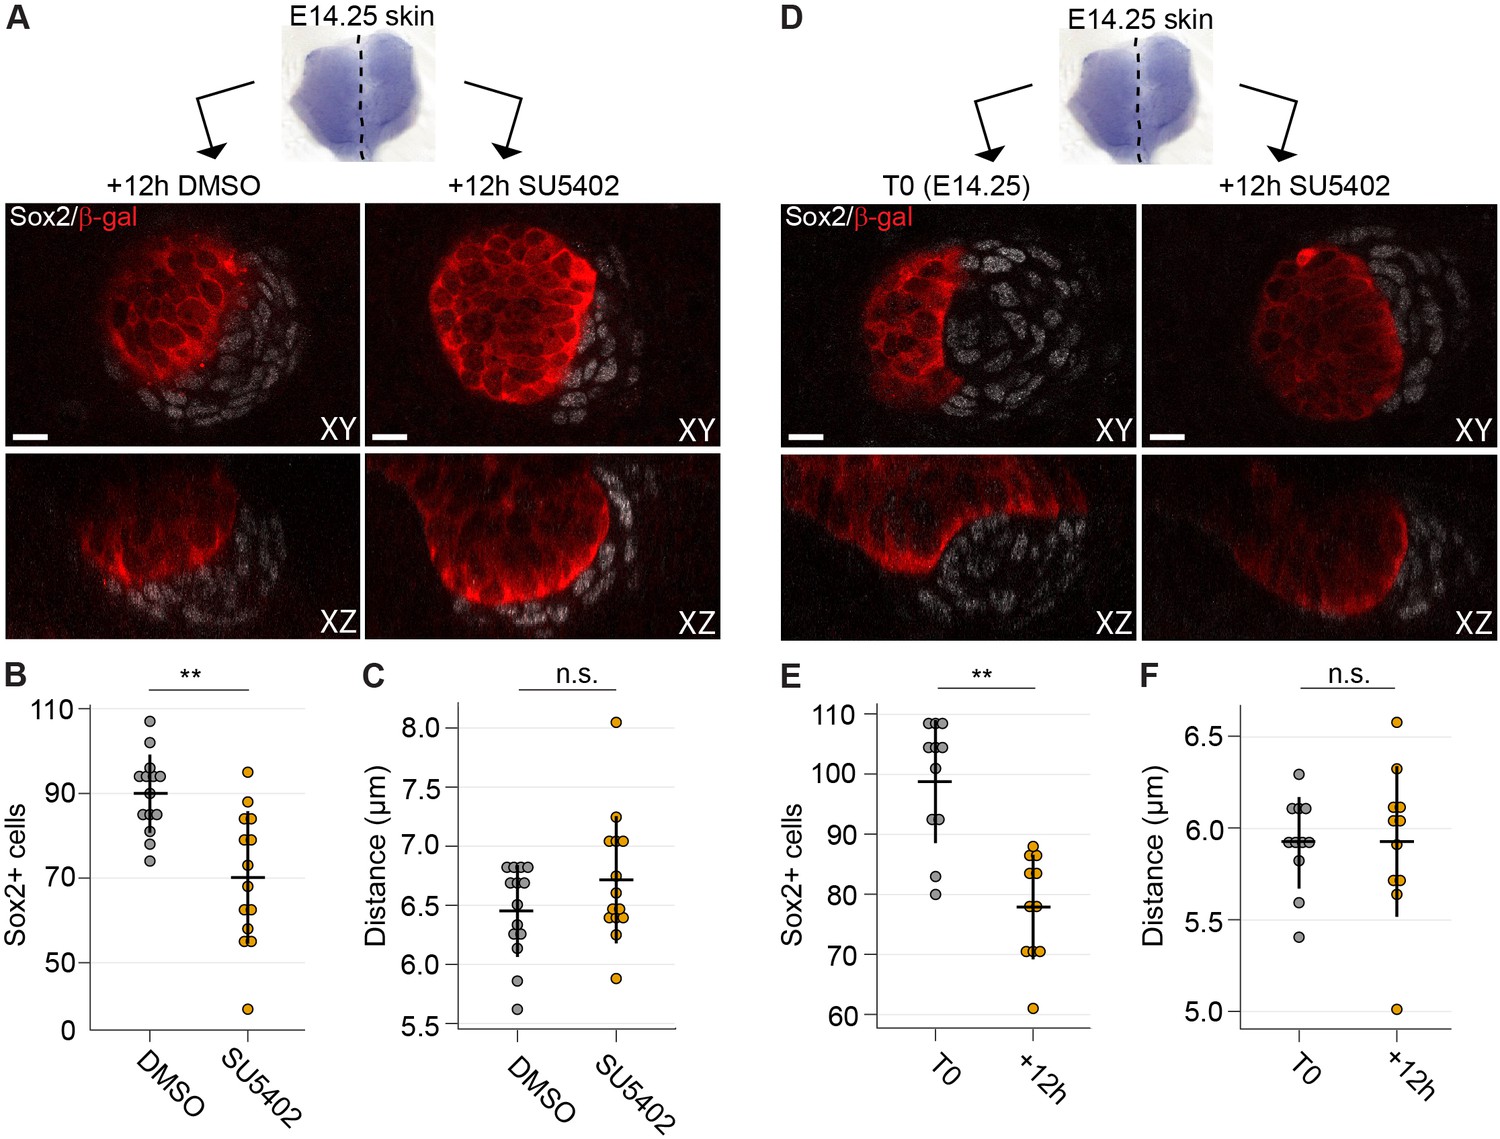
Inhibition of Fgf signaling blocks morphogenesis of dermal condensate ex vivo.
(A) Confocal optical sections of paired E14.25 Fgf20+/- skins explants cultured for 12 hr with SU5402 (20 µM) or DMSO vehicle control. Samples were stained for β-Gal (red) and Sox2 (white). (B) Quantification of Sox2+ DC cell numbers in control and SU5402-treated samples relative to DMSO control (n = 14 DCs each from six skins). (C) Quantification of the distance of Sox2+ DC cells to their nearest neighbor in control and SU5402-treated samples (n = 14 DCs each from six skins). (D) Confocal optical sections of E14.25 paired skin explants either fixed at T0 or cultured 12 hr with SU5402 (20 µM). Samples were stained for β-gal (red) and Sox2 (white). (E, F) Quantification of Sox2+ DC cell numbers and distance to neighbor (n = 11 DCs from four skins). Significance was assessed with Student’s T-test. n.s., not significant; **, p≤0.01. Error bars represent SD. See also Figure 7—source data and Figure 7—figure supplement 1.
-
Figure 7—source data 1
Values used to quantify DC morphogenesis in the presence of Fgfr inhibitor.
Values used to quantify E14 + 12 hr culture with DMSO or SU5402 DC normalized cell numbers (Figure 7B). Values used to quantify E14 + 12 hr culture with DMSO or SU5402 distance of DC cells (Figure 7C). Values used to quantify DC cell number at E14 and after 12 hr culture with SU5402. (Figure 7E). Values used to quantify DC cell distance at E14 and after 12 hr culture with SU5402 (Figure 7F).
- https://doi.org/10.7554/eLife.36468.035
Figure 7—figure supplement 1

Inhibition of Fgf signaling at different developmental stages ex vivo impairs DC formation and maintenance.
(A–C) Maximum intensity projections of confocal image stacks of Fgf20+/- skins explants labeled with antibodies against β-gal (red) and Sox2 (white). (A) E13.5 skin explants were halved and cultured for 24 hr in the presence of DMSO vehicle control (left) or 20 µM SU5402 (right) (n = 7 skins). In the DMSO-treated samples, dermal condensates are readily observed (Sox2+ cells), whereas SU5402-treated samples are devoid of Sox2+ cells and display altered epithelial Fgf20 expression. (B) E14.25 Fgf20+/- skins explants were divided into two halves: one was cultured in the presence of DMSO (vehicle control, left) for 12 hr and the other in the presence of 20 µM SU5402 (right) (n = 8 skins). (C) E14.25 Fgf20+/- skins explants were divided into two halves: one was fixed immediately (T0, left) while the other was cultured for 12 hr with 20 µM SU5402 (right) (n = 5 skins). Scale bar = 50 µm. See also Figure 7.
Figure 7—figure supplement 2

Inhibition of VEGFR signaling with XL184 and FGFR signaling with BGJ398 in skin explants.
E13.5 Fgf20+/- skins was cultured for 24 hr in the presence of DMSO vehicle control (A) (n = 14 skins), 50 nM and 250 nM XL184 to inhibit VEGFR signaling (B,C) (n = 7 and 13 skins, respectively), as well as 0.6 µM and 1.5 µM BGJ398 (D,E) (n = 11 and 12 skins, respectively). First image column shows representative maximum intensity projections of 10x confocal stacks (scale bar = 50 µM) and the second and third columns show representative 63x confocal optical sections of single DCs as top and side views (scale bar = 10 µM). See also Figure 7—figure supplement 2—source data 1..
-
Figure 7—figure supplement 2—source data 1
Inhibitors used to test FGFR signaling in DC induction.
Table of reported IC50 values for SU5402, BGJ398, and XL154 for the FGFR1 and VEGFR2 receptors. Equivalent dose represents the concentration required to inhibit either FGFR1 or VEGFR2 to the same degree as SU5402.
- https://doi.org/10.7554/eLife.36468.034
Author response image 1
Videos
Video 1
Time-lapse fluorescence confocal video of DC morphogenesis.
Dorsal skin from E13.75 Fucci-mKO;Sox2-GFP was explanted into Trowell culture set up and imaged with Leica TCS SP5 confocal microscope for 13 hr. Tracks of manually traced DC cells (Sox2-GFP+, green; Fucci-mKO+, red) and non-DC fibroblasts (Sox2-GFP-; Fucci-mKO+, red cells) are shown. See also Figure 4 and Figure 4—figure supplement 1.
Tables
Table 1
Differentially expressed genes after 3 hr FGF20 treatment.
Genes in red: Fold DC vs. Fb is >2 x in Sennett et al., 2015; * indicates a DC signature gene. Genes in blue: Fold Fb vs. DC is >2 x in Sennett et al., 2015; # indicates a Fibroblast signature gene. See also Figure 5 and Figure 5—figure supplement 1.
| Ensembl gene ID | Gene symbol | Log2 fold change | q-value |
|---|---|---|---|
| ENSMUSG00000024427 | Spry4 | 1,24306661 | 2,87958E-14 |
| ENSMUSG00000040276 | 1,117757314 | 0,005409828 | |
| ENSMUSG00000000938 | 1,067306677 | 4,89962E-05 | |
| ENSMUSG00000022484 | Hoxc10 | 1,055122804 | 0,000135006 |
| ENSMUSG00000037580 | 0,953581456 | 0,001623219 | |
| ENSMUSG00000039628 | 0,9259377 | 0,048932785 | |
| ENSMUSG00000013089 | Etv5 | 0,904428558 | 3,51931E-06 |
| ENSMUSG00000019960 | 0,768627588 | 2,59873E-05 | |
| ENSMUSG00000000435 | Myf5 | 0,741106812 | 0,021043062 |
| ENSMUSG00000022508 | 0,71492512 | 0,001178264 | |
| ENSMUSG00000014813 | Stc1 | 0,70075808 | 8,12534E-07 |
| ENSMUSG00000022367 | Has2 | 0,688772195 | 0,000329738 |
| ENSMUSG00000046223 | Plaur | 0,680287177 | 0,019395279 |
| ENSMUSG00000037211 | 0,668125166 | 0,000252705 | |
| ENSMUSG00000020023 | 0,652897112 | 0,017991893 | |
| ENSMUSG00000045671 | Spred2 | 0,646652707 | 0,021043062 |
| ENSMUSG00000032020 | 0,608057108 | 0,025457783 | |
| ENSMUSG00000022114 | 0,604959493 | 3,29426E-05 | |
| ENSMUSG00000039680 | 0,587495288 | 0,048932785 | |
| ENSMUSG00000043099 | 0,58156032 | 7,06147E-06 | |
| ENSMUSG00000021567 | Nkd2 | 0,574323421 | 0,048932785 |
| ENSMUSG00000025402 | Nab2 | 0,573087974 | 0,001623219 |
| ENSMUSG00000026064 | Ptp4a1 | 0,560735472 | 0,049490799 |
| ENSMUSG00000026655 | 0,552834404 | 0,000598789 | |
| ENSMUSG00000046324 | Ermp1 | 0,545018197 | 0,004713961 |
| ENSMUSG00000015957 | 0,521839644 | 0,030834254 | |
| ENSMUSG00000023067 | 0,509994166 | 0,048932785 | |
| ENSMUSG00000027351 | 0,501328957 | 0,017546304 | |
| ENSMUSG00000053716 | Dusp7 | 0,498184179 | 0,017991893 |
| ENSMUSG00000007029 | Vars | 0,396158628 | 0,048932785 |
| ENSMUSG00000018001 | Cyth3 | 0,388676591 | 0,017546304 |
| ENSMUSG00000029563 | Foxp2 | −0,555487269 | 0,028254118 |
| ENSMUSG00000046743 | −0,569844598 | 0,006906967 | |
| ENSMUSG00000036995 | Asap3 | −0,763477567 | 0,021457852 |
| ENSMUSG00000028036 | −0,85391079 | 6,19325E-06 | |
| ENSMUSG00000035352 | −0,855627781 | 0,01168856 | |
| ENSMUSG00000026163 | −1,030633182 | 0,001174907 | |
| ENSMUSG00000070304 | Scn2b | −1,038110113 | 0,009838673 |
| ENSMUSG00000042604 | −1,228592873 | 0,000211934 | |
| ENSMUSG00000029394 | Cdk2ap1 | −1,589028583 | 0,011081145 |
-
: Fold DC vs. Fb is >2 x in Sennett et al., 2015; indicates a .
: Fold Fb vs. DC is >2 x in Sennett et al., 2015; indicates a .
Key resources table
| Reagent type (species) or resource | Designation | Source or reference | Identifiers | Additional information |
|---|---|---|---|---|
| Strain, strain background (Mus musculus, C57/Bl6) | Fgf20+/- | PMID: 23431057 | RRID:MGI:5425887 | |
| Strain, strain background (M. musculus, C57/Bl6) | Fgf20-/- | PMID: 23431057 | RRID:MGI:5425887 | |
| Strain, strain background (M. musculus, C57/Bl6) | K14-Eda | PMID: 12812793 | ||
| Strain, strain background (M. musculus, C57/Bl6) | R26RtdTomato | Jackson Laboratory | Stock 007914, RRID:IMSR_JAX:007914 | |
| Strain, strain background (M. musculus, C57/Bl6) | R26RmT/mG | Jackson Laboratory | Stock 007576, RRID:IMSR_JAX:007576 | |
| Strain, strain background (M. musculus, C57/Bl6) | Sox2creERT | Jackson Laboratory | Stock 017593, RRID:IMSR_JAX:017593 | |
| Strain, strain background (M. musculus, mixed) | Fucci | PMID: 18267078 | RRID:IMSR_RBRC02892 | |
| Strain, strain background (M. musculus, C57/Bl6) | R26Fucci2aR | EMMA | EM:08395, RRID:IMSR_EM:08395 | |
| Strain, strain background (M. musculus, C57/Bl6) | Sox2-GFP | PMID: 12923297 | ||
| Strain, strain background (M. musculus, C57/Bl6) | K14-Edar | PMID: 15366021 | ||
| Antibody | Beta-galactosidase rabbit | MP Biomedicals | 0855976, RRID:AB_2334934 | 1:1500 |
| Antibody | Beta-galactosidase chicken | Abcam | ab9361, RRID:AB_307210 | 1:1500 |
| Antibody | EpCAM rat monoclonal | BD Pharmingen | 552370, RRID:AB_394370 | 1:500 |
| Antibody | Krt14 rabbit monoclonal | Thermo Fisher Scientific | RB-9020-P, RRID:AB_149790 | 1:500 |
| Antibody | Sox2 goat polyclonal | Santa Cruz | SC-17320, RRID:AB_2286684 | 1:500 sections, '1:200 wholemount |
| Antibody | Sox2 rabbit polyclonal | Stemgent | 09–0024, RRID:AB_2195775 | 1:300 |
| Antibody | Cdkn1a rabbit monoclonal | Abcam | ab188224, RRID:AB_2734729 | 1:1000 |
| Sequence-based reagent | Dusp6 RNA probe | PMID: 11960712 | ||
| Sequence-based reagent | Cdkn1a RNA probe | PMID: 9486790 | ||
| Sequence-based reagent | Spry4 RNA probe | PMID: 11731251 | ||
| Sequence-based reagent | Sox2 RNA probe | PMID: 15240551 | ||
| Sequence-based reagent | Edar RNA probe | PMID: 11203701 | ||
| Sequence-based reagent | Hprt probe | BioRad | qMmuCEP0054164 | |
| Sequence-based reagent | Dusp6 probe | BioRad | qMmuCIP0029423 | |
| Sequence-based reagent | Eef1 probe | BioRad | qMmuCEP0057829 | |
| Sequence-based reagent | Spred1 probe | BioRad | qMmuCEP0055028 | |
| Sequence-based reagent | Gapdh probe | BioRad | qMmuCEP0039581 | |
| Sequence-based reagent | Etv5 probe | BioRad | qMmuCIP0034710 | |
| Sequence-based reagent | Spry4 probe | BioRad | qMmuCEP0054507 | |
| Sequence-based reagent | Bcl6 qPCR primers | this study | template NM_001348026.1 | F: CGCGAACCTTGATCTCCAGT, R: CAGGGACCTGTTCACGAGAT |
| Sequence-based reagent | Hprt qPCR primers | this study | template NM_013556.2 | F: CAGTCCCAGCGTCGTGATTA, R: TCGAGCAAGTCTTTCAGTCCT |
| Peptide, recombinant protein | FGF20 human recombinant protein | PeproTech | 100–41 | |
| Peptide, recombinant protein | FGF9 human recombinant protein | R and D Systems | 273-F9 | |
| Commercial assay or kit | Rneasy plus micro kit | Qiagen | ID: 74004 | |
| Commercial assay or kit | Quantitect reverse transcription kit | Qiagen | ID: 205311 | |
| Commercial assay or kit | TruSeq Stranded Total RNA Library Prep Kit with Ribo-Zero Mouse | illumina | RS-122–2202 | |
| Chemical compound, drug | SU5402 | Calbiochem | 572630 | |
| Chemical compound, drug | BGJ398 | Selleckchem.com | S2183 | |
| Chemical compound, drug | XL184 | Selleckchem.com | S4001 | |
| Software, algorithm | AfterQc | PMID: 28361673 | RRID:SCR_016390 | |
| Software, algorithm | SortMeRNA | PMID: 23071270 | RRID:SCR_014402 | |
| Software, algorithm | STAR | PMID: 23104886 | RRID:SCR_015899 | |
| Software, algorithm | Htseq-count | PMID: 25260700 | RRID:SCR_011867 | |
| Software, algorithm | DEseq2 | PMID: 25516281 | RRID:SCR_015687 |
Additional files
-
Supplementary file 1
- https://doi.org/10.7554/eLife.36468.036
-
Reporting standard 1
- https://doi.org/10.7554/eLife.36468.037
-
Transparent reporting form
- https://doi.org/10.7554/eLife.36468.038
Download links
A two-part list of links to download the article, or parts of the article, in various formats.
Downloads (link to download the article as PDF)
Open citations (links to open the citations from this article in various online reference manager services)
Cite this article (links to download the citations from this article in formats compatible with various reference manager tools)
Hair follicle dermal condensation forms via Fgf20 primed cell cycle exit, cell motility, and aggregation
eLife 7:e36468.
https://doi.org/10.7554/eLife.36468


