A facile approach for the in vitro assembly of multimeric membrane transport proteins
- Oregon Health & Science University, United States
- Cornell University, Unites States
- Cornell University, United States
- Weill Cornell Medicine, United States
- Howard Hughes Medical Institute, United States
Figures
Figure 1
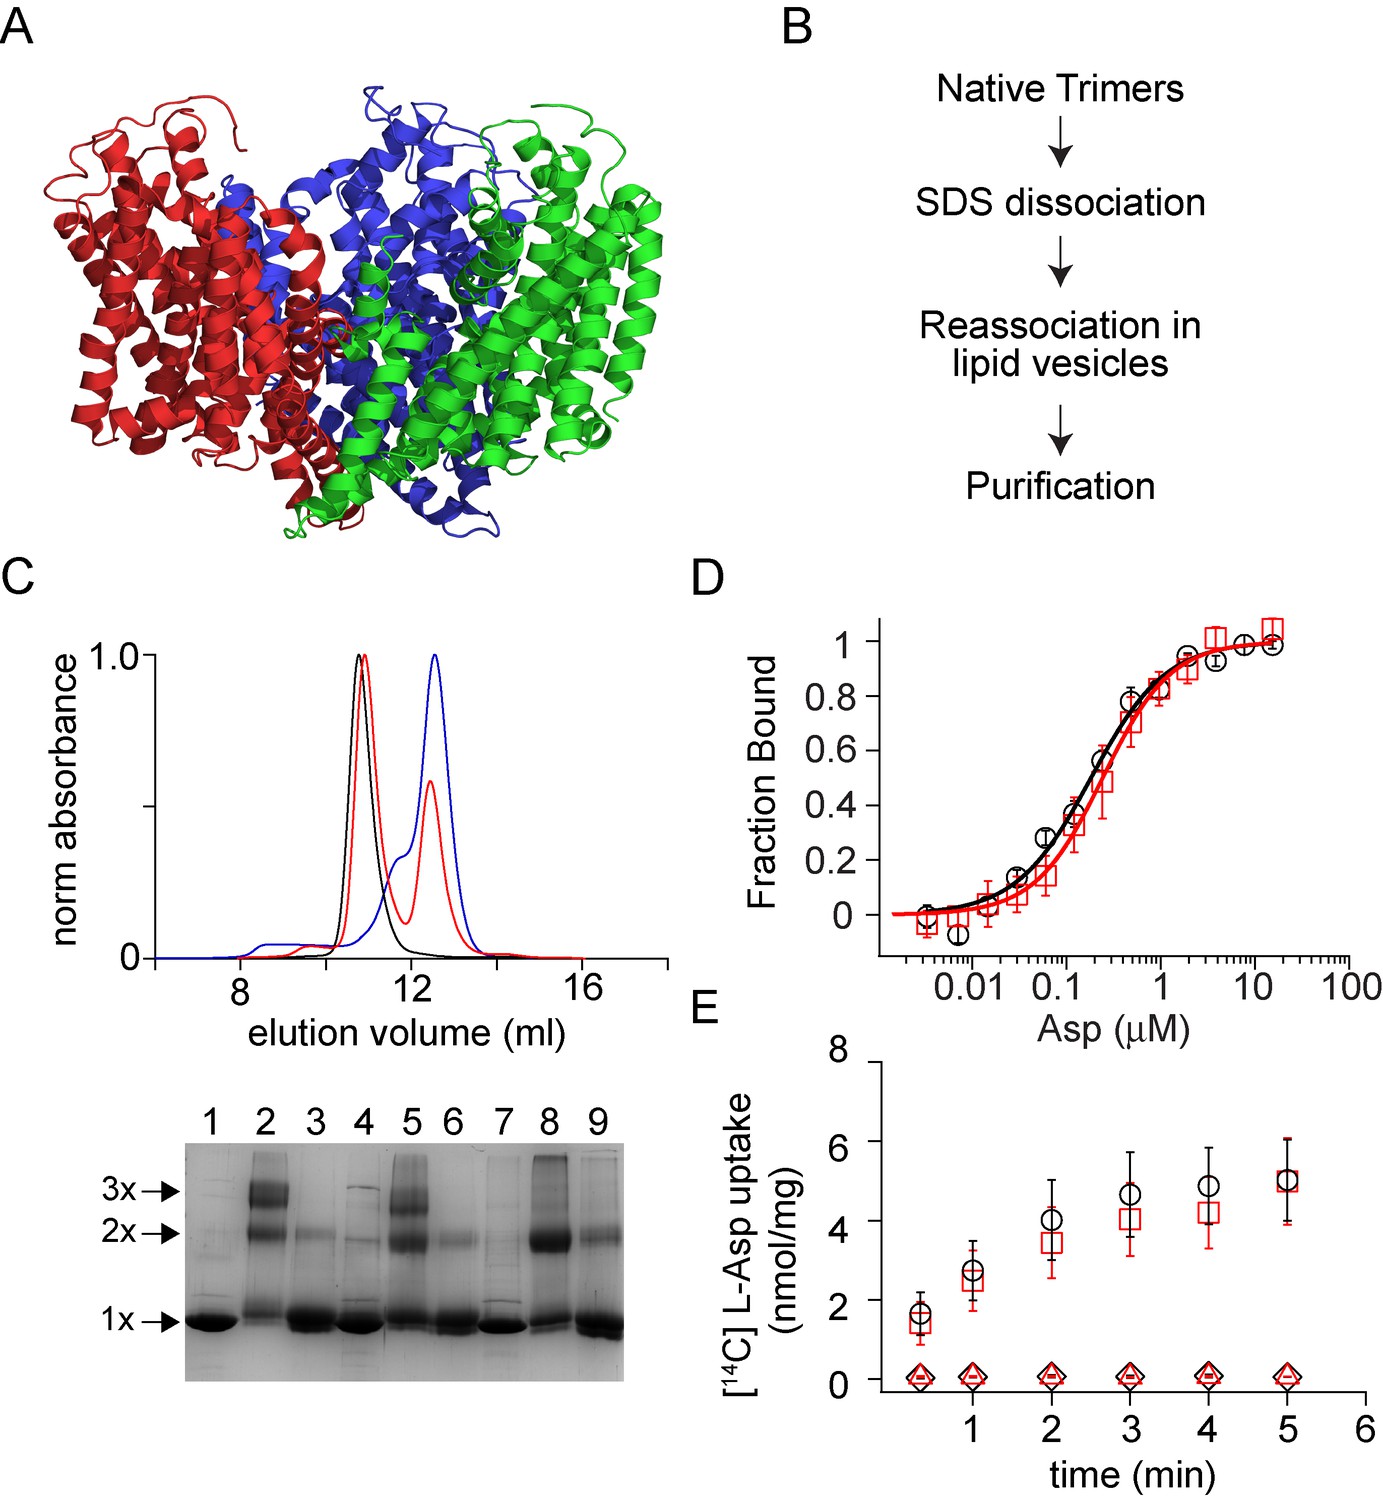
Dissociation and reassociation of GltPh.
(A) Structure of the GltPh trimer (pdb: 2nwx) is shown in ribbon representation. (B) Flow chart outlining the strategy used for the dissociation and reassociation of the GltPh trimer. (C) Size exclusion chromatography of the native GltPh (black) and the SDS dissociated GltPh following dilution into lipid vesicles (red) and into DDM (blue). Reassembly of GltPh takes place in lipid vesicles. Inset, SDS-PAGE gel showing the glutaraldehyde crosslinking of the native GltPh (lanes 1–3), reassociated GltPh (r-GltPh, lanes 4–6) and the SDS dissociated GltPh subunits (lanes 7–9). Lanes 1, 4, and 7, without glutaraldehyde crosslinking, lanes 2, 5, and 8, with glutaraldehyde crosslinking and lanes 3, 6, and 9, with glutaraldehyde crosslinking in the presence of 1% SDS. The oligomeric nature of the protein band (1x, 2x, and 3x) is indicated. (D) Asp binding by native and r-GltPh. Asp binding was monitored by changes in fluorescence of the native (black circles) or r-GltPh (red squares) with the L130W substitution. The fraction of the protein bound (Fbound) is determined by dividing the change in fluorescence upon addition of Asp by the total change at the end of the titration. Solid lines are fits to the data using the equation described in Materials and methods with KD values of 183 ± 16 nM for native GltPh and 216 ± 15 nM for r-GltPh. The binding assays were conducted in 10 mM Na+. (E) Asp uptake assay. The time course of [14C]-Asp uptake for native GltPh (black circles) and r-GltPh (red squares) in the presence of a Na+ gradient. No uptake is observed for native GltPh (black diamonds) and r-GltPh (red triangles) in the absence of a Na+ gradient. For panels D and E, error bars indicate standard error of mean (SEM) for n > 3.
Figure 2
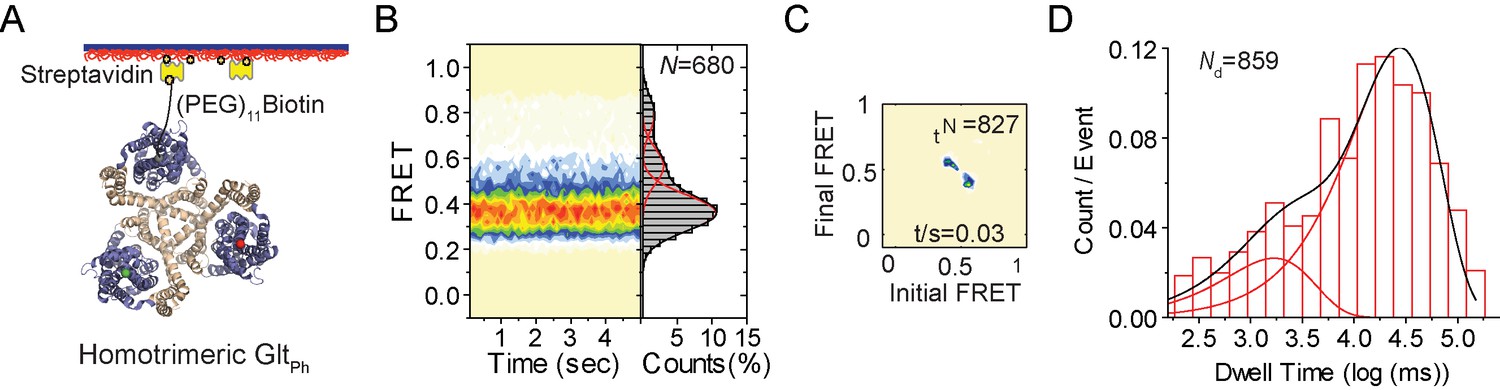
smFRET experiments on reassociated GltPh molecules.
(A) Labeling and surface-immobilization strategy for smFRET experiments. (B) Population distributions FRET efficiency population contour plots (left) and cumulative population histograms (right) are shown for r-GltPh. The contour plots are color-coded from tan (lowest) to red (highest population) with the color scale from 0–12%. The population histograms display the time-averaged values and standard deviations. The solid black lines are fits to the sums of individual Gaussian functions (red lines). The number of molecules analyzed (N) is shown. (C) Transition density plots show that transitions occur at a frequency of ~0.03/ s. The number of transitions in the dataset (Nt) is shown. (D) Dwell time distribution for the low-FRET state obtained for r-GltPh shows biphasic behavior and was fitted to a probability density function. The number of dwells in the analysis (Nd) is shown.
Figure 3 with 3 supplements
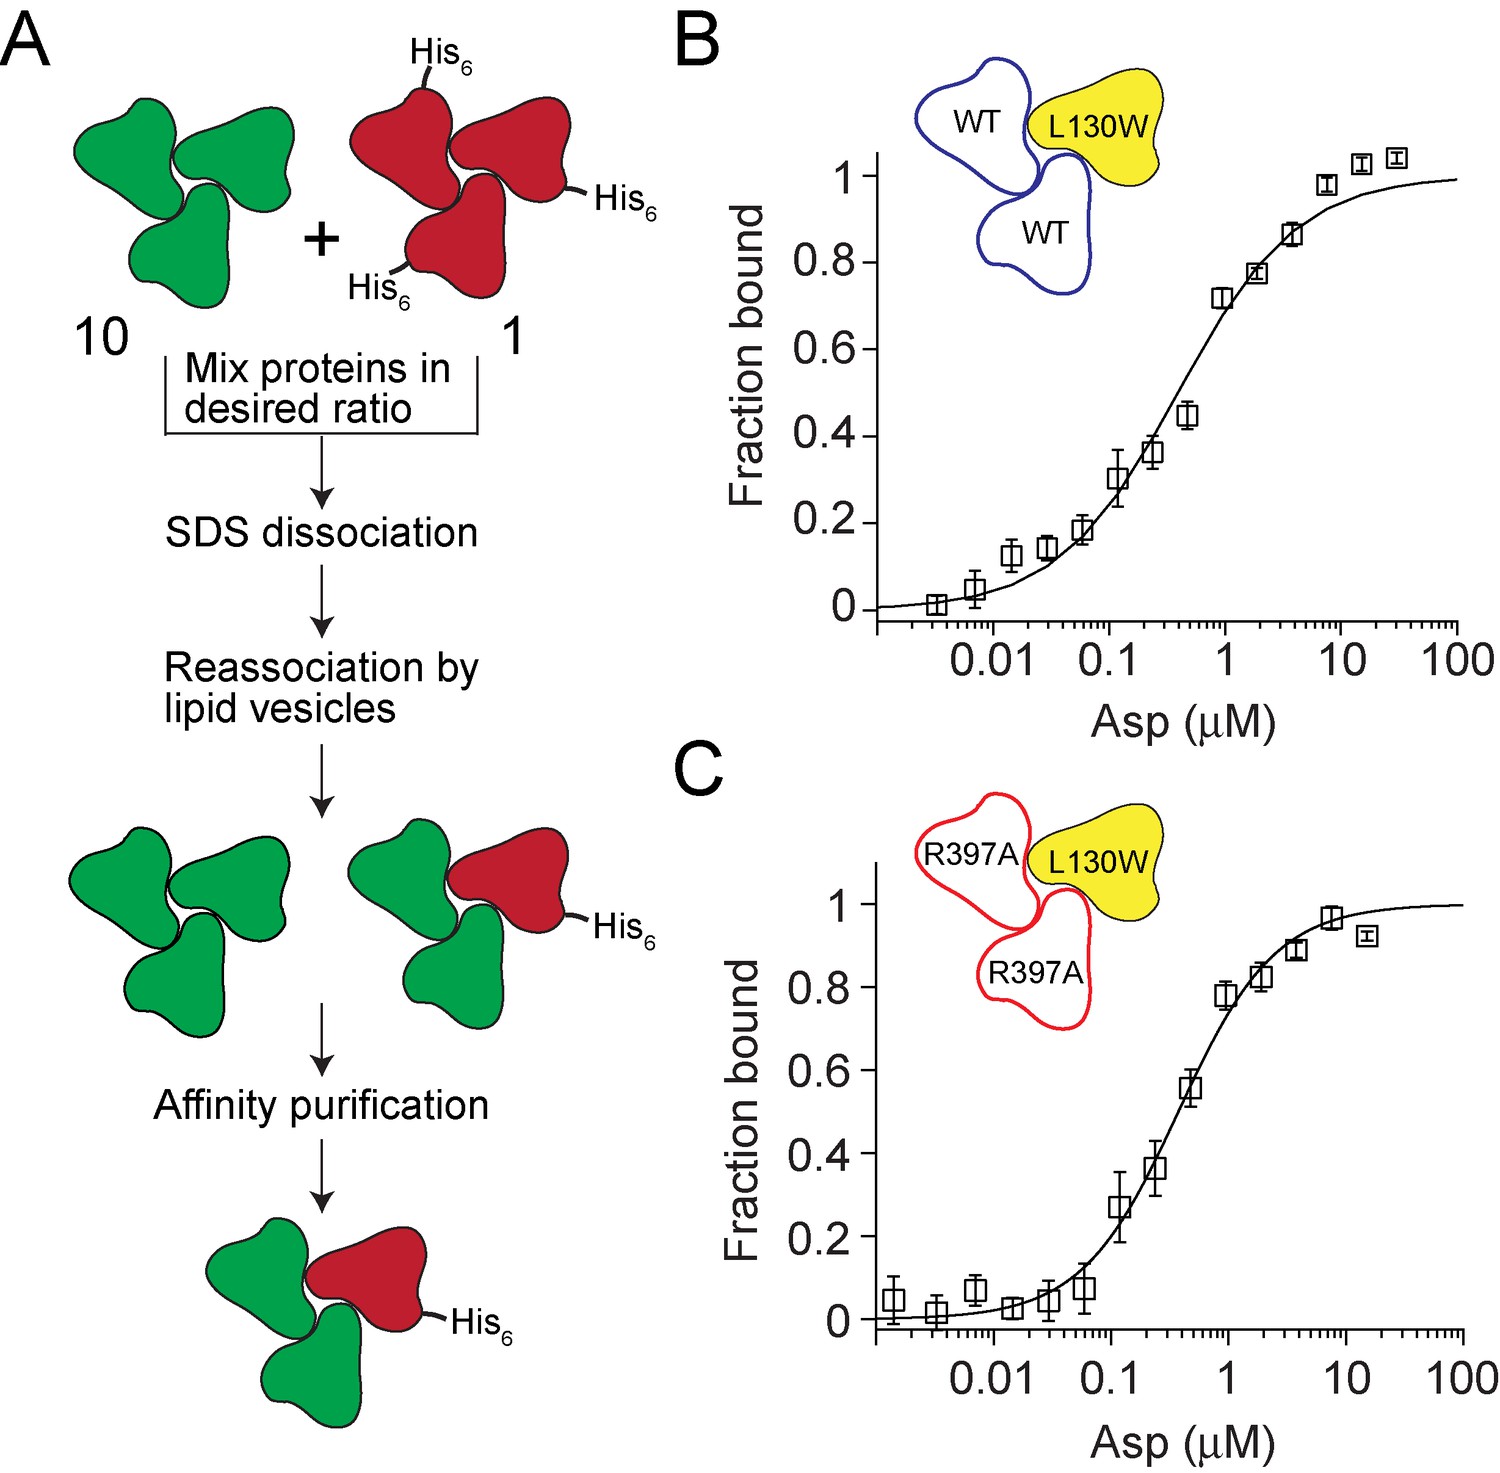
Testing crosstalk between GltPh subunits in Asp binding.
(A) Flowchart outlining the strategy used for assembling heterotrimers of GltPh. The test subunits are depicted in green and the reporter subunits are in red. A 10: 1 ratio of test to reporter subunits is used to ensure that the probability of assembling heterotrimers with more than one reporter subunit is very low. The presence of a polyhistidine tag on the reporter subunit enables purification of the heterotrimers that contain a reporter subuit. (B and C) Asp binding to heterotrimeric GltPh with test subunits containing the wild-type Asp-binding site (blue, B) or with a R397A substitution in the Asp binding site (red, C). The reporter subunit (yellow) contains the L130W substitution for monitoring Asp binding to the subunit. Asp-binding assays as described in Figure 1D. The solid lines indicate fits to the data using a Hill equation with KD = 455 ± 61 nM, Hill coefficient = 0.84 ± 0.08 for the heterotrimer with the wild-type test subunits and with KD = 356 ± 36 nM, Hill coefficient = 1.05 ± 0.07 for the heterotrimer with test subunits carrying the R397A substitution. Error bars indicate SEM for n > 3.
Figure 3—figure supplement 1
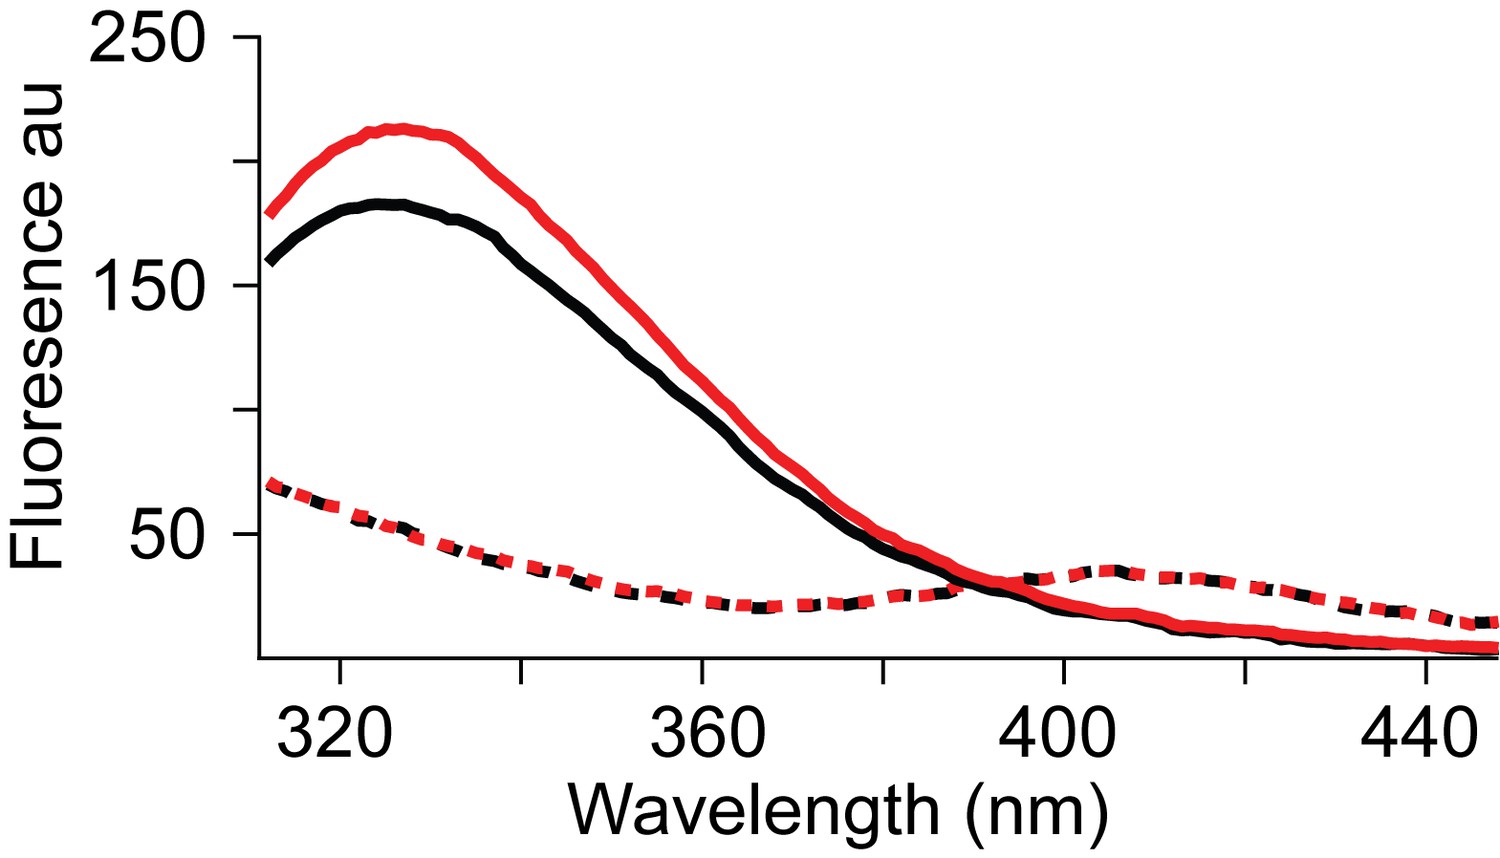
Spectral properties of wild type and L130W GltPh.
Fluorescence emission spectra of the L130W GltPh in 10 mM NaCl (solid black) and after addition of 100 μM Asp (solid red) with excitation at 295 nm. Spectra of the wild-type GltPh before (dashed black) and after the addition of 100 μM Asp (dashed red). Equal amounts (50 nM) of the wild type and the L130W GltPh protein was used for measuring the spectra. An increase in fluorescence at 334 nm is observed on Asp binding by L130W GltPh. No corresponding fluorescence change is observed for the wild-type GltPh.
Figure 3—figure supplement 2

Asp binding by R397A GltPh.
Asp binding by R397A GltPh with the L130W substitution in 10 mM Na+ was carried out as described in legend to Figure 1. The R397A substitution (KD = 238 μM) causes a ~ 1300 fold decrease in affinity for Asp binding compared to the wild-type GltPh (KD = 0. 183 μM). Error bars indicate SEM for n > 3.
Figure 3—figure supplement 3
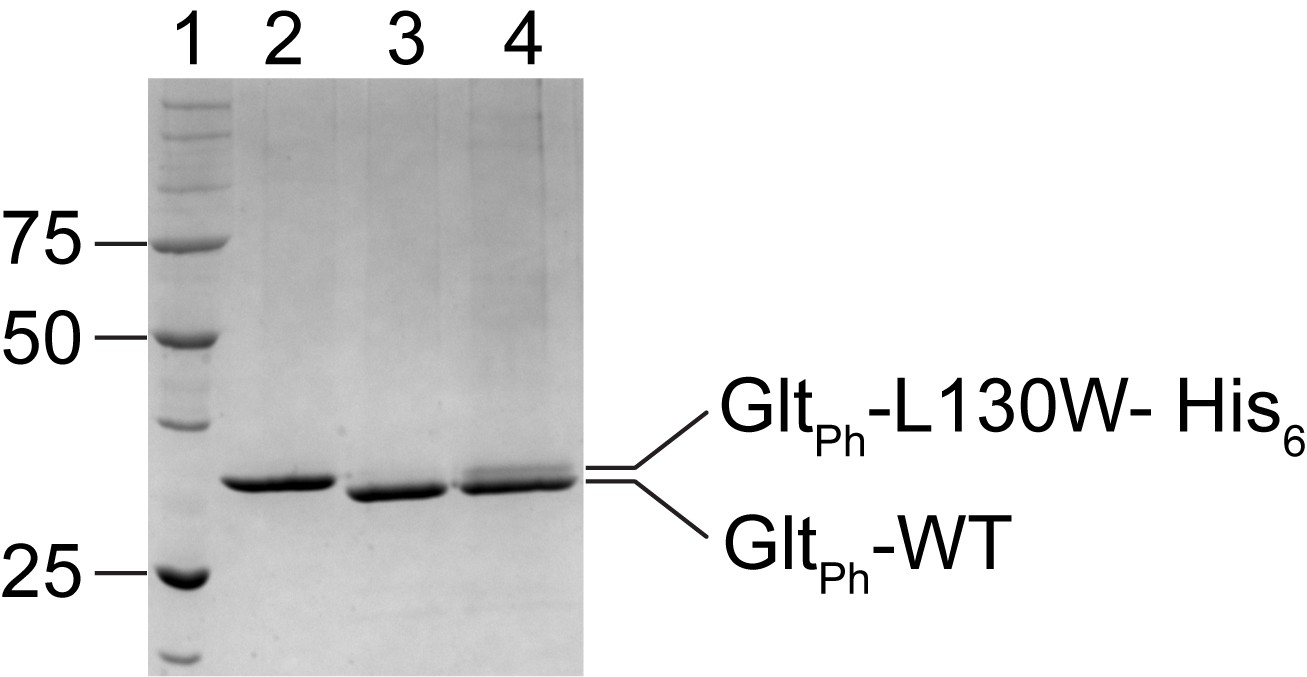
Assembly of heteromeric GltPh.
A heteromeric GltPh with two wild-type subunits and one subunit with the L130W substitution was assembled using the protocol diagrammed in Figure 3A. SDS-PAGE gel showing molecular weight markers (Lane 1), the L130W GltPh His6 (lane 2), wild type GltPh (Lane 3) and heterotrimeric GltPh (Lane 4). The presence of both the subunits in the heterotrimeric GltPh is shown.
Figure 4
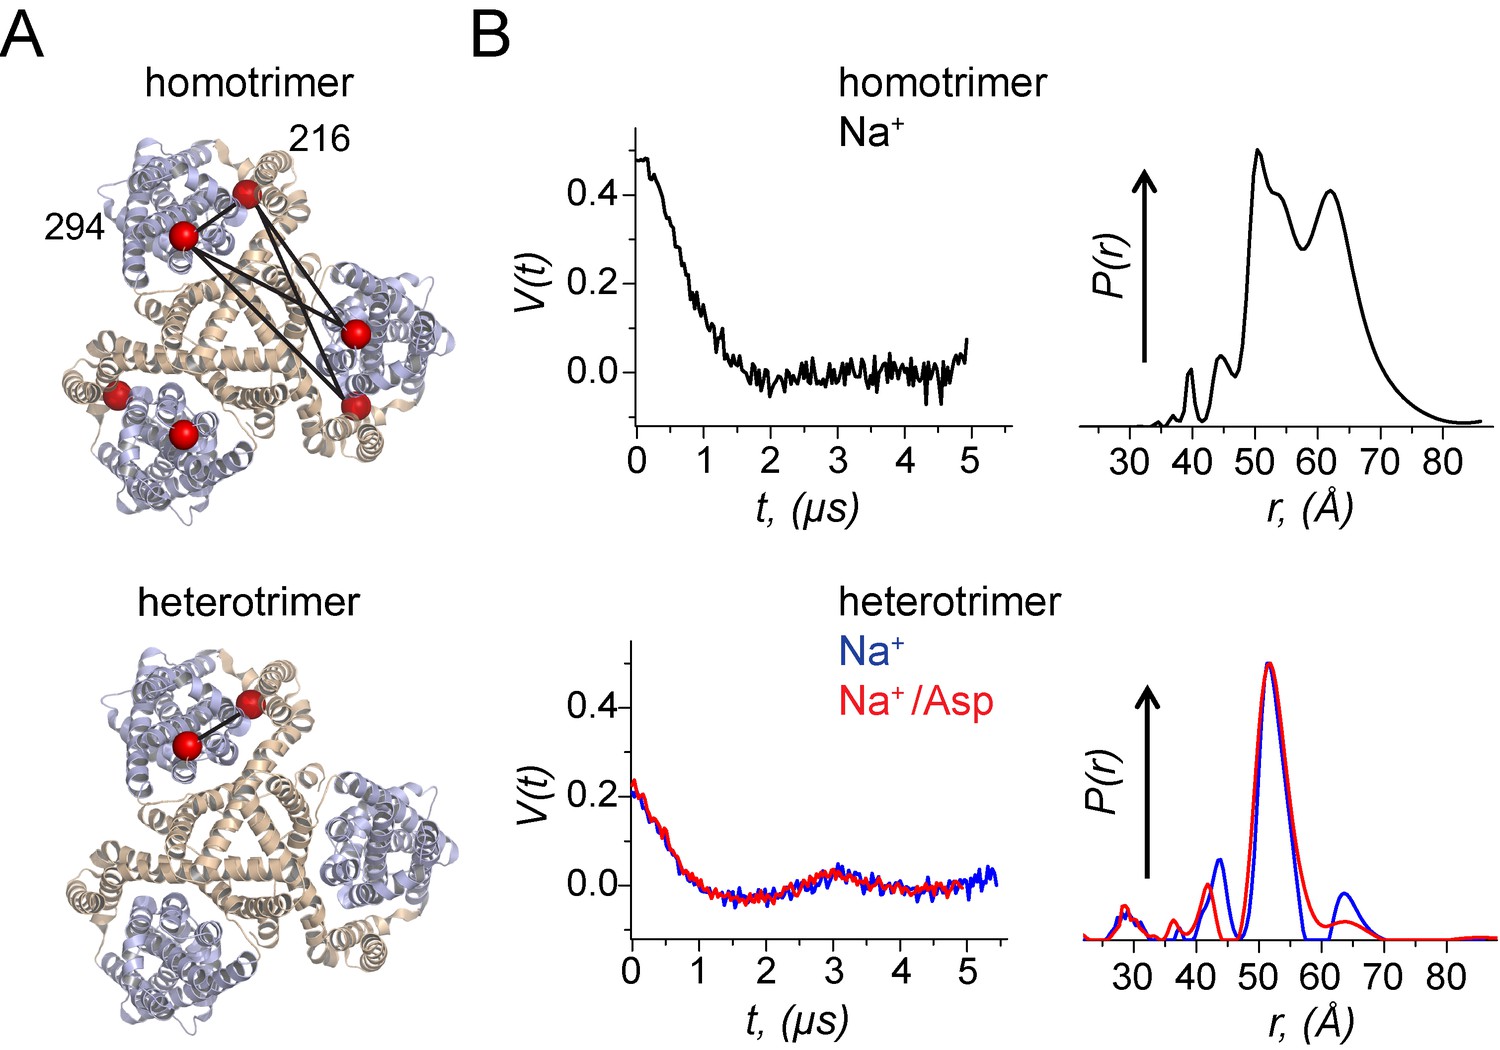
Using a heterotrimeric GltPh to probe movements of the transport domain using DEER.
(A) A homomeric and a heteromeric GltPh transporter are shown in ribbon representation. The scaffold domain is colored in wheat while the transport domain is colored in light blue. The Cβ atoms of the Cys residues at 216 and 294 labelled with spin probes are shown as red spheres. All subunits in the homomeric GltPh carry the Cys substitutions while only one subunit in the heteromeric GltPh carries the Cys substitutions. The distances monitored in the DEER experiment are indicated by solid lines. (B) Background-corrected DEER amplitude, V(t) vs. evolution time t (left). The data are shown for: GltPh homotrimers with spin labels at both positions in each of the protomers prepared with 200 mM NaCl (black); GltPh heterotrimer with spin-labels just in one of the protomers prepared with either 200 mM NaCl (blue) or 200 mM NaCl/300 μM aspartate (red). The data are plotted to have the 'DEER modulation depth’ at t = 0 and decay to zero value asymptotically (see Materials and methods). Larger modulation depth, that is V(0) indicates larger number of coupled spins. Inter-spin distance distributions, P(r), reconstructed from the above DEER data, are plotted in respective colors (right). All P(r)’s were normalized to common value at the maxima. GltPh heterotrimers show much simpler P(r) as compared to convoluted result for homotrimers.
Figure 5
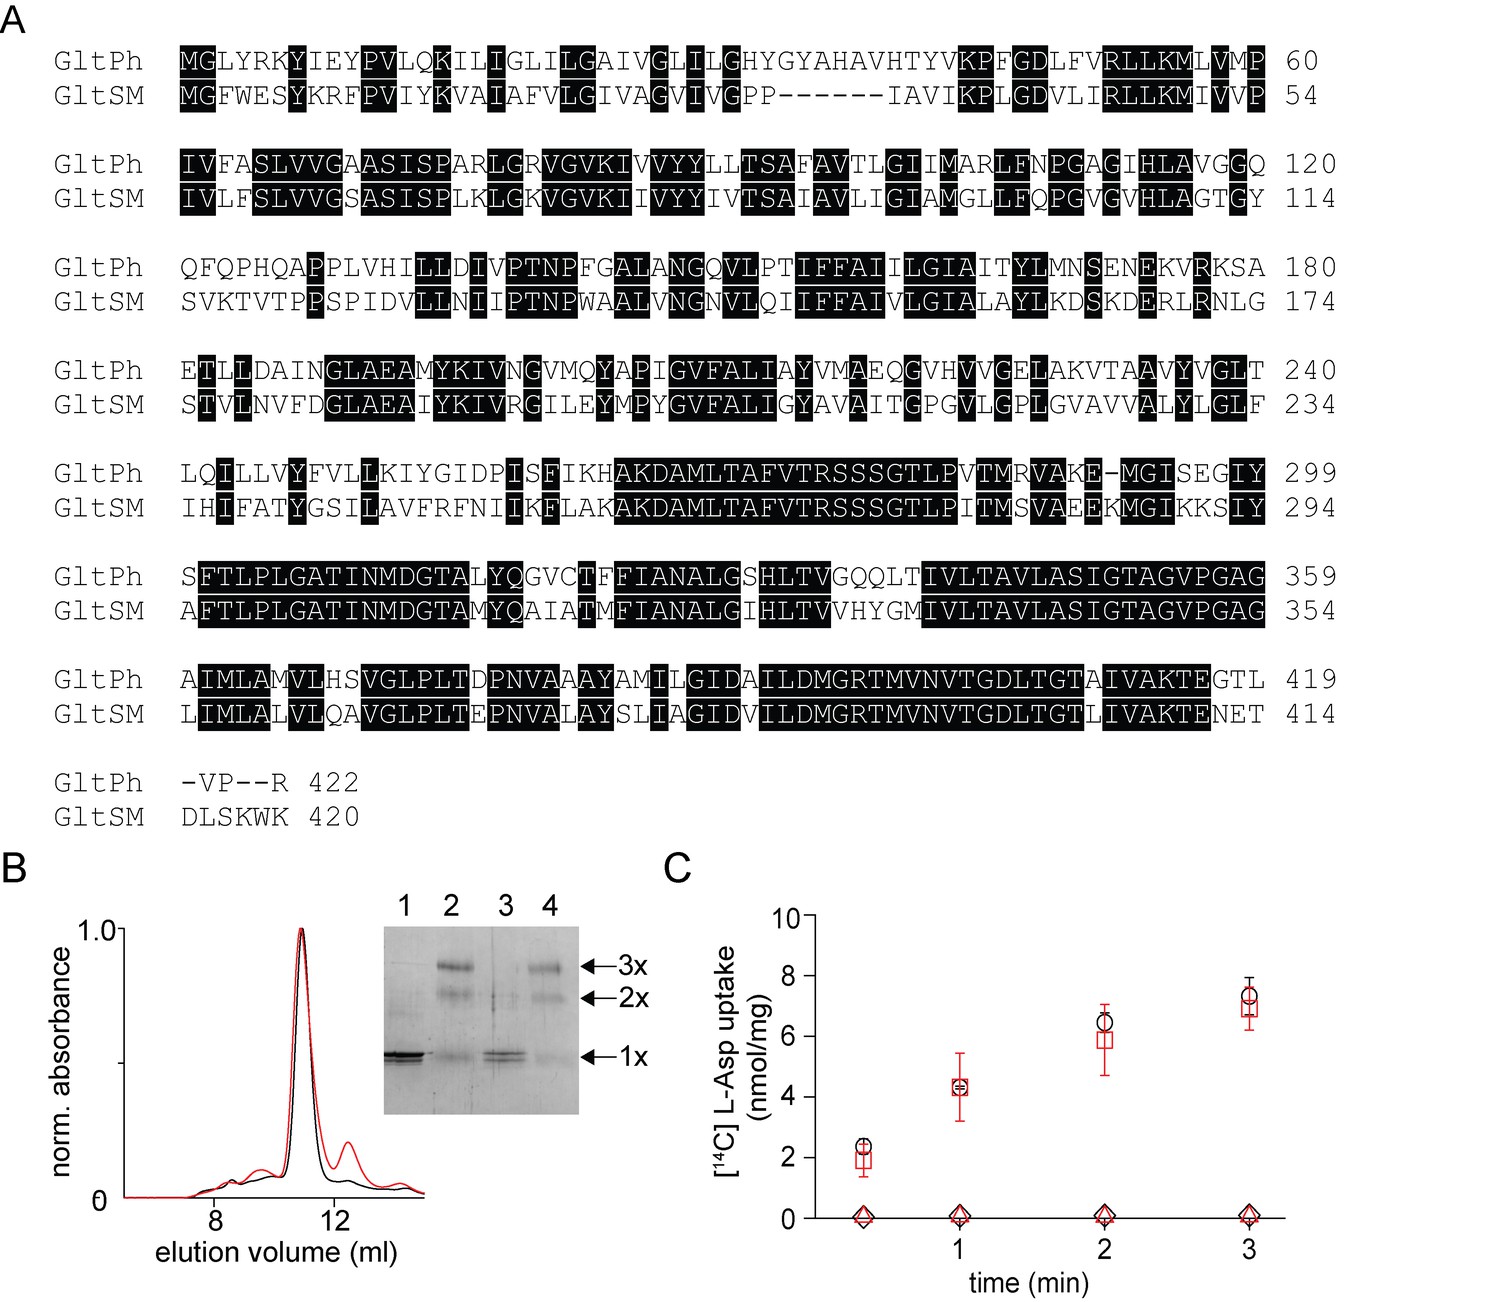
In vitro assembly of GltSm.
(A) Sequence alignment of GltSm with GltPh with identical residues highlighted. (B) Size exclusion chromatography of the native (black) and the reassociated GltSm (r-GltSm, red). Inset, SDS-PAGE gel shows the glutaraldehyde cross-linking of the native and r-GltSm. Native GltSm without (lane 1) and with glutaraldehyde crosslinking (lane 2) and r-GltSm without (Lane 3) and with glutaraldehyde crosslinking (Lane 4) are shown. The oligomeric nature of the protein band (1x, 2x, and 3x) is indicated. (C) Aspartate uptake assay. The time course of [14C]-Asp uptake by native GltSm (black circles) and r-GltSm (red squares) in the presence of a Na+ gradient. No uptake is observed for native GltSm (black diamonds) and r-GltSm (red triangles) in the absence of a Na+ gradient. Error bars indicate SEM for n > 3.
Figure 6

In vitro assembly of VcINDY.
(A) Structure of VcINDY (pdb: 4f35) is shown in ribbon representation. (B) Dissociation of the VcINDY dimer by SDS. SDS-PAGE gel showing the native VcINDY without (lane 1), with glutaraldehyde crosslinking (lane 2) and the SDS dissociated VcINDY without (lane 3) and with glutaraldehyde crosslinking (lane 4). (C) Size exclusion chromatography of the native (black) and the reassociated VcINDY (r-VcINDY, red). Inset, SDS-PAGE gel showing the glutaraldehyde cross-linking of the peak fraction of r-VcINDY without (lane 1) and with glutaraldehyde crosslinking (lane 2). (D) Succinate uptake assay. The time course of [14C]-succinate uptake by native VcINDY (black circles) and r-VcINDY (red squares) in the presence of a Na+ gradient. No uptake is observed for native VcINDY (black diamonds) and r-VcINDY (red triangles) in the absence of a Na+ gradient. Error bars indicate SEM for n > 3.
Figure 7

In vitro assembly of CLC-ec1.
(A) Structure of CLC-ec1 (pdb: 1kpl) shown in ribbon representation. (B) Size exclusion chromatography of the native (black) and the in vitro assembled CLC-ec1 (r-CLC-ec1, red). Inset, SDS-PAGE gel showing the glutaraldehyde cross-linking of the peak fraction of native and r-CLC-ec1. Native CLC-ec1 without glutaraldehyde crosslinking (lane 1), with glutaraldehyde crosslinking before (lane 2) and after (Lane 3) treatment with 1% SDS. r-CLC-ec1 without glutaraldehyde crosslinking (lane 4), with glutaraldehyde crosslinking before (lane 5) and after (Lane 6) treatment with 1% SDS. (C) Fluorescence spectra of the native and r-CLC-ec1. Intrinsic fluorescence spectra (excitation at 295 nm) for the native (solid black) and r-CLC-ec1 (solid red) in 50 mMTris-HCl, pH 7.5, 200 mM NaCl, 0.25% DM. Dashed lines show the fluorescence spectra for the native (dashed black) and r-CLC-ec1 (dashed red) after the addition of 1% SDS. (D) Chloride transport assays. Left: Chloride efflux from liposomes containing native CLC-ec1 (Black), r-CLC-ec1 (red), and no protein control (blue). Bulk efflux was initiated at time zero by the addition of valinomycin. Triton X-100 was added after 60 s to release all of the intra-vesicular chloride. Chloride efflux was normalized to the total chloride concentration upon addition of Triton X-100. Right: Bar graph showing the normalized rate of chloride movement through liposomes containing native CLC-ec1 (N), r-CLC-ec1 (R), and no protein control (C). Normalized rates were calculated from the initial slope after addition of valinomycin from graphs such as those shown on the left. Error bars represent the SEM from six independent flux assays.
Tables
Key resources table
| Reagent type (species) or resource | Designation | Source or reference | Identifiers | Additional information |
|---|---|---|---|---|
| Gene (Pyrococcus horikoshii) | GltPh | 10.1038/nature03018 | Uniprot ID: O59010 | |
| Gene (Vibrio cholerae) | VcINDY | 10.1038/nature11542 | Uniprot ID: Q9KNE0 | |
| Gene (Escherichia coli) | CLC-ec1 | 10.1085/jgp.200308935 | Uniprot ID: P37019 | |
| Gene (Staphylothermus marinus) | GltSm | 10.1111/febs.12105 | Uniprot ID: A3DPQ3 | |
| Recombinant DNA reagent | pBCH/G4-GltPh | 10.1038/nature03018 | ||
| Recombinant DNA reagent | pET-VcINDY | 10.1038/nature11542 | ||
| Recombinant DNA reagent | pASK-CLC-ec1 | 10.1085/jgp.200308935 | ||
| Recombinant DNA reagent | pBAD-GltSm | This study | GltSm from the GltSm-GFP fusion gene (ref: 10.1111/febs.12105) was cloned into a pBAD-HisA vector (Fisher Scientific) | |
| Chemical compound, drug | Asolectin | Avanti Polar Lipids | Cat # 541601G | |
| Software, algorithm | Pymol | PyMOL Molecular Graphics System, Schrödinger, LLC | RRID:SCR_000305 | www.pymol.org |
| Software, algorithm | Matlab | Mathworks | RRID:SCR_001622 | www.mathworks.com |
| Software, algorithm | Origin | Originlab | RRID:SCR_014212 | www.originlab.com |
Additional files
-
Transparent reporting form
- https://doi.org/10.7554/eLife.36478.012
Download links
A two-part list of links to download the article, or parts of the article, in various formats.
Downloads (link to download the article as PDF)
Open citations (links to open the citations from this article in various online reference manager services)
Cite this article (links to download the citations from this article in formats compatible with various reference manager tools)
A facile approach for the in vitro assembly of multimeric membrane transport proteins
eLife 7:e36478.
https://doi.org/10.7554/eLife.36478


