Dissection of the in vitro developmental program of Hammondia hammondi reveals a link between stress sensitivity and life cycle flexibility in Toxoplasma gondii
- Dietrich School of Arts and Sciences, University of Pittsburgh, United States
- Beltsville Agricultural Research Center, Agricultural Research Service, U.S. Department of Agriculture, United States
Figures
Figure 1
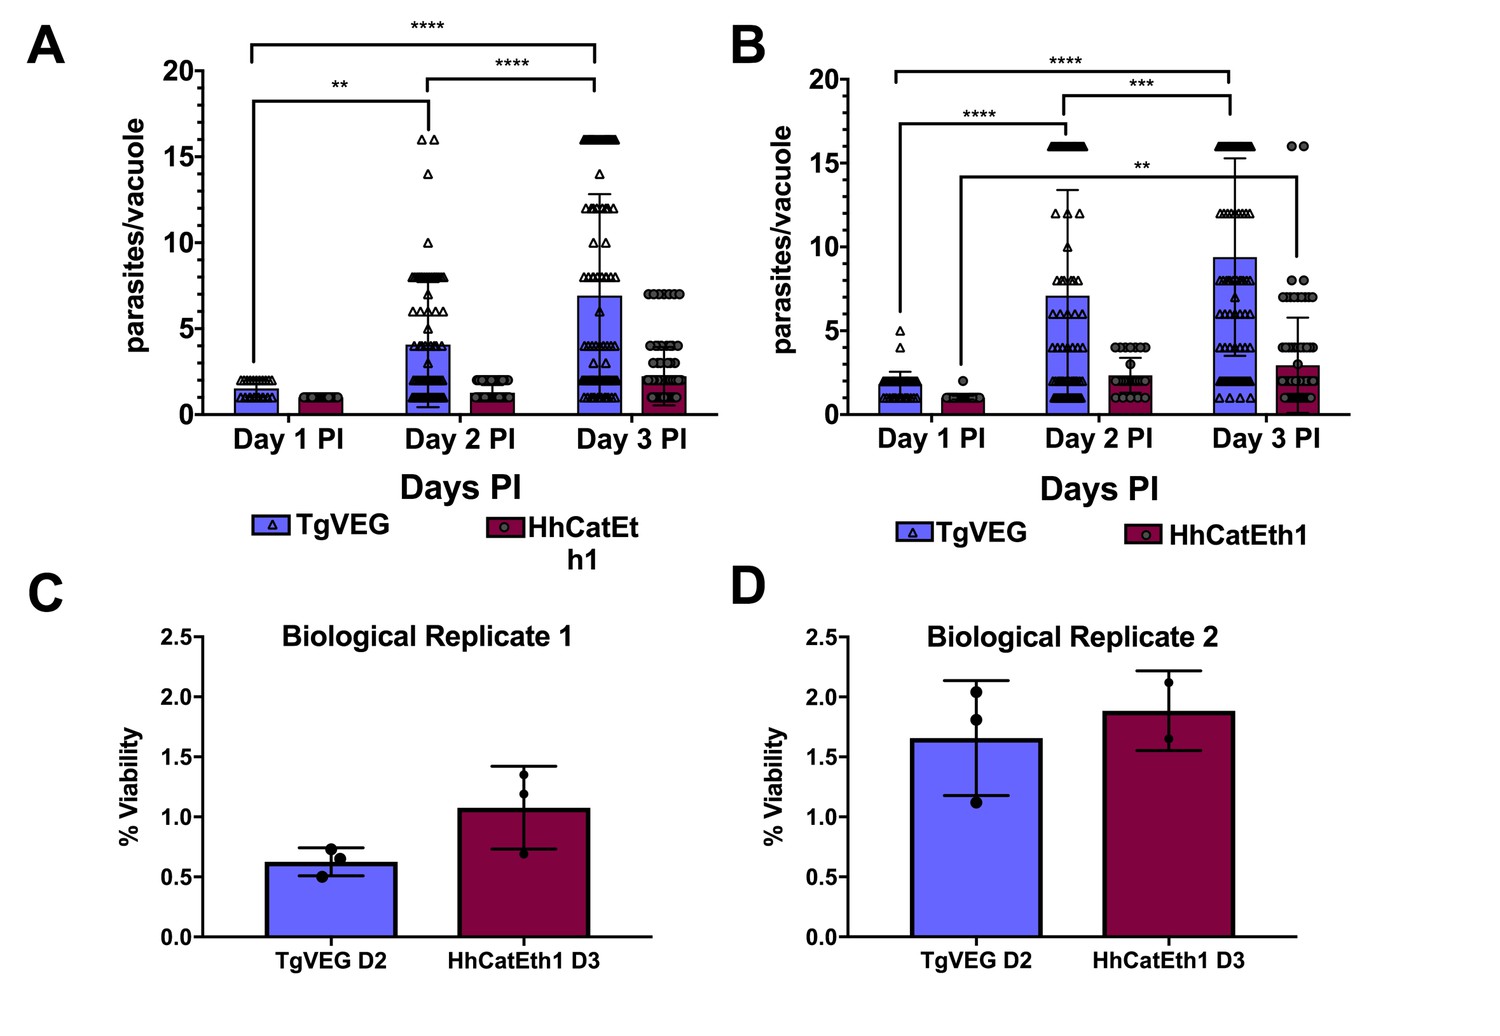
T. gondii and H. hammondi maintain similar infection rates, but T. gondii replicates at significantly higher rates.
(A–B) Confluent monolayers of HFFs were infected with either HhCatEth1 or TgVEG sporozoites, obtained via in vitro excystation at an MOI of 0.5. Infected monolayers were fixed at 1, 2, and 3 DPI and assayed for the number of parasites observed in each vacuole for infection with T. gondii and H. hammondi for a total of 2 replicates, Replicate 1 (A) and Replicate 2 (B). Vacuoles containing more than 16 parasites were binned at 16 as it was defined as the limit of confident detection. Bars represent mean ± SD. For both Biological Replicate 1 and 2, there was a significant difference between the number of parasites per vacuole on Days 1, 2, and 3 PI for TgVEG. For Biological replicate 1, there was no significant difference between the number of parasites per vacuole for HhCatEth1 on Days 1, 2 and 3 PI. For Biological Replicate 2, there was a significant difference in the number of parasites per vacuole between 1 and 3 DPI for HhCatEth1. Statistical significance was determined with a 2-Way ANOVA and Tukey's multiple comparison test. (C–D) There is no significant difference in sporozoite infectivity between HhEthCat1 and TgVEG. Graphs demonstrate the in vitro percent viability of excysted HhCatEth1 and TgVEG sporozoites 2 and 3 days, respectively, post excystation. Bars show the mean ± SD of three technical replicates. The viability assay was repeated with two biological replicates and there was no significance in viability between species within experiments, determined via unpaired t-test with Welch's correction.
Figure 2
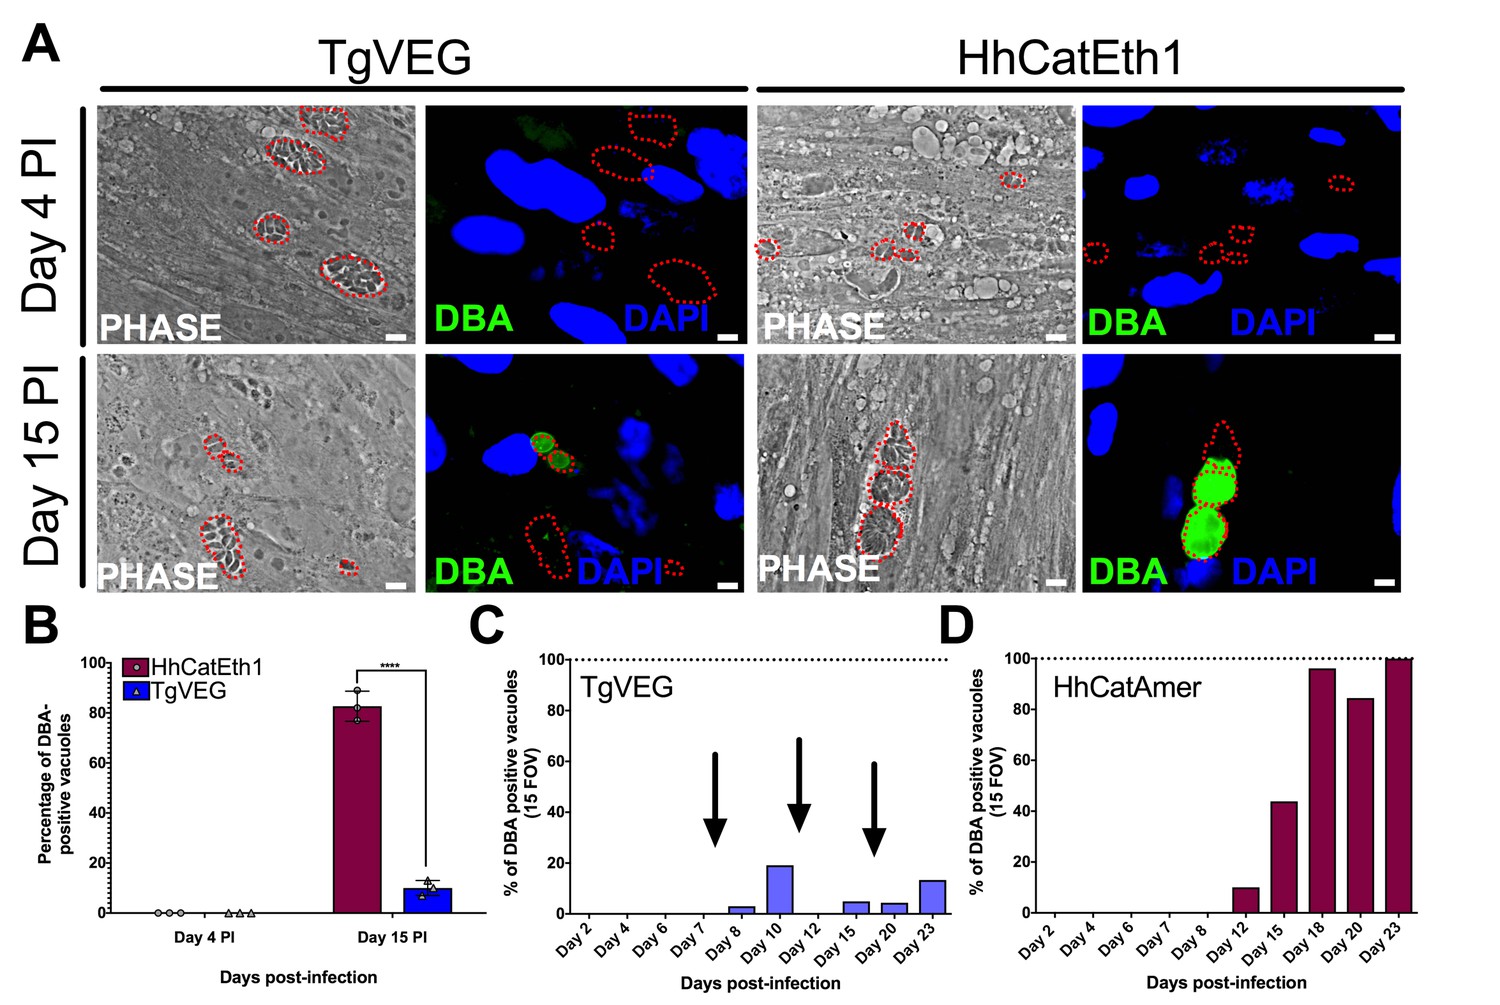
T. gondii and H. hammondi spontaneously form tissue cysts in vitro, but do so with different dynamics.
(A) Representative images of cells infected with T. gondii (TgVEG) and H. hammondi (HhCatEth1) sporozoites that were fixed and stained with DBA after 4 and 15 DPI. Scale bar represents 5 µm. (B) Quantification of T. gondii and H. hammondi infection described in A demonstrating that after 4 days, neither H. hammondi or T. gondii spontaneously form tissue cysts, but both parasite species form tissue cysts after 15 DPI. However, the percentage of H. hammondi tissue cysts is significantly increased after 15 DPI when compared to T. gondii. Statistical significance was determined using a 2-way ANOVA with Sidak’s multiple comparison test. (****=P < 0.0001). (C and D) Average percentage of DBA positive vacuoles in 15 FOV over a course of a 23 day infection with T. gondii (TgVEG) and H. hammondi (HhCatAmer). Arrows in (C) indicate when T. gondii was passed onto new host cells to prevent complete lysis. (D) H. hammondi form tissue cysts after 12 DPI. The percentage of DBA positive vacuoles increases until all vacuoles are DBA positive at 23 DPI. (C) T. gondii forms tissue cysts at 8 DPI, however, the percentage of DBA positive vacuoles does not reach 100% during the 23 day infection.
Figure 3 with 3 supplements
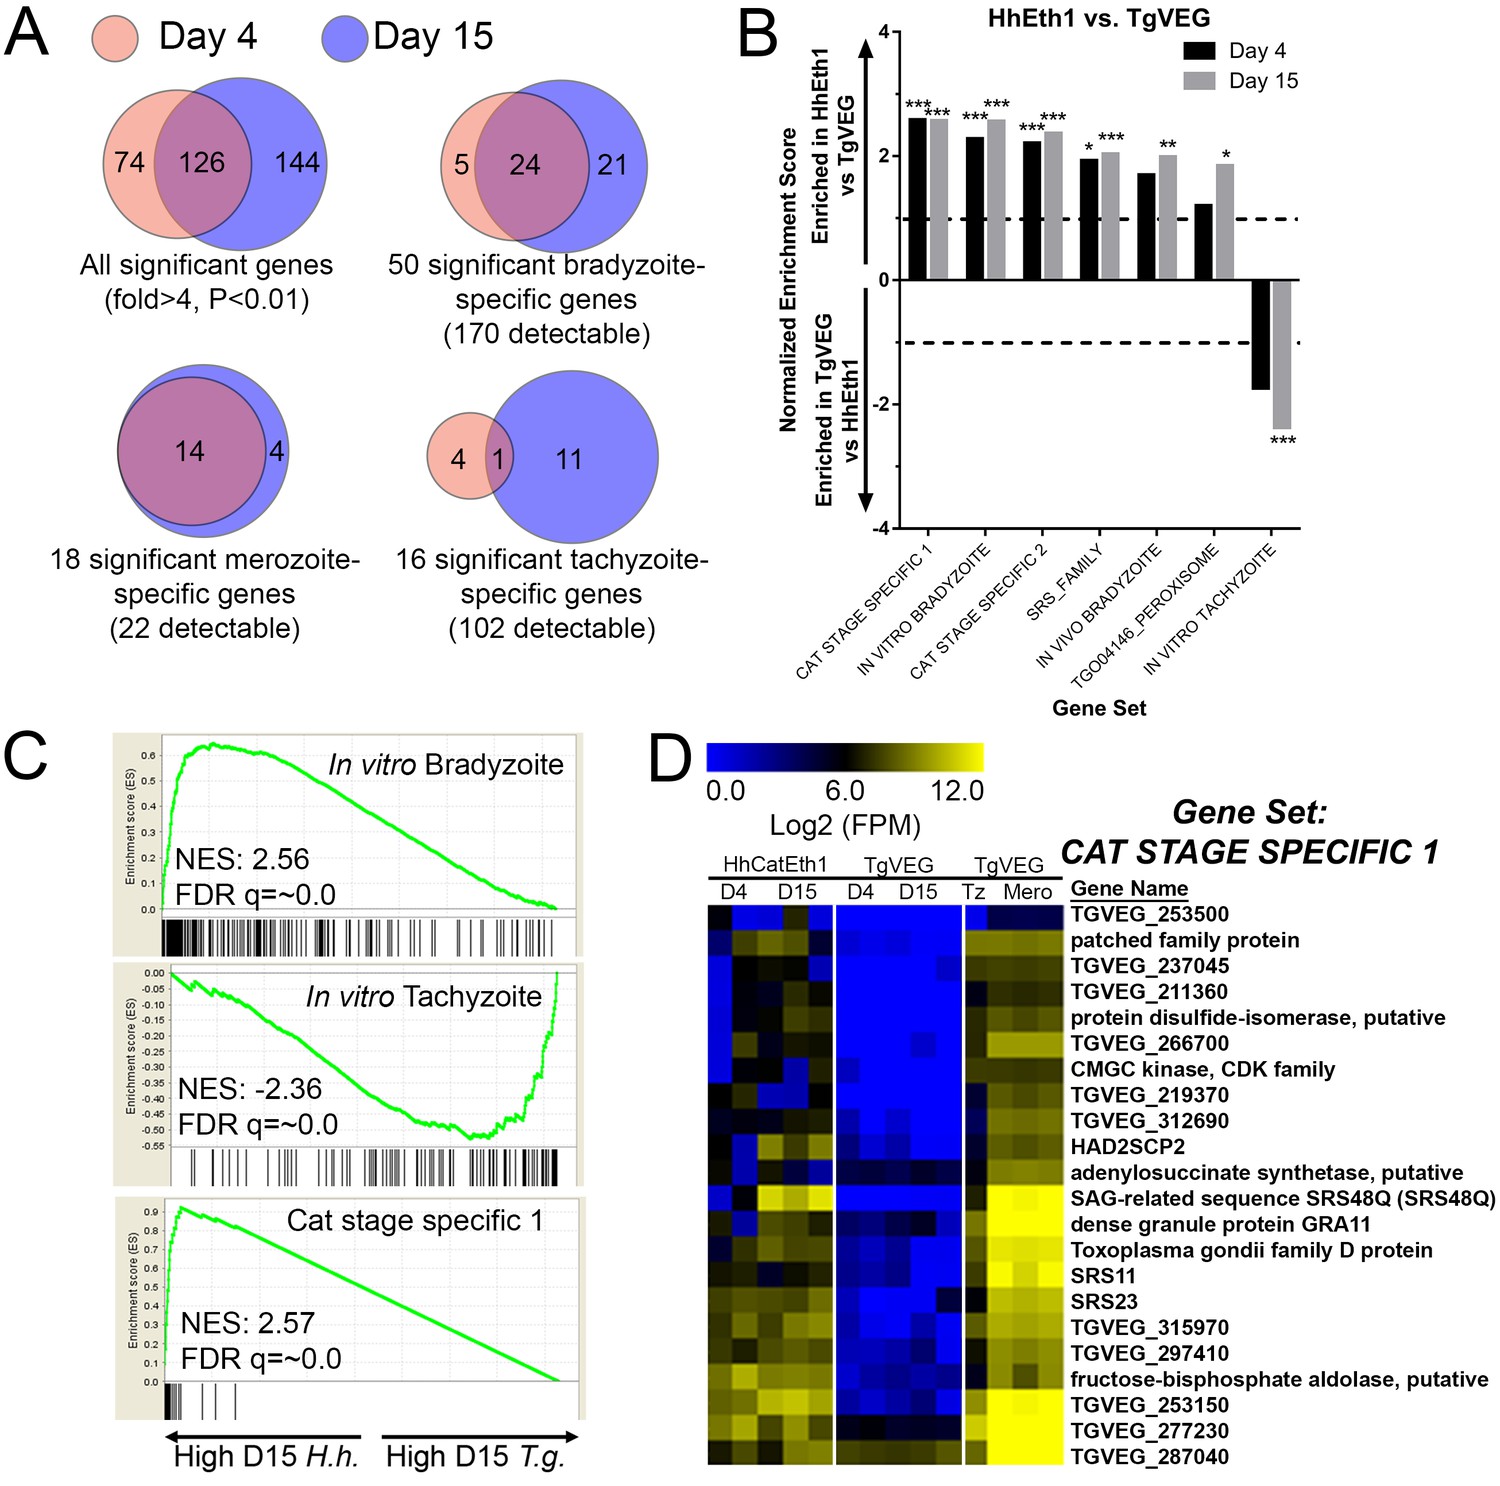
mRNAseq comparisons between T. gondii and H. hammondi identify unique aspects of the H. hammondi transcriptome.
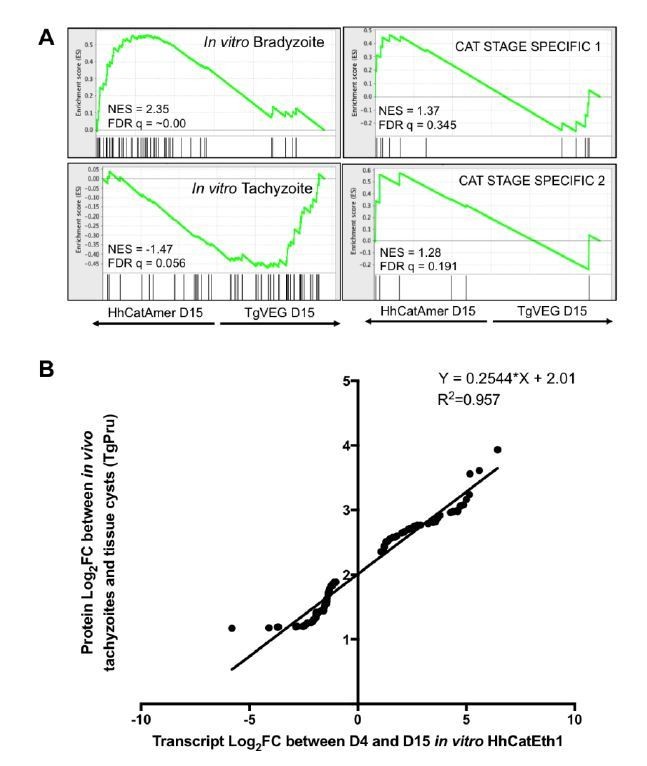
(A) Venn diagrams indicating the degree of overlap in genes of significantly different transcript abundance between T. gondii and H. hammondi at D4 and D15 post-infection. While overall there are distinct genes that are significantly different at D4 and D15 (Venn diagram, upper left), H. hammondi expresses high numbers of bradyzoite genes even at 4 dPI and this number increases further by D15 (21 additional genes; Venn diagram in upper right). This progression towards an increase in the number of bradyzoite genes over time is not recapitulated among merozoite-specific genes, in that only four additional detectable genes from this gene set were found to be of significantly higher abundance (Padj <0.01; Fold-change ≥4) at 15 DPI. Moreover 18 of the 22 total detectable merozoite genes were of significantly different abundance in H. hammondi, indicating its transcriptional similarity to both bradyzoites and merozoites. (B) Gene Sets found to be significantly (FDR q-value <0.05) enriched in H. hammondi high-abundance transcripts (top) or T. gondii high-abundance transcripts (bottom) at either 4 or 15 days in culture. Gene Set Details can be found in Table 2. *: p<0.05; **: p<0.01; ***: p<0.001. (C) GSEA plots of the in vitro bradyzoite, in vitro tachyzoite, and Cat stage specific one gene sets, showing enrichment profiles between H. hammondi and T. gondii at 15 DPI. NES; Normalized enrichment score. FDR q: False discovery rate q-value. (D) Hierarchically clustered expression data for detectable genes in the CAT STAGE SPECIFIC one gene set in H. hammondi or T. gondii grown for 4 or 15 days in vitro, or for T. gondii grown as tachyzoites or merozoites (in cat enteroepithelial cells).
Figure 3—figure supplement 1
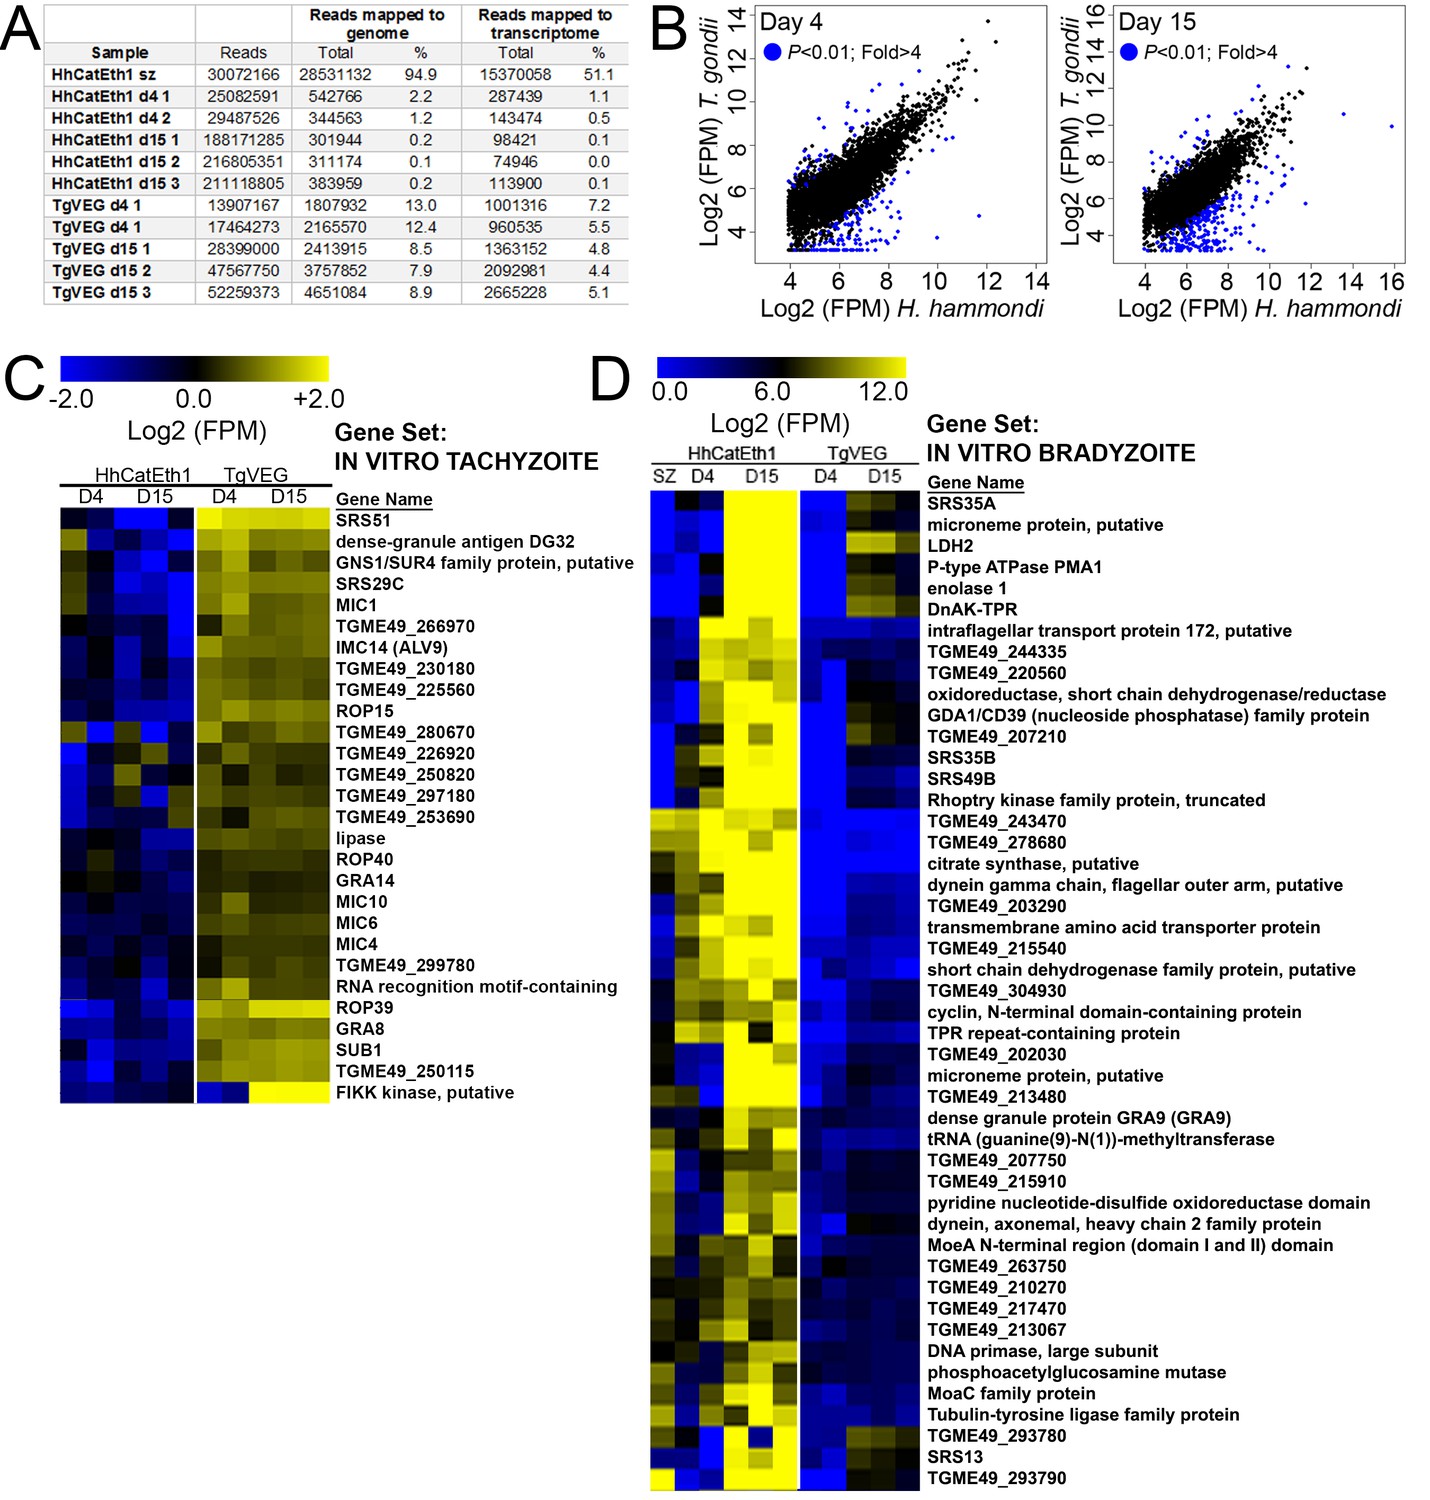
Transcriptional profiling and Gene Set Enrichment Analysis of T. gondii and H. hammondi.
(A) Summary of reads obtained for each parasite species and life stage, and the percentage of reads from each that mapped to the respective parasite genomes or transcriptomes. (B) Log2-transformed and normalized Fragments Per Million (FPM) data for the 4276 shared genes between T. gondii and H. hammondi that passed thresholds for detection in both species. Genes of significantly different abundance (based on criteria as listed in inset) are blue. (C) Hierarchical cluster (Euclidean distance, complete) of all detectable genes belonging to the IN VITRO TACHYZOITE gene set. Raw Log2 transformed FPM values (taken from DESeq2 following normalization and transformation using ‘rlog’) are shown. (D) Hierarchical cluster (Euclidean distance, complete) of all detectable genes belonging to the IN VITRO BRADYZOITE gene set. Raw Log2 transformed FPM values (taken from DESeq2 following normalization and transformation using ‘rlog’) are shown. Gene sets are described in Table 2.
Figure 3—figure supplement 2

mRNA-seq comparisons between TgVEG and HhCatAmer sporozoites identify unique H. hammondi transcriptome profiles.
(A) A heat map illustrates differential expression profiles of cat stage specific genes enriched for TgVEG and HhCatAmer. The relative levels of gene expression (mean-centered log2-fold change) are depicted using a color scale where blue indicates the lowest level of expression and yellow indicates the highest level of expression. (B) Gene sets found to be enriched in H. hammondi high-abundance transcripts at 1 day post-excystation. Gene set details can be found in Table 2. (***: FDR q < 0.001; **: FDR q < 0.01). The AP2 transcription factor gene set is provided as a negative control. (C) GSEA plot of cat stage specific one gene set, showing enrichment profiles between H. hammondi and T. gondii at 1 day post-excystation. NES: Normalized enrichment score. FDR q: False discovery rate q-value. (D) A summary of reads obtained for each parasite species, and the percentage of reads from each that mapped to the respective parasite genomes or transcriptomes. A total of 8912 genes that had at least one read in both TgVEG and HhCatAmer samples were selected for analysis.
Figure 3—figure supplement 3
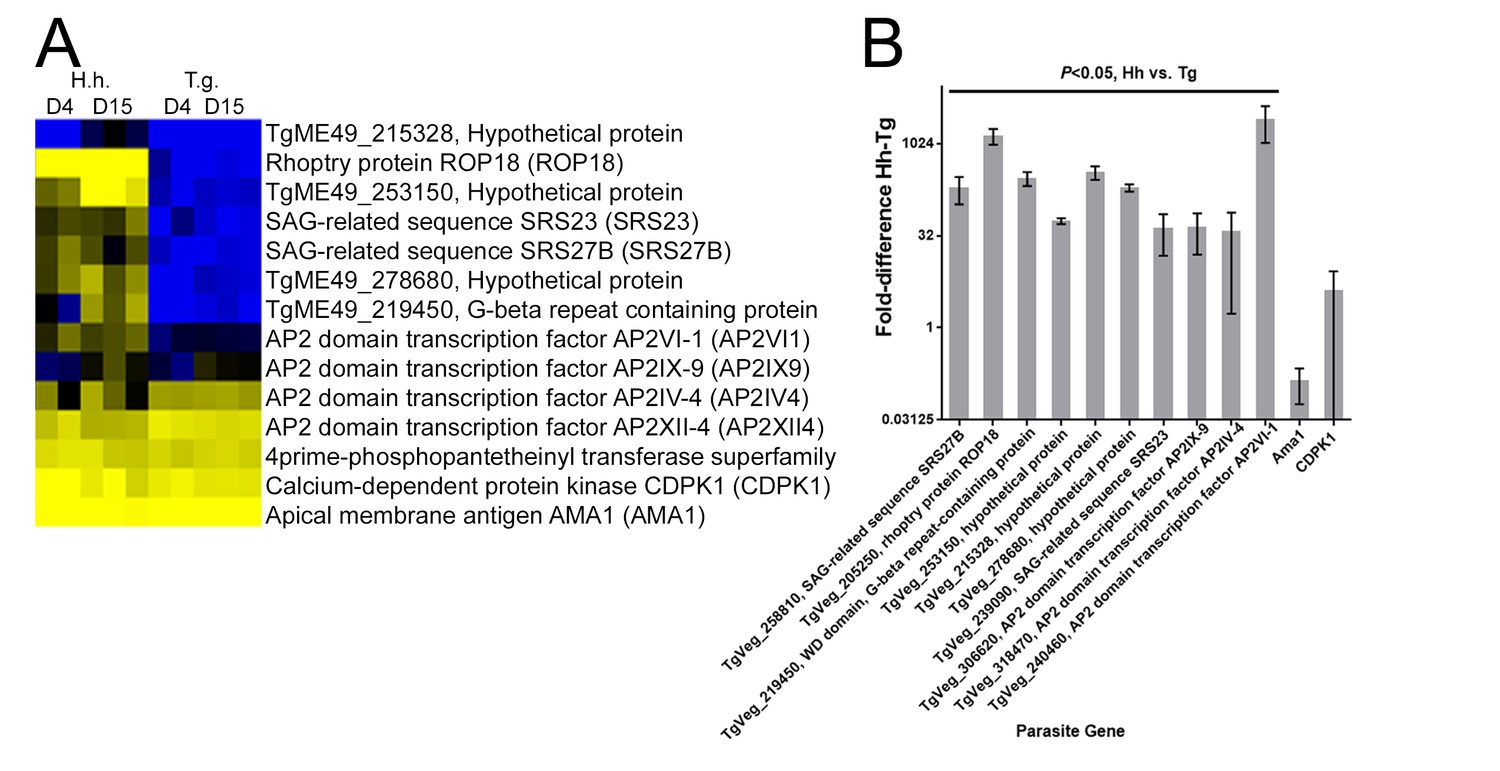
qPCR validation for nine transcripts that were found to be of higher abundance in D4 or D15 H. hammondi compared to T. gondii.
(A) Clustered Log2(TPM) value taken from RNAseq expression profiles of HhCatEth1 and TgVEG at 4 and 15 DPI. Gene models are from TgME49 since that is the most well-annotated T. gondii genome and upon which our synteny maps were based. (B) qPCR for nine transcripts show significantly higher transcript level in HhCatEth1 compared to TgVEG at D4 pi. Fold difference of HhCatEth1 genes relative to TgVEG is shown; bars represent mean and SD from three biological replicates. Significance was determined from ΔCt values using multiple t-tests and the Holm-Sidak method, with alpha = 5.0%. Apical membrane antigen 1 (AMA1) and calcium dependent protein kinase 1 (CDPK1) genes served as examples of transcripts found to not differ between species and transcript abundance values were normalized using parasite GAPDH genes. All genes were queried using species-specific primers.
Figure 4 with 1 supplement
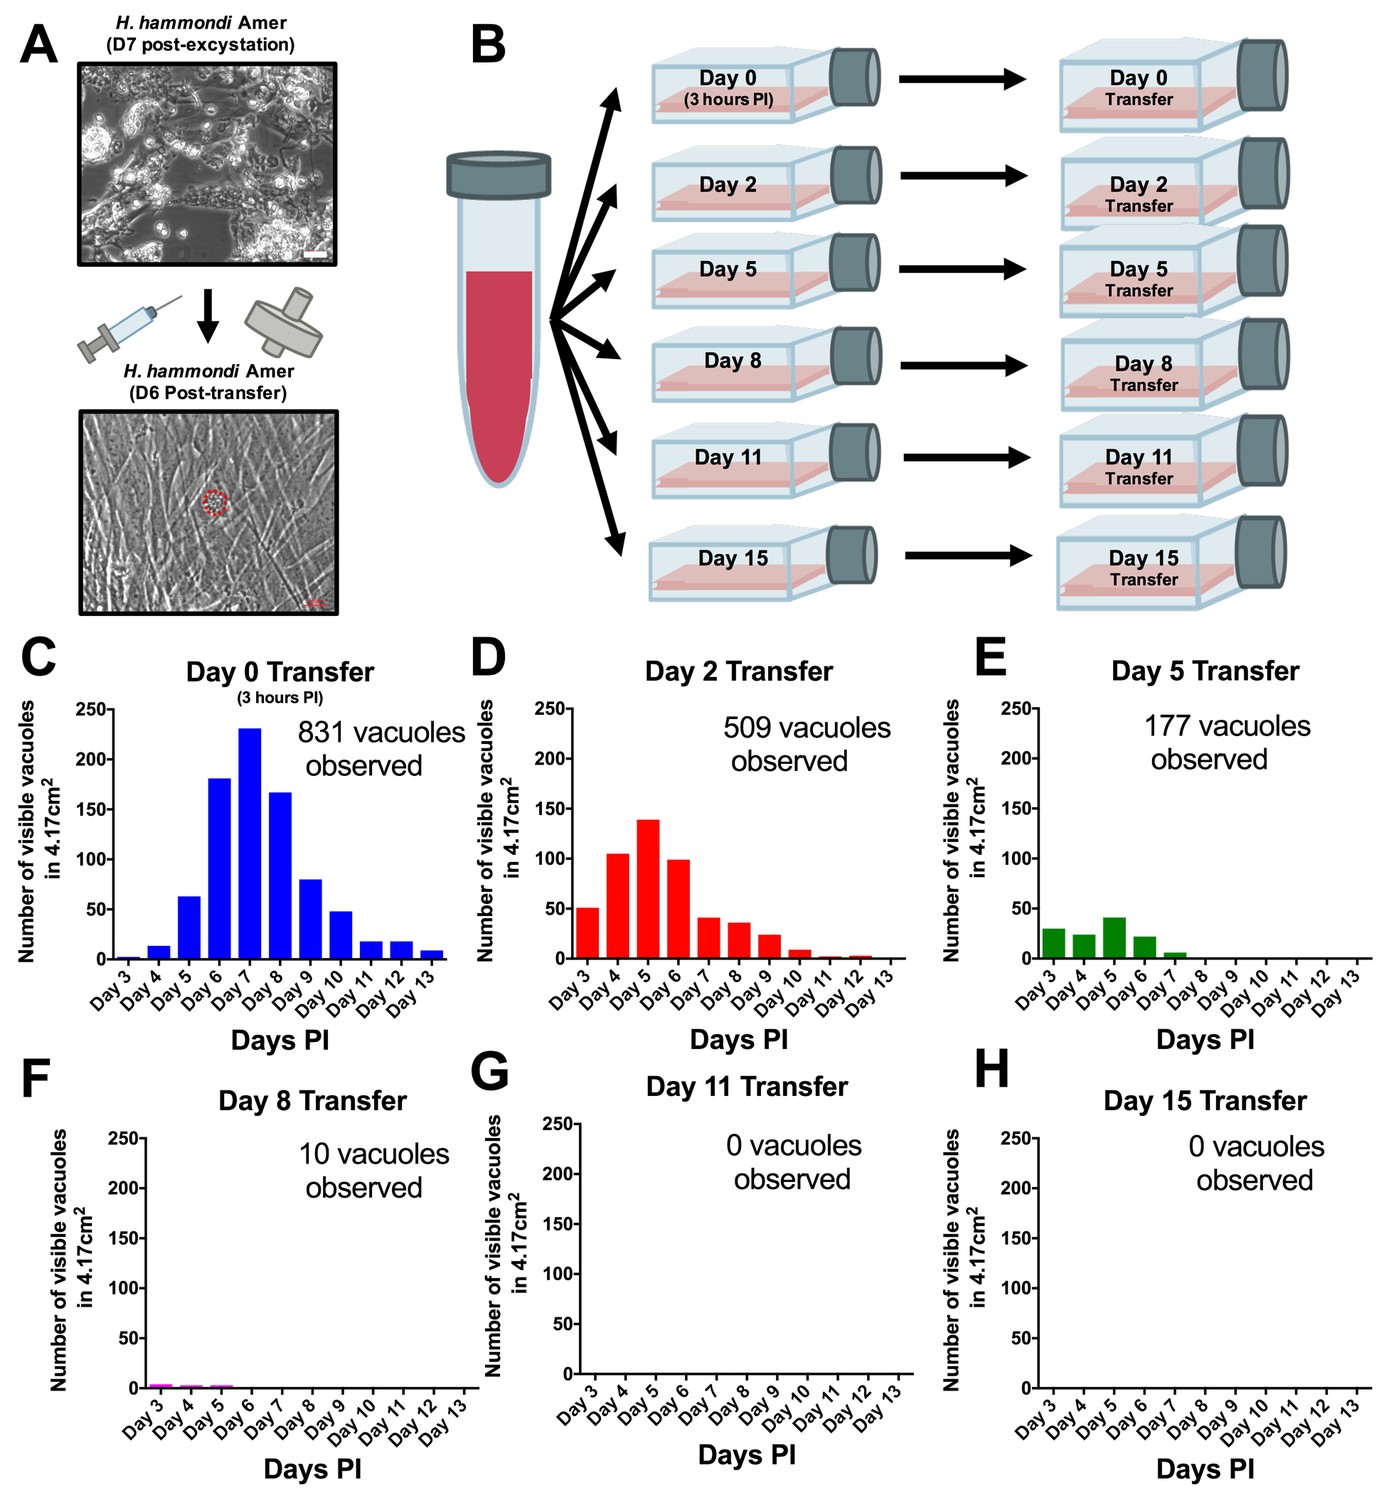
H. hammondi can be successfully subcultured in vitro for a limited period of time.
(A) Monolayers containing HhCatAmer with oocyst debris were needle passaged, filtered, and used to infect a confluent monolayer of HFFs seven days post-excystation. Vacuoles were observed in subcultured monolayers after 6 DPI. (B–H) Confluent monolayers of HFFs were infected with HhCatAmer sporozoites at an MOI of ~2. (2,812,500 sporozoites). After a three-hour incubation at 37°C, the Day 0 transfer flask was scraped, needle passaged, filtered, and transferred to a new host cells. This process was repeated after 2, 5, 8, and 15 days of growth. Each flask was monitored daily for the number (C–H) for 13 DPI, or until visible vacuoles were no longer detected. The number of visible vacuoles increased in number for the first week post-excystation then began to decrease. Replicative capacity was greatest for sporozoites transferred to new host cells at Day 0 (C) and decreased during each subsequent passage. (D–H).
Figure 4—figure supplement 1
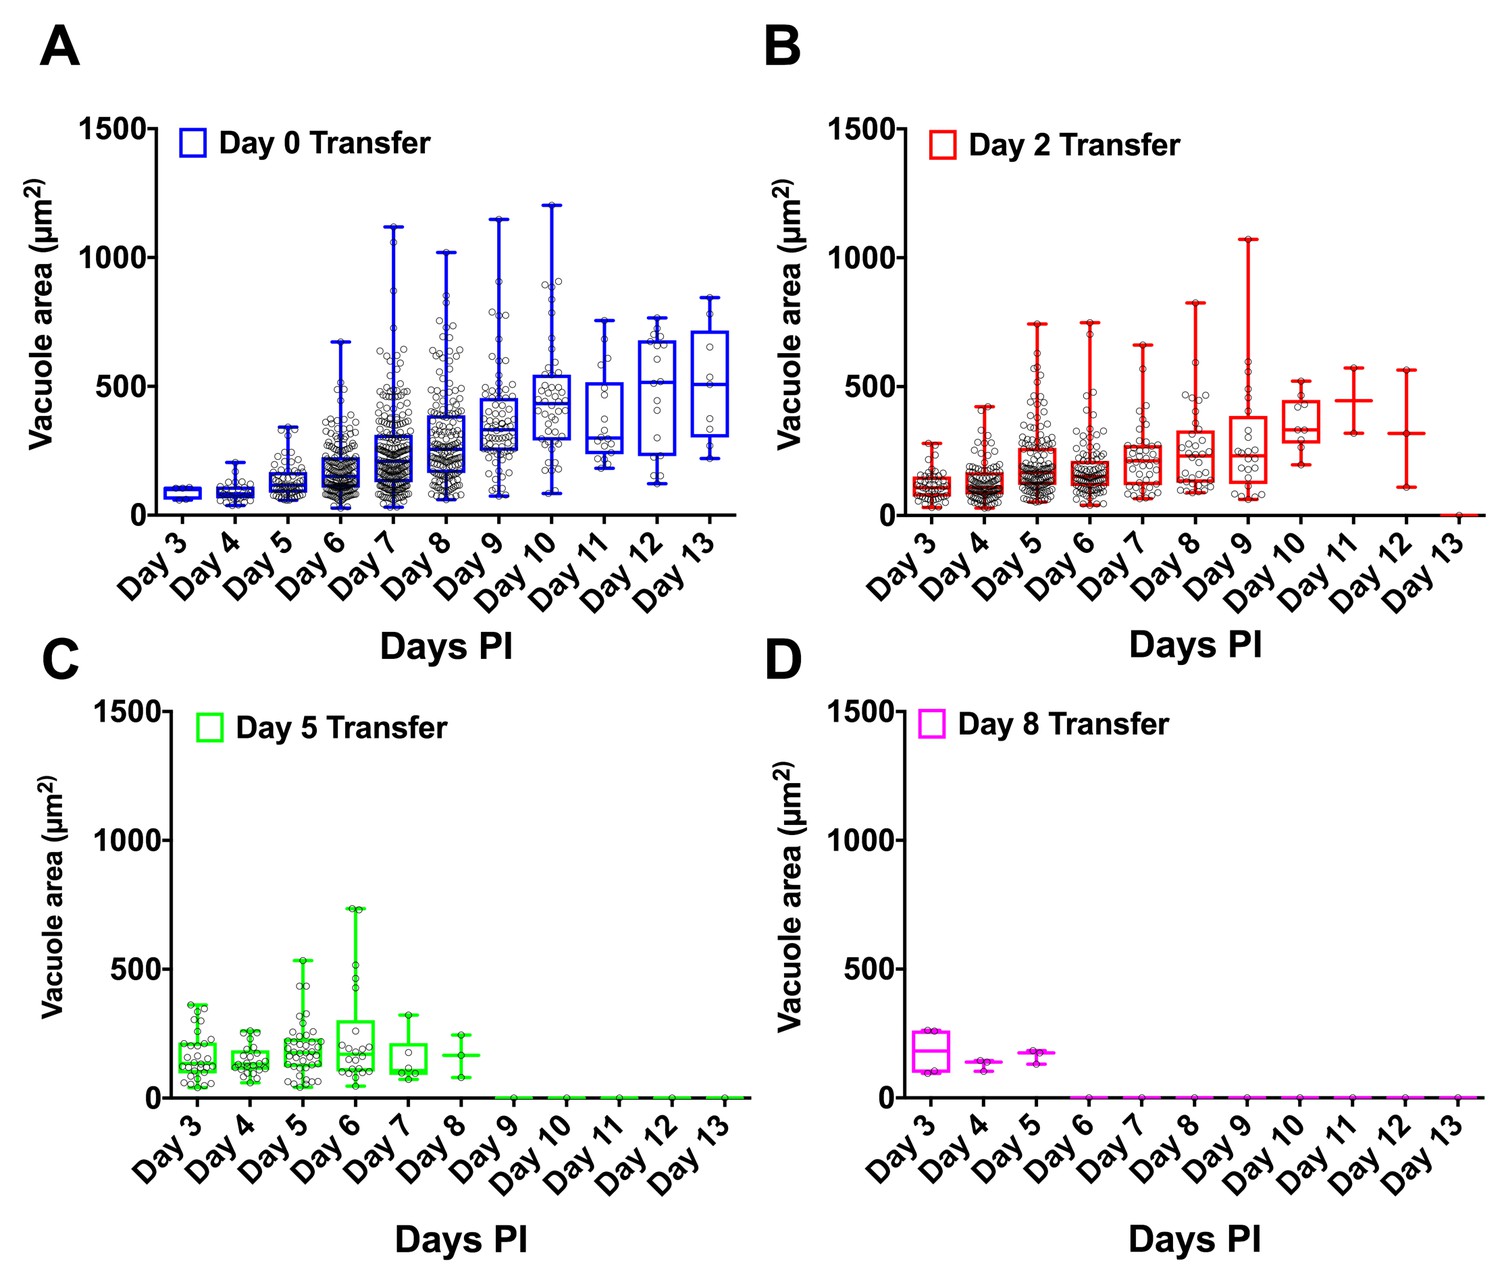
H. hammondi vacuole sizes following subculture.
(A–D) Visible vacuoles sizes were measured using ImageJ (NIH) for each day of attempted subculture. Vacuole size progressively increases over the course of in vitro cultivation, after which the size plateaus.
Figure 5
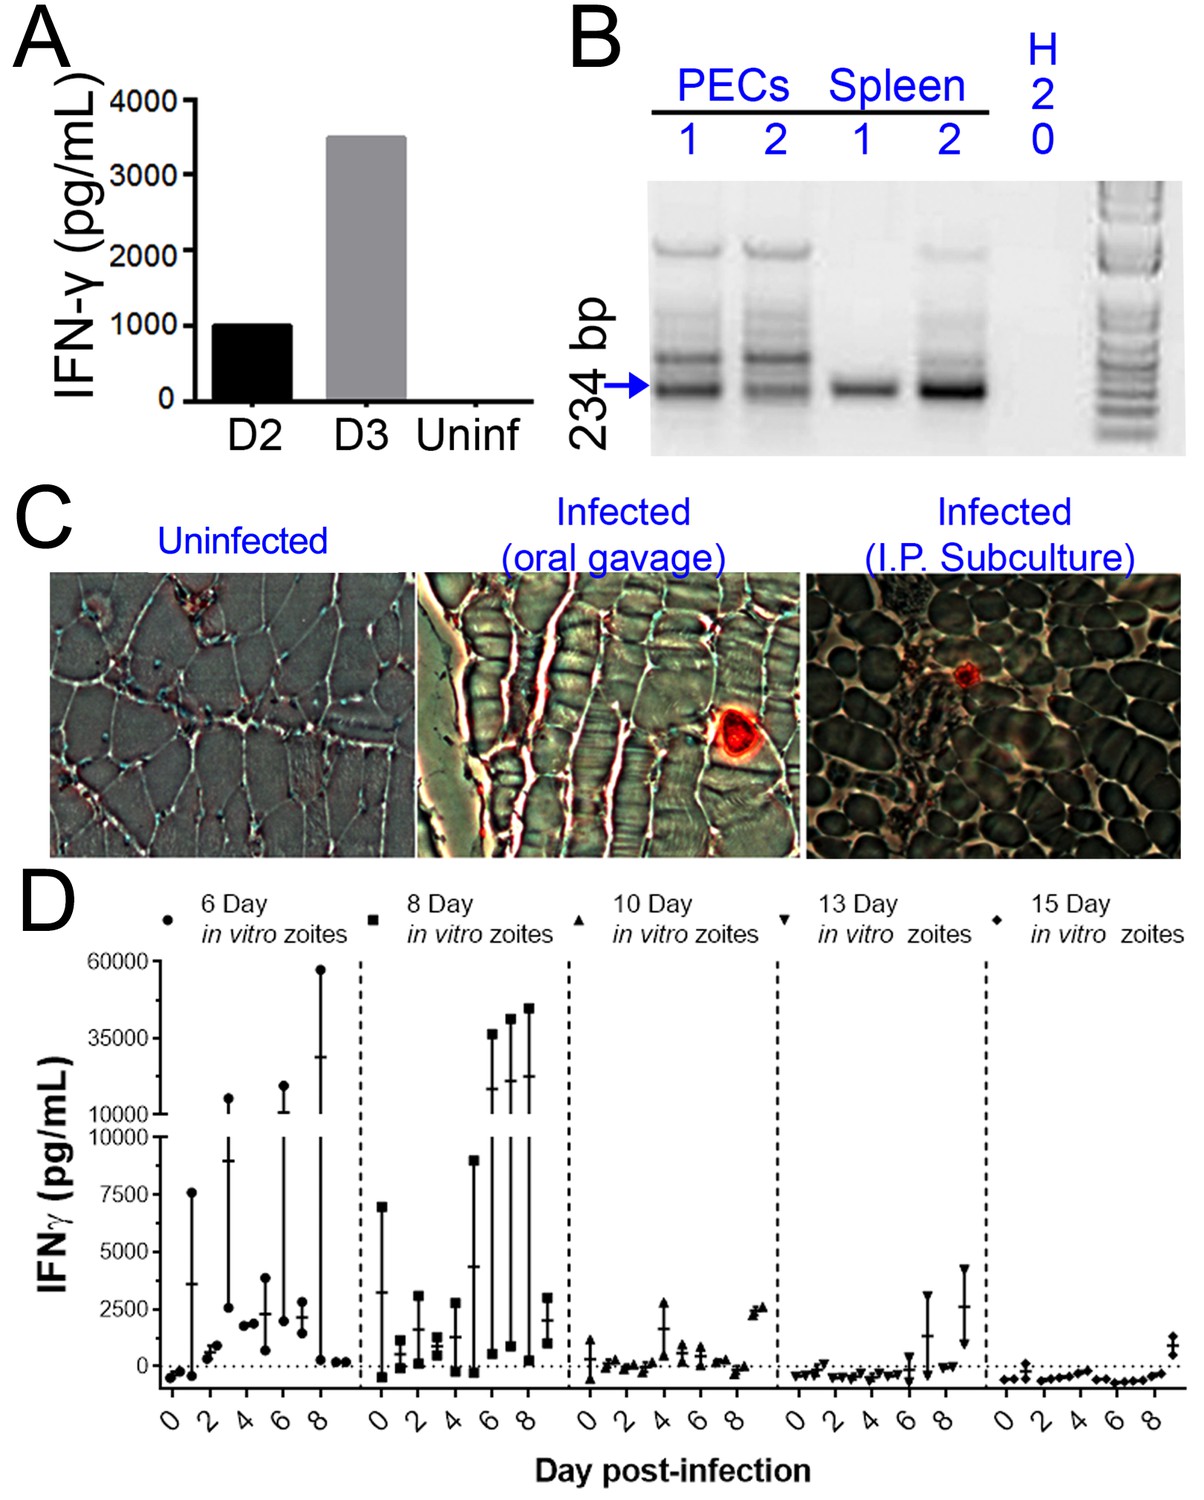
H. hammondi parasites can be grown in vitro and then used to successfully infect mice.
(A–C) Two Balb/C mice were infected with ~50,000 hr. hammondi zoites grown in vitro for 5 days. (A) Serum was collected on days 2 and 3 and assayed for interferon-γ. (B) Three weeks post-infection, DNA was harvested from peritoneal lavage cells and spleen and assayed for H. hammondi DNA using H. hammondi-specific primers. Arrow indicates primary band for H. hammondi-specific PCR, although we also routinely see larger bands after PCR amplification. Samples were only considered positive if the 234 bp band was present (arrowhead). (C) Leg muscles from infected mice were sectioned and stained with H. hammondi-reactive anti-Toxoplasma antibodies and compared to uninfected mice and mice infected with H. hammondi by oral gavage with 50,000 sporulated oocysts. (D) In vitro cultivation leads to a dramatic and predictable loss in the ability to infect mice. Two BALB/C mice were infected with 50,000 H. hammondi American parasites after 6, 8, 10, 13, and 15 days of in vitro growth. The mass of the mice was monitored and a serum sample was obtained daily for 9 days post-infection. Analysis of IFN-γ production was analyzed in serum samples using an ELISA. Mice infected with parasites grown in vitro for 6 days (1 of 2) showed spikes in IFN-γ levels. This IFN-γ spike was also observed in mice infected with parasites grown in vitro for 8 days (2 of 2), while no IFN-γ was observed in mice infected with parasite grown in vitro for 10, 13, or 15 days.
Figure 6 with 1 supplement
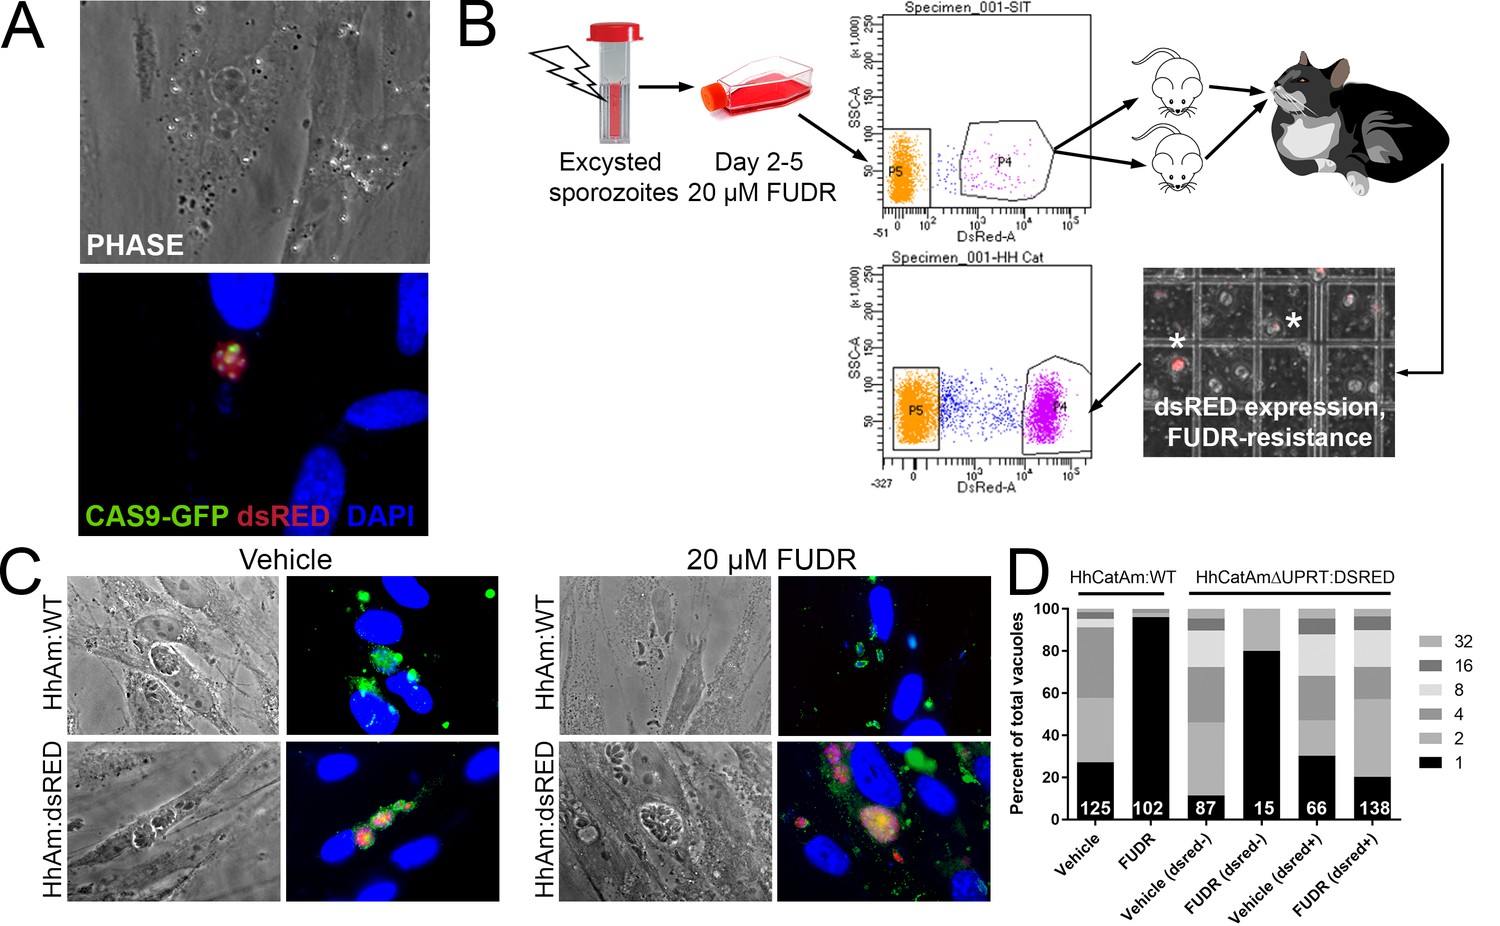
Generation of stable transgenic Hammondia hammondi.
(A) H. hammondi zoites co-transfected with CRISPR/CAS9-GFP and a plasmid harboring a T. gondii dsRED expression cassette. We identified multiple parasites with both GFP-tagged nuclei (due to CAS9-GFP expression) and dsRED-tagged cytoplasm, indicating uptake of both plasmids within the same parasites. (B) Protocol for generating stably transgenic H. hammondi using flow cytometry and drug selection to enrich for transgenic parasites prior to cat infections. (C,D) Testing FUDR resistance in transgenic H. hammondi parasites. WT and transgenic H. hammondi sporozoites were incubated in the presence or absence of 20 µM FUDR, and vacuole size and presence/absence of dsRED was quantified in at least 100 vacuoles per treatment condition. While WT and non-dsRED-expressing H. hammondi from the transgenic population were highly susceptible to FUDR treatment (the majority of vacuoles in these categories contained only one parasite), dsRED -expressing transgenic parasites were resistant to FUDR treatment, confirming that the parasites harbored two genetic markers.
Figure 6—figure supplement 1
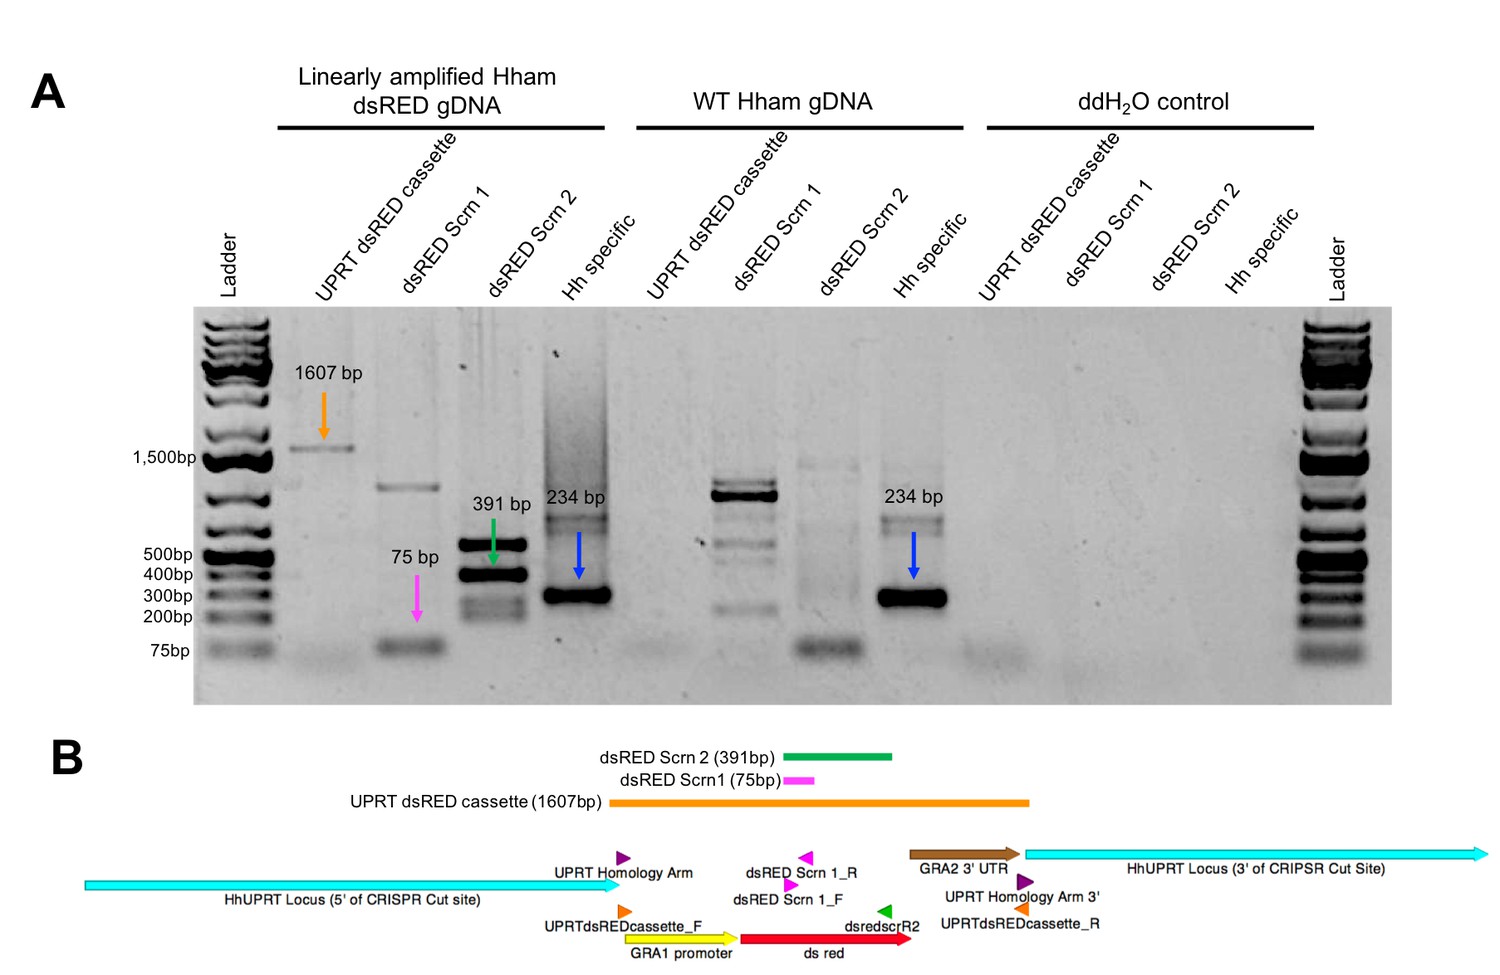
Validation of transgenic H. hammondi.
(A) PCR validation of H. hammondi dsRED-expressing parasites using primers targeting the UPRTdsREDcassette (1607bp product), dsRED (75 and 391 bp products, respectively), and an H. hammondi specific sequence (234 bp product). PCR reactions were conducted with 45 ng of template DNA from linearly amplified Hham dsRED genomic DNA, WT Hham genomic DNA, of ddH2O control. (B) Schematic of UPRT dsRED cassette (generated using APE). Arrows indicate sequence features, arrowheads indicate location of primers. Colored lines indicate expected product. (See supplementary file 3 for primer sequences).
Figure 7
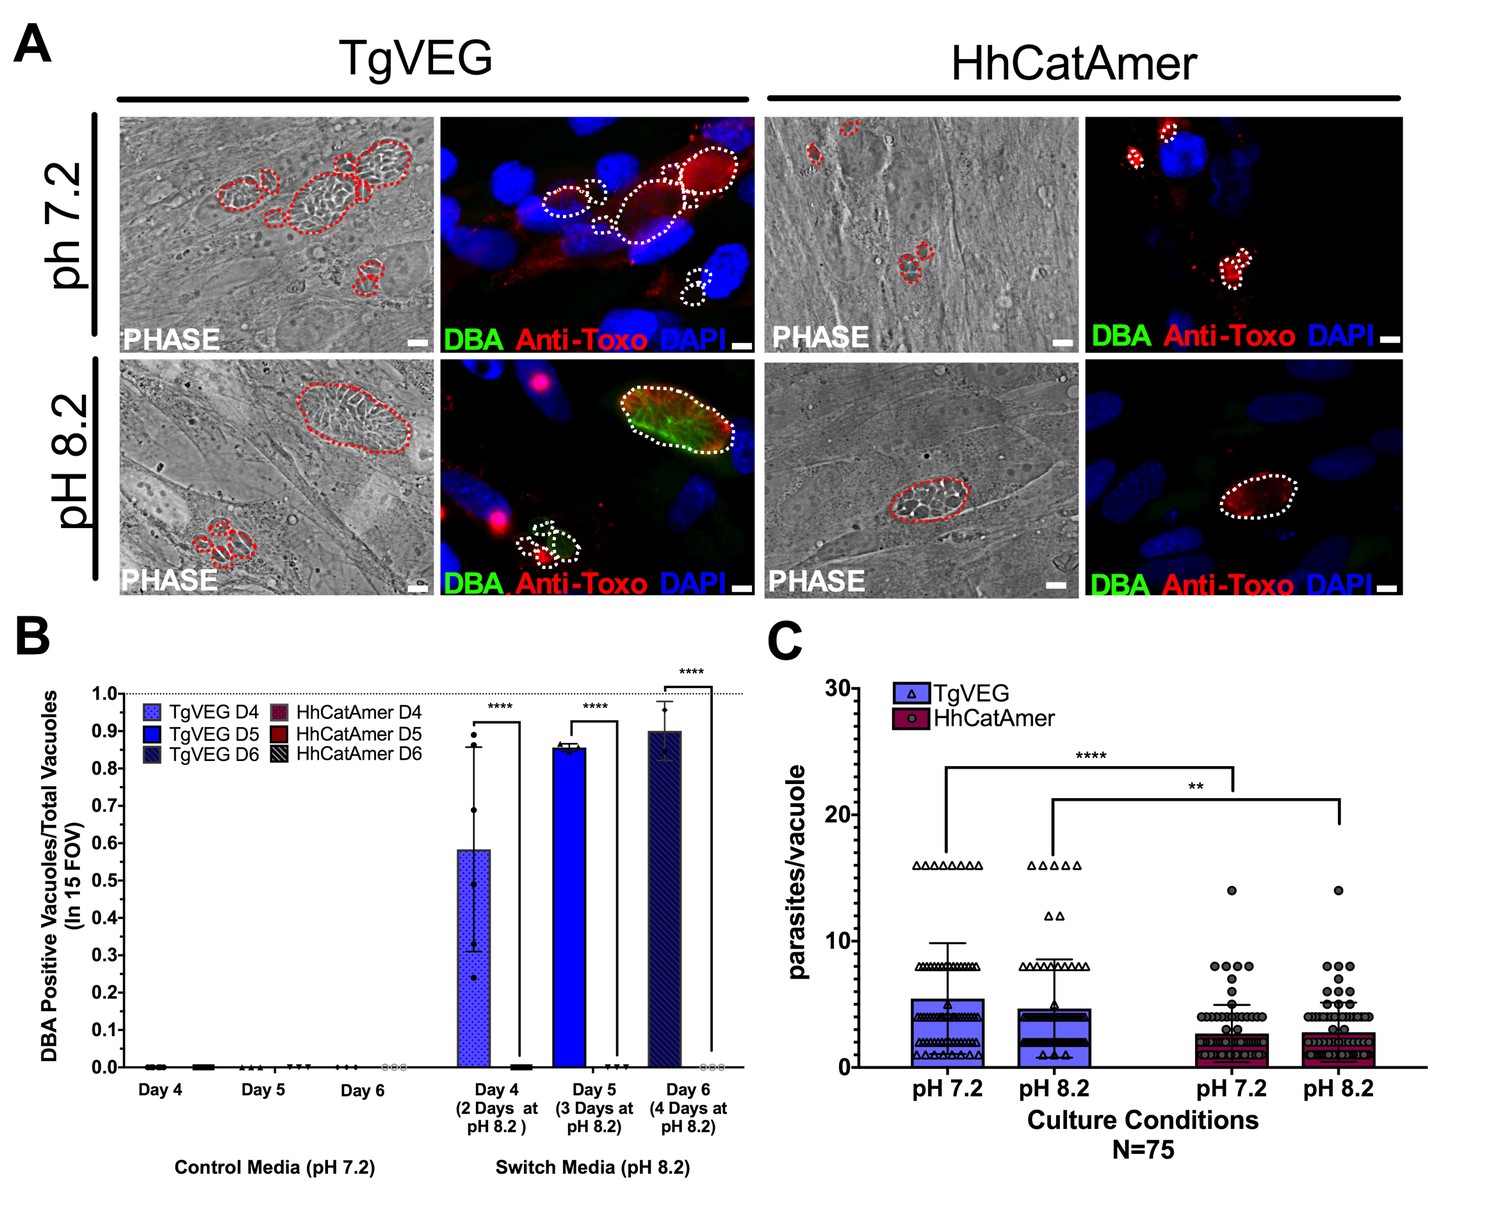
Conditions that induced T. gondii tissue cyst formation in vitro did not induce tissue cyst formation in H. hammondi.
(A) Representative images of cells infected with T. gondii (TgVEG) and H. hammondi (HhCatAmer) sporozoites that were grown for 2 days in pH 7.2 media and switched to pH 8.2 media (bradyzoite induction conditions) for 2 days, fixed and stained with an Anti-Toxoplasma gondii/Hammondia hammondi antibody and DBA. Scale bar represents 5 µm. (B) Quantification of T. gondii and H. hammondi tissue cyst formation described in A demonstrating that H. hammondi does not form tissue cysts when exposed to conditions that promote tissue cyst formation in T. gondii. Statistical significance was determined using a 2-way ANOVA with Tukey’s multiple comparison test. (****=P < 0.0001). (C) Number of parasites per vacuole for both T. gondii and H. hammondi grown at pH 7.2 and pH 8.2. T. gondii has significantly more parasites per vacuole than H. hammondi at both pH 7.2 and pH 8.2. There is no statistically significant difference between either T. gondii or H. hammondi between pH 7.2 and pH 8.2. Statistical significance was determined using a 2-way ANOVA with Sidak’s multiple comparison test. (**=P < 0.01 and ****=P < 0.0001).
Figure 8 with 1 supplement
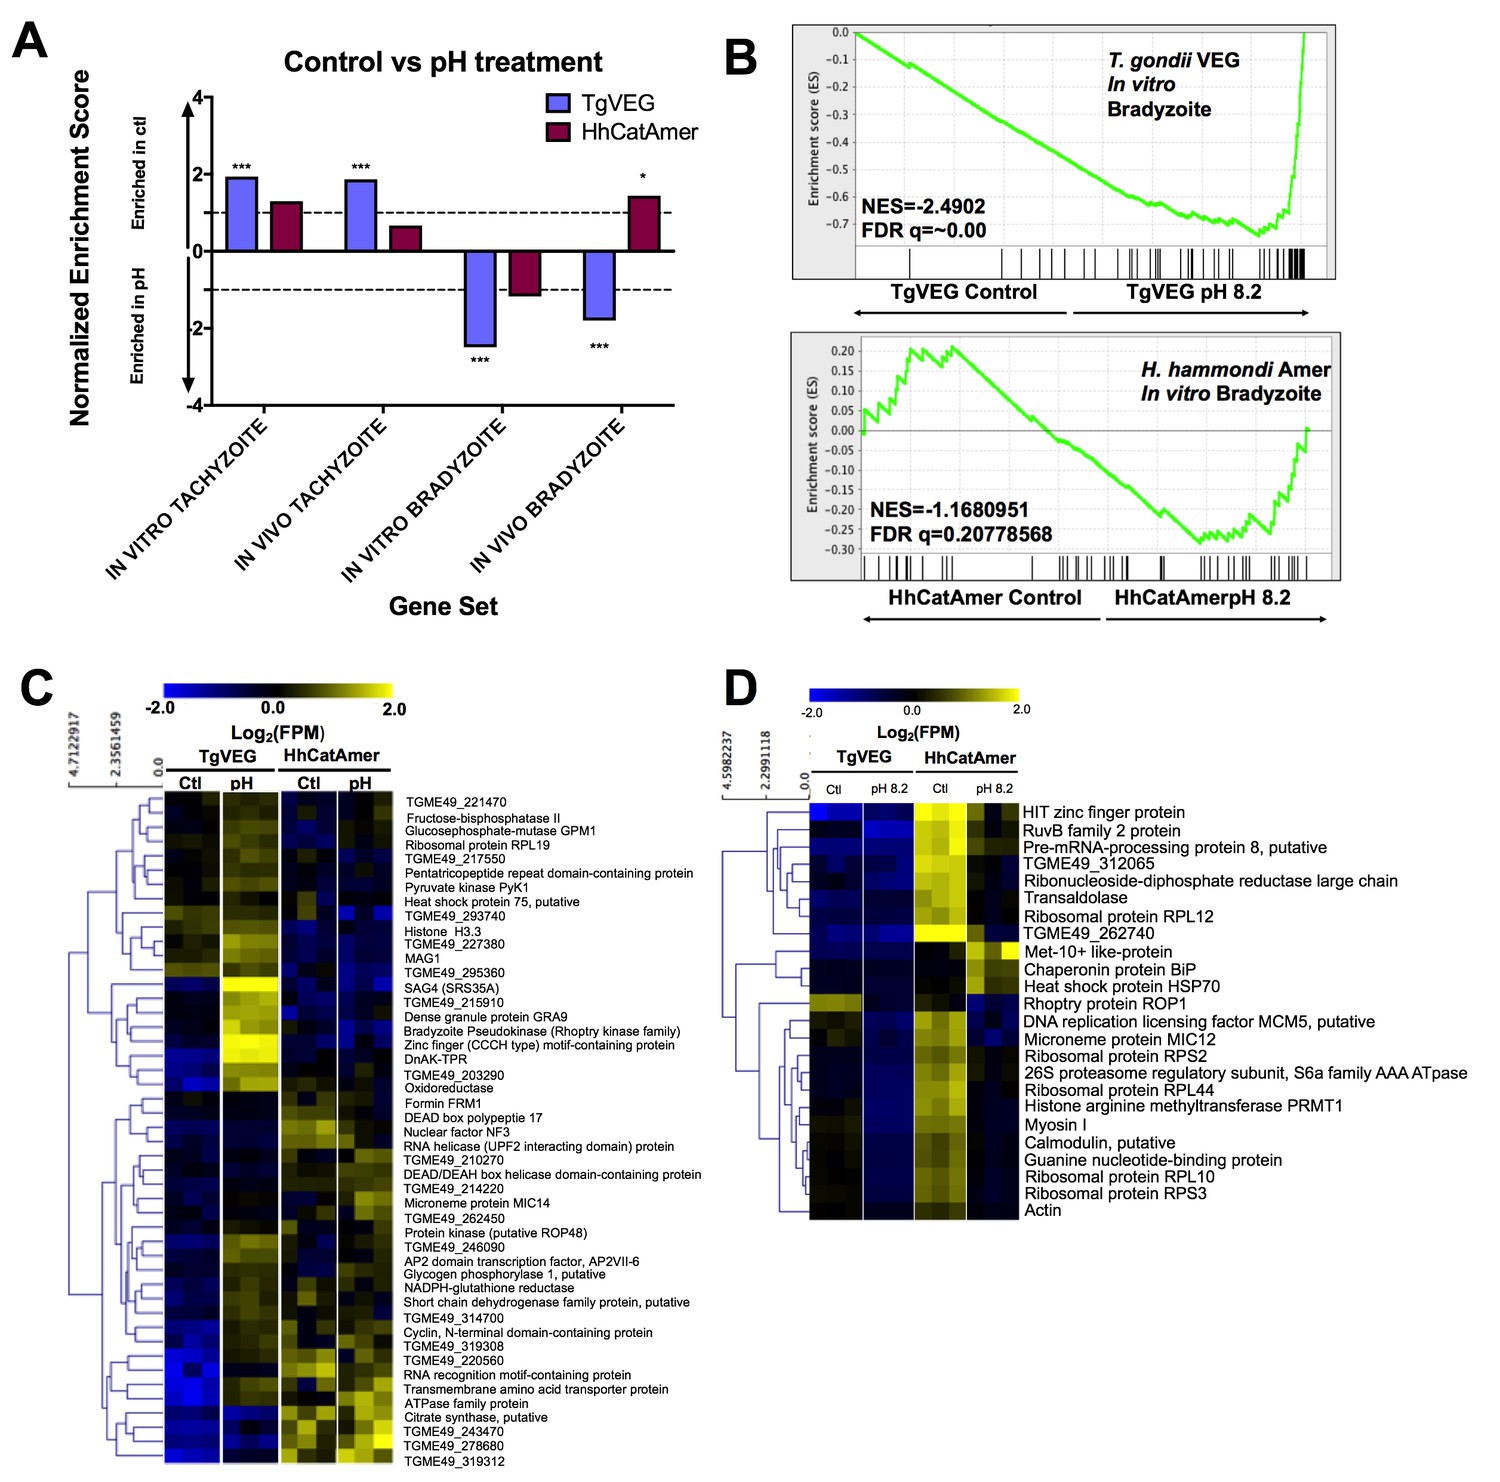
The H. hammondi transcriptome is refractory to pH-induced stress.
(A) GSEA analysis comparing TgVEG (blue) and HhCatAmer (red) treated with control media to TgVEG and HhCatAmer treated with pH 8.2 media. Not all gene sets are significantly enriched. NES: Normalized enrichment score FDR q: False discovery rate q-value. See table supplement for FDR q-values for all analyses. Nominal p-value is indicated by *<0.05, **<0.01, and ***<0.001. (B) GSEA plots of the IN VITRO BRADYZOITE gene set comparing control versus pH 8.2 treated TgVEG and HhCatAmer. (C) Heat map showing mean centered log2(FPM) values for all detectable genes from the IN VITRO BRADYZOITE gene set. (D) Mean centered, hierarchically clustered heatmap of log2(FPM) values of the 24 genes that significantly differed in transcript abundance (fold-change ≥1; Padj <0.01) between control and pH 8.2 treated H. hammondi. As shown only three transcripts were found to be of higher abundance in pH-treated H. hammondi, while the remaining genes were of significantly lower abundance after pH exposure.
Figure 8—figure supplement 1
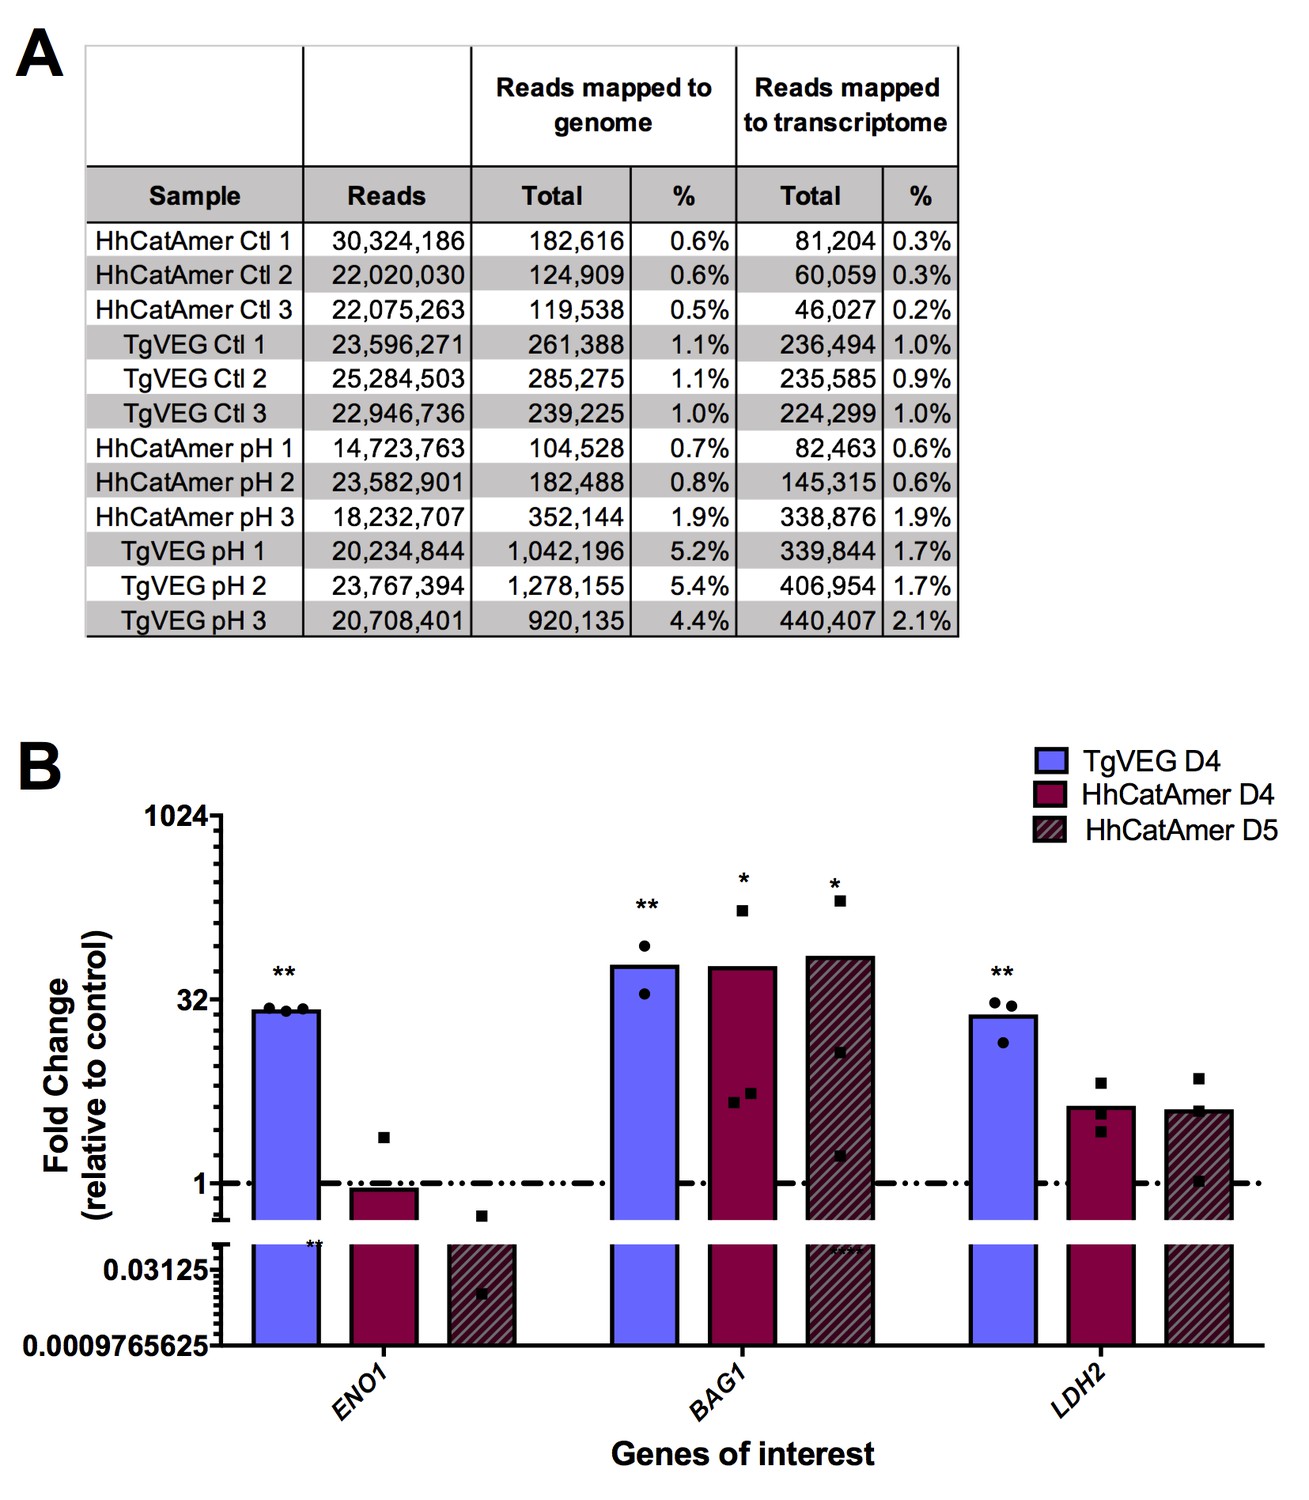
Transcriptional profiling and qPCR of pH vs control RNAseq data.
(A) Summary of reads mapping from each sample for T. gondii and H. hammondi zoites treated with control or bradyzoite-induction media. (B) Fold change in transcript abundance relative to control of canonical bradyzoite genes ENO1, BAG1, and LDH2 determined by qPCR for TgVEG and HhCatAmer exposed to pH 8.2. *=P < 0.05 and **=P < 0.01.
Author response image 1
Additional analysis of identified differences in transcript abundance between H. hammondi Eth1 and T. gondii VEG on a translational level.
A) GSEA of transcripts detected in our D15 analysis that are known to display some level of transcriptional regulation (see (6)). B) Log2 fold change of transcripts that significantly differed in abundance (Log2 fold change >1, padj < 0.05) between D4 and D15 in H. hammondi Eth1 versus differentially expressed proteins (Log2 fold change > 1) between tachyzoite and cysts (see (5))
Tables
Table 1
Median and maximum parasites per vacuole during 1, 2, and 3 DPI for TgVEG and HhCatEth1.
https://doi.org/10.7554/eLife.36491.004| Day 1 | Day 2 | Day 3 | |
|---|---|---|---|
| Median, Maximum | Median, Maximum | Median, Maximum | |
| HhCatEth1 Replicate 1 | 1, 1 | 1, 2 | 2, 4 |
| HhCatEth1 Replicate 2 | 1, 2 | 2, 4 | 2, 16 |
| TgVEG Replicate 1 | 2, 2 | 2, 16 | 4, 16+ |
| TgVEG Replicate 2 | 2, 4 | 4, 16+ | 8, 16+ |
Table 2
Additional gene sets used in Gene Set Enrichment analyses.
https://doi.org/10.7554/eLife.36491.010| Gene set name | Search strategy on ToxoDB | Size |
|---|---|---|
| SRS_Family | Text search for ‘SAG-related sequence SRS’ | 111 |
| AP2_family | Text search for ‘AP2 domain transcription factor’ | 66 |
| CAT STAGE SPECIFIC 1 | Cat enteroepithelial stages at least 40-fold higher than Tachyzoite at D3, D5 or D7 | 293 |
| CAT STAGE SPECIFIC 2 | Cat enteroepithelial stages > 90 th percentile in any of D3, D5 or D7; Tachyzoite expression between 0 and 50th percentile | 81 |
Additional files
-
Supplementary file 1
D4D15 RNASeq and 24 hr THP-1 RNAseq.
Xls file containing raw reads, rLog values, and results for DESeq2 analysis for D4 and D15 HFF infection with H. hammondi Eth1 and T.gondii VEG and 24 hr THP-1 infection with H. hammondi Amer and T. gondii VEG.
- https://doi.org/10.7554/eLife.36491.019
-
Supplementary file 2
pH vs Ctl RNAseq data.
Xls file containg raw reads, rLog values, and results for DESeq two analysis for pH vs control treated H. hammondi Amer and T. gondii VEG HFF infection.
- https://doi.org/10.7554/eLife.36491.020
-
Supplementary file 3
Primer Table.
File containing all of the primers used in this study, the purpose of the primer, and the Toxodb.org gene ID for each gene queried.
- https://doi.org/10.7554/eLife.36491.021
-
Supplementary file 4
Gene Set Categorization Significant Genes D4 vs D15 and 24 hr THP-1.
Xls file containing all genes belonging to gene sets used in analyses and indicating which genes are significant in which categories for analysis. Significant genes for D4, D15, and 24 hr THP-1 data sets are indicated by the number 1, highlighted in a green box.
- https://doi.org/10.7554/eLife.36491.022
-
Supplementary file 5
Gene Set Categorization Significant Genes pH vs Ctl.
Xls file containing all genes belonging to gene sets used in analyses and indicating which genes are significant in which categories for analysis. Significant genes for pH versus control data sets are indicated by the number 1, highlighted in a green box.
- https://doi.org/10.7554/eLife.36491.023
-
Transparent reporting form
- https://doi.org/10.7554/eLife.36491.024
Download links
A two-part list of links to download the article, or parts of the article, in various formats.
Downloads (link to download the article as PDF)
Open citations (links to open the citations from this article in various online reference manager services)
Cite this article (links to download the citations from this article in formats compatible with various reference manager tools)
Dissection of the in vitro developmental program of Hammondia hammondi reveals a link between stress sensitivity and life cycle flexibility in Toxoplasma gondii
eLife 7:e36491.
https://doi.org/10.7554/eLife.36491


